Replication, Update, and Extension of Loughran and Ritter's - BEAR
Replication, Update, and Extension of Loughran and Ritter's - BEAR
Replication, Update, and Extension of Loughran and Ritter's - BEAR

You also want an ePaper? Increase the reach of your titles
YUMPU automatically turns print PDFs into web optimized ePapers that Google loves.
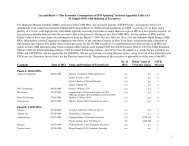
Table 1<br />
Underperformance <strong>of</strong> IPOs by issue volume, 1973 to 1996<br />
The sample period is January 1973 to December 1996 (288 months). The dependent<br />
variable is the equally weighted monthly percentage return on a portfolio <strong>of</strong> IPOs that<br />
have gone public during the prior 36 months. A coefficient <strong>of</strong> -0.18 represents<br />
underperformance <strong>of</strong> 18 basis points per month. rpt - rft is the excess return over the riskfree<br />
rate on a portfolio in time period t, rmt - rft is the realization <strong>of</strong> the market risk<br />
premium in period t, SMBt is the return on a portfolio <strong>of</strong> small stocks minus the return on<br />
a portfolio <strong>of</strong> big stocks in period t, <strong>and</strong> HMLt is the return on a portfolio <strong>of</strong> value stocks<br />
minus the return on a portfolio <strong>of</strong> growth stocks in period t. The Fama-French factor<br />
returns are supplied by Kenneth French, using “research factors” with annual<br />
rebalancing, as distinct from “benchmark factors” with quarterly rebalancing. Purged<br />
(decontaminated) HML <strong>and</strong> SMB factors have been constructed after purging from the<br />
universe <strong>of</strong> firms all stocks that publicly issued equity for cash during the prior five years,<br />
or have been CRSP-listed for less than five years. The 144 months when the ratio <strong>of</strong><br />
recent equity issuers (IPOs + SEOs) to the total number <strong>of</strong> domestic operating firms on<br />
CRSP is highest are defined as high-volume markets. The other 144 months are<br />
designated as low-volume markets. The first row <strong>of</strong> each panel uses all months, the<br />
second row uses months with low-volume markets, <strong>and</strong> the third row uses months with<br />
high-volume markets. T-statistics are in parentheses.<br />
Panel A: The Fama – French method, IPOs<br />
rpt – rft = a + b(rmt – rft) + sSMBt + hHMLt+ ept<br />
a b t s t h t R 2 adj<br />
All -0.18 1.02 1.35 -0.14 89%<br />
(-1.26) (28.78) (25.35) (-2.41)<br />
Low volume markets 0.01 0.97 1.54 -0.28 89%<br />
(0.03) (17.81) (17.69) (-3.05)<br />
High volume markets -0.52 1.05 1.15 -0.08 92%<br />
(-3.20) (24.92) (17.96) (-1.10)<br />
Panel B: HML <strong>and</strong> SMB are purged <strong>of</strong> new issues, IPOs<br />
All -0.35 1.11 1.33 -0.12 87%<br />
(-2.17) (28.63) (21.26) (-1.59)<br />
Low volume markets -0.02 1.07 1.47 -0.20 86%<br />
(-0.09) (18.13) (14.73) (-1.77)<br />
High volume markets -0.76 1.14 1.14 -0.08 89%<br />
(-4.09) (23.91) (14.86) (-0.93)