Replication, Update, and Extension of Loughran and Ritter's - BEAR
Replication, Update, and Extension of Loughran and Ritter's - BEAR
Replication, Update, and Extension of Loughran and Ritter's - BEAR

Create successful ePaper yourself
Turn your PDF publications into a flip-book with our unique Google optimized e-Paper software.
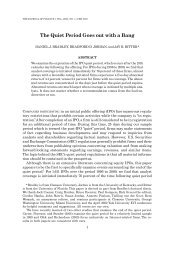
<strong>Replication</strong>, <strong>Update</strong>, <strong>and</strong> <strong>Extension</strong> <strong>of</strong> <strong>Loughran</strong> <strong>and</strong> Ritter’s 2000 Journal <strong>of</strong> Financial<br />
Economics article “Uniformly Least Powerful Tests <strong>of</strong> Market Efficiency”<br />
April 2005<br />
In the following tables, with the assistance <strong>of</strong> Ozgur Ince, the Table 6 results in our 2000 JFE<br />
article are extended from the 1973-1996 sample period to 1973-2003. In the published article, we<br />
report that an EW portfolio <strong>of</strong> IPOs underperforms by 24 basis points per month using the three<br />
Fama-French (1993) factors, <strong>and</strong> by 42 bp/month using purged factors, a difference <strong>of</strong> 18<br />
bp/month. In the replication below, the corresponding numbers for the same sample period are<br />
underperformance <strong>of</strong> 18 bp/month <strong>and</strong> 35 bp/month, a difference <strong>of</strong> 17 bp/month. So we haven’t<br />
been able to replicate the published results exactly, but we’re close, especially when it comes to<br />
the difference between the unpurged <strong>and</strong> purged results.<br />
It should be noted that in purging the universe <strong>of</strong> recent equity issuers, it is important to not only<br />
exclude CRSP-listed firms that issued IPOs or SEOs in the prior 60 months, but also to exclude<br />
all firms that have not been CRSP-listed for at least 60 months. Each year, CRSP adds about 200<br />
new lists that are not picked up in the usual IPO databases, <strong>and</strong> these new listing tend to be small<br />
firms with very low returns during their first five years <strong>of</strong> public trading. Many <strong>of</strong> these are small<br />
bank mutual to stock company conversions or bankruptcy reorganizations. Indeed, this<br />
seemingly innocuous screen is a major reason why <strong>Loughran</strong> <strong>and</strong> Ritter (1995 JF) find more<br />
underperformance for IPOs than Brav <strong>and</strong> Gompers (1997 JF) do. Brav <strong>and</strong> Gompers include<br />
these “non-IPO new lists” in their c<strong>and</strong>idate matching firms, whereas we screen them out. Many<br />
<strong>of</strong> these new lists are in fact IPOs, but are frequently screened out <strong>of</strong> IPO samples.<br />
As inspection <strong>of</strong> the tables below shows, the addition <strong>of</strong> seven more years <strong>of</strong> data does not<br />
change our qualitative results. IPOs severely underperform following high volume periods, <strong>and</strong><br />
don’t underperform following low volume periods.<br />
The monthly purged factor returns for January 1973-December 2003 are available on my website<br />
as an Excel file. We were not able to replicate the unpurged Fama-French factor returns exactly,<br />
although the differences in returns from those available on Ken French’s website are mostly<br />
minor. For each month, the variables are<br />
Month in YYYYMM format<br />
Market: The monthly percentage return on the CRSP VW index.<br />
Rf: The risk-free percentage monthly interest rate.<br />
uSMB: The unpurged Small Minus Big factor monthly percentage return computed here.<br />
uHML: The unpurged High Minus Low factor monthly percentage return computed here.<br />
pSMB: The purged Small Minus Big factor monthly percentage return computed here.<br />
pHML: The purged High Minus Low factor monthly percentage return computed here.<br />
IPOreturn: The monthly percentage return on an EW portfolio <strong>of</strong> IPOs from months t-36 to t-1.<br />
SEOreturn: The monthly percentage return on an EW portfolio <strong>of</strong> SEOs from months t-36 to t-1.<br />
SMB: The Fama-French SMB monthly percentage return from Ken French.<br />
HML: The Fama-French HML monthly percentage return from Ken French.<br />
numIPO: The number <strong>of</strong> IPOs in the portfolio at the start <strong>of</strong> month t.<br />
numSEO: The number <strong>of</strong> SEOs in the portfolio at the start <strong>of</strong> month t.<br />
1
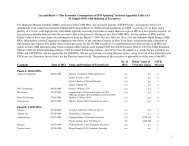
Table 1<br />
Underperformance <strong>of</strong> IPOs by issue volume, 1973 to 1996<br />
The sample period is January 1973 to December 1996 (288 months). The dependent<br />
variable is the equally weighted monthly percentage return on a portfolio <strong>of</strong> IPOs that<br />
have gone public during the prior 36 months. A coefficient <strong>of</strong> -0.18 represents<br />
underperformance <strong>of</strong> 18 basis points per month. rpt - rft is the excess return over the riskfree<br />
rate on a portfolio in time period t, rmt - rft is the realization <strong>of</strong> the market risk<br />
premium in period t, SMBt is the return on a portfolio <strong>of</strong> small stocks minus the return on<br />
a portfolio <strong>of</strong> big stocks in period t, <strong>and</strong> HMLt is the return on a portfolio <strong>of</strong> value stocks<br />
minus the return on a portfolio <strong>of</strong> growth stocks in period t. The Fama-French factor<br />
returns are supplied by Kenneth French, using “research factors” with annual<br />
rebalancing, as distinct from “benchmark factors” with quarterly rebalancing. Purged<br />
(decontaminated) HML <strong>and</strong> SMB factors have been constructed after purging from the<br />
universe <strong>of</strong> firms all stocks that publicly issued equity for cash during the prior five years,<br />
or have been CRSP-listed for less than five years. The 144 months when the ratio <strong>of</strong><br />
recent equity issuers (IPOs + SEOs) to the total number <strong>of</strong> domestic operating firms on<br />
CRSP is highest are defined as high-volume markets. The other 144 months are<br />
designated as low-volume markets. The first row <strong>of</strong> each panel uses all months, the<br />
second row uses months with low-volume markets, <strong>and</strong> the third row uses months with<br />
high-volume markets. T-statistics are in parentheses.<br />
Panel A: The Fama – French method, IPOs<br />
rpt – rft = a + b(rmt – rft) + sSMBt + hHMLt+ ept<br />
a b t s t h t R 2 adj<br />
All -0.18 1.02 1.35 -0.14 89%<br />
(-1.26) (28.78) (25.35) (-2.41)<br />
Low volume markets 0.01 0.97 1.54 -0.28 89%<br />
(0.03) (17.81) (17.69) (-3.05)<br />
High volume markets -0.52 1.05 1.15 -0.08 92%<br />
(-3.20) (24.92) (17.96) (-1.10)<br />
Panel B: HML <strong>and</strong> SMB are purged <strong>of</strong> new issues, IPOs<br />
All -0.35 1.11 1.33 -0.12 87%<br />
(-2.17) (28.63) (21.26) (-1.59)<br />
Low volume markets -0.02 1.07 1.47 -0.20 86%<br />
(-0.09) (18.13) (14.73) (-1.77)<br />
High volume markets -0.76 1.14 1.14 -0.08 89%<br />
(-4.09) (23.91) (14.86) (-0.93)
Table 2<br />
Underperformance <strong>of</strong> IPOs excluding the lock-up period,<br />
1973 to 1996 (Top Panels) <strong>and</strong> 1973-2003 (Bottom Panels)<br />
The sample period is January 1973 to December 1996 (288 months) in Panels A <strong>and</strong> B<br />
<strong>and</strong> until December 2003 (372 months) in Panels C <strong>and</strong> D. For simplicity, lock-up<br />
expiration dates are assumed to be six months after the <strong>of</strong>ferings. The first row <strong>of</strong> each<br />
panel includes all IPOs that have gone public during the prior 36 months, <strong>and</strong> the second<br />
row excludes IPOs that have gone public in the last six months. Previous research<br />
(<strong>Loughran</strong> <strong>and</strong> Ritter’s 1995 Journal <strong>of</strong> Finance article) has shown no underperformance<br />
by IPOs in the first six months. Purged (decontaminated) HML <strong>and</strong> SMB factors have<br />
been constructed after purging from the universe <strong>of</strong> firms all stocks that publicly issued<br />
equity for cash during the prior five years, or have been CRSP-listed for less than five<br />
years. T-statistics are in parentheses.<br />
rpt – rft = a + b(rmt – rft) + sSMBt + hHMLt+ ept<br />
1973-1996 a b t s t h t R 2 adj<br />
Panel A: The Fama – French method, IPOs<br />
IPO returns in months (-1,-36) -0.18 1.02 1.35 -0.14 89%<br />
(-1.26) (28.78) (25.35) (-2.41)<br />
IPO returns in months (-7, -36) -0.38 1.00 1.33 -0.11 89%<br />
(-2.57) (27.97) (24.80) (-1.91)<br />
Panel B: HML <strong>and</strong> SMB are purged <strong>of</strong> new issues, IPOs<br />
IPO returns in months (-1,-36) -0.35 1.11 1.33 -0.12 87%<br />
(-2.17) (28.63) (21.26) (-1.59)<br />
IPO returns in months (-7, -36) -0.54 1.09 1.32 -0.09 86%<br />
(-3.31) (27.99) (20.99) (-1.27)<br />
1973-2003 a b t s t h t R 2 adj<br />
Panel C: The Fama – French method, IPOs<br />
IPO returns in months (-1,-36) -0.17 1.14 1.18 -0.23 85%<br />
(-0.92) (26.83) (21.50) (-3.69)<br />
IPO returns in months (-7, -36) -0.32 1.13 1.16 -0.20 82%<br />
(-1.66) (24.97) (19.86) (-2.89)<br />
Panel D: HML <strong>and</strong> SMB are purged <strong>of</strong> new issues, IPOs<br />
IPO returns in months (-1,-36) -0.29 1.22 1.24 -0.34 82%<br />
(-1.48) (27.12) (19.09) (-4.35)<br />
IPO returns in months (-7, -36) -0.43 1.20 1.22 -0.30 80%<br />
(-2.10) (25.52) (17.89) (-3.75)<br />
3
Table 3<br />
Underperformance <strong>of</strong> IPOs by issue volume, 1973 to 2003<br />
The sample period is January 1973 to December 2003 (372 months). The dependent<br />
variable is the equally weighted monthly percentage return on a portfolio <strong>of</strong> IPOs that<br />
have gone public during the prior 36 months. A coefficient <strong>of</strong> -0.17 represents<br />
underperformance <strong>of</strong> 17 basis points per month. rpt - rft is the excess return over the riskfree<br />
rate on a portfolio in time period t, rmt - rft is the realization <strong>of</strong> the market risk<br />
premium in period t, SMBt is the return on a portfolio <strong>of</strong> small stocks minus the return on<br />
a portfolio <strong>of</strong> big stocks in period t, <strong>and</strong> HMLt is the return on a portfolio <strong>of</strong> value stocks<br />
minus the return on a portfolio <strong>of</strong> growth stocks in period t. The Fama-French factor<br />
returns are supplied by Kenneth French, using “research factors” with annual<br />
rebalancing, as distinct from “benchmark factors” with quarterly rebalancing. Purged<br />
(decontaminated) HML <strong>and</strong> SMB factors have been constructed after purging from the<br />
universe <strong>of</strong> firms all stocks that publicly issued equity for cash during the prior five years,<br />
or have been CRSP-listed for less than five years. The 186 months when the ratio <strong>of</strong><br />
recent equity issuers to the total number <strong>of</strong> domestic operating firms on CRSP is highest<br />
are defined as high-volume markets. The other 186 months are designated as low-volume<br />
markets. The first row <strong>of</strong> each panel uses all months, the second row uses months with<br />
low-volume markets, <strong>and</strong> the third row uses months with high-volume markets. Tstatistics<br />
are in parentheses.<br />
Panel A: The Fama – French method, IPOs<br />
rpt – rft = a + b(rmt – rft) + sSMBt + hHMLt+ ept<br />
4<br />
a b t s t h t R 2 adj<br />
All -0.17 1.14 1.18 -0.23 85%<br />
(-0.92) (26.83) (21.50) (-3.69)<br />
Low volume markets 0.01 1.12 1.43 -0.29 86%<br />
(0.06) (19.66) (16.35) (-3.08)<br />
High volume markets -0.44 1.08 0.95 -0.38 84%<br />
(-1.73) (16.65) (12.35) (-3.97)<br />
Panel B: HML <strong>and</strong> SMB are purged <strong>of</strong> new issues, IPOs<br />
All -0.29 1.22 1.24 -0.34 82%<br />
(-1.48) (27.12) (19.09) (-4.35)<br />
Low volume markets -0.06 1.25 1.33 -0.23 81%<br />
(-0.20) (19.95) (12.59) (-1.85)<br />
High volume markets -0.56 1.15 1.07 -0.51 82%<br />
(-2.10) (17.41) (12.27) (-4.82)
Table 4<br />
Underperformance <strong>of</strong> IPOs by sample period<br />
The dependent variable is the equally weighted monthly percentage return on a portfolio<br />
<strong>of</strong> IPOs that have gone public during the prior 36 months. A coefficient <strong>of</strong> -0.18<br />
represents underperformance <strong>of</strong> 18 basis points per month. rpt - rft is the excess return<br />
over the risk-free rate on a portfolio in time period t, rmt - rft is the realization <strong>of</strong> the<br />
market risk premium in period t, SMBt is the return on a portfolio <strong>of</strong> small stocks minus<br />
the return on a portfolio <strong>of</strong> big stocks in period t, <strong>and</strong> HMLt is the return on a portfolio <strong>of</strong><br />
value stocks minus the return on a portfolio <strong>of</strong> growth stocks in period t. The Fama-<br />
French factor returns are supplied by Kenneth French, using “research factors” with<br />
annual rebalancing, as distinct from “benchmark factors” with quarterly rebalancing.<br />
Purged (decontaminated) HML <strong>and</strong> SMB factors have been constructed after purging<br />
from the universe <strong>of</strong> firms all stocks that publicly issued equity for cash during the prior<br />
five years, or have been CRSP-listed for less than five years. T-statistics are in<br />
parentheses.<br />
Panel A: The Fama – French method, IPOs<br />
rpt – rft = a + b(rmt – rft) + sSMBt + hHMLt+ ept<br />
5<br />
a b t s t h t R 2 adj<br />
Jan 1973 – Dec 1989 (N=204) -0.18 1.02 1.33 -0.16 89%<br />
(-0.96) (23.60) (19.97) (-2.21)<br />
Jan 1990 – Dec 1999 (N=120) -0.12 1.04 1.24 -0.17 88%<br />
(-0.57) (17.15) (16.61) (-1.99)<br />
Jan 1990 – Dec 2000 (N=132) -0.47 1.11 0.97 -0.26 86%<br />
(-1.82) (15.36) (13.00) (-2.76)<br />
Jan 2000 – Dec 2003 (N=48) 0.86 1.67 0.81 -0.49 82%<br />
(0.88) (8.57) (4.04) (-1.91)<br />
Panel B: HML <strong>and</strong> SMB are purged <strong>of</strong> new issues, IPOs<br />
Jan 1973 – Dec 1989 (N=204) -0.38 1.11 1.31 -0.11 87%<br />
(-1.84) (24.22) (16.75) (-1.28)<br />
Jan 1990 – Dec 1999 (N=120) -0.20 1.16 1.19 -0.29 84%<br />
(-0.81) (16.43) (13.40) (-2.50)<br />
Jan 1990 – Dec 2000 (N=132) -0.46 1.17 1.10 -0.41 84%<br />
(-1.66) (15.16) (12.90) (-3.77)<br />
Jan 2000 – Dec 2003 (N=48) 0.41 1.75 1.02 -0.65 81%<br />
(0.42) (8.94) (4.28) (-2.35)
Table 5<br />
Underperformance <strong>of</strong> SEOs by issue volume, 1973 to 1996<br />
The sample period is January 1973 to December 1996 (288 months). The dependent<br />
variable is the equally weighted monthly percentage return on a portfolio <strong>of</strong> SEOs that<br />
have gone public during the prior 36 months. A coefficient <strong>of</strong> -0.39 represents<br />
underperformance <strong>of</strong> 39 basis points per month. rpt - rft is the excess return over the riskfree<br />
rate on a portfolio in time period t, rmt - rft is the realization <strong>of</strong> the market risk<br />
premium in period t, SMBt is the return on a portfolio <strong>of</strong> small stocks minus the return on<br />
a portfolio <strong>of</strong> big stocks in period t, <strong>and</strong> HMLt is the return on a portfolio <strong>of</strong> value stocks<br />
minus the return on a portfolio <strong>of</strong> growth stocks in period t. The Fama-French factor<br />
returns are supplied by Kenneth French, using “research factors” with annual<br />
rebalancing, as distinct from “benchmark factors” with quarterly rebalancing. Purged<br />
(decontaminated) HML <strong>and</strong> SMB factors have been constructed after purging from the<br />
universe <strong>of</strong> firms all stocks that publicly issued equity for cash during the prior five years,<br />
or have been CRSP-listed for less than five years. The 144 months when the ratio <strong>of</strong><br />
recent equity issuers (IPOs + SEOs) to the total number <strong>of</strong> domestic operating firms on<br />
CRSP is highest are defined as high-volume markets. The other 144 months are<br />
designated as low-volume markets. The first row <strong>of</strong> each panel uses all months, the<br />
second row uses months with low-volume markets, <strong>and</strong> the third row uses months with<br />
high-volume markets. T-statistics are in parentheses.<br />
Panel A: The Fama – French method, SEOs<br />
rpt – rft = a + b(rmt – rft) + sSMBt + hHMLt+ ept<br />
a b t s t h t R 2 adj<br />
All -0.39 1.15 1.03 -0.13 96%<br />
(-4.57) (54.37) (32.60) (-3.77)<br />
Low volume markets -0.33 1.16 1.02 -0.12 95%<br />
(-2.40) (35.51) (19.56) (-2.13)<br />
High volume markets -0.44 1.14 1.02 -0.14 97%<br />
(-4.27) (41.80) (24.99) (-3.10)<br />
Panel B: HML <strong>and</strong> SMB are purged <strong>of</strong> new issues, SEOs<br />
All -0.52 1.21 1.03 -0.12 94%<br />
(-5.26) (50.97) (26.89) (-2.66)<br />
Low volume markets -0.36 1.21 1.01 -0.10 94%<br />
(-2.38) (35.61) (17.50) (-1.44)<br />
High volume markets -0.68 1.21 1.04 -0.13 94%<br />
(-5.15) (36.00) (19.04) (-2.11)<br />
6
Table 6<br />
Underperformance <strong>of</strong> SEOs by issue volume, 1973 to 2003<br />
The sample period is January 1973 to December 2003 (372 months). The dependent<br />
variable is the equally weighted monthly percentage return on a portfolio <strong>of</strong> SEOs that<br />
have gone public during the prior 36 months. A coefficient <strong>of</strong> -0.49 represents<br />
underperformance <strong>of</strong> 49 basis points per month. rpt - rft is the excess return over the riskfree<br />
rate on a portfolio in time period t, rmt - rft is the realization <strong>of</strong> the market risk<br />
premium in period t, SMBt is the return on a portfolio <strong>of</strong> small stocks minus the return on<br />
a portfolio <strong>of</strong> big stocks in period t, <strong>and</strong> HMLt is the return on a portfolio <strong>of</strong> value stocks<br />
minus the return on a portfolio <strong>of</strong> growth stocks in period t. The Fama-French factor<br />
returns are supplied by Kenneth French, using “research factors” with annual<br />
rebalancing, as distinct from “benchmark factors” with quarterly rebalancing. Purged<br />
(decontaminated) HML <strong>and</strong> SMB factors have been constructed after purging from the<br />
universe <strong>of</strong> firms all stocks that publicly issued equity for cash during the prior five years,<br />
or have been CRSP-listed for less than five years. The 186 months when the ratio <strong>of</strong><br />
recent equity issuers to the total number <strong>of</strong> domestic operating firms on CRSP is highest<br />
are defined as high-volume markets. The other 186 months are designated as low-volume<br />
markets. The first row <strong>of</strong> each panel uses all months, the second row uses months with<br />
low-volume markets, <strong>and</strong> the third row uses months with high-volume markets. Tstatistics<br />
are in parentheses.<br />
Panel A: The Fama – French method, SEOs<br />
rpt – rft = a + b(rmt – rft) + sSMBt + hHMLt+ ept<br />
7<br />
a b t s t h t R 2 adj<br />
All -0.49 1.21 0.84 0.03 93%<br />
(-4.67) (49.05) (26.57) (0.90)<br />
Low volume markets -0.38 1.20 0.97 -0.12 95%<br />
(-2.85) (39.11) (20.64) (-2.38)<br />
High volume markets -0.66 1.18 0.79 0.08 91%<br />
(-4.21) (29.74) (16.68) (1.31)<br />
Panel B: HML <strong>and</strong> SMB are purged <strong>of</strong> new issues, SEOs<br />
All -0.56 1.25 0.91 -0.02 92%<br />
(-5.20) (50.39) (25.52) (-0.56)<br />
Low volume markets -0.45 1.27 0.95 -0.11 93%<br />
(-2.95) (38.24) (16.99) (-1.63)<br />
High volume markets -0.68 1.22 0.89 0.00 91%<br />
(-4.43) (31.77) (17.52) (0.04)
Table 7<br />
Underperformance <strong>of</strong> SEOs by sample period<br />
The dependent variable is the equally weighted monthly percentage return on a portfolio<br />
<strong>of</strong> SEOs that have gone public during the prior 36 months. A coefficient <strong>of</strong> -0.42<br />
represents underperformance <strong>of</strong> 42 basis points per month. rpt - rft is the excess return<br />
over the risk-free rate on a portfolio in time period t, rmt - rft is the realization <strong>of</strong> the<br />
market risk premium in period t, SMBt is the return on a portfolio <strong>of</strong> small stocks minus<br />
the return on a portfolio <strong>of</strong> big stocks in period t, <strong>and</strong> HMLt is the return on a portfolio <strong>of</strong><br />
value stocks minus the return on a portfolio <strong>of</strong> growth stocks in period t. The Fama-<br />
French factor returns are supplied by Kenneth French, using “research factors” with<br />
annual rebalancing, as distinct from “benchmark factors” with quarterly rebalancing.<br />
Purged (decontaminated) HML <strong>and</strong> SMB factors have been constructed after purging<br />
from the universe <strong>of</strong> firms all stocks that publicly issued equity for cash during the prior<br />
five years, or have been CRSP-listed for less than five years. T-statistics are in<br />
parentheses.<br />
Panel A: The Fama – French method, SEOs<br />
rpt – rft = a + b(rmt – rft) + sSMBt + hHMLt+ ept<br />
8<br />
a b t s t h t R 2 adj<br />
Jan 1973 – Dec 1989 (N=204) -0.42 1.13 1.05 -0.16 96%<br />
(-3.74) (43.36) (26.00) (-3.53)<br />
Jan 1990 – Dec 1999 (N=120) -0.51 1.13 0.97 0.10 94%<br />
(-3.97) (31.13) (21.69) (1.84)<br />
Jan 1990 – Dec 2000 (N=132) -0.56 1.19 0.74 0.19 91%<br />
(-3.51) (26.55) (15.94) (3.20)<br />
Jan 2000 – Dec 2003 (N=48) 0.34 1.36 0.53 -0.00 88%<br />
(0.66) (13.27) (4.98) (-0.03)<br />
Panel B: HML <strong>and</strong> SMB are purged <strong>of</strong> new issues, SEOs<br />
Jan 1973 – Dec 1989 (N=204) -0.58 1.20 1.06 -0.14 94%<br />
(-4.54) (42.29) (21.81) (-2.45)<br />
Jan 1990 – Dec 1999 (N=120) -0.56 1.21 0.96 0.04 93%<br />
(-3.98) (30.85) (19.45) (0.58)<br />
Jan 1990 – Dec 2000 (N=132) -0.53 1.22 0.83 0.11 92%<br />
(-3.39) (28.06) (17.13) (1.87)<br />
Jan 2000 – Dec 2003 (N=48) 0.20 1.40 0.62 -0.05 87%<br />
(0.38) (13.45) (4.93) (-0.32)