Complete Annual Report - Uralita
Complete Annual Report - Uralita
Complete Annual Report - Uralita

Create successful ePaper yourself
Turn your PDF publications into a flip-book with our unique Google optimized e-Paper software.
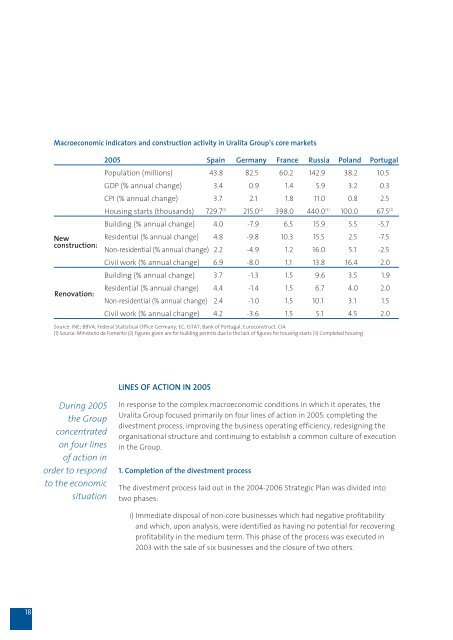
Macroeconomic indicators and construction activity in <strong>Uralita</strong> Group’s core markets<br />
New<br />
construction:<br />
Renovation:<br />
2005 Spain Germany France Russia Poland Portugal<br />
Population (millions) 43.8 82.5 60.2 142.9 38.2 10.5<br />
GDP (% annual change) 3.4 0.9 1.4 5.9 3.2 0.3<br />
CPI (% annual change) 3.7 2.1 1.8 11.0 0.8 2.5<br />
Housing starts (thousands) 729.7 (1) 215.0 (2) 398.0 440.0 (3) 100.0 67.5 (2)<br />
Building (% annual change) 4.0 -7.9 6.5 15.9 5.5 -5.7<br />
Residential (% annual change) 4.8 -9.8 10.3 15.5 2.5 -7.5<br />
Non-residential (% annual change) 2.2 -4.9 1.2 16.0 5.1 -2.5<br />
Civil work (% annual change) 6.9 -8.0 1.1 13.8 16.4 2.0<br />
Building (% annual change) 3.7 -1.3 1.5 9.6 3.5 1.9<br />
Residential (% annual change) 4.4 -1.4 1.5 6.7 4.0 2.0<br />
Non-residential (% annual change) 2.4 -1.0 1.5 10.1 3.1 1.5<br />
Civil work (% annual change) 4.2 -3.6 1.5 5.1 4.5 2.0<br />
Source: INE; BBVA; Federal Statistical Office Germany; EC; ISTAT; Bank of Portugal; Euroconstruct, CIA<br />
(1) Source: Ministerio de Fomento (2) Figures given are for building permits due to the lack of figures for housing starts (3) <strong>Complete</strong>d housing<br />
LINES OF ACTION IN 2005<br />
During 2005<br />
the Group<br />
concentrated<br />
on four lines<br />
of action in<br />
order to respond<br />
to the economic<br />
situation<br />
In response to the complex macroeconomic conditions in which it operates, the<br />
<strong>Uralita</strong> Group focused primarily on four lines of action in 2005: completing the<br />
divestment process, improving the business operating efficiency, redesigning the<br />
organisational structure and continuing to establish a common culture of execution<br />
in the Group.<br />
1. Completion of the divestment process<br />
The divestment process laid out in the 2004-2006 Strategic Plan was divided into<br />
two phases:<br />
i) Immediate disposal of non-core businesses which had negative profitability<br />
and which, upon analysis, were identified as having no potential for recovering<br />
profitability in the medium term. This phase of the process was executed in<br />
2003 with the sale of six businesses and the closure of two others.<br />
18