Experimental Stream Facility - Design and Research - EAHCP
Experimental Stream Facility - Design and Research - EAHCP
Experimental Stream Facility - Design and Research - EAHCP

Create successful ePaper yourself
Turn your PDF publications into a flip-book with our unique Google optimized e-Paper software.
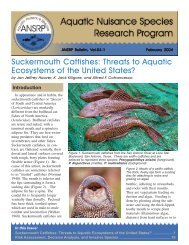
EPA/600/F-11/004 | March 2011 | www.epa.gov/ord<br />
<strong>Experimental</strong> <strong>Stream</strong> <strong>Facility</strong><br />
<strong>Design</strong> <strong>and</strong> <strong>Research</strong><br />
Providing <strong>Research</strong> Solutions to<br />
Manage Water Quality<br />
Office of <strong>Research</strong> <strong>and</strong> Development<br />
National Risk Management <strong>Research</strong> Laboratory
Background<br />
The <strong>Experimental</strong> <strong>Stream</strong> <strong>Facility</strong> (ESF) is a valuable research<br />
tool for the U.S. Environmental Protection Agency’s (EPA)<br />
Office of <strong>Research</strong> <strong>and</strong> Development’s (ORD) laboratories in<br />
Cincinnati, Ohio. This brochure describes the ESF, which is<br />
one of only a h<strong>and</strong>ful of research facilities in the United States<br />
designed to conduct small stream research.<br />
The Need for Small <strong>Stream</strong> <strong>Research</strong><br />
Small stream ecosystems comprise over 72% of the river miles<br />
in the U. S.; yet, the role they play in managing watershedlevel<br />
water quality is uncertain. While the potential impact of<br />
naturally occurring biogeochemical functions within an individual<br />
small stream may seem minimal, the accumulated impact of the many small streams within a watershed may be<br />
significant. Small streams are largely unmapped, unregulated, overlooked in watershed models, <strong>and</strong> generally not<br />
considered in the total maximum daily load (TMDL) process or in l<strong>and</strong> use regulations. As such, they are often<br />
ignored in l<strong>and</strong> development plans, <strong>and</strong> are often replaced with culverts, storm sewers, or lined ditches, which<br />
eliminates any role they may play in maintaining water quality. <strong>Research</strong> is needed to increase our underst<strong>and</strong>ing<br />
of the relative importance of small stream ecosystems <strong>and</strong> the services they provide for effective watershed<br />
management.<br />
In addition to watershed management research, there is a continual need to better characterize how streams <strong>and</strong><br />
rivers, in general, react to <strong>and</strong> process emerging contaminants <strong>and</strong> stressful mixtures. The numerous physical,<br />
chemical, <strong>and</strong> biological variables interacting under natural conditions, as aquatic ecosystems are exposed<br />
to contaminants of concern, confound the interpretation of effects on aquatic biology in receiving streams.<br />
Mesoscale studies are needed to gain a better underst<strong>and</strong>ing of the impact of contaminant stressors on multiple<br />
trophic levels <strong>and</strong> the levels which are the most sensitive to stress.<br />
As a final point, biotic indicators form the basis for stream<br />
condition assessment in this Nation, but current design criteria<br />
for watershed best management practices (BMPs) are based<br />
largely on peak flow control <strong>and</strong> sediment removal. <strong>Research</strong><br />
is needed to begin to bridge the gap between physical-based<br />
engineering design <strong>and</strong> biological-based assessment criteria.<br />
The Need for the <strong>Stream</strong> <strong>Facility</strong><br />
The facility has eight stream mesocosms; a mesocosm is an<br />
experimental system designed to simulate natural conditions,<br />
often by using naturally occurring organisms <strong>and</strong> artificial<br />
<strong>Experimental</strong> stream mesocosms<br />
The <strong>Experimental</strong> <strong>Stream</strong> <strong>Facility</strong><br />
1
The <strong>Experimental</strong> <strong>Stream</strong> <strong>Facility</strong><br />
structures that simulate nature as closely as possible. Mesocosm design<br />
provides a balance between the benefits of a controlled laboratory study<br />
(e.g. controlled flow rates, solar irradiance <strong>and</strong> streambed type) <strong>and</strong> the<br />
benefits of a field study (e.g. continuous biota for colonization, <strong>and</strong><br />
natural variability of biota <strong>and</strong> water quality). This allows researchers<br />
to study how pollutant loads interact with important characteristics of<br />
stream habitat that may or may not change as a result of anthropogenic<br />
stress. Changes to the stream ecosystem structure <strong>and</strong> function can be<br />
measured <strong>and</strong> observed in ways that are not possible in field or laboratory<br />
studies. Well designed <strong>and</strong> controlled experimental stream mesocosm<br />
studies can represent a primary tool for providing the process-level<br />
underst<strong>and</strong>ing necessary to move basic research <strong>and</strong> development from<br />
the laboratory bench-top to field applications.<br />
<strong>Research</strong> Approach<br />
ESF studies are designed to obtain information on both watershed<br />
management <strong>and</strong> the impact of contaminants of concern.<br />
Watershed Perspective<br />
The ESF sits at the downstream end of the watershed of the East Fork<br />
of the Little Miami River (1295 km² / 500 mi²), <strong>and</strong> experiments are<br />
designed with watershed scale management as one focus of the studies.<br />
Studies at the ESF afford EPA the opportunity to collect <strong>and</strong> analyze<br />
data on in-stream process-level biological, chemical, <strong>and</strong> physical<br />
interactions. Each ESF study is designed to provide information on<br />
small stream ecosystem structure <strong>and</strong> function that can be used for the<br />
development <strong>and</strong> testing of: new indicators of ecological stress; water<br />
quality monitoring technologies; watershed monitoring strategies; <strong>and</strong><br />
water quality management methods <strong>and</strong> models. Characteristics of small<br />
stream sub-watersheds in the East Fork watershed provide information<br />
for the design of ESF experiments, <strong>and</strong> the results of ESF experiments are<br />
subsequently incorporated into a multi-spatial scale watershed research<br />
plan designed to characterize, track, <strong>and</strong> model changes to water quality<br />
2
associated with the National Pollutant Discharge Elimination System (NPDES) <strong>and</strong> the Safe Drinking Water Act<br />
-associated BMP implementation projects. Hence, an overarching goal is to develop numerical descriptions of<br />
these stressor-biotic linkages for watershed models used as decision support in TMDL <strong>and</strong> TMDL-like analyses of<br />
watershed management.<br />
Contaminant Perspective<br />
The ESF mesocosms are especially useful for studying the impacts of contaminants of concern (e.g. endocrine<br />
disruptors, pharmaceuticals, pesticides) on the natural stream biota. Contaminants can be added at<br />
environmentally relevant levels; levels observed in natural ecosystems <strong>and</strong> reported in the literature. Exposure<br />
at these levels lets researchers observe more subtle changes (e.g. gene <strong>and</strong> protein expression) in stream biota as<br />
well as changes in biotic communities <strong>and</strong> ecosystem structure <strong>and</strong> function. This approach provides additional<br />
information to laboratory studies which commonly use lethal effects (e.g. LC 50<br />
) as the endpoint. The postdose<br />
recovery period built into each experiment provides additional information on the ability of the biota to<br />
recover when the contaminant is removed from the ecosystem. The relative importance of specific changes in<br />
stream habitat (e.g. sediment load, flow rates) on contaminant impact can be simulated <strong>and</strong> are often included<br />
as interacting variables. Additional biotic indicators can be studied through the use of emergent traps, fish<br />
deployments, in-stream invertebrate exposures, <strong>and</strong> real time biomonitoring. Interactions <strong>and</strong> effects observed in<br />
the ESF setting help identify important assessment endpoints, <strong>and</strong> inclusion functions for field-scale models of the<br />
fate <strong>and</strong> transport.<br />
<strong>Experimental</strong> Framework<br />
Natural river water flows through the ESF, which allows studies to be conducted when stream biota are most<br />
abundant <strong>and</strong> active, approximately mid-March through late October. Typically two experiments are conducted<br />
per year, with each experiment running for about 12-15 weeks: 4-6 weeks for colonization of the streams by<br />
natural biota; 4-6 for applying a stressor(s) such as a chemical dose or flow manipulation; <strong>and</strong> 3-4 weeks for stream<br />
recovery after the stressor period ends.<br />
Base Analytical Endpoints<br />
The baseline analytical endpoints for each<br />
experiment include: sediment size fractions;<br />
carbon, nitrogen, <strong>and</strong> phosphorus in<br />
sediments; inter-gravel water nutrient species<br />
concentrations; surface water temperature,<br />
conductivity, pH, dissolved oxygen, oxidation/<br />
reduction potential, <strong>and</strong> turbidity; stored<br />
organic matter; invertebrate community<br />
structure; periphyton (a gelatinous matrix,<br />
also known as a biofilm, that may consist<br />
of attached algae, bacteria, fungi, trapped<br />
fine sediment <strong>and</strong> deterital material, <strong>and</strong><br />
The <strong>Experimental</strong> <strong>Stream</strong> <strong>Facility</strong><br />
3
The <strong>Experimental</strong> <strong>Stream</strong> <strong>Facility</strong><br />
microinvertebrates that use it both as a food source <strong>and</strong> habitat); per capita invertebrate drift emigration rates;<br />
periphyton chlorophyll-a concentrations; carbon, nitrogen, <strong>and</strong> phosphorus in periphyton; surface water nutrient<br />
species concentrations; <strong>and</strong> algal community structure. These data are acquired <strong>and</strong> managed across all ESF<br />
studies, <strong>and</strong> are likewise a part of the associated field research. They<br />
serve as a basis for meta-analyses, scaling ESF results to the field, or<br />
comparing against novel indicators of exposure <strong>and</strong> stress.<br />
The <strong>Research</strong> Team<br />
National Risk Management <strong>Research</strong> Laboratory (NRMRL) is<br />
responsible for the operation, maintenance, <strong>and</strong> facilitation of the<br />
experiments at the ESF. However, the experimental designs are<br />
developed <strong>and</strong> implemented by a multi-disciplinary team of research<br />
scientists <strong>and</strong> engineers, <strong>and</strong> technical support personnel from across<br />
EPA’s ORD laboratories. The lead for each experiment can be a<br />
researcher from any of the EPA laboratories. Using the combined<br />
expertise of the multi-disciplinary team members optimizes<br />
coordination, leverages resources, <strong>and</strong> encourages collegiality in the<br />
integration of both risk assessment <strong>and</strong> risk management objectives<br />
into novel experiments.<br />
The <strong>Experimental</strong> <strong>Stream</strong> <strong>Facility</strong><br />
The facility, located in Milford, Ohio, was originally built by the<br />
Proctor & Gamble Company, <strong>and</strong> was well known as a premier<br />
laboratory in the area of mesocosm research in ecotoxicology <strong>and</strong> risk<br />
assessment. The facility is currently owned by Clermont County,<br />
<strong>and</strong> became available to EPA in 2005, through a lease with the<br />
County (some lab <strong>and</strong> office space is used by the Clermont County<br />
Sewer District Water Quality Testing Laboratory). Since taking<br />
occupancy, EPA has made several modifications to the facility which<br />
Scientist <strong>and</strong> engineers<br />
make it a unique small stream research laboratory. The capabilities of the facility have been extended for research<br />
applications in the fields of ecohydrology/sedimentology, biogeochemistry, <strong>and</strong> risk management.<br />
<strong>Experimental</strong> <strong>Stream</strong> Configuration<br />
Each stream mesocosm includes a head tank, an upper biotic colonization channel, a lower biotic colonization<br />
channel, a tail tank, <strong>and</strong> a water recirculation system (see figure, page 4), <strong>and</strong> is 12 meters (m) long, or 39 feet (ft).<br />
The upper channel typically has a tile streambed, <strong>and</strong> the lower channel usually has a gravel streambed, but the<br />
channels can be interchanged. A small pool section can be added between the upper <strong>and</strong> lower channels. Plastic<br />
or stainless steel mesocosms are available, depending upon the physiochemical properties of the contaminant<br />
under study. A removable baffle to subdivide the channel sections into like units is optional for increasing<br />
statistical replication.<br />
4
Head Tank<br />
All source water, chemical dose, <strong>and</strong><br />
recirculated water flows pass through an in-line<br />
mixer into the bottom of the 126 liter (L), or<br />
33 gallon (gal), head tank. Water flows over a<br />
rectangular weir into the upper channel section.<br />
The head tank is mounted on a jacking system<br />
which can raise or lower the head tank, which<br />
allows the channel slope to be varied between<br />
0 <strong>and</strong> 4.3% to simulate different stream flow<br />
conditions.<br />
Head Works<br />
1) Head Tank<br />
2) Main River Water Influent<br />
3) Alternate Water Source<br />
Influent<br />
4) Flow Meter-Transmitter<br />
5) Actuator<br />
6) Chemical Dose Influent<br />
7) Scissor Jack-Slope Control<br />
Tile Section<br />
The upper channel is usually configured to simulate large, flat rocks in a<br />
glide reach of a natural stream where periphyton attach <strong>and</strong> grow. The<br />
channel is approximately 30 centimeters (cm), or 12 inches (in), wide; 9<br />
cm (3.5 in) deep; <strong>and</strong> 4.5 m (14 ft) long. It is usually lined with 47 rows<br />
of unglazed ceramic tiles, with 3 tiles per row. The tiles provide a defined<br />
surface area, as well as a removable substrate for the growth of periphyton.<br />
Water moves through this section in a more laminar flow at a depth of<br />
2.5 cm (1 in). The tiles are sampled r<strong>and</strong>omly during an experiment to<br />
derive several measurements, such as algal biomass, stored nutrients, <strong>and</strong><br />
periphyton community structure.<br />
1 2<br />
3<br />
1. Tiled sampled in low light channel 2. Tiled sampled in highlight channel 3. Cyanobacteria in<br />
tile section<br />
The <strong>Experimental</strong> <strong>Stream</strong> <strong>Facility</strong><br />
5
The <strong>Experimental</strong> <strong>Stream</strong> <strong>Facility</strong><br />
Gravel Tray Section<br />
The lower channel is usually configured to simulate a riffle in a natural stream where small rocks <strong>and</strong> gravel<br />
provide both substrate for periphyton <strong>and</strong> shelter for aquatic invertebrates. The channel is approximately 50 cm<br />
(21 in) wide, 17 cm (6.5 in) deep, <strong>and</strong> 4.5 m (14 ft) long. It contains an array of gravel-filled plastic trays in 15<br />
rows, with 3 trays per row (mesh baskets can be used instead of plastic trays to allow interflow between sampling<br />
units.). Gravel (small river rock) ranging in size from 1.5 to 4 cm (0.6 to 1.6 in) diameter has been used to date,<br />
but substrates ranging from fine silt/clays to smaller gravel could be used depending on experimental objectives.<br />
Each gravel tray provides a removable substrate of defined volume <strong>and</strong> area, which can be used to quantify many<br />
of the base analytical endpoints.<br />
Water moves through this section<br />
in a more turbulent flow at a depth<br />
of 5 cm (2 in), <strong>and</strong> water jets<br />
can be configured in this section<br />
to simulate peak flow velocities<br />
during storm events. Gravel<br />
trays are also sampled r<strong>and</strong>omly<br />
during an experiment. Similar<br />
gravel trays are used at several field<br />
sampling locations in the East<br />
Fork Watershed, <strong>and</strong> provide the<br />
same base analytical endpoint data.<br />
St<strong>and</strong>ard operating procedures<br />
have been written for sampling,<br />
processing, <strong>and</strong> analyzing all<br />
variables obtained from the gravel<br />
trays <strong>and</strong> the tiles.<br />
1. Trays at the start of experiment 2. Trays with accumulation & recently replaced trays<br />
3a-c. Gravel biota 4. Samplers are buried in gravel 5. Sampled tray<br />
6
Drift Measurements<br />
Invertebrate drift responses can be measured by<br />
positioning drift nets to isolate the gravel section.<br />
The upstream net secludes influent drift, while the<br />
downstream net catches all organisms drifting from<br />
the gravel during the measurement period. Per capita<br />
emigration is determined as the number of individuals<br />
captured by the downstream net divided by their<br />
respective density counted in the gravel section.<br />
Tail Tank<br />
A 222 L (59 gal) tail tank at the end of each mesocosm<br />
simulates conditions of a pool in a natural stream<br />
channel. The tail tanks house continuous clam-based<br />
behavioral biomonitoring <strong>and</strong> real-time water quality<br />
sensing equipment, <strong>and</strong> can be configured for exposing<br />
larger stream biota (i.e., fish). Side-streams are plumbed<br />
in-line with the discharge from each mesocosm to supply<br />
flow to additional small tanks for other biotic exposure<br />
options. The biomonitors allow behavioral responses to<br />
be tracked in relation to the measured changes in stream<br />
structure <strong>and</strong> function. Outflow from the tail tank can<br />
be discharged under an NPDES permit or sent to the<br />
neighboring wastewater treatment plant. A new version<br />
of clam biomonitors is currently being tested.<br />
Upstream Drift Net<br />
1. Electronics<br />
2. Plunger<br />
3. Clam<br />
4. Adhesive<br />
5. Pedestal<br />
6. Adjustable Height<br />
Tail tank with exposure cage<br />
Clam biomonitor housing in tail<br />
tank<br />
Clams in biomonitor; plunger moves<br />
proportional to shell gape<br />
The <strong>Experimental</strong> <strong>Stream</strong> <strong>Facility</strong><br />
7
The <strong>Experimental</strong> <strong>Stream</strong> <strong>Facility</strong><br />
Recirculation System<br />
Recirculation loops with pumps can return water at a constant pre-set flow rate from the tail tank to the head tank<br />
for each mesocosm, which allows residence time to be manipulated while maintaining velocities <strong>and</strong> turbulent<br />
features for the biotic colonization sections. This can be important for studies considering the fate <strong>and</strong> transport<br />
of stream solutes. The recirculation flow can also be diverted to the head tank of an adjacent mesocosm so that the<br />
effluent of one mesocosm can serve as influent to another, allowing up to eight streams to be studied in series.<br />
1. Tail tanks 2. Recirculation line from tail tank to pump 3. Flow meter on recirculation loop<br />
Unique ESF Features<br />
There are several unique features that make the ESF a one-of-a-kind facility for conducting controlled, flowthrough,<br />
meso-scale simulation studies of stream ecosystems. The process flow diagram below depicts the key<br />
components <strong>and</strong> linkages of the process-controlled systems.<br />
Multiple Water Sources<br />
Water is pumped into four ESF<br />
supply tanks from several sources,<br />
<strong>and</strong> flows by gravity from the<br />
supply tanks to each mesocosm.<br />
Each mesocosm has two sets of<br />
piping, flow meters, <strong>and</strong> computercontrolled<br />
valves to allow water<br />
from two supply tanks to flow to the<br />
head tank of each mesocosm. Flow<br />
through one set can be controlled<br />
within 0.38 liters/minute (L/min),<br />
or 0.1 gallons per minute (gpm), in<br />
the range of 19 to 190 L/min (5 to<br />
50 gpm). Flow though the other set<br />
can be controlled within the range of<br />
8
East Fork River intakes East Fork River main channel ESF water supply tanks<br />
0 to 57 L/min (0 to 15 gpm). This flow control, along with the ability to adjust the mesocosm slopes, allows for a<br />
range of controllable in-stream velocities.<br />
Natural water flow can be supplied from two nearby sources: Heiserman <strong>Stream</strong>, a relatively unimpacted<br />
headwater stream, or the East Fork, a 6 th order river channel. The East Fork water has two to three times the<br />
carbon <strong>and</strong> nutrient concentration of the Heiserman water. The availability of water from such different stream<br />
sources exp<strong>and</strong>s the natural simulation horizon of ESF experiments.<br />
Tertiary wastewater effluent (oxidation ditches followed by<br />
clarification <strong>and</strong> s<strong>and</strong> filtration) from the adjacent Lower East Fork<br />
Wastewater Treatment Plant (WWTP) is pumped to an ESF supply<br />
tank which can be aerated to avoid stagnation. Excess wastewater is<br />
routed back to the WWTP. The availability of wastewater allows the<br />
effects of emerging contaminants in wastewater to be studied alone or<br />
in combination with other variables. Finally, carbon-treated tap water<br />
is also available for experiments.<br />
Variable Simulated Solar Irradiance<br />
High intensity grow lights provide simulated sunlight to fuel primary<br />
production in ESF mesocosms. The ceiling mounted lights provide<br />
daily-integrated irradiance of approximately 12% of unshaded (openfield)<br />
photosynthetically active radiation (PAR), which is similar to<br />
that experienced by a forested stream where leaves in the tree canopy<br />
shade the channel. Additional lights can be configured to provide<br />
daily-integrated irradiance of approximately 100% of unshaded<br />
(open-field) PAR to simulate a stream flowing through an agricultural<br />
field or developed area without a forested riparian buffer. The lights<br />
are programmed to run on a 24-hour cycle based on the ESF’s<br />
geographical location.<br />
Grow lights - low light channels<br />
High light channel<br />
The <strong>Experimental</strong> <strong>Stream</strong> <strong>Facility</strong><br />
9
The <strong>Experimental</strong> <strong>Stream</strong> <strong>Facility</strong><br />
Continuous Water Quality <strong>and</strong> Climate Monitoring<br />
Each mesocosm has sensors in the tail tank that measure the<br />
surface water quality base analytical endpoints listed previously.<br />
The sensors continually transmit the water quality data for each<br />
mesocosm at five minute intervals to the data acquisition system.<br />
A complementary set of these sensors monitors the influent waters<br />
to the facility. The ESF has an outdoor weather station <strong>and</strong><br />
indoor sensors to continuously monitor PAR, air temperature, <strong>and</strong><br />
humidity. Precipitation is continuously tracked by the outdoor<br />
station as well.<br />
Chemical Dosing System<br />
Chemical doses of stressors/pollutants can be metered into the<br />
head of each mesocosm from the chemical delivery system. Doses<br />
are continuously mixed in 570 L (150 gal) stainless steel tanks.<br />
The chemical feed pumps are accurate to within 0.5 milliliters/<br />
minute (ml/min), or 0.2 gallons per day (gpd), within the range of<br />
25 to 150 ml/min (9.5 to 57 gpd), <strong>and</strong> are integrated with pressure<br />
transducers to ensure even pumping <strong>and</strong> fail safe operation. They<br />
work together with meters <strong>and</strong> valves on the river flow lines to<br />
provide constant in-stream dose concentration over extended<br />
dosing periods (e.g. 30 days, typically).<br />
Continuous water quality monitoring equipment<br />
Chemical dosing tanks<br />
10
Supervisory Control <strong>and</strong> Data Acquisition<br />
A supervisory control <strong>and</strong> data acquisition (SCADA) system<br />
performs several functions:<br />
• monitors/controls natural river, wastewater, <strong>and</strong><br />
recirculation flows;<br />
• activates/controls the timing of the simulated solar<br />
irradiance;<br />
• monitors/controls the chemical delivery system;<br />
• acquires data from all the continuous water quality <strong>and</strong><br />
behavioral monitoring sensors; <strong>and</strong><br />
• initiates phone calls to the operators in case of any system<br />
failure (e.g. low water flow).<br />
Screenshot of SCADA System<br />
Data files generated within the SCADA system are transferred to a data storage device, in which data management<br />
functions are housed. An effort is underway to make data accessible to all collaborators via email or the web.<br />
Programmable Environmental Triggers<br />
Logic control algorithms can be written for the SCADA system that trigger changes in flow rate, chemical dosing,<br />
or flow distribution (river inflow vs. recirculation) in response to natural changes in climate or water quality.<br />
Some examples include mesocosm flow regimes that can be programmed to change at the onset of a rain event, as<br />
detected by the weather station, or a change in water quality, as detected by one of the real-time sensors in the tail<br />
tank. The timing <strong>and</strong> proportion of flow that is recirculated can be used to manipulate sediment accumulation,<br />
colonization rates, <strong>and</strong>/or discharge rate from each mesocosm. Contaminant dosing can be programmed to be<br />
continuous or intermittent <strong>and</strong> triggered by a rain event.<br />
Significance<br />
Underst<strong>and</strong>ing the impact of contaminants on small streams, <strong>and</strong> reducing the loading of stressors to watersheds,<br />
is of concern to environmental stakeholders, including local <strong>and</strong> state governments, utilities, developers, <strong>and</strong><br />
homeowners. Knowing how contaminants of concern affect aquatic biota will help determine which stressors<br />
are most important for the consideration of environmental regulators. Adoption of the watershed approach <strong>and</strong><br />
best management practices to control both urban <strong>and</strong> rural sources of waterborne pollutants is helping to reduce<br />
contaminants at the watershed level. The chief beneficiaries are the environmental decision makers who will use<br />
the ESF data in watershed models to better characterize how streams react to, <strong>and</strong> process, emerging contaminants<br />
<strong>and</strong> stressful mixtures, <strong>and</strong> to quantitatively link known stressors in stream flow with the structure <strong>and</strong> function of<br />
stream ecosystems.<br />
The <strong>Experimental</strong> <strong>Stream</strong> <strong>Facility</strong><br />
11
The <strong>Experimental</strong> <strong>Stream</strong> <strong>Facility</strong><br />
Contacts<br />
Technical Contact<br />
Christopher Nietch PhD<br />
Systems Ecologist<br />
U.S. Environmental Protection Agency<br />
Office of <strong>Research</strong> & Development<br />
National Risk Management <strong>Research</strong> Laboratory<br />
Water Suppy & Water Resources Division<br />
(513) 569-7460 nietch.christopher@epa.gov<br />
Communications<br />
Michelle Latham<br />
Biologist/Communications Specialist<br />
U.S. Environmental Protection Agency<br />
Office of <strong>Research</strong> & Development<br />
National Risk Management <strong>Research</strong> Laboratory<br />
Water Supply & Water Resources Division<br />
(513) 569-7601 latham.michelle@epa.gov<br />
EPA Scientist leading a tour<br />
at the <strong>Experimental</strong><br />
<strong>Stream</strong> <strong>Facility</strong>.<br />
Resources<br />
Website<br />
<strong>Experimental</strong> <strong>Stream</strong> <strong>Facility</strong><br />
http://www.epa/nrmrl/wswrd/wqm/esf/esf.html<br />
Video<br />
U.S. EPA (2009) <strong>Experimental</strong> <strong>Stream</strong> <strong>Facility</strong> -<br />
<strong>Design</strong> <strong>and</strong> <strong>Research</strong><br />
http://www.youtube.com/user/USEPAgov#play/<br />
uploads/5/jwOlYv7heE4<br />
Fact Sheet<br />
<strong>Experimental</strong> <strong>Stream</strong> <strong>Facility</strong><br />
(EPA/600/F-08/006)<br />
http://www.epa.gov/ord/NRMRL/pubs/<br />
facilities/600f08006.pdf<br />
12 12
PRESORTED STANDARD<br />
POSTAGE & FEES PAID<br />
EPA<br />
PERMIT NO. G-35<br />
Office of <strong>Research</strong> <strong>and</strong> Development<br />
National Risk Management <strong>Research</strong> Laboratory<br />
Cincinnati, Ohio 45268<br />
Official Business<br />
Penalty for Private Use<br />
$300