WE ARE ALL WITNESSES - PEOPLE IN A CHANGING CLIMATE
The 24 panels of the "We are all witnesses - People in a Changing Climate" exhibition illustrate how climate change is already taking place in 16 countries in four countries.
The 24 panels of the "We are all witnesses - People in a Changing Climate" exhibition illustrate how climate change is already taking place in 16 countries in four countries.

Create successful ePaper yourself
Turn your PDF publications into a flip-book with our unique Google optimized e-Paper software.
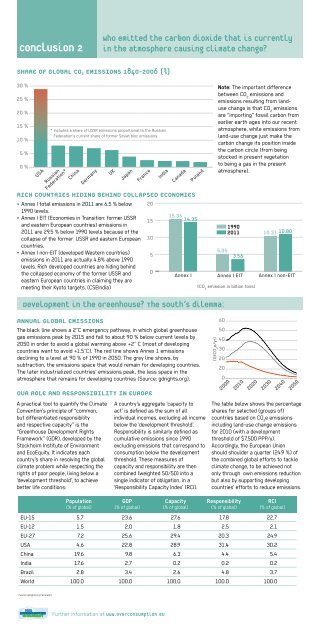
Conclusion 2<br />
Who emitted the carbon dioxide that is currently<br />
in the atmosphere causing climate change?<br />
SH<strong>ARE</strong> OF GLOBAL CO 2 EMISSIONS 1840-2006 (%)<br />
Source: ASTM based on informations from Centre for Science and Environment (2008).<br />
30 %<br />
25 %<br />
20 %<br />
15 %<br />
10 %<br />
5 %<br />
0 %<br />
USA<br />
* Includes a share of USSR emissions proportional to the Russian<br />
Federation‘s current share of former Soviet bloc emissions.<br />
Russian<br />
Federation*<br />
China<br />
Germany<br />
UK<br />
Japan<br />
France<br />
RICH COUNTRIES HID<strong>IN</strong>G BEH<strong>IN</strong>D COLLAPSED ECONOMIES<br />
• Annex I total emissions in 2011 are 6.5 % below<br />
1990 levels.<br />
• Annex I EIT (Economies in Transition: former USSR<br />
and eastern European countries) emissions in<br />
2011 are 29.5 % below 1990 levels because of the<br />
collapse of the former USSR and eastern European<br />
countries.<br />
• Annex I non-EIT (developed Western countries)<br />
emissions in 2011 are actually 4.8% above 1990<br />
levels. Rich developed countries are hiding behind<br />
the collapsed economy of the former USSR and<br />
eastern European countries in claiming they are<br />
meeting their Kyoto targets. (CSEIndia)<br />
Development in the Greenhouse? The South’s dilemma:<br />
20<br />
15<br />
10<br />
5<br />
0<br />
India<br />
Canada<br />
15.36<br />
14.35<br />
Annex I<br />
ANNUAL GLOBAL EMISSIONS<br />
The black line shows a 2°C emergency pathway, in which global greenhouse<br />
gas emissions peak by 2015 and fall to about 90 % below current levels by<br />
2050 in order to avoid a global warming above +2° C (most of developing<br />
countries want to avoid +1.5°C). The red line shows Annex 1 emissions<br />
declining to a level at 90 % of 1990 in 2050. The grey line shows, by<br />
subtraction, the emissions space that would remain for developing countries.<br />
The later industrialized countries’ emissions peak, the less space in the<br />
Poland<br />
60<br />
50<br />
40<br />
30<br />
20<br />
20<br />
atmosphere that remains for developing countries (Source: gdrights.org). 0<br />
OUR ROLE AND RESPONSIBILITY <strong>IN</strong> EUROPE<br />
A practical tool to quantify the Climate<br />
Convention’s principle of “common,<br />
but differentiated responsibility<br />
and respective capacity” is the<br />
“Greenhouse Development Rights<br />
Framework” (GDR), developed by the<br />
Stockholm Institute of Environment<br />
and EcoEquity. It indicates each<br />
country’s share in resolving the global<br />
climate problem while respecting the<br />
rights of poor people, living below a<br />
‘development threshold’, to achieve<br />
better life conditions:<br />
Population<br />
(% of global)<br />
A country’s aggregate ‘capacity to<br />
act’ is defined as the sum of all<br />
individual incomes, excluding all income<br />
below the ‘development threshold’.<br />
Responsibility is similarly defined as<br />
cumulative emissions since 1990<br />
excluding emissions that correspond to<br />
consumption below the development<br />
threshold. These measures of<br />
capacity and responsibility are then<br />
combined (weighted 50/50) into a<br />
single indicator of obligation, in a<br />
‘Responsibility Capacity Index’ (RCI).<br />
GDP<br />
(% of global)<br />
Capacity<br />
(% of global)<br />
Note: The important difference<br />
between CO 2<br />
emissions and<br />
emissions resulting from landuse<br />
change is that CO 2<br />
emissions<br />
are “importing” fossil carbon from<br />
earlier earth ages into our recent<br />
atmosphere, while emissions from<br />
land-use change just make the<br />
carbon change its position inside<br />
the carbon circle (from being<br />
stocked in present vegetation<br />
to being a gas in the present<br />
atmosphere).<br />
5.05<br />
1990<br />
2011 10.31<br />
3.56<br />
Annex I EIT<br />
(CO 2<br />
emission in billion tons)<br />
2000<br />
2010<br />
2020<br />
10.80<br />
Annex I non-EIT<br />
2030<br />
2040<br />
2050<br />
The table below shows the percentage<br />
shares for selected (groups of)<br />
countries based on CO 2<br />
e emissions<br />
including land-use change emissions<br />
for 2010 (with a development<br />
threshold of $7,500 PPP/y).<br />
Accordingly, the European Union<br />
should shoulder a quarter (24.9 %) of<br />
the combined global efforts to tackle<br />
climate change, to be achieved not<br />
only through own emissions reduction<br />
but also by supporting developing<br />
countries’ efforts to reduce emissions.<br />
Responsibility<br />
(% of global)<br />
RCI<br />
(% of global)<br />
EU-15 5.7 23.6 27.6 17.8 22.7<br />
EU-12 1.5 2.0 1.8 2.5 2.1<br />
EU-27 7.2 25.6 29.4 20.3 24.9<br />
USA 4.6 22.8 28.9 31.4 30.2<br />
China 19.6 9.8 6.3 4.4 5.4<br />
India 17.6 2.7 0.2 0.2 0.2<br />
Brazil 2.8 3.4 2.6 4.8 3.7<br />
World 100.0 100.0 100.0 100.0 100.0<br />
(GtCO 2<br />
e/yr)<br />
Source: CSEIndia 2012<br />
(Source: gdrights.org/calculator).<br />
Further information at www.overconsumption.eu