

Performance of short duration rice mutants and assessment of genetic diversity using RAPD and ISSR markers
Eleven short duration rice mutants along with their parent (Mandakini) and three standard checks (Jogesh, Nilagiri and Annapurna) were evaluated in the field. ORT 11, ORT 30 and ORT 35 out yielded significantly (>3250kg/ha) as compared to the parent (2830kg/ha) and also the best standard check variety Annapurna (2950q/ha). High yield performance of the aforesaid mutants were associated with high tiller number, number of grains/panicle, grain weight, and fertility percentage. 13 RAPD and 11 ISSR primers revealed 78.32% and 96.55% polymorphism respectively across the test genotypes and primers. RAPD had shown comparatively high genomic homology, whereas ISSR revealed divergent genotype pair with similarity coefficient value as low as 0.20 between Annapurna and Mandakini followed by Annapurna and ORT 30; and Annapurna and ORT 15.. The mutant ORT 38 and variety Jogesh clubbed together and could not be distinguished from each other at even 100% phenon level using RAPD markers. However, ISSR alone as well as the combined analysis could discriminate such genotypes. Considering the level of polymorphism, similarity coefficient value and clustering pattern; ISSR markers are preferred as these are comparatively more informative and potent enough for study of genetic diversity than RAPD markers. The genotype-specific RAPD and ISSR profiles would help to certify the genetic make up in rice genotypes.
Eleven short duration rice mutants along with their parent (Mandakini) and three standard checks (Jogesh, Nilagiri and Annapurna) were evaluated in the field. ORT 11, ORT 30 and ORT 35 out yielded significantly (>3250kg/ha) as compared to the parent (2830kg/ha) and also the best standard check variety Annapurna (2950q/ha). High yield performance of the aforesaid mutants were associated with high tiller number, number of grains/panicle, grain weight, and fertility percentage. 13 RAPD and 11 ISSR primers revealed 78.32% and 96.55% polymorphism respectively across the test genotypes and primers. RAPD had shown comparatively high genomic homology, whereas ISSR revealed divergent genotype pair with similarity coefficient value as low as 0.20 between Annapurna and Mandakini followed by Annapurna and ORT 30; and Annapurna and ORT 15.. The mutant ORT 38 and variety Jogesh clubbed together and could not be distinguished from each other at even 100% phenon level using RAPD markers. However, ISSR alone as well as the combined analysis could discriminate such genotypes. Considering the level of polymorphism, similarity coefficient value and clustering pattern; ISSR markers are preferred as these are comparatively more informative and potent enough for study of genetic diversity than RAPD markers. The genotype-specific RAPD and ISSR profiles would help to certify the genetic make up in rice genotypes.

Create successful ePaper yourself
Turn your PDF publications into a flip-book with our unique Google optimized e-Paper software.
Int. J. Agr. & Agri. R.<br />
discriminated the genotypes effectively with a robust<br />
discriminating power (0.99), followed by <strong>ISSR</strong> (0.76)<br />
<strong>and</strong> <strong>RAPD</strong> (0.61).<br />
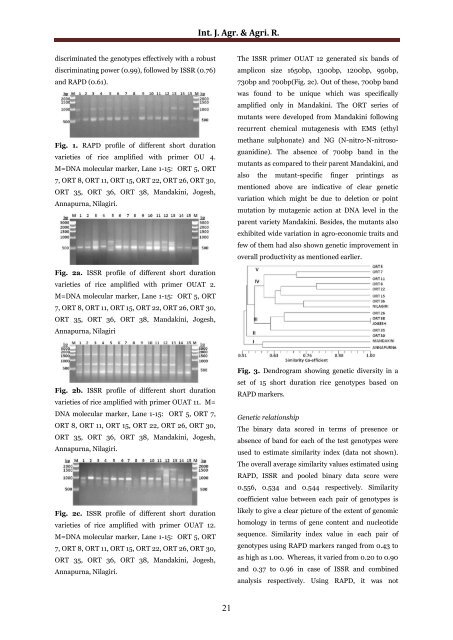
Fig. 1. <strong>RAPD</strong> pr<strong>of</strong>ile <strong>of</strong> different <strong>short</strong> <strong>duration</strong><br />
varieties <strong>of</strong> <strong>rice</strong> amplified with primer OU 4.<br />
M=DNA molecular marker, Lane 1-15: ORT 5, ORT<br />
7, ORT 8, ORT 11, ORT 15, ORT 22, ORT 26, ORT 30,<br />
ORT 35, ORT 36, ORT 38, M<strong>and</strong>akini, Jogesh,<br />
Annapurna, Nilagiri.<br />
The <strong>ISSR</strong> primer OUAT 12 generated six b<strong>and</strong>s <strong>of</strong><br />
amplicon size 1650bp, 1300bp, 1200bp, 950bp,<br />
730bp <strong>and</strong> 700bp(Fig. 2c). Out <strong>of</strong> these, 700bp b<strong>and</strong><br />
was found to be unique which was specifically<br />
amplified only in M<strong>and</strong>akini. The ORT series <strong>of</strong><br />
<strong>mutants</strong> were developed from M<strong>and</strong>akini following<br />
recurrent chemical mutagenesis with EMS (ethyl<br />
methane sulphonate) <strong>and</strong> NG (N-nitro-N-nitrosoguanidine).<br />
The absence <strong>of</strong> 700bp b<strong>and</strong> in the<br />
<strong>mutants</strong> as compared to their parent M<strong>and</strong>akini, <strong>and</strong><br />
also the mutant-specific finger printings as<br />
mentioned above are indicative <strong>of</strong> clear <strong>genetic</strong><br />
variation which might be due to deletion or point<br />
mutation by mutagenic action at DNA level in the<br />
parent variety M<strong>and</strong>akini. Besides, the <strong>mutants</strong> also<br />
exhibited wide variation in agro-economic traits <strong>and</strong><br />
few <strong>of</strong> them had also shown <strong>genetic</strong> improvement in<br />
overall productivity as mentioned earlier.<br />
Fig. 2a. <strong>ISSR</strong> pr<strong>of</strong>ile <strong>of</strong> different <strong>short</strong> <strong>duration</strong><br />
varieties <strong>of</strong> <strong>rice</strong> amplified with primer OUAT 2.<br />
M=DNA molecular marker, Lane 1-15: ORT 5, ORT<br />
7, ORT 8, ORT 11, ORT 15, ORT 22, ORT 26, ORT 30,<br />
ORT 35, ORT 36, ORT 38, M<strong>and</strong>akini, Jogesh,<br />
Annapurna, Nilagiri<br />
Fig. 2b. <strong>ISSR</strong> pr<strong>of</strong>ile <strong>of</strong> different <strong>short</strong> <strong>duration</strong><br />
varieties <strong>of</strong> <strong>rice</strong> amplified with primer OUAT 11. M=<br />
DNA molecular marker, Lane 1-15: ORT 5, ORT 7,<br />
ORT 8, ORT 11, ORT 15, ORT 22, ORT 26, ORT 30,<br />
ORT 35, ORT 36, ORT 38, M<strong>and</strong>akini, Jogesh,<br />
Annapurna, Nilagiri.<br />
Fig. 2c. <strong>ISSR</strong> pr<strong>of</strong>ile <strong>of</strong> different <strong>short</strong> <strong>duration</strong><br />
varieties <strong>of</strong> <strong>rice</strong> amplified with primer OUAT 12.<br />
M=DNA molecular marker, Lane 1-15: ORT 5, ORT<br />
7, ORT 8, ORT 11, ORT 15, ORT 22, ORT 26, ORT 30,<br />
ORT 35, ORT 36, ORT 38, M<strong>and</strong>akini, Jogesh,<br />
Annapurna, Nilagiri.<br />
Fig. 3. Dendrogram showing <strong>genetic</strong> <strong>diversity</strong> in a<br />
set <strong>of</strong> 15 <strong>short</strong> <strong>duration</strong> <strong>rice</strong> genotypes based on<br />
<strong>RAPD</strong> <strong>markers</strong>.<br />
Genetic relationship<br />
The binary data scored in terms <strong>of</strong> presence or<br />
absence <strong>of</strong> b<strong>and</strong> for each <strong>of</strong> the test genotypes were<br />
used to estimate similarity index (data not shown).<br />
The overall average similarity values estimated <strong>using</strong><br />
<strong>RAPD</strong>, <strong>ISSR</strong> <strong>and</strong> pooled binary data score were<br />
0.556, 0.534 <strong>and</strong> 0.544 respectively. Similarity<br />
coefficient value between each pair <strong>of</strong> genotypes is<br />
likely to give a clear picture <strong>of</strong> the extent <strong>of</strong> genomic<br />
homology in terms <strong>of</strong> gene content <strong>and</strong> nucleotide<br />
sequence. Similarity index value in each pair <strong>of</strong><br />
genotypes <strong>using</strong> <strong>RAPD</strong> <strong>markers</strong> ranged from 0.43 to<br />
as high as 1.00. Whereas, it varied from 0.20 to 0.90<br />
<strong>and</strong> 0.37 to 0.96 in case <strong>of</strong> <strong>ISSR</strong> <strong>and</strong> combined<br />
analysis respectively. Using <strong>RAPD</strong>, it was not<br />
21


