Background Methods Results Results (cont') - 2003 National ...
Background Methods Results Results (cont') - 2003 National ...
Background Methods Results Results (cont') - 2003 National ...

You also want an ePaper? Increase the reach of your titles
YUMPU automatically turns print PDFs into web optimized ePapers that Google loves.
AL-Alabama, AK-Alaska, AZ- Ar i zona, AR-Ar kansas, CA-Calif or nia, CO-Color ado, CT -Connecticut,<br />
DE-Delaware, DC-District of Columbia, FL-Florida, GA-Georgia, HI-Hawaii, ID-Idaho- IL-Illinois- IN- Indiana, IA-Iowa, KS-Kansas, KY-<br />
Kentucky, LA-Louisiana, M E - M aine, M D- M ar yl and, M A- M assachusetts, Ml- Michigan, MN- Minnesota, MS- M ississippi, MO- M issour i,<br />
MT - M ontana, NE- Nebr aska, NV- Nevada, NH- New Hampshir e, NJ- New Jersey, NM - New Mexico, NY- New Yor k, NC- Nor th Car olina, ND-<br />
Nor th Dakota, OH- Ohio, OK- Okl ahoma, OR- Or egon, PA- P ennsylvania, RI- Rhode I sl and, SC- South Car olina, SD- South Dakota, T N-<br />
Tennessee, T X- Texas, UT - Utah, VT- Ver mont, VA- Vir ginia, WA- Washington, WV- West Vir ginia, WI- Wisconsin, WY- Wyoming.<br />
A State Level Evaluation Design To Assess<br />
Program Effectiveness<br />
Priti Bandi 1 , Patrick L. Remington 2 , D. Paul Moberg 2<br />
American Cancer Society 1, University of Wisconsin<br />
Comprehensive Cancer Center 2<br />
•Acknowledgements<br />
‣This project was funded by the Tobacco Prevention and Control Program, Division<br />
of Public Health, Wisconsin Department of Health and Family Services.<br />
‣The authors would like to thank David Ahrens, Barbara Hill and Vilma Cokkinides<br />
for their contributions.<br />
‣The authors would like to thank the American Cancer Society for their sponsorship<br />
of this poster presentation.<br />
•Contacts<br />
‣Priti Bandi – priti.bandi@cancer.org<br />
‣Patrick L. Remington – plreming@factsaff.wisc.edu<br />
‣D. Paul Moberg - dpmoberg@wisc.edu<br />
<strong>Background</strong><br />
• State level tobacco control program evaluations have traditionally employed state-tostate<br />
or national comparisons, of tobacco use measures, in assessing program<br />
effectiveness. This methodology, while accounting for secular trends, does not<br />
account for complex factors affecting tobacco use at the state level.<br />
• This research presents program evaluators an innovative design to conduct program<br />
evaluations by comparing state level outcomes to those in unique groupings of “peer”<br />
states.<br />
• Wisconsin’s progress in reducing cigarette consumption, two years after program<br />
implementation, is used to illustrate this methodology.<br />
• Wisconsin’s Comprehensive Tobacco Control Program<br />
‣ Wisconsin Tobacco Control Board established in 1999.<br />
‣ Most Board instituted programs became operational in Summer 2001.<br />
‣ Funding – Approx $21 million (Jan-Dec ’01) , Approx $ 13 million (Jan ’02-present)<br />
‣ Seven primary goals were established, one of which included a 20 % reduction<br />
capita cigarette consumption between 2000 and 2005.<br />
<strong>Methods</strong><br />
• Cluster analysis<br />
‣ Multivariate cluster analysis (Ward’s hierarchical method) was used to classify all<br />
50 states and the D.C. into distinct homogenous clusters.<br />
‣ State-level variables related to state-level cigarette consumption were included in<br />
the cluster analysis. These variables were divided into quintiles (1-lowest, 5-<br />
highest).<br />
‣ Sociodemographic - State education level (% in state over age 25 with<br />
bachelor’s degree) and state Hispanic ethnicity level (% of state population<br />
that is Hispanic or Latino). 1<br />
‣ Tobacco policy related - Inflation adjusted real price of cigarettes 2 and a<br />
scale of state-level smoke-free air laws in 5 public places 3 (Range=0 to 15,<br />
Mean=5.2, Cronbach’s alpha = 0.74).<br />
‣ Validity of the cluster solution was established by a comparison of means using<br />
univariate F ratios.<br />
• Outcome measure - Per capita cigarette sales 2 were used to estimate cigarette<br />
consumption.<br />
‣ Fiscal year 2001 was established as baseline year of the program. Annual and<br />
cumulative percent changes in Wisconsin between 2001-<strong>2003</strong> were compared to<br />
corresponding changes in its “peer” state cluster (defined as the state cluster that<br />
contained Wisconsin) and other state clusters.<br />
• Cluster analysis<br />
‣ Cluster solution – Two, four and<br />
five cluster solutions from the<br />
hierarchical cluster analysis were<br />
examined. Based on the<br />
agglomeration coefficients, the<br />
dendogram from the hierarchical<br />
analysis, and the cluster profiles<br />
on the variables included in the<br />
analysis, a four cluster solution<br />
yielded the most parsimonious<br />
and explicable solution.<br />
‣ Cluster validity – Significant<br />
differences were observed across<br />
clusters on the clustering<br />
variables (internal), variables that<br />
were not included in the analysis<br />
(external) and, those variables<br />
that have a theoretically based<br />
relationship to the clustering<br />
variables (predictive). These<br />
results suggested validity of the<br />
cluster solution. (Table 1)<br />
<strong>Results</strong><br />
Cluster 1 Cluster 2 Cluster 3<br />
(n=16) (n=13) (n=11) †<br />
Cluster 4<br />
(n=11)<br />
Differences<br />
across<br />
clusters<br />
p values<br />
Internal validity<br />
State cigarette price (cents) 156.4 167.3 185.3 199.2 p
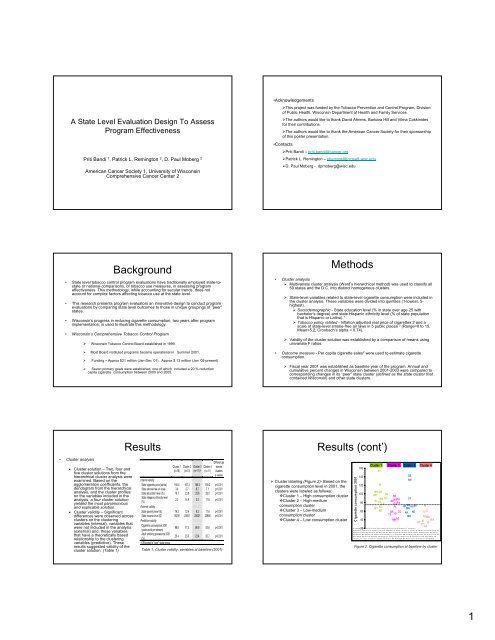
‣ Cluster interpretations (Figure 3)<br />
While the high and highmedium<br />
consumption clusters<br />
were similar on state cigarette<br />
price and smoke-free air scale,<br />
they were different on state<br />
sociodemographic<br />
characteristics, especially<br />
Hispanic ethnicity level.<br />
The low consumption and<br />
low-medium consumption<br />
clusters were similar on all the<br />
variables except on Hispanic<br />
ethnicity level, where the lowmedium<br />
consumption cluster<br />
was closer to the high<br />
consumption cluster.<br />
<strong>Results</strong> (cont’)<br />
M ean of the clustering v a r ia b le (q uintile)<br />
5.0<br />
4.5<br />
4.0<br />
3.5<br />
3.0<br />
2.5<br />
2.0<br />
1.5<br />
1.0<br />
0.5<br />
0.0<br />
High consumption cluster<br />
Low -medium consumption cluster<br />
State Cigarette<br />
Price<br />
High-medium consumption cluster<br />
Low consumption cluster<br />
State smoke-free State education State Hispanic<br />
scale<br />
level<br />
ethnicity<br />
Figure 3. Cluster profiles for the 4 cluster solution<br />
<strong>Results</strong> (cont’)<br />
Progress in reducing cigarette consumption in Wisconsin<br />
Table 2: Comparison of Wisconsin to State Groups-Cigarette Consumption* and Percent Change 2001-<strong>2003</strong><br />
% % %<br />
Cigarette Cigarette Cigarette Change Change Change<br />
Consumption Consumption Consumption 2001- 2002- 2001-<br />
2001 2002 <strong>2003</strong> ‘02 ‘03 ‘03<br />
Mean 98.6 96 95.7 -2.3 -0.9 -3.5<br />
High consumption cluster (n=16) Median 98.3 96.9 91.4 -2.5 -2.4 -4.4<br />
High-medium consumption cluster Mean 77.3 74.5 75.4 -3.7 0.6 -3.1<br />
(n=13) Median 78.6 77.9 74.7 -2.9 1 -3.3<br />
Low-medium consumption cluster Mean 87.8 87 86.9 -0.8 -3.3 -4.2<br />
† (n=10) Median 78.7 77.8 72 -1.7 -6.9 -5.8<br />
Mean 53.6 53.5 47 0.3 -11.3 -10.8<br />
Low consumption cluster (n=11) Median 50.2 51.1 47.5 1.1 -10.1 -13.3<br />
Wisconsin 78.2 75.3 71 -3.7 -5.7 -9.2<br />
* Packs per person,<br />
Group 1- Alabama, Arkansas, Indiana, Iowa, Kentucky, Louisiana, Mississippi, Missouri, Montana, North Dakota, Ohio,<br />
Oklahoma, South Carolina, South Dakota, Tennessee, West Virginia<br />
Group 2 († Wisconsin excluded from this group: Peer state group) – Alaska, Delaware, Kansas, Maine, Maryland,<br />
Michigan, Minnesota, Nebraska, New Hampshire, Vermont<br />
Group 3 – Arizona, Colorado, Florida, Georgia, Idaho, Nevada, New Mexico, North Carolina, Oregon, Pennsylvania,<br />
Texas, Virginia, Wyoming<br />
Group 4 – California, Connecticut, District of Columbia, Hawaii, Illinois, Massachusetts, New Jersey, New York, Rhode<br />
Island, Utah, Washington<br />
Table 2: Comparison of Wisconsin to State Clusters-Cigarette Consumption and Percent Reduction 2001-<strong>2003</strong><br />
<strong>Results</strong> (cont’)<br />
<strong>Results</strong> (cont’)<br />
Cigarette consumption<br />
95<br />
90<br />
85<br />
80<br />
75<br />
70<br />
65<br />
60<br />
United States Peer State Cluster Wisconsin<br />
Most programs became operational<br />
in Summer 2001<br />
2000 2001 2002 <strong>2003</strong><br />
mean = 4.2%<br />
median = 5.8%<br />
3.8%<br />
9.2%<br />
% Decline in<br />
Consumption<br />
baseline<br />
(2001)-<strong>2003</strong><br />
• Showing a greater percent decline in its cigarette consumption rate than 3<br />
of the four derived clusters, Wisconsin performed favorably in its progress<br />
towards reducing cigarette consumption in the first two years of its program.<br />
• Only Cluster 4 showed a greater percent decline than Wisconsin during this<br />
time period.<br />
• Wisconsin performed considerably better than its own peer state group<br />
(Cluster 2), between 2001 and <strong>2003</strong>, with a cumulative percent decline of<br />
9.2 percent compared to 4.2 percent for the peer state cluster. In the first<br />
year of the program, between 2001 and 2002, cigarette consumption in<br />
Wisconsin declined 3.7 percent while consumption in its peer state declined<br />
0.8 percent. In the second year of the program, between 2002 and <strong>2003</strong>,<br />
cigarette consumption in Wisconsin declined 5.7 percent compared to a<br />
decline of 3.3 percent in its peer state cluster.<br />
• Wisconsin’s cumulative percent decline in the first two years of its program,<br />
between 2001 and <strong>2003</strong>, was 5.0 percentage points greater than the<br />
decline in its peer state cluster.<br />
Figure 4. Progress in reducing cigarette consumption, WI vs. “peer” state cluster & U.S.<br />
Conclusions<br />
• This research found that states clustered into four distinguishable groups on<br />
characteristics related to cigarette consumption. Comparisons with these<br />
clusters serves as a useful state level evaluation design.<br />
• This methodology minimizes the effects of state level factors that would not<br />
be accounted for in simple comparisons to the United States or other states.<br />
• Apart from cigarette consumption, other measures of tobacco use, such as<br />
adult and youth smoking prevalence, can also be compared to assess<br />
program effectiveness.<br />
• Greater declines in Wisconsin compared to its peer state cluster and most<br />
state clusters suggest early effectiveness of Wisconsin’s tobacco control<br />
program.<br />
• Limitations: Cluster analysis is primarily an exploratory technique that is<br />
dependent on the variables included. Other variables were investigated for<br />
inclusion and the choice of included variables reflects a mixture of past<br />
research 4,5 and model parsimony. Cluster validity could not be established<br />
by replication because the 51 states represented the universe of cases.<br />
However, significant differences on the included and external variables<br />
indicated validity. Also, there may be some states in each cluster that do not<br />
conform to the description of the “average” state in that cluster. In that<br />
respect, these derived clusters should be interpreted as separate entities<br />
References<br />
1. U.S. Census Bureau. Census 2000 Summary File 3-[United States]<br />
American FactFinder. Available at: http://factfinder.census.gov Accessed<br />
July 10, 2004.<br />
2. Orzechowski W, Walker RC. The Tax Burden on Tobacco: Historical<br />
Compilation. Volume 38, <strong>2003</strong>. Arlington VA: Orzechowski and Walker;<br />
2004.<br />
3. ImpacTeen Project. ImpacTeen Tobacco Control Research Team. Roswell<br />
Park Cancer Institute, Department of Health Behavior; Buffalo, New York.<br />
Tobacco Control Policy and Prevalence Data: 1991-2001. Available at:<br />
http://www.impacteen.org/tobaccodata.htm. Accessed: August 17, 2004.<br />
4. Stillman FA, Hartman AM, Graubard BI, Gilpin EA, Murray DM, Gibson JT.<br />
Evaluation of the American Stop Smoking Intervention Study (ASSIST): a<br />
report of outcomes. J Natl Cancer Inst. <strong>2003</strong> Nov 19;95(22):1681-91.<br />
5. Gilpin EA, Stillman FA, Hartman AM, Gibson JT, Pierce JP. Index for US<br />
state tobacco control initial outcomes. Am J Epidemiol. 2000 Oct<br />
15;152(8):727-38.<br />
2