Getting the Most from High Speed Broadband in New ... - Castalia
Getting the Most from High Speed Broadband in New ... - Castalia
Getting the Most from High Speed Broadband in New ... - Castalia

You also want an ePaper? Increase the reach of your titles
YUMPU automatically turns print PDFs into web optimized ePapers that Google loves.
<strong>Gett<strong>in</strong>g</strong> <strong>the</strong> <strong>Most</strong> <strong>from</strong> <strong>High</strong><br />
<strong>Speed</strong> <strong>Broadband</strong> <strong>in</strong> <strong>New</strong><br />
Zealand: Invest<strong>in</strong>g <strong>in</strong><br />
Productivity Growth<br />
Report to<br />
Telecom, TelstraClear, & Vodafone<br />
FINAL<br />
December<br />
2008<br />
Copyright <strong>Castalia</strong> Limited. All rights reserved. <strong>Castalia</strong> is not liable for any loss caused by reliance on this<br />
document. <strong>Castalia</strong> is a part of <strong>the</strong> worldwide <strong>Castalia</strong> Advisory Group.
Glossary<br />
Below we discuss some key concepts and dist<strong>in</strong>ctions used <strong>in</strong> this report. This is followed<br />
by a glossary expla<strong>in</strong><strong>in</strong>g technical terms and acronyms we have used.<br />
Key Dist<strong>in</strong>ctions Used <strong>in</strong> this Report<br />
In th<strong>in</strong>k<strong>in</strong>g about <strong>the</strong> costs and benefits of different broadband development scenarios,<br />
we need to clearly dist<strong>in</strong>guish between several key concepts:<br />
• Incremental and absolute costs and benefits<br />
This report exam<strong>in</strong>es <strong>the</strong> <strong>in</strong>cremental benefits <strong>from</strong> publicly fund<strong>in</strong>g high<br />
speed broadband over and above what <strong>the</strong> private sector is likely to provide.<br />
We focus on <strong>the</strong> <strong>in</strong>cremental costs and benefits to <strong>New</strong> Zealanders <strong>from</strong><br />
government <strong>in</strong>tervention (what economists refer to as marg<strong>in</strong>al costs and<br />
benefits).<br />
It is important to dist<strong>in</strong>guish this concept of <strong>in</strong>cremental costs and benefits<br />
<strong>from</strong> absolute costs and benefits. We do not question that high speed<br />
broadband will ultimately deliver significant benefits to <strong>New</strong> Zealand.<br />
However, absent any major structural barriers to <strong>in</strong>vestment, <strong>in</strong>vestment by<br />
private firms is likely to deliver many of <strong>the</strong>se benefits without <strong>the</strong> need for<br />
government <strong>in</strong>tervention. Thus to determ<strong>in</strong>e whe<strong>the</strong>r government action is<br />
warranted we need to focus on <strong>the</strong> <strong>in</strong>cremental benefits government action<br />
can deliver, over and above what <strong>the</strong> market will deliver anyway, and <strong>the</strong><br />
<strong>in</strong>cremental costs.<br />
• Coverage and take-up<br />
In this report we use <strong>the</strong> term coverage to mean <strong>the</strong> number of customers a<br />
broadband network passes—that is, <strong>the</strong> number of customers who could<br />
connect to <strong>the</strong> network should <strong>the</strong>y choose to do so.<br />
We use <strong>the</strong> term take-up to refer to <strong>the</strong> number of customers who actually<br />
chose to connect to and use a broadband service. This dist<strong>in</strong>ction is critical as<br />
<strong>the</strong> benefits delivered by any new <strong>in</strong>vestment <strong>in</strong> high speed broadband will<br />
depend primarily on <strong>the</strong> number of customers who choose to connect and use<br />
<strong>the</strong> new service. We would expect this number to be smaller than <strong>the</strong> number<br />
of customers covered by <strong>the</strong> new service.<br />
• Application and use<br />
In th<strong>in</strong>k<strong>in</strong>g about <strong>the</strong> <strong>in</strong>cremental benefits of high speed broadband, we need<br />
to clearly dist<strong>in</strong>guish between <strong>the</strong> applications broadband services enable<br />
customers to access, and <strong>the</strong> uses customers have for those applications. In<br />
this report, <strong>the</strong> term applications refers to software packages or data formats<br />
which enable customers to transmit or receive certa<strong>in</strong> types of <strong>in</strong>formation<br />
over broadband networks.<br />
Examples of applications <strong>in</strong>clude email, voice over IP, videoconferenc<strong>in</strong>g,<br />
web brows<strong>in</strong>g, video stream<strong>in</strong>g, and digital television services (such as<br />
standard def<strong>in</strong>ition TV, and high def<strong>in</strong>ition TV). In contrast, uses of<br />
applications <strong>in</strong>clude “eEducation”, “eHealth”, and so on. In pr<strong>in</strong>ciple,<br />
eEducation might utilise a variety of applications, <strong>from</strong> web-brows<strong>in</strong>g to<br />
access onl<strong>in</strong>e learn<strong>in</strong>g materials, video stream<strong>in</strong>g to view recorded lectures on<br />
a given topic, to video conferenc<strong>in</strong>g enabl<strong>in</strong>g real time <strong>in</strong>teraction with remote
Glossary 1<br />
Term<br />
teachers. Depend<strong>in</strong>g on <strong>the</strong> particular application(s) a given “eEducation”<br />
programme is based on, <strong>the</strong> user may require different levels of customer<br />
experience <strong>from</strong> <strong>the</strong>ir broadband connection, which <strong>in</strong> turn may imply<br />
different underly<strong>in</strong>g access technologies (see below).<br />
• Customer experience and access technologies<br />
A number of technologies can provide access to broadband services, with<br />
differ<strong>in</strong>g technical characteristics. These access technologies <strong>in</strong>clude ADSL,<br />
ADSL2+, VDSL, Hybrid Fibre Coax (HFC), fibre, 3G mobile technologies,<br />
and wireless technologies such as WiFi and WiMax.<br />
From <strong>the</strong> customer’s po<strong>in</strong>t of view, however, what is important is generally<br />
not <strong>the</strong> technical specifications of <strong>the</strong> particular access technology <strong>the</strong>y use,<br />
but <strong>the</strong> impact that it has on <strong>the</strong> customer’s experience <strong>in</strong> access<strong>in</strong>g <strong>the</strong><br />
applications <strong>the</strong>y wish to use. For example, does <strong>the</strong> customer experience<br />
delays <strong>in</strong> send<strong>in</strong>g an email, or download<strong>in</strong>g content <strong>from</strong> <strong>the</strong> Internet? A delay<br />
of 500 mili-seconds will not be noticed <strong>in</strong> an email transaction, but would be<br />
detrimental for a voice call or gam<strong>in</strong>g experience. Is <strong>the</strong> customer able to use<br />
demand hungry applications such as video stream<strong>in</strong>g, or video conferenc<strong>in</strong>g?<br />
Is <strong>the</strong> quality of Internet based voice or video communications acceptable?<br />
Does <strong>the</strong> customer experience <strong>in</strong>terruptions to <strong>the</strong>ir service, that disrupt <strong>the</strong>ir<br />
use of applications? The impact of high speed broadband on <strong>the</strong> customer<br />
experience <strong>in</strong> terms of speed, reliability, and <strong>the</strong> range of applications <strong>the</strong><br />
customer can use will determ<strong>in</strong>e <strong>the</strong> level of benefit <strong>from</strong> <strong>in</strong>vestment <strong>in</strong> new<br />
<strong>in</strong>frastructure.<br />
Def<strong>in</strong>ition<br />
ADSL<br />
ADSL2+<br />
<strong>Broadband</strong><br />
Asymmetric Digital Subscriber L<strong>in</strong>e is a form of DSL, a data<br />
communications technology that enables broadband service over<br />
copper telephone l<strong>in</strong>es. It does this by utiliz<strong>in</strong>g frequencies that are<br />
not used by a voice telephone call. Because phone l<strong>in</strong>es vary <strong>in</strong><br />
quality and were not orig<strong>in</strong>ally eng<strong>in</strong>eered with DSL <strong>in</strong> m<strong>in</strong>d, it can<br />
generally only be used over short distances, typically less than 4km .<br />
Depend<strong>in</strong>g on <strong>the</strong> particular standard used, ADSL can provide down<br />
load speeds of between 8 Mbps and 12 Mbps, and upload speeds of<br />
up to 1.8 Mbps.<br />
ADSL2+ is a newer, faster, standard of ADSL. ADSL2+ can provide<br />
download speeds of up to 24 Mbps, and upload speeds of up to 1<br />
Mbps.<br />
The term broadband can have different mean<strong>in</strong>gs <strong>in</strong> different<br />
contexts. For <strong>the</strong> purposes of this report, we accept <strong>the</strong> OECD<br />
def<strong>in</strong>ition of broadband, which <strong>in</strong>cludes Internet access services that<br />
provide download speeds greater than 256 kbps to end users.<br />
In <strong>New</strong> Zealand a range of access technologies provide services that<br />
meet this def<strong>in</strong>ition, <strong>in</strong>clud<strong>in</strong>g DSL technologies, HFC and optical<br />
fibre, and a range of wireless services.<br />
1<br />
Some of <strong>the</strong> def<strong>in</strong>itions <strong>in</strong> this glossary draw on material <strong>from</strong> www.wikipedia.org.
DSL<br />
FTTH or FTTP<br />
HDTV<br />
HFC<br />
<strong>High</strong> speed broadband<br />
Internet Protocol (IP)<br />
IPTV<br />
SDTV<br />
VDSL<br />
Digital Subscriber L<strong>in</strong>e is a set of data transmission protocols that<br />
enable delivery of broadband services over exist<strong>in</strong>g copper telephone<br />
l<strong>in</strong>es.<br />
Fibre to <strong>the</strong> home, or fibre to <strong>the</strong> premises. This refers to optical<br />
fibre networks laid to <strong>the</strong> boundary of <strong>the</strong> customer’s premises. Fibre<br />
can deliver broadband services with very high speeds (both upstream<br />
and downstream). The dist<strong>in</strong>ction between fibre to <strong>the</strong> home and<br />
fibre to <strong>the</strong> premises is that <strong>the</strong> latter explicitly <strong>in</strong>cludes bus<strong>in</strong>ess as<br />
well as residential customers (although we use <strong>the</strong> two terms<br />
synonymously <strong>in</strong> this report).<br />
<strong>High</strong> def<strong>in</strong>ition television is a digital television broadcast<strong>in</strong>g system,<br />
which provides much higher resolution (and so better picture quality)<br />
than traditional television systems.<br />
Hybrid Fibre Coax, <strong>the</strong> technology TelstraClear uses to deliver<br />
broadband services <strong>in</strong> Kapiti, Well<strong>in</strong>gton, and Christchurch.<br />
In this report, we use <strong>the</strong> term high speed broadband to encompass a<br />
range of emerg<strong>in</strong>g access technologies that deliver download speeds<br />
of 10Mbps or greater. This <strong>in</strong>cludes VDSL, optical fibre, HFC us<strong>in</strong>g<br />
DOCSIS-2 standard, and fast wireless broadband. Generally, high<br />
speed broadband requires upgrade of <strong>the</strong> f<strong>in</strong>al l<strong>in</strong>k <strong>from</strong> <strong>the</strong><br />
exchange to end users, to provide broadband speeds well <strong>in</strong> excess of<br />
those offered by exist<strong>in</strong>g technologies<br />
Internet protocol is a telecommunications protocol used for<br />
communicat<strong>in</strong>g data across a packet switched network. A key feature<br />
of Internet Protocol is that it breaks a data transmission (for example<br />
a voice signal) <strong>in</strong>to a series of “packets”, each of which can be<br />
transmitted separately over <strong>the</strong> Internet, and reassembles <strong>the</strong>se<br />
packets at <strong>the</strong> transmission’s dest<strong>in</strong>ation. This allows two-way<br />
communication without <strong>the</strong> need for a cont<strong>in</strong>uous open circuit, and<br />
so provides for much more efficient use of exist<strong>in</strong>g networks.<br />
IPTV (Internet Protocol Television) is a system where a digital<br />
television service is delivered us<strong>in</strong>g Internet Protocol, usually over a<br />
broadband connection, <strong>in</strong>stead of through traditional television<br />
broadcast formats.<br />
Standard Def<strong>in</strong>ition television (SDTV) is one of two of <strong>the</strong> new<br />
formats for television broadcasts (<strong>the</strong> o<strong>the</strong>r be<strong>in</strong>g high def<strong>in</strong>ition<br />
television, or HDTV). SDTV is a digital format that provides a high<br />
quality picture, very similar to that of a DVD. SDTV is a lower<br />
resolution picture than HDTV, but provides better image quality<br />
than today's TV screens, as well as stereo sound.<br />
The difference between SDTV and HDTV is that <strong>the</strong> signal on SDTV<br />
is more compressed than that of HDTV. As <strong>the</strong> digital signal is<br />
compressed, broadcasters can transmit five SDTV programs, whereas<br />
HDTV can only broadcast one. The picture def<strong>in</strong>ition of SDTV is<br />
also slightly lower than on HDTV.<br />
VDSL (Very <strong>High</strong> Bitrate DSL) is a DSL technology provid<strong>in</strong>g faster<br />
data transmission over a s<strong>in</strong>gle copper telephone l<strong>in</strong>e. VDSL is<br />
capable of support<strong>in</strong>g high bandwidth applications such as HDTV,
as well as telephone services (Voice over IP) and general Internet<br />
access, over a s<strong>in</strong>gle connection. In <strong>New</strong> Zealand VDSL/VDSL2+<br />
could provide a maximum download speed of as much as 50 Mbps.<br />
VoIP<br />
Voice over Internet Protocol is a protocol for transmitt<strong>in</strong>g voice<br />
signals over <strong>the</strong> Internet. In effect this allows users to make<br />
telephone calls, <strong>from</strong> <strong>the</strong>ir computer or phone, at much lower cost<br />
than traditional telephone services. (The quality of <strong>the</strong> call may also<br />
be lower than traditional circuit-switched phone calls.) Skype is one<br />
example of a VoIP service.
Table of Contents<br />
1 Introduction 1<br />
1.1 Focus of this Report 1<br />
1.2 Outl<strong>in</strong>e of this Report 2<br />
2 <strong>Broadband</strong> is about Access to Applications 4<br />
2.1 An Overview of <strong>the</strong> <strong>Broadband</strong> Supply Cha<strong>in</strong> 4<br />
2.2 <strong>Broadband</strong> Access Technologies 7<br />
2.2.1 The grow<strong>in</strong>g role of wireless <strong>in</strong> provid<strong>in</strong>g high speed<br />
broadband 9<br />
2.2.2 The impact of distance on DSL speeds 10<br />
2.2.3 The role of fibre <strong>in</strong> improv<strong>in</strong>g broadband service<br />
quality 10<br />
2.3 Access to Applications 11<br />
2.3.1 Residential users 12<br />
2.3.2 Bus<strong>in</strong>ess users 13<br />
2.3.3 Sector specific uses: eEducation and eHealth 13<br />
2.3.4 Applications and broadband speed requirements 14<br />
2.3.5 Applications: The future 17<br />
2.4 Conclusion 18<br />
3 Private Benefits of <strong>Broadband</strong>: Will<strong>in</strong>gness to Pay 19<br />
3.1 International Comparison of <strong>New</strong> Zealand <strong>Broadband</strong> Take<br />
Up 20<br />
3.1.1 Impact of <strong>the</strong> Telecommunications Service<br />
Obligation 21<br />
3.2 Trends <strong>in</strong> Internet Access <strong>in</strong> <strong>New</strong> Zealand 22<br />
3.2.1 Residential broadband usage 23<br />
3.2.2 Bus<strong>in</strong>ess broadband usage 23<br />
3.3 Revealed Demand for Applications—Take Up of <strong>Broadband</strong><br />
Packages 23<br />
3.3.1 Demand for access speeds 24<br />
3.3.2 Demand for data 25<br />
3.3.3 Demand for applications 27<br />
3.4 Regional Differences 30<br />
3.5 Conclusions on Will<strong>in</strong>gness to Pay 32<br />
4 The Counterfactual: What <strong>the</strong> Market will Provide 35<br />
4.1 Investment Plans of Service Providers 35
4.2 Projected Demand for Internet Based Applications 38<br />
4.3 What Users are Likely to Get under <strong>the</strong> Counterfactual 38<br />
5 Incremental Benefits and Costs of Subsidis<strong>in</strong>g <strong>Broadband</strong> 40<br />
5.1 Proposed <strong>Broadband</strong> Policy: Wide Scale Roll-out of Fibre to<br />
<strong>the</strong> Premises 40<br />
5.2 Compar<strong>in</strong>g Access to Applications under <strong>the</strong> Government’s<br />
Proposed Policy to <strong>the</strong> Counterfactual 41<br />
5.3 Review of Benefits <strong>from</strong> <strong>the</strong> <strong>New</strong> Zealand Institute Analysis 41<br />
5.3.1 Conclusion on <strong>in</strong>cremental benefits 45<br />
5.4 Incremental Costs of Policy Factual 46<br />
5.4.1 Costs for users and companies 46<br />
5.4.2 Wider economic costs 46<br />
5.4.3 Incremental costs of <strong>the</strong> Policy Factual 47<br />
5.5 Comparison of Costs and Benefits 50<br />
5.6 Policy Conclusions 54<br />
6 Structur<strong>in</strong>g Public Investment <strong>in</strong> <strong>Broadband</strong> 56<br />
6.1 Subsidies and Match<strong>in</strong>g Policy Objectives 56<br />
6.1.1 Understand<strong>in</strong>g what should be subsidised 58<br />
6.1.2 Fibre <strong>in</strong> <strong>New</strong> Zealand 60<br />
6.2 Public Investment Options 61<br />
6.3 Unit Subsidy 64<br />
6.3.1 The role of transitional subsidies 65<br />
6.4 Conclusions and Next Steps 65<br />
Appendices<br />
Appendix A : International Trends <strong>in</strong> Fast <strong>Broadband</strong> Deployment 67<br />
Appendix B : Understand<strong>in</strong>g <strong>the</strong> Benefits and Costs <strong>from</strong> Public<br />
Investment <strong>in</strong> <strong>High</strong> <strong>Speed</strong> <strong>Broadband</strong> 71<br />
Tables<br />
Table 2.1: <strong>Broadband</strong> Access Technology <strong>Speed</strong>s 9<br />
Table 3.1: Percentage of Bus<strong>in</strong>esses with <strong>Broadband</strong> Connections, by<br />
Size (2006) 23<br />
Table 3.2: Use of Applications and Implications for Access<br />
Requirements 28<br />
Table 5.1: Public Investment <strong>in</strong> <strong>High</strong> <strong>Speed</strong> <strong>Broadband</strong> 40
Table 5.2: Estimated Annual Incremental Benefits <strong>from</strong> FTTH by<br />
Type of Use 42<br />
Table 5.3: Components of Cost of Deliver<strong>in</strong>g FTTH 48<br />
Table 5.4: Cost of Upgrad<strong>in</strong>g Internal House Wir<strong>in</strong>g and Equipment 49<br />
Table 5.5: Costs and Benefits of <strong>Broadband</strong> Scenarios—Summary 51<br />
Table 6.1: What do Policy Makers <strong>in</strong> <strong>New</strong> Zealand Perceive as <strong>the</strong><br />
Problem? 57<br />
Table 6.2: Comparison of Subsidy Options 63<br />
Table 6.3: Practical Examples of Subsidy Options 63<br />
Figures<br />
Figure 2.1: Overview of <strong>the</strong> <strong>Broadband</strong> Supply Cha<strong>in</strong> 5<br />
Figure 2.2: Impact of Distance on Service (DSL Access Technologies) 10<br />
Figure 2.3: Delivery Architecture for Major <strong>Broadband</strong> Alternatives 11<br />
Figure 2.4: Applications and Download <strong>Speed</strong> Requirements—<br />
Residential 15<br />
Figure 2.5: Applications and Download <strong>Speed</strong> Requirements—<br />
Bus<strong>in</strong>ess 16<br />
Figure 3.1: <strong>Broadband</strong> Subscribers per 100 Inhabitants (June 2008) 20<br />
Figure 3.2: <strong>Broadband</strong> Subscribers per 100 Inhabitants by GDP, June<br />
2008 21<br />
Figure 3.3: Internet Subscriptions by Connection Type (March 2006–<br />
March 2008) 22<br />
Figure 3.4: <strong>Broadband</strong> Subscribers by Size of Data Cap 26<br />
Figure 3.5: <strong>Broadband</strong> Take Up by Region, 2006 30<br />
Figure 3.6: Variation <strong>in</strong> Take Up between Urban and Rural 31<br />
Figure 3.7: Reasons Given for No <strong>Broadband</strong> 32<br />
Figure 3.8: Will<strong>in</strong>gness to Pay for Fibre to <strong>the</strong> Home 33<br />
Figure 4.1: Chorus Fibre to <strong>the</strong> Cab<strong>in</strong>et Solution 35<br />
Figure 4.2: Development of <strong>the</strong> Counterfactual on <strong>the</strong> Supply Cha<strong>in</strong> 39<br />
Figure 5.1: Depiction of an FTTH Network 47<br />
Figure 2: Topp<strong>in</strong>g Up 57<br />
Figure 6.3: Public Investment Options 62<br />
Figure 6.4: Transitional Subsidy 65
Boxes<br />
Box 3.1: Take up of <strong>High</strong> <strong>Speed</strong> <strong>Broadband</strong> <strong>in</strong> O<strong>the</strong>r Countries 26<br />
Box 4.1: Telecom’s <strong>Broadband</strong> Download Service Targets Follow<strong>in</strong>g<br />
Cab<strong>in</strong>etisation 36
Executive Summary<br />
The Government has focused its policy agenda on deliver<strong>in</strong>g a stronger economy and<br />
higher wages for <strong>New</strong> Zealanders. Better broadband for <strong>New</strong> Zealand is a core<br />
component of this agenda.<br />
The Government’s objective is to enable at least 75 percent of <strong>the</strong> population to access<br />
high speed broadband—enabl<strong>in</strong>g <strong>New</strong> Zealand to jo<strong>in</strong> o<strong>the</strong>r lead<strong>in</strong>g economies <strong>in</strong> <strong>the</strong><br />
top half of <strong>the</strong> OECD.<br />
This report is about support<strong>in</strong>g <strong>the</strong> Government <strong>in</strong> achiev<strong>in</strong>g this aim.<br />
For a small economy <strong>New</strong> Zealand has a vibrant <strong>in</strong>formation technology <strong>in</strong>dustry, and<br />
considerable private <strong>in</strong>vestment is under way to improve <strong>the</strong> exist<strong>in</strong>g broadband<br />
<strong>in</strong>frastructure. Our analysis shows that already committed <strong>in</strong>vestment programs by <strong>the</strong><br />
major <strong>in</strong>frastructure providers will deliver high speed broadband services, capable of<br />
download speeds rang<strong>in</strong>g between 10 Mbps and 20 Mbps, to at least 80 percent of <strong>New</strong><br />
Zealanders with<strong>in</strong> <strong>the</strong> next few years. Considerable fur<strong>the</strong>r work is needed to identify <strong>the</strong><br />
true costs of extend<strong>in</strong>g <strong>the</strong>se planned <strong>in</strong>vestments, to deliver a complete fibre network to<br />
<strong>the</strong> majority of <strong>New</strong> Zealanders.<br />
For <strong>New</strong> Zealand consumers to ga<strong>in</strong> substantial benefits <strong>from</strong> fibre to <strong>the</strong> home, <strong>the</strong>y<br />
must be will<strong>in</strong>g to pay access prices that reflect <strong>the</strong> cost of roll<strong>in</strong>g out fibre to <strong>the</strong> home,<br />
and <strong>in</strong> many cases will have to <strong>in</strong>vest <strong>in</strong> upgrades to <strong>the</strong>ir home wir<strong>in</strong>g and equipment.<br />
Available data shows that most broadband users are not currently will<strong>in</strong>g to pay even for<br />
<strong>the</strong> faster broadband packages that are available now. There is considerable uncerta<strong>in</strong>ty<br />
about how much demand for high speed broadband <strong>the</strong>re will be <strong>in</strong> <strong>the</strong> future, and when<br />
this will emerge. This uncerta<strong>in</strong>ty is beh<strong>in</strong>d <strong>the</strong> current, low, level of <strong>in</strong>vestment <strong>in</strong> fibre<br />
to <strong>the</strong> home.<br />
The Government’s <strong>in</strong>itiative to subsidise, or stimulate, <strong>the</strong> drive for fibre to <strong>the</strong> home is<br />
<strong>in</strong> itself a clear signal that such a roll-out will not occur on a purely commercial basis for<br />
some time to come. The Government is <strong>the</strong>refore consider<strong>in</strong>g a range of <strong>in</strong>terventions to<br />
promote greater use of fast broadband.<br />
This report provides a framework for exam<strong>in</strong><strong>in</strong>g various <strong>in</strong>tervention options that will<br />
deliver <strong>the</strong> best outcomes for <strong>New</strong> Zealanders. The framework is based on:<br />
• Develop<strong>in</strong>g a thorough understand<strong>in</strong>g of <strong>the</strong> “supply cha<strong>in</strong>” <strong>from</strong> <strong>the</strong><br />
suppliers of broadband applications to users, and of <strong>the</strong> costs and constra<strong>in</strong>ts<br />
that impact on our utilisation of exist<strong>in</strong>g and emerg<strong>in</strong>g Internet applications. If<br />
<strong>New</strong> Zealand is to realise <strong>the</strong> desired benefits <strong>from</strong> high speed broadband, we<br />
must take an end-to-end view of <strong>the</strong> supply of broadband services, and not<br />
focus solely on <strong>the</strong> “last mile” <strong>in</strong>frastructure. There is little to be ga<strong>in</strong>ed <strong>from</strong><br />
<strong>in</strong>vest<strong>in</strong>g <strong>in</strong> a world class local access service, if constra<strong>in</strong>ts elsewhere <strong>in</strong> <strong>the</strong><br />
supply cha<strong>in</strong> prevent end users <strong>from</strong> see<strong>in</strong>g <strong>the</strong> benefits of that <strong>in</strong>vestment<br />
• Develop<strong>in</strong>g a clear view on <strong>the</strong> exist<strong>in</strong>g and emerg<strong>in</strong>g Internet applications,<br />
and <strong>the</strong> broadband technologies which are able to support those applications.<br />
We emphasise that broadband is only valuable because of <strong>the</strong> applications it<br />
allows users to access, and <strong>the</strong> quality of user experience it delivers. Hence, to<br />
assess any policy <strong>in</strong>tervention, we need to understand how that <strong>in</strong>tervention<br />
would alter <strong>the</strong> range of applications that customers use, and how <strong>the</strong>se<br />
applications are used. Our analysis shows that most exist<strong>in</strong>g and emerg<strong>in</strong>g<br />
i
applications would not require <strong>the</strong> speed and consistency made possible by<br />
fibre to <strong>the</strong> premises<br />
• Develop<strong>in</strong>g a thorough understand<strong>in</strong>g of <strong>the</strong> market counterfactual: <strong>the</strong> level<br />
of <strong>in</strong>vestment <strong>in</strong> different k<strong>in</strong>ds of broadband <strong>in</strong>frastructure which would take<br />
place on <strong>the</strong> commercial basis, without any fur<strong>the</strong>r government <strong>in</strong>tervention.<br />
A key challenge for <strong>the</strong> Government will be to ensure that policies to<br />
encourage high speed broadband do not displace private <strong>in</strong>vestment <strong>in</strong><br />
improved services, but <strong>in</strong>stead build on exist<strong>in</strong>g and planned <strong>in</strong>vestments.<br />
Overall, we conclude that follow<strong>in</strong>g <strong>the</strong> considerable improvements already be<strong>in</strong>g<br />
undertaken <strong>the</strong> widespread roll-out of fibre to <strong>the</strong> home would deliver only a small<br />
improvement <strong>in</strong> <strong>New</strong> Zealanders’ ability to use <strong>the</strong> exist<strong>in</strong>g and emerg<strong>in</strong>g Internet<br />
applications over <strong>the</strong> market counterfactual. It is clear that most mass market<br />
applications which do not require consumers to <strong>in</strong>vest <strong>in</strong> very high cost specialist user<br />
equipment also do not require <strong>the</strong> very high speeds supported by fibre to <strong>the</strong> premises.<br />
This is consistent with <strong>the</strong> market reality of <strong>New</strong> Zealanders’ low demonstrated<br />
will<strong>in</strong>gness to pay for additional speed and reliability.<br />
Our analysis of <strong>the</strong> speeds required by consumer applications suggests that <strong>the</strong> costs of a<br />
policy which immediately subsidises a widespread roll-out of fibre to <strong>the</strong> home would<br />
likely exceed its benefits. Instead, much of <strong>the</strong> economic benefit attributed to fibre to <strong>the</strong><br />
premises could be captured through targeted deployment of fibre to bus<strong>in</strong>esses, schools,<br />
and hospitals ra<strong>the</strong>r than through a full deployment of FTTH to retail users.<br />
This does not mean that <strong>the</strong>re is noth<strong>in</strong>g <strong>the</strong> Government can do to help <strong>New</strong><br />
Zealanders get <strong>the</strong> most benefit <strong>from</strong> high speed broadband, or that Government<br />
support for fibre to <strong>the</strong> home may not be appropriate at some time <strong>in</strong> <strong>the</strong> future. Ra<strong>the</strong>r,<br />
our analysis leads us to suggest a flexible approach to develop<strong>in</strong>g a long-term partnership<br />
between <strong>the</strong> <strong>in</strong>dustry and <strong>the</strong> Government, with Government <strong>in</strong>vestment targeted to<br />
those areas <strong>the</strong> market will not address. We believe this approach will achieve <strong>the</strong> desired<br />
productivity and social outcomes <strong>in</strong> <strong>the</strong> most cost effective manner.<br />
In particular, while <strong>the</strong> market will deliver high speed broadband access to most <strong>New</strong><br />
Zealanders, <strong>the</strong>re are some key problems that <strong>the</strong> market will not address. These <strong>in</strong>clude:<br />
• Low will<strong>in</strong>gness to pay for high speed broadband, and uncerta<strong>in</strong>ty around<br />
how this will evolve<br />
• User equipment and wir<strong>in</strong>g, which may significantly constra<strong>in</strong> <strong>the</strong> quality of<br />
service users are able to experience<br />
• The cost of <strong>in</strong>ternational data capacity and “peer<strong>in</strong>g” is higher than many <strong>New</strong><br />
Zealanders are will<strong>in</strong>g to pay. The cost of <strong>in</strong>ternational capacity will need to<br />
come down (or will<strong>in</strong>gness to pay for high speed data transmissions <strong>in</strong>crease)<br />
for <strong>New</strong> Zealand to obta<strong>in</strong> many of <strong>the</strong> potential benefits <strong>from</strong> high speed<br />
broadband, and<br />
• Cont<strong>in</strong>u<strong>in</strong>g slow service for rural users. Current private <strong>in</strong>vestment plans will<br />
still leave around 20 percent of users—<strong>in</strong> rural and prov<strong>in</strong>cial parts of <strong>the</strong><br />
country—unable to access high speed broadband.<br />
Some form of public-private partnership is required whenever a government wants <strong>the</strong><br />
<strong>in</strong>dustry to deliver services or <strong>in</strong>vestments which are not commercially viable, but which<br />
<strong>the</strong> government believes to have a greater social value than <strong>in</strong>dicated by consumers’<br />
private will<strong>in</strong>gness to pay. The challenge for <strong>the</strong> Government is to structure a publicprivate<br />
partnership which builds on commercial <strong>in</strong>centives fac<strong>in</strong>g <strong>the</strong> private sector, on<br />
ii
changes <strong>in</strong> technologies and demand patterns, and on <strong>New</strong> Zealanders’ evolv<strong>in</strong>g ability<br />
and will<strong>in</strong>gness to pay, <strong>in</strong> a way which delivers <strong>the</strong> best outcomes <strong>from</strong> <strong>the</strong><br />
Government’s contribution to <strong>the</strong> partnership.<br />
The research undertaken for this paper leads us to <strong>the</strong> view that <strong>the</strong>re is no s<strong>in</strong>gle silver<br />
bullet to ensure that high speed broadband makes <strong>the</strong> maximum contribution to <strong>New</strong><br />
Zealand’s productivity. The detailed design of any subsidy programme will depend on <strong>the</strong><br />
specific objectives <strong>the</strong> Government <strong>in</strong>tends to achieve. More work is needed to clearly<br />
formulate detailed objectives for Government <strong>in</strong>tervention <strong>in</strong> <strong>the</strong> supply of broadband,<br />
given <strong>the</strong> grow<strong>in</strong>g understand<strong>in</strong>g of <strong>the</strong> end-to-end supply cha<strong>in</strong>. For example, <strong>the</strong><br />
greatest <strong>in</strong>itial uplift <strong>in</strong> productivity could come <strong>from</strong> build<strong>in</strong>g on current broadband<br />
<strong>in</strong>frastructure improvement programs to help<strong>in</strong>g low <strong>in</strong>come urban residents take<br />
advantage of <strong>the</strong> exist<strong>in</strong>g broadband <strong>in</strong>frastructure, before devot<strong>in</strong>g public resources to<br />
<strong>in</strong>vestment <strong>in</strong> additional <strong>in</strong>frastructure.<br />
Any future partnership between <strong>the</strong> Government and <strong>the</strong> <strong>in</strong>dustry will need to clearly<br />
def<strong>in</strong>e <strong>the</strong> services to be provided and <strong>the</strong> key standards of performance. The approach<br />
that is adopted will have important consequences for <strong>the</strong> costs of <strong>the</strong> scheme, <strong>the</strong><br />
<strong>in</strong>centives faced by service providers, and <strong>the</strong> strategy for monitor<strong>in</strong>g and verify<strong>in</strong>g<br />
performance. The partnership will also need to be structured <strong>in</strong> a way that m<strong>in</strong>imises<br />
governance risks, and ensures that subsidies do not become unnecessarily entrenched.<br />
We recommend that <strong>the</strong> Government and <strong>the</strong> <strong>in</strong>dustry work toge<strong>the</strong>r to address <strong>the</strong>se<br />
questions, and to lay <strong>the</strong> foundations for an effective partnership that will deliver <strong>the</strong> best<br />
outcome for <strong>New</strong> Zealand.<br />
iii
1 Introduction<br />
The Government is look<strong>in</strong>g to achieve a “step change” to significantly <strong>in</strong>crease <strong>New</strong><br />
Zealand’s productivity, lead<strong>in</strong>g to a stronger economy and higher wages. Market<br />
commentators widely view high speed broadband as an enabl<strong>in</strong>g technology with <strong>the</strong><br />
potential to make <strong>New</strong> Zealand more productive. It is not difficult to imag<strong>in</strong>e that, if<br />
most of us had ready access to very fast data transfers, our economy and community<br />
could be transformed.<br />
Previous studies have argued that widespread deployment of high speed broadband<br />
would deliver significant economic benefits for <strong>New</strong> Zealand. For example, a recent<br />
study by <strong>the</strong> <strong>New</strong> Zealand Institute estimated that <strong>the</strong> economic benefits <strong>from</strong><br />
widespread access to fast broadband would be <strong>in</strong> <strong>the</strong> range of $2.7 to $4.4 billion per<br />
annum. These benefits derive <strong>from</strong> a comb<strong>in</strong>ation of cost sav<strong>in</strong>gs, productivity<br />
improvements and access to new opportunities.<br />
Fibre to <strong>the</strong> home is often regarded as <strong>the</strong> best available technology for deliver<strong>in</strong>g<br />
reliable, fast broadband. For this reason, <strong>the</strong> economic benefits of widespread access to<br />
fast broadband are commonly identified with <strong>the</strong> roll-out of fibre to most homes <strong>in</strong> <strong>New</strong><br />
Zealand.<br />
At <strong>the</strong> same time, it is clear that users are not yet prepared to pay for <strong>the</strong> roll-out of fibre<br />
to <strong>the</strong> home—if <strong>the</strong>y were, <strong>the</strong>re is little doubt that <strong>New</strong> Zealand’s <strong>in</strong>formation<br />
technology sector would have responded to <strong>the</strong> profit opportunities. Where users are<br />
prepared to pay, <strong>the</strong> private sector is deliver<strong>in</strong>g considerable <strong>in</strong>vestment <strong>in</strong> extend<strong>in</strong>g and<br />
improv<strong>in</strong>g broadband services to <strong>New</strong> Zealanders. For example, it is worth not<strong>in</strong>g that<br />
<strong>New</strong> Zealand is close to complet<strong>in</strong>g <strong>the</strong> fibre to <strong>the</strong> node roll-out on a purely commercial<br />
basis, while <strong>the</strong> Australian Government is <strong>in</strong> <strong>the</strong> early stages of procur<strong>in</strong>g such a roll-out<br />
through a massive subsidy program.<br />
The Government has <strong>in</strong>dicated its <strong>in</strong>tention to promote <strong>the</strong> use of fast broadband <strong>in</strong><br />
<strong>New</strong> Zealand. In particular, it has proposed to subsidise <strong>in</strong>vestment <strong>in</strong> fibre to <strong>the</strong> home.<br />
1.1 Focus of this Report<br />
<strong>Castalia</strong> was jo<strong>in</strong>tly commissioned by Telecom, TelstraClear, and Vodafone to consider<br />
policy options for achiev<strong>in</strong>g <strong>the</strong> Government’s objective of rais<strong>in</strong>g productivity through<br />
greater use of fast broadband <strong>in</strong> <strong>New</strong> Zealand. The objective of this report is to<br />
contribute to <strong>the</strong> formulation of detailed policies <strong>in</strong> this area. In particular, we were asked<br />
to consider what can be done to achieve a genu<strong>in</strong>e partnership between <strong>the</strong> Government<br />
and <strong>the</strong> private sector.<br />
Some form of public-private partnership is required whenever a Government wants <strong>the</strong><br />
<strong>in</strong>dustry to deliver services or <strong>in</strong>vestments which are not commercially viable, but which<br />
<strong>the</strong> Government believes to have a greater social value than <strong>in</strong>dicated by consumers’<br />
private will<strong>in</strong>gness to pay. However, <strong>the</strong> devil <strong>in</strong> such partnerships is <strong>in</strong> <strong>the</strong> detail. The<br />
challenge is particularly great when <strong>the</strong> partnership <strong>in</strong>volves long-lived <strong>in</strong>vestment, such<br />
as fibre to <strong>the</strong> premises. In decid<strong>in</strong>g how to structure <strong>the</strong> partnership and what its<br />
contribution should be, <strong>the</strong> Government needs to consider:<br />
• The tim<strong>in</strong>g of <strong>in</strong>vestment. The more <strong>the</strong> publicly-supported <strong>in</strong>vestment<br />
runs ahead of consumer needs, <strong>the</strong> more <strong>the</strong> Government will end up pay<strong>in</strong>g<br />
for <strong>the</strong> same results<br />
• Technology risks. By support<strong>in</strong>g any particular type of <strong>in</strong>vestment, <strong>the</strong><br />
Government would <strong>in</strong>evitably be crowd<strong>in</strong>g out private <strong>in</strong>vestments <strong>in</strong><br />
1
compet<strong>in</strong>g technologies. The public-private partnership needs to be explicitly<br />
structured to m<strong>in</strong>imise this risk<br />
• Trade-off between new <strong>in</strong>vestment and better utilisation of <strong>the</strong> exist<strong>in</strong>g<br />
<strong>in</strong>frastructure. At present, many <strong>New</strong> Zealanders who have physical access<br />
to fast broadband technologies ei<strong>the</strong>r cannot afford or see little value <strong>in</strong><br />
utilis<strong>in</strong>g those technologies. This lack of take-up would not be fixed through a<br />
roll-out of a better <strong>in</strong>frastructure.<br />
Overall, a well-designed public-private partnership would build on, ra<strong>the</strong>r than distort,<br />
<strong>the</strong> <strong>in</strong>dustry’s commercial responses to consumer needs, and would aim to achieve <strong>the</strong><br />
greatest social benefit for <strong>the</strong> least fiscal cost.<br />
For this reason, <strong>the</strong> analysis <strong>in</strong> this report focuses on develop<strong>in</strong>g a clear understand<strong>in</strong>g of<br />
what <strong>the</strong> market will be deliver<strong>in</strong>g <strong>in</strong> <strong>the</strong> absence of any Government <strong>in</strong>tervention, and<br />
how <strong>the</strong> outcomes <strong>from</strong> possible <strong>in</strong>terventions would differ <strong>from</strong> <strong>the</strong> market outcomes.<br />
The <strong>in</strong>dustry <strong>in</strong> <strong>New</strong> Zealand is mak<strong>in</strong>g significant <strong>in</strong>vestments <strong>in</strong> broadband<br />
<strong>in</strong>frastructure, which will deliver large ga<strong>in</strong>s <strong>in</strong> service quality and create new<br />
opportunities for users over <strong>the</strong> next few years. Added to this, improvements <strong>in</strong><br />
compression technologies mean that exist<strong>in</strong>g access networks will be able to deliver a<br />
much wider range of applications, more quickly, than is currently <strong>the</strong> case.<br />
To be able to analyse <strong>the</strong> <strong>in</strong>cremental costs and benefits of possible Government<br />
<strong>in</strong>terventions, we:<br />
• Develop a detailed picture of Internet applications which consumers use now,<br />
or may use <strong>in</strong> <strong>the</strong> foreseeable future, and establish which broadband<br />
technologies are required to support those applications<br />
• Review <strong>the</strong> <strong>in</strong>vestment programs of <strong>the</strong> market participants to establish what<br />
will be happen<strong>in</strong>g to <strong>the</strong> consumers’ ability to use various current and<br />
emerg<strong>in</strong>g applications over <strong>the</strong> next few years. This review is based on <strong>the</strong><br />
committed <strong>in</strong>vestment programs currently under way<br />
• Compare <strong>the</strong> consumers’ ability to use various applications under <strong>the</strong> market<br />
counterfactual with <strong>the</strong>ir ability to use <strong>the</strong>se applications under various policy<br />
<strong>in</strong>tervention options.<br />
1.2 Outl<strong>in</strong>e of this Report<br />
The rema<strong>in</strong>der of this report is structured as follows:<br />
• In <strong>the</strong> follow<strong>in</strong>g section we provide an overview of <strong>the</strong> broadband<br />
technologies that are currently available, or are likely to become available <strong>in</strong><br />
<strong>the</strong> foreseeable future<br />
• Section 3 reviews available data on <strong>New</strong> Zealanders’ take up and use of<br />
Internet access, and broadband <strong>in</strong> particular. Based on <strong>the</strong> available data we<br />
draw conclusions on users’ will<strong>in</strong>gness to pay for high speed broadband,<br />
which <strong>in</strong> turn tells us how users value <strong>the</strong> private benefits to <strong>the</strong>m <strong>from</strong> high<br />
speed broadband<br />
• In section 4 we describe <strong>the</strong> counterfactual. We base our counterfactual on <strong>the</strong><br />
extent and type of broadband services that are likely to be available to users<br />
five years <strong>from</strong> now, draw<strong>in</strong>g on known <strong>in</strong>vestment plans of <strong>New</strong> Zealand’s<br />
large telecommunications service providers<br />
2
• Section 5 describes <strong>the</strong> “factual” of government <strong>in</strong>tervention. This section<br />
focuses on <strong>the</strong> proposal to subsidise <strong>the</strong> roll-out of fibre to 75 percent of<br />
homes <strong>in</strong> <strong>New</strong> Zealand. In this section we assess <strong>the</strong> <strong>in</strong>cremental costs and<br />
benefits of this factual compared to <strong>the</strong> counterfactual, and identify<br />
opportunities to enhance <strong>the</strong> net ga<strong>in</strong>s <strong>from</strong> <strong>in</strong>tervention<br />
• In Section 6 we discuss how best to deliver a government subsidy for fast<br />
broadband, draw<strong>in</strong>g on <strong>in</strong>ternational lessons <strong>from</strong> public-private partnerships.<br />
We identify key questions <strong>the</strong> government would need to answer <strong>in</strong> order to<br />
design an effective subsidy for high speed broadband.<br />
3
2 <strong>Broadband</strong> is about Access to Applications<br />
Ultimately, any discussion about <strong>the</strong> economic effects of broadband <strong>in</strong>frastructure<br />
<strong>in</strong>vestments is about users’ ability to access applications, and <strong>the</strong> quality of <strong>the</strong>ir<br />
experience <strong>in</strong> do<strong>in</strong>g so. This concept underp<strong>in</strong>s our analysis: consumers do not care<br />
about how <strong>the</strong> network is configured, which technology is used, or about what else <strong>the</strong><br />
technology can do, as long as <strong>the</strong>y can use all <strong>the</strong> applications <strong>the</strong>y want at <strong>the</strong> level of<br />
reliability <strong>the</strong>y prefer.<br />
In this section we:<br />
• Provide an overview of <strong>the</strong> various elements <strong>in</strong>volved <strong>in</strong> deliver<strong>in</strong>g Internet<br />
applications to end users, of which <strong>the</strong> access network is just one component<br />
• Review <strong>the</strong> broadband access technologies available <strong>in</strong> <strong>New</strong> Zealand now, and<br />
<strong>the</strong> <strong>in</strong>creas<strong>in</strong>g role that wireless technologies will play <strong>in</strong> <strong>the</strong> future,<br />
highlight<strong>in</strong>g <strong>the</strong> download and upload speeds that are currently be<strong>in</strong>g achieved<br />
<strong>in</strong> <strong>New</strong> Zealand, and<br />
• Discuss what various access technologies mean for <strong>the</strong> Internet applications<br />
used by households and bus<strong>in</strong>esses.<br />
2.1 An Overview of <strong>the</strong> <strong>Broadband</strong> Supply Cha<strong>in</strong><br />
Telecommunications networks are, <strong>in</strong> effect, a transport network for voice and data<br />
services. Suppliers of a wide range of applications use <strong>the</strong>se networks to deliver <strong>the</strong>ir<br />
services to users. The quality of service experienced by users depends not only on <strong>the</strong><br />
network itself, but on <strong>the</strong> technical characteristics of <strong>the</strong> application be<strong>in</strong>g supplied at <strong>the</strong><br />
supplier’s end, and of <strong>the</strong> user’s wir<strong>in</strong>g and equipment at <strong>the</strong> customer end. In addition,<br />
<strong>the</strong> transport network itself comprises a number of components.<br />
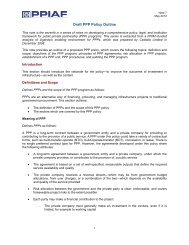
Figure 2.1 provides a simplified view of this “broadband supply cha<strong>in</strong>”. The figure is<br />
based on <strong>the</strong> network structure for an <strong>in</strong>cumbent telecommunications provider, which<br />
supplies broadband us<strong>in</strong>g a DSL access technology. Clearly <strong>the</strong> specific network<br />
components of <strong>the</strong> supply cha<strong>in</strong> will vary across different types of provider and different<br />
network technologies, particularly <strong>in</strong> <strong>the</strong> local access network, but <strong>the</strong> ma<strong>in</strong> elements are<br />
generally <strong>the</strong> same.<br />
4
Figure 2.1: Overview of <strong>the</strong> <strong>Broadband</strong> Supply Cha<strong>in</strong><br />
Modem<br />
Local IP<br />
cloud<br />
International<br />
gateway<br />
International<br />
backhaul<br />
Local<br />
backhaul<br />
Core<br />
network<br />
Customer<br />
equipment<br />
Internal<br />
wir<strong>in</strong>g<br />
Key:<br />
Optical fibre<br />
Street<br />
cab<strong>in</strong>et<br />
Local access<br />
network<br />
Copper<br />
Internal wir<strong>in</strong>g<br />
“Last mile”<br />
Problems <strong>in</strong> any s<strong>in</strong>gle element of <strong>the</strong> cha<strong>in</strong>, or <strong>in</strong> <strong>the</strong> way <strong>the</strong>y <strong>in</strong>terconnect to deliver<br />
services, can compromise <strong>the</strong> quality of service customers experience <strong>in</strong> access<strong>in</strong>g and<br />
us<strong>in</strong>g Internet applications. The policy debate about <strong>in</strong>vestment <strong>in</strong> fibre to <strong>the</strong> home has<br />
focused on <strong>the</strong> bottlenecks created by <strong>the</strong> “last mile” part of <strong>the</strong> supply cha<strong>in</strong>. In reality,<br />
<strong>the</strong>re are o<strong>the</strong>r constra<strong>in</strong>ts <strong>in</strong> <strong>the</strong> supply cha<strong>in</strong>, which may have an even greater effect on<br />
customer experience. The k<strong>in</strong>ds of improvements <strong>in</strong> customer experience which would<br />
be needed to achieve <strong>the</strong> desired <strong>in</strong>crease <strong>in</strong> <strong>New</strong> Zealand’s productivity growth will<br />
require a broader focus on constra<strong>in</strong>ts across <strong>the</strong> whole supply cha<strong>in</strong>. The Government<br />
and <strong>the</strong> <strong>in</strong>dustry will need to work toge<strong>the</strong>r to address <strong>the</strong>se constra<strong>in</strong>ts.<br />
Customer end hardware<br />
The hardware through which users access <strong>the</strong> Internet affects <strong>the</strong> quality <strong>the</strong>y experience<br />
<strong>in</strong> us<strong>in</strong>g Internet applications. The follow<strong>in</strong>g elements are particularly important at <strong>the</strong><br />
customer end:<br />
• Users’ equipment—computers or o<strong>the</strong>r equipment such as games consoles<br />
and televisions: <strong>Most</strong> new computers should be able to keep up with <strong>the</strong> very<br />
fast connection speeds fibre to <strong>the</strong> home would provide, although this does<br />
depend on <strong>the</strong> type of application. 2 Computers more than two to three years<br />
old may have a problem deliver<strong>in</strong>g Internet applications at <strong>the</strong>se speeds. <strong>New</strong><br />
Zealand’s stock of computers is relatively old, and it is unlikely that<br />
improvements <strong>in</strong> customer experience of broadband can be achieved without<br />
a significant updat<strong>in</strong>g of <strong>the</strong> national computer “fleet”<br />
2<br />
For video applications, such as IP television or video stream<strong>in</strong>g, <strong>the</strong> ma<strong>in</strong> constra<strong>in</strong>t for computers currently on <strong>the</strong><br />
market is <strong>the</strong> speed of <strong>the</strong> video card. Many new computers are configured to provide a high resolution picture.<br />
Some video cards are not fast enough to display high resolution video pictures and give a smooth view<strong>in</strong>g<br />
experience. Users can fix this by simply chang<strong>in</strong>g <strong>the</strong> computer’s display sett<strong>in</strong>gs to a lower resolution. In many<br />
cases this will not reduce <strong>the</strong> quality of <strong>the</strong> users experience, as most video content currently available is not high<br />
def<strong>in</strong>ition.<br />
5
• Internal wir<strong>in</strong>g (or wireless access), <strong>from</strong> <strong>the</strong> po<strong>in</strong>t of connection with <strong>the</strong><br />
broadband provider’s network to <strong>the</strong> user’s equipment: The <strong>in</strong>ternal wir<strong>in</strong>g <strong>in</strong><br />
most <strong>New</strong> Zealand houses uses copper wires, designed for voice telephony,<br />
which will cont<strong>in</strong>ue to limit <strong>the</strong> speeds users experience, even with fibre to <strong>the</strong><br />
home. Wireless access po<strong>in</strong>ts or modems can provide much faster speeds<br />
with<strong>in</strong> <strong>the</strong> home than copper wires, but will <strong>the</strong>mselves have an upper limit. 3<br />
Interference <strong>from</strong> o<strong>the</strong>r sources, as well as relative position<strong>in</strong>g with<strong>in</strong> <strong>the</strong><br />
home, can reduce <strong>the</strong> quality of service provided by wireless networks below<br />
<strong>the</strong>ir <strong>the</strong>oretical maximum.<br />
The local access network<br />
The speed and quality of service <strong>the</strong> local access network provides—<strong>from</strong> <strong>the</strong> local<br />
exchange to <strong>the</strong> customer’s premises—depends on <strong>the</strong> access technology <strong>in</strong> use<br />
(discussed <strong>in</strong> more detail <strong>in</strong> section 2.2 below).<br />
Backhaul and <strong>the</strong> core network<br />
Local backhaul and <strong>the</strong> core network were designed to support <strong>the</strong> pattern of use typical<br />
of web brows<strong>in</strong>g, that is a short burst of data flow<strong>in</strong>g primarily <strong>in</strong> one direction, or<br />
cont<strong>in</strong>ued stream<strong>in</strong>g of relatively narrow band applications. They were not designed to<br />
cope with many users simultaneously access<strong>in</strong>g susta<strong>in</strong>ed bandwidth-hungry services,<br />
such as video-on-demand. Backhaul is generally scalable, but any plans for deploy<strong>in</strong>g fast<br />
broadband will need to account for <strong>the</strong> costs of <strong>in</strong>creas<strong>in</strong>g backhaul and core capacity.<br />
International peer<strong>in</strong>g<br />
<strong>New</strong> Zealand’s ma<strong>in</strong> connection to <strong>the</strong> rest of <strong>the</strong> world is <strong>the</strong> Sou<strong>the</strong>rn Cross cable. The<br />
cost of capacity on this <strong>in</strong>ternational l<strong>in</strong>k is higher than many <strong>New</strong> Zealanders are will<strong>in</strong>g<br />
to pay. Alongside this, under <strong>in</strong>ternational peer<strong>in</strong>g arrangements, <strong>the</strong> cost of transmitt<strong>in</strong>g<br />
data depends on <strong>the</strong> balance of traffic. A country that, on balance, exports data receives a<br />
net payment for this. Countries that are net importers of data must pay. <strong>New</strong> Zealand is a<br />
net importer of data, which <strong>in</strong>creases <strong>the</strong> cost of Internet use to <strong>New</strong> Zealanders.<br />
Interconnection<br />
Internet service providers must <strong>in</strong>terconnect with each o<strong>the</strong>r so that <strong>the</strong>ir customers can<br />
exchange data. For example, for a TelstraClear customer to access a web service provided<br />
by a customer of Telecom’s Xtra service, TelstraClear and Telecom must have an<br />
<strong>in</strong>terconnection arrangement cover<strong>in</strong>g Internet services. The normal standard for<br />
Internet <strong>in</strong>terconnection is “best efforts”. That is, service providers undertake to use<br />
<strong>the</strong>ir best efforts to deliver data quickly, but with <strong>the</strong> understand<strong>in</strong>g that <strong>from</strong> time to<br />
time bits of data may be delayed or even lost. Up until recently this standard has been<br />
sufficient to deliver available Internet applications to an acceptable quality of service. For<br />
applications such as email or file downloads, a delay <strong>in</strong> transmitt<strong>in</strong>g some “packets” of<br />
data that make up <strong>the</strong> whole typically has no noticeable effect <strong>from</strong> <strong>the</strong> user’s po<strong>in</strong>t of<br />
view.<br />
However, this is chang<strong>in</strong>g. Some applications now delivered over <strong>the</strong> Internet require<br />
low levels of latency (that is, little or no delay <strong>in</strong> transmitt<strong>in</strong>g pieces of data). Examples<br />
<strong>in</strong>clude video-conferenc<strong>in</strong>g over <strong>the</strong> Internet and high quality voice-over-Internet<br />
services. A best efforts <strong>in</strong>terconnection standard cannot guarantee an acceptable quality<br />
of service for <strong>the</strong>se applications.<br />
3<br />
For example <strong>the</strong> Thomson TG123g modem supported by Telecom can deliver speeds of up to 54Mbps. This is<br />
significantly faster than currently available residential broadband connections, but considerably slower than <strong>the</strong><br />
maximum speed fibre to <strong>the</strong> home could provide.<br />
6
<strong>New</strong> Zealand Internet services providers are currently negotiat<strong>in</strong>g a new set of<br />
<strong>in</strong>terconnection standards for voice over <strong>the</strong> Internet and o<strong>the</strong>r low latency applications.<br />
These new standards will <strong>in</strong>clude procedures for <strong>in</strong>terconnected providers to control for<br />
<strong>the</strong> quality of <strong>in</strong>terconnection service, to give priority to low latency applications such as<br />
voice over <strong>the</strong> Internet. However, <strong>New</strong> Zealand service providers will cont<strong>in</strong>ue<br />
experienc<strong>in</strong>g latency problems with <strong>in</strong>ternational service providers.<br />
Intellectual property and anti-siphon<strong>in</strong>g laws<br />
Leav<strong>in</strong>g <strong>the</strong> <strong>in</strong>frastructure issues aside, it is unlikely that ISPs will be able to deliver IPTV<br />
or video-on-demand services without a change to <strong>the</strong> market structure that currently<br />
determ<strong>in</strong>es access to content. Sky and o<strong>the</strong>r television broadcasters control premium<br />
content <strong>in</strong> <strong>New</strong> Zealand. While Sky does wholesale content to o<strong>the</strong>r providers, it has a<br />
lengthy satellite lease and has no <strong>in</strong>centives proactively to push content onto a new<br />
platform such as broadband. Similarly, development of any new digital platform by<br />
TVNZ (supported by <strong>the</strong> Government) would dim<strong>in</strong>ish <strong>in</strong>centive to make that content<br />
available over <strong>the</strong> broadband.<br />
The Government is currently undertak<strong>in</strong>g a major review of <strong>the</strong> policy and regulation of<br />
digital content. 4 This work will recommend detailed options on a range of topics,<br />
<strong>in</strong>clud<strong>in</strong>g <strong>the</strong> exist<strong>in</strong>g arrangements for acquir<strong>in</strong>g, packag<strong>in</strong>g, wholesal<strong>in</strong>g, retail<strong>in</strong>g, and<br />
transmitt<strong>in</strong>g content.<br />
2.2 <strong>Broadband</strong> Access Technologies<br />
There is no s<strong>in</strong>gle def<strong>in</strong>ition for “broadband”. For <strong>the</strong> purposes of this report, we accept<br />
<strong>the</strong> OECD def<strong>in</strong>ition of broadband, which <strong>in</strong>cludes Internet access services that provide<br />
download speeds greater than 256 kbps to end users. 5 We dist<strong>in</strong>guish between<br />
broadband services and “high speed broadband”, which we def<strong>in</strong>e as any service<br />
provid<strong>in</strong>g download speeds of 10 Mbps or more.<br />
A range of different types of access technologies can provide broadband services,<br />
<strong>in</strong>clud<strong>in</strong>g:<br />
• Digital Subscriber L<strong>in</strong>e (DSL)—DSL is a family of access technologies that<br />
use exist<strong>in</strong>g copper <strong>in</strong>frastructure to deliver broadband services. DSL<br />
technologies <strong>in</strong>clude:<br />
– ADSL1 and ADSL2+, which Telecom and o<strong>the</strong>rs currently use to deliver<br />
broadband services, and<br />
– VDSL, which Telecom and o<strong>the</strong>rs will implement through Telecom’s<br />
cab<strong>in</strong>etisation programme. TelstraClear recently announced that it is now<br />
offer<strong>in</strong>g VDSL2 to bus<strong>in</strong>esses, and will have this service available <strong>in</strong> 14<br />
centres by <strong>the</strong> end of 2008<br />
• Wireless—<strong>in</strong> <strong>New</strong> Zealand, wireless broadband services <strong>in</strong>clude Vodafone’s<br />
broadband offer<strong>in</strong>g, Woosh services, and various localised “WiFi” networks.<br />
4<br />
5<br />
The M<strong>in</strong>istry of Culture and Heritage and M<strong>in</strong>istry of Economic Development are undertak<strong>in</strong>g this work.<br />
OECD <strong>Broadband</strong> Subscriber Criteria, accessible on <strong>the</strong> world wide web at<br />
http://www.oecd.org/document/46/0,3343,en_2649_34225_39575598_1_1_1_1,00.html (accessed December<br />
2008). The OECD has acknowledged that <strong>the</strong>se current criteria will need to be reconsidered and possibly changed,<br />
as new applications appear which require faster connections than <strong>the</strong> lowest-speed broadband connections can<br />
support. (see <strong>Broadband</strong> Growth and Policies In OECD Countries, OECD 2008<br />
7
Orcon offers a wireless broadband service targeted to rural users, with<br />
download speeds of up to 1Mbps 6<br />
• Mobile broadband—Telecom and Vodafone both offer mobile broadband<br />
services, with plans to upgrade <strong>the</strong>ir network to provide faster speeds.<br />
Telecom recently announced plans to roll out a new broadband mobile<br />
network nationally by June 2009<br />
• Hybrid Fibre Coax (HFC)—TelstraClear uses HFC networks to provide<br />
broadband services <strong>in</strong> <strong>the</strong> Well<strong>in</strong>gton region and Christchurch<br />
• Optical fibre—-Optical fibre (“fibre”) is already widely used <strong>in</strong> <strong>New</strong> Zealand’s<br />
telecommunications networks. Fibre makes up <strong>the</strong> core network, and <strong>in</strong> many<br />
areas runs up to <strong>the</strong> local exchange or street cab<strong>in</strong>et (see Figure 2.1). Telecom<br />
is currently implement<strong>in</strong>g a cab<strong>in</strong>etisation programme to take fibre to <strong>the</strong><br />
street cab<strong>in</strong>et nationally. For bus<strong>in</strong>esses, Telecom, TelstraClear, Citil<strong>in</strong>k, an<br />
o<strong>the</strong>rs supply optical fibre to <strong>the</strong> premises <strong>in</strong> some areas (<strong>in</strong> particular central<br />
bus<strong>in</strong>ess districts)<br />
• Satellite—BayCity Communications provides broadband satellite services to<br />
users <strong>in</strong> <strong>New</strong> Zealand, resell<strong>in</strong>g IPStar’s wholesale satellite offer<strong>in</strong>g. This<br />
service is available anywhere <strong>in</strong> <strong>New</strong> Zealand, provided that <strong>the</strong> property has<br />
“l<strong>in</strong>e of sight” to <strong>the</strong> IPStar satellite, <strong>in</strong> <strong>the</strong> western part of <strong>the</strong> sky.<br />
DSL and cable broadband are <strong>the</strong> two most common types of broadband connections <strong>in</strong><br />
<strong>New</strong> Zealand. In Table 2.1 below we highlight <strong>the</strong> average download and upload speeds<br />
available.<br />
6<br />
This service was orig<strong>in</strong>ally developed by <strong>the</strong> state owned enterprise BCL, and was known as <strong>the</strong> “BCL Extend<br />
Network”.<br />
8
Table 2.1: <strong>Broadband</strong> Access Technology <strong>Speed</strong>s<br />
Average Download<br />
<strong>Speed</strong><br />
Average Upload<br />
<strong>Speed</strong><br />
Typical Maximum<br />
Download <strong>Speed</strong> <strong>in</strong> NZ<br />
ADSL Approx. 5 Mbps 0.9 Mbps 7.6 Mbps (1)<br />
ADSL 2+ Approx. 12 Mbps 0.9 Mbps 21 Mbps (1)<br />
HFC<br />
8.8 Mbps 0.8 Mbps<br />
10 Mbps (Well<strong>in</strong>gton)<br />
25 Mbps (Christchurch)<br />
VDSL/VDSL 2+ Approx 30 Mbps Approx. 5 Mbps 50 Mbps (2)<br />
FTTH<br />
(assumed) 78 Mbps 39 Mbps<br />
2 x 1 Gbps<br />
Fibre Optic Not available Not available 1 Gbps<br />
Wireless (3) 1.6 Mbps 0.1 Mbps<br />
Satellite Not available Not available 2 Mbps<br />
Notes:<br />
(1) This is normally a maximum speed that very few customers actually get. It is not known<br />
exactly how many customers can get <strong>the</strong> maximum speed for ADSL and ADSL2+, Cable, and<br />
VDSL, although we understand that it at least 10 percent should be able to. (Telecom no longer<br />
advertises speed but o<strong>the</strong>r providers do.) Fibre to <strong>the</strong> home, due to its different technical<br />
characteristics, should be able to deliver maximum speeds to all users.<br />
(2) This is <strong>the</strong> maximum download speed VDSL will be able to provide to users, follow<strong>in</strong>g<br />
completion of Telecom’s cab<strong>in</strong>etisation programme (see Box 4.1 on page 36). In practice this<br />
maximum speed will only be available to customers who live relatively close to <strong>the</strong> cab<strong>in</strong>et—<br />
approximately 20 percent of users by 2011.<br />
(3) This table reflects current wireless broadband speeds. As discussed below, wireless is expected<br />
to deliver much higher speeds <strong>in</strong> <strong>the</strong> medium term.<br />
In practice, <strong>the</strong> <strong>the</strong>oretical connection speed advertised by providers for broadband<br />
access is not always reliably available to <strong>the</strong> customer. Providers <strong>in</strong> most cases have<br />
allowed a greater number of subscribers than <strong>the</strong>ir backbone connection could handle at<br />
one time, based on <strong>the</strong> assumption that most users will not be us<strong>in</strong>g <strong>the</strong>ir full connection<br />
capacity very frequently. The cab<strong>in</strong>etisation programme be<strong>in</strong>g undertaken by Chorus has<br />
started to ease some of <strong>the</strong>se throughput issues, by <strong>in</strong>creas<strong>in</strong>g <strong>the</strong> extent of optical fibre<br />
<strong>in</strong> <strong>the</strong> network down to <strong>the</strong> level of <strong>the</strong> street cab<strong>in</strong>et.<br />
2.2.1 The grow<strong>in</strong>g role of wireless <strong>in</strong> provid<strong>in</strong>g high speed broadband<br />
Over <strong>the</strong> last 10 years, mobile networks have made substantial progress <strong>in</strong> <strong>the</strong> cost<br />
effective delivery of data services. This, comb<strong>in</strong>ed with <strong>the</strong> decl<strong>in</strong><strong>in</strong>g cost of powerful<br />
digital devices, has led to a rapid growth of mobile and wireless <strong>in</strong>ternet traffic. Ongo<strong>in</strong>g<br />
developments <strong>in</strong> mobile technologies are cont<strong>in</strong>u<strong>in</strong>g to deliver <strong>in</strong>creases <strong>in</strong> data speeds.<br />
The speed and bandwidth that mobile networks offer today is similar to <strong>the</strong> performance<br />
of DSL services three to four years ago. Wireless technology is expected to cont<strong>in</strong>ue its<br />
progress and to deliver <strong>in</strong> three to five years speeds materially higher than current access<br />
networks. Recent announcements by Vodafone regard<strong>in</strong>g developments <strong>in</strong> new<br />
technologies such as Long Term Evolution (LTE) confirm that trend. Similarly, Telecom<br />
has announced that it is roll<strong>in</strong>g out WCDMA technology to provide coverage to 97<br />
percent of <strong>the</strong> population by June 2009.<br />
9
2.2.2 The impact of distance on DSL speeds<br />
At present, <strong>the</strong> overwhelm<strong>in</strong>g majority of <strong>New</strong> Zealand local access l<strong>in</strong>es are copper<br />
loops <strong>from</strong> <strong>the</strong> exchange to <strong>the</strong> cab<strong>in</strong>et. The exchange is connected to <strong>the</strong> backbone<br />
through optical fibre, and <strong>the</strong> connection <strong>from</strong> <strong>the</strong> street cab<strong>in</strong>et to <strong>the</strong> home typically<br />
uses copper earth cable. The copper network was orig<strong>in</strong>ally built to provide a voice<br />
service over a public switched telephone network, well before Internet technology or<br />
broadband were even conceived of. DSL technologies have emerged to enable<br />
<strong>in</strong>frastructure providers supply broadband Internet access us<strong>in</strong>g <strong>the</strong>se exist<strong>in</strong>g telephone<br />
networks.<br />
Us<strong>in</strong>g DSL technologies <strong>in</strong>frastructure providers can provide services with much greater<br />
bandwidth than a normal telephone l<strong>in</strong>e could achieve. However, <strong>the</strong> speeds customers<br />
can obta<strong>in</strong> <strong>from</strong> DSL services decl<strong>in</strong>e, <strong>the</strong> fur<strong>the</strong>r <strong>the</strong> customer is <strong>from</strong> <strong>the</strong> exchange.<br />
Figure 2.2 <strong>in</strong>dicates <strong>the</strong> percentage of <strong>New</strong> Zealand homes that will be able to access<br />
different speeds us<strong>in</strong>g DSL technologies.<br />
Figure 2.2: Impact of Distance on Service (DSL Access Technologies)<br />
Distance has particular implications for rural areas, as:<br />
• Households are more dispersed than <strong>in</strong> urban areas and consumers may be<br />
many kilometres <strong>from</strong> <strong>the</strong> exchange<br />
• Local exchange build<strong>in</strong>gs may not be located <strong>in</strong> <strong>the</strong> most densely populated<br />
areas<br />
• Copper pairs will be routed along streets and <strong>the</strong> loop length may be more<br />
than double <strong>the</strong> straight l<strong>in</strong>e distance between <strong>the</strong> exchange and <strong>the</strong> customer.<br />
2.2.3 The role of fibre <strong>in</strong> improv<strong>in</strong>g broadband service quality<br />
In contrast to copper, fibre can provide high quality broadband services over very long<br />
distances. Thus, by deploy<strong>in</strong>g fibre with<strong>in</strong> <strong>the</strong>ir networks, <strong>in</strong>frastructure providers can<br />
deliver high quality broadband services over a wider area. Fibre deployments essentially<br />
amount to replac<strong>in</strong>g exist<strong>in</strong>g copper with fibre <strong>in</strong> different parts of <strong>the</strong><br />
10
telecommunications network. Usually this will also <strong>in</strong>volve changes to <strong>the</strong> network<br />
topology, for example <strong>the</strong> number and placement of exchanges and street cab<strong>in</strong>ets.<br />
<strong>Most</strong> <strong>in</strong>frastructure providers use fibre to at least some extent, regardless of <strong>the</strong><br />
technology used <strong>in</strong> <strong>the</strong> local access network to provide broadband services to end users.<br />
TelstraClear, Telecom, and Vodafone already have substantial optical fibre deployments<br />
<strong>in</strong> <strong>the</strong>ir networks. For example, Telecom has around 20,000 kilometres of optical fibre <strong>in</strong><br />
its network. Of this, 8,000 kilometres is <strong>in</strong> <strong>the</strong> local access network, with <strong>the</strong> balance <strong>in</strong><br />
backhaul <strong>from</strong> exchanges, and <strong>in</strong> <strong>the</strong> core network. Chorus’s cab<strong>in</strong>etisation programme<br />
currently underway will boost <strong>the</strong> reach of high speed DSL networks by br<strong>in</strong>g<strong>in</strong>g fibre to<br />
<strong>the</strong> street cab<strong>in</strong>et.<br />
Figure 2.3 illustrates how different fibre strategies can be characterised by how close <strong>the</strong><br />
fibre is brought to <strong>the</strong> customer.<br />
Figure 2.3: Delivery Architecture for Major <strong>Broadband</strong> Alternatives<br />
ADSL 2+<br />
Optical Fibre<br />
Exchange Copper<br />
SC<br />
Copper<br />
12 Mbps<br />
12 Mbps<br />
VDSL<br />
Optical Fibre<br />
Exchange Optical Fibre<br />
SC<br />
Copper<br />
30 Mbps<br />
30 Mbps<br />
FTTH<br />
Optical Fibre<br />
Exchange Optical Fibre<br />
CP 100<br />
100<br />
Mbps<br />
Mbps<br />
FITH<br />
Optical Fibre<br />
Exchange<br />
Optical Fibre<br />
1,000 Mbps<br />
1,000 Mbps<br />
Notes:<br />
“SC” stands for “street cab<strong>in</strong>et<br />
“CP” stands for “customer premises”<br />
“FTTH” stands for “fibre to <strong>the</strong> home”<br />
“FITH” stands for “fibre <strong>in</strong> <strong>the</strong> home”<br />
2.3 Access to Applications<br />
In th<strong>in</strong>k<strong>in</strong>g about <strong>the</strong> value that <strong>New</strong> Zealanders might ga<strong>in</strong> <strong>from</strong> public <strong>in</strong>vestment<br />
subsidis<strong>in</strong>g <strong>the</strong> deployment of high speed broadband, we must first recognise that<br />
different users demand different types of applications. Not all of <strong>the</strong>se applications<br />
require high speed broadband, or <strong>the</strong> same levels of speed and reliability.<br />
The range of applications that potentially require broadband is large, and each application<br />
has its own unique characteristics. The technical requirements for a given service are<br />
often imprecisely def<strong>in</strong>ed. In only a very few cases <strong>the</strong>re is a simple m<strong>in</strong>imum bandwidth<br />
(or latency), such that <strong>the</strong> service works perfectly with this speed, and fails completely<br />
11
without it. The actual quality of <strong>the</strong> service, as it appears to <strong>the</strong> user, could and does vary<br />
greatly. Users adapt to <strong>in</strong>ferior service where <strong>the</strong>y are “forced” to do so. Where <strong>the</strong> use<br />
of certa<strong>in</strong> applications is impaired, <strong>the</strong>re must be a m<strong>in</strong>imum po<strong>in</strong>t at which users judge<br />
<strong>the</strong> service “<strong>in</strong>operable” for normal purposes. Def<strong>in</strong><strong>in</strong>g that po<strong>in</strong>t will often be a matter<br />
of personal preference.<br />
Users of applications can be separated <strong>in</strong>to two ma<strong>in</strong> groups: residential users and<br />
bus<strong>in</strong>ess users. We discuss <strong>the</strong> types of applications relevant to each group below. In<br />
section 2.3.3 we describe two categories of use that commonly arise <strong>in</strong> <strong>the</strong> broadband<br />
debate: eEducation and eHealth. In section 3.3.3 we discuss levels of demand for<br />
different applications.<br />
2.3.1 Residential users<br />
We categorise <strong>the</strong> applications households are us<strong>in</strong>g or are likely to be us<strong>in</strong>g <strong>in</strong> <strong>the</strong> future<br />
<strong>in</strong> <strong>the</strong> follow<strong>in</strong>g way:<br />
• Communication: E-mail is currently <strong>the</strong> most common communications<br />
application that <strong>New</strong> Zealanders are us<strong>in</strong>g. However, as “voice over Internet<br />
protocol” applications such as Skype and Yahoo Messenger are grow<strong>in</strong>g, more<br />
households are us<strong>in</strong>g <strong>the</strong>ir <strong>in</strong>ternet connections to make phone calls. Around<br />
25 percent of broadband users use <strong>the</strong> Internet for more data <strong>in</strong>tensive peer to<br />
peer file transfers. Video conferenc<strong>in</strong>g <strong>from</strong> <strong>the</strong> home computer is also<br />
important for a number of residential users. This is a particularly important<br />
form of communication for <strong>New</strong> Zealand’s deaf community. Video<br />
conferenc<strong>in</strong>g allows deaf people to communicate directly with each o<strong>the</strong>r<br />
us<strong>in</strong>g sign language. The deaf community is also seek<strong>in</strong>g <strong>in</strong>troduction of a<br />
video relay service, which would enable <strong>the</strong>m to make telephone calls to o<strong>the</strong>r<br />
parties us<strong>in</strong>g a video conferenc<strong>in</strong>g l<strong>in</strong>k 7<br />
• Web surf<strong>in</strong>g and file shar<strong>in</strong>g: Many <strong>New</strong> Zealanders use <strong>the</strong> Internet to<br />
browse <strong>the</strong> world wide web. This <strong>in</strong>cludes access<strong>in</strong>g news and enterta<strong>in</strong>ment<br />
websites, mak<strong>in</strong>g transactions or purchases onl<strong>in</strong>e, and personal research<br />
<strong>in</strong>clud<strong>in</strong>g schoolwork. A large and <strong>in</strong>creas<strong>in</strong>g number of <strong>New</strong> Zealanders use<br />
<strong>the</strong> Internet to access “Web 2.0” social network<strong>in</strong>g sites such as Facebook and<br />
Myspace, to share photos and communicate with o<strong>the</strong>rs<br />
• Audio visual enterta<strong>in</strong>ment: As compression technologies have improved,<br />
more <strong>New</strong> Zealanders are able to watch videos and television programs<br />
onl<strong>in</strong>e, through us<strong>in</strong>g applications such as YouTube. Users can also listen to<br />
radio, or listen to or purchase music over <strong>the</strong> Internet (for example through<br />
iTunes)<br />
• Research and learn<strong>in</strong>g: Many households use Internet access for personal<br />
research, for example read<strong>in</strong>g news reports, and for educational purposes such<br />
as school homework, or remote school lessons.<br />
Many studies of <strong>the</strong> social value of broadband ascribe benefit to work<strong>in</strong>g or learn<strong>in</strong>g<br />
<strong>from</strong> home. The applications <strong>in</strong>volved <strong>in</strong> work<strong>in</strong>g or learn<strong>in</strong>g <strong>from</strong> home fall <strong>in</strong>to all of<br />
<strong>the</strong> three categories set out above. Work<strong>in</strong>g <strong>from</strong> home requires <strong>the</strong> ability to<br />
communicate with o<strong>the</strong>r colleagues, send files and access <strong>the</strong> world wide web. Similarly,<br />
learn<strong>in</strong>g <strong>from</strong> home may require <strong>the</strong> ability to download video programs, to share files<br />
and to participate <strong>in</strong> video sessions.<br />
7<br />
Video relay is a service that allows a deaf or hard of hear<strong>in</strong>g person to make a telephone call via an Internet video<br />
connection between <strong>the</strong> user and <strong>the</strong> relay centre staffed with sign language <strong>in</strong>terpreters.<br />
12
Hence, <strong>in</strong> order to understand whe<strong>the</strong>r a particular level of broadband service enables<br />
households to derive benefits <strong>from</strong> work<strong>in</strong>g or learn<strong>in</strong>g <strong>from</strong> home, we need to consider<br />
whe<strong>the</strong>r <strong>the</strong>y are able to use <strong>the</strong> applications which fall <strong>in</strong>to <strong>the</strong> above three categories.<br />
2.3.2 Bus<strong>in</strong>ess users<br />
Bus<strong>in</strong>esses, small and large, rely on access to <strong>the</strong> Internet for a range of core functions.<br />
In general, as bus<strong>in</strong>esses grow <strong>the</strong>y cont<strong>in</strong>ue to use <strong>the</strong> Internet for <strong>the</strong> same types of<br />
application, but <strong>the</strong> complexity of <strong>the</strong>ir systems, and associated bandwidth requirements<br />
<strong>in</strong>crease:<br />
• Bank<strong>in</strong>g, payment systems: Us<strong>in</strong>g <strong>in</strong>ternet connections to enable credit and<br />
debit cards to be used <strong>in</strong> purchases and to undertake bank<strong>in</strong>g<br />
• Account keep<strong>in</strong>g: Many small bus<strong>in</strong>esses use account<strong>in</strong>g packages which<br />
require connection to <strong>the</strong> <strong>in</strong>ternet to function effectively<br />
• Communication: Us<strong>in</strong>g e-mail to communicate with customers and<br />
suppliers, <strong>in</strong>clud<strong>in</strong>g send<strong>in</strong>g and receiv<strong>in</strong>g large files. Us<strong>in</strong>g voice and video<br />
over Internet applications to communicate with staff work<strong>in</strong>g <strong>from</strong> home<br />
• Research: Us<strong>in</strong>g <strong>the</strong> world wide web as a low cost, accessible research tool<br />
• Advertis<strong>in</strong>g: Advertis<strong>in</strong>g products and services through websites. As server<br />
technology prices have fallen, many small bus<strong>in</strong>esses are choos<strong>in</strong>g to host<br />
<strong>the</strong>ir own websites<br />
• Flexible work<strong>in</strong>g arrangements: Us<strong>in</strong>g <strong>in</strong>ternet connectivity to provide<br />
more flexible work<strong>in</strong>g arrangements, to improve <strong>the</strong> overall productivity of<br />
<strong>the</strong>ir staff. This <strong>in</strong>cludes access to company data <strong>from</strong> external locations (for<br />
example <strong>from</strong> home), and email over mobile phones. Bus<strong>in</strong>esses can provide<br />
for flexible work<strong>in</strong>g <strong>in</strong> various ways, <strong>in</strong>clud<strong>in</strong>g giv<strong>in</strong>g staff access to a virtual<br />
private network (“VPN”), or mak<strong>in</strong>g <strong>the</strong>ir files and <strong>in</strong>ternal systems accessible<br />
over <strong>the</strong> Internet. 8 This is happen<strong>in</strong>g now (although even faster speeds may<br />
<strong>in</strong>crease <strong>the</strong> value)<br />
• Data storage: Back<strong>in</strong>g up essential files and data on servers located at an<br />
alternative locations. To do this effectively requires reliable <strong>in</strong>ternet<br />
connections<br />
• Video conferenc<strong>in</strong>g: Video conferenc<strong>in</strong>g is becom<strong>in</strong>g an essential tool for<br />
large bus<strong>in</strong>esses, <strong>in</strong> particular for those operat<strong>in</strong>g <strong>from</strong> multiple locations<br />
• Inventory and stock control: Supply cha<strong>in</strong> management has become globally<br />
<strong>in</strong>tegrated, with large bus<strong>in</strong>esses need<strong>in</strong>g permanent connectivity to manage<br />
stock control and <strong>in</strong>ventory processes effectively.<br />
2.3.3 Sector specific uses: eEducation and eHealth<br />
The terms “eEducation” 9 and “eHealth” refer to particular uses for Internet applications.<br />
They are not <strong>in</strong> <strong>the</strong>mselves applications. Ra<strong>the</strong>r <strong>the</strong>y refer to <strong>the</strong> delivery of education<br />
and health services us<strong>in</strong>g a range of electronic media. For example, eEducation is <strong>the</strong><br />
delivery of educational material us<strong>in</strong>g a variety of media, such as web sites, <strong>in</strong>teractive<br />
television, video, and video conferenc<strong>in</strong>g.<br />
8<br />
9<br />
There are now software packages available that allow bus<strong>in</strong>esses to configure <strong>the</strong>ir systems for secure access over<br />
<strong>the</strong> Internet.<br />
eEducation is also sometimes referred to as “eLearn<strong>in</strong>g”.<br />
13
eHealth refers to <strong>the</strong> use of electronic tools and communication to support effective<br />
healthcare. eHealth can encompass:<br />
• Shar<strong>in</strong>g of medical records between different healthcare professionals<br />
• Onl<strong>in</strong>e <strong>in</strong>formation on evidenced based medic<strong>in</strong>e—that is up to date<br />
<strong>in</strong>formation on medical research to support diagnostic and treatment<br />
decisions<br />
• Collaboration between healthcare professionals, us<strong>in</strong>g applications such as<br />
email and videoconferenc<strong>in</strong>g, to create “virtual” healthcare teams<br />
• The use of electronic media for <strong>the</strong> delivery of cl<strong>in</strong>ical care to patients<br />
(“Telemedic<strong>in</strong>e”). For example this may <strong>in</strong>volve video-conferenc<strong>in</strong>g to<br />
conduct a real-time consultation between medical specialists <strong>in</strong> two different<br />
countries, or to provide remote medical procedures or exam<strong>in</strong>ations.<br />
Telemedic<strong>in</strong>e can reduce <strong>the</strong> need for patients to travel to see a specialist, or<br />
conversely can enable specialists to cover a wider population.<br />
The <strong>New</strong> Zealand Health IT Cluster, 10 toge<strong>the</strong>r with <strong>the</strong> M<strong>in</strong>istry of Health, is engaged<br />
<strong>in</strong> a significant work program to improve <strong>the</strong> delivery of healthcare us<strong>in</strong>g <strong>the</strong> eHealth<br />
approach. This “Connected Health” project is look<strong>in</strong>g at ways to improve <strong>the</strong> flow of<br />
<strong>in</strong>formation with<strong>in</strong> <strong>the</strong> health sector, with <strong>the</strong> aim that patients’ medical <strong>in</strong>formation is<br />
available to healthcare practitioners who need it, regardless of which part of <strong>the</strong> health<br />
system <strong>the</strong>y work for. The Cluster is also work<strong>in</strong>g to develop and implement systems for<br />
electronic laboratory order<strong>in</strong>g and results, and electronic prescriptions.<br />
2.3.4 Applications and broadband speed requirements<br />
Increased usage, comb<strong>in</strong>ed with more bandwidth-hungry applications, has meant that<br />
demands on <strong>the</strong> broadband network have been <strong>in</strong>creas<strong>in</strong>g over a number of years. The<br />
level of typical consumption of content, measured by <strong>the</strong> amount of data downloaded<br />
per household has cont<strong>in</strong>ued to rise dramatically s<strong>in</strong>ce <strong>the</strong> <strong>in</strong>troduction of broadband,<br />
and this can be attributed <strong>in</strong> particular to <strong>the</strong> growth <strong>in</strong> peer-to-peer traffic and video.<br />
As Table 2.1 on page 9 shows, broadband services currently available <strong>in</strong> <strong>New</strong> Zealand<br />
provide average download speeds of 1Mbps for wireless broadband services up to<br />
around 78Mbps for users that already have fibre to <strong>the</strong> premises. 11 Upload speeds—that<br />
is <strong>the</strong> speed at which a user can send data to o<strong>the</strong>rs—are generally much slower.<br />
The figures below show approximate download speeds needed to access various Internet<br />
applications at a reasonable level of service quality, separated <strong>in</strong>to applications demanded<br />
by residential users and by bus<strong>in</strong>esses. The figures show that users can access <strong>the</strong><br />
majority of Internet applications with download speeds <strong>in</strong> <strong>the</strong> region of 1 to 2 Mbps. The<br />
exceptions are:<br />
• For residential users: IPTV multicast services, real time video on demand,<br />
high def<strong>in</strong>ition TV multicast services, and high def<strong>in</strong>ition eEducation<br />
• For bus<strong>in</strong>ess users: high def<strong>in</strong>ition multi-media applications such as high<br />
def<strong>in</strong>ition TV health consultations, high def<strong>in</strong>ition TV eEducation, high<br />
def<strong>in</strong>ition video conferenc<strong>in</strong>g, and telepresence.<br />
10 The <strong>New</strong> Zealand Health IT Cluster is an <strong>in</strong>dustry group<strong>in</strong>g of <strong>in</strong>frastructure providers, health software vendors,<br />
consultants, and healthcare providers.<br />
11 Fibre to <strong>the</strong> premises is currently available to some bus<strong>in</strong>esses, and residential users <strong>in</strong> selected new residential<br />
developments.<br />
14
To give some examples of <strong>the</strong> effect of access speed on <strong>the</strong> range of applications users<br />
can access:<br />
• Voice and email do not consume material bandwidth<br />
• Gam<strong>in</strong>g and brows<strong>in</strong>g are today ma<strong>in</strong>ly restricted by latency ra<strong>the</strong>r than speed,<br />
with content servers be<strong>in</strong>g <strong>the</strong> ma<strong>in</strong> bottleneck<br />
• Users can start to access digital TV and similar quality video-on-demand at<br />
speeds of between 2.5 and 3.5 Mbps<br />
• <strong>High</strong> def<strong>in</strong>ition TV uses up to 8 Mbps per channel today, but should be<br />
available at lower speeds as compression technology advances.<br />
Figure 2.4: Applications and Download <strong>Speed</strong> Requirements—Residential<br />
100<br />
<strong>High</strong> <strong>Speed</strong> broadband<br />
“Current generation” broadband<br />
Downstream bandwidth requirements (Mbps)<br />
10<br />
9<br />
8<br />
7<br />
6<br />
5<br />
4<br />
3<br />
2<br />
1<br />
Email<br />
Mobile<br />
eCommerce<br />
Digital Radio –<br />
DAB, WiFi<br />
TV view<strong>in</strong>g place<br />
/ device shift<strong>in</strong>g<br />
Video<br />
Conferenc<strong>in</strong>g -<br />
desk<br />
Video on<br />
Demand –<br />
Real Time<br />
VoIP over<br />
Internet<br />
Telemetry –<br />
e.g. GPS<br />
Mobile TV<br />
Video stream<strong>in</strong>g<br />
– provider<br />
Fully<br />
<strong>in</strong>teractive TV<br />
HDTV –<br />
multicast<br />
Electronic video<br />
programm<strong>in</strong>g<br />
Intelligent<br />
home<br />
applicances<br />
Gam<strong>in</strong>g<br />
Web 2.0 (<strong>in</strong>c.<br />
social<br />
applications)<br />
Home security<br />
– remote<br />
monitor<strong>in</strong>g<br />
eEducation –<br />
HDTV<br />
lessons<br />
eCommerce (onl<strong>in</strong>e<br />
purchas<strong>in</strong>g)<br />
Video on<br />
Demand–<br />
Trickle<br />
Music<br />
Download<br />
eEducation –<br />
SDTV lessons<br />
IPTV –<br />
multicast<br />
Note:<br />
“<strong>High</strong> speed broadband” encompasses those broadband access technologies that can deliver<br />
download speeds of 10Mbps or greater, <strong>in</strong>clud<strong>in</strong>g: HFC, which TelstraClear already provides <strong>in</strong><br />
some areas); ADSL2+ which Telecom is already provid<strong>in</strong>g <strong>in</strong> some areas; VDSL and VDSL2+,<br />
currently be<strong>in</strong>g rolled out by Telstra Clear and Telecom; and fibre to <strong>the</strong> home.<br />
“Current generation broadband” <strong>in</strong>cludes those broadband access technologies that provide<br />
speeds lower than 10 Mbps, such as ADSL.<br />
15
Figure 2.5: Applications and Download <strong>Speed</strong> Requirements—Bus<strong>in</strong>ess<br />
<strong>High</strong> <strong>Speed</strong> broadband<br />
“Current generation” broadband<br />
100<br />
Downstream bandwidth requirements (Mbps)<br />
10<br />
9<br />
8<br />
7<br />
6<br />
5<br />
4<br />
3<br />
2<br />
1<br />
Email<br />
Telemetry –<br />
e.g GPS<br />
Data<br />
back-up<br />
Video<br />
Conferenc<strong>in</strong>g<br />
- desk<br />
VoIP over<br />
Internet<br />
Videophone<br />
–e.g<br />
polycom<br />
Software as<br />
a service<br />
eHealth –<br />
HDTV<br />
consultation<br />
eCommerce<br />
(on-l<strong>in</strong>e<br />
purchas<strong>in</strong>g)<br />
Fixed/mobile<br />
voice<br />
<strong>in</strong>tegration<br />
eHealth –<br />
SDTV<br />
consultation<br />
eEducation<br />
– HDTV<br />
lessons<br />
eHealth RFID<br />
drug track<strong>in</strong>g<br />
Digital Radio<br />
–DAB, WiFi<br />
eEducation<br />
–SDTV<br />
lessons<br />
Video<br />
Conferenc<strong>in</strong>g<br />
-HD<br />
Telepresence<br />
Note:<br />
“<strong>High</strong> speed broadband” encompasses those broadband access technologies that can deliver<br />
download speeds of 10Mbps or greater, <strong>in</strong>clud<strong>in</strong>g: HFC, which TelstraClear already provides <strong>in</strong><br />
some areas); ADSL2+ which Telecom is already provid<strong>in</strong>g <strong>in</strong> some areas; VDSL and VDSL2+,<br />
currently be<strong>in</strong>g rolled out by Telstra Clear and Telecom; and fibre to <strong>the</strong> home.<br />
“Current generation broadband” <strong>in</strong>cludes those broadband access technologies that provide<br />
speeds lower than 10 Mbps, such as ADSL.<br />
The above discussion shows users can access most available applications us<strong>in</strong>g<br />
broadband services that are currently available, or will become available <strong>in</strong> <strong>the</strong><br />
foreseeable future (such as ADSL, ADSL2+, or VDSL). Hence, any demand for even<br />
faster broadband services would rely on <strong>the</strong> grow<strong>in</strong>g demand for greater quality of<br />
service, where lack of congestion and spare capacity enable users to improve <strong>the</strong>ir<br />
experience.<br />
16
So far we have focussed on download speeds as <strong>the</strong> ma<strong>in</strong> concern for access<strong>in</strong>g<br />
applications. Until recently Internet applications have generally been asymmetric <strong>in</strong> terms<br />
of <strong>the</strong>ir bandwidth requirements—that is users downloaded much more data than <strong>the</strong>y<br />
uploaded. Examples <strong>in</strong>clude brows<strong>in</strong>g web pages, or access<strong>in</strong>g videos and music. In this<br />
asymmetric world download speeds were <strong>the</strong> ma<strong>in</strong> determ<strong>in</strong>ant of <strong>the</strong> quality of users’<br />
experience. More recently changes <strong>in</strong> <strong>the</strong> way we use <strong>the</strong> Internet mean that users are<br />
<strong>in</strong>creas<strong>in</strong>gly demand<strong>in</strong>g fast two-way data transmission. “Web 2.0” applications also<br />
require fast upload speeds. Examples <strong>in</strong>clude social network<strong>in</strong>g applications, where users<br />
exchange data such as photos, or YouTube which <strong>in</strong>volves exchange of video files<br />
between users.<br />
2.3.5 Applications: The future<br />
Growth <strong>in</strong> <strong>the</strong> volume of traffic, <strong>the</strong> range of available applications, and <strong>the</strong> number of<br />
users is likely to drive greater demand for high speed broadband <strong>in</strong> <strong>the</strong> future:<br />
• Internationally, demand for <strong>in</strong>ternet bandwidth has grown rapidly. YouTube<br />
currently consumes as much bandwidth as <strong>the</strong> entire Internet did <strong>in</strong> <strong>the</strong> year<br />
2000. Cisco forecasts an annual growth rate of 42 percent <strong>in</strong> global consumer<br />
traffic<br />
• <strong>New</strong> devices will <strong>in</strong>crease <strong>the</strong> load on both core and access networks. The<br />
extension of <strong>the</strong> IP standard to radios, TV sets, alarms, remotely-controlled<br />
systems (such as heat<strong>in</strong>g and appliances) will cont<strong>in</strong>ue to alter <strong>the</strong> profile of<br />
use by <strong>in</strong>creas<strong>in</strong>g <strong>the</strong> number of devices that will simultaneously exchange<br />
symmetric <strong>in</strong>formation on <strong>the</strong> web. The decl<strong>in</strong><strong>in</strong>g cost of computer memory,<br />
monitors, and process<strong>in</strong>g power will lead to cont<strong>in</strong>ued enhancement of quality<br />
of services. Similarly, users will <strong>in</strong>creas<strong>in</strong>gly be able to access <strong>the</strong> Internet<br />
through arrange of devices, such as gam<strong>in</strong>g consoles and television sets<br />
• Chang<strong>in</strong>g demographics will shift toward heavier users of onl<strong>in</strong>e services that<br />
will spend more and more time on <strong>in</strong>ternet-connected devices and bandwidthhungry<br />
applications.<br />
As demand rises fur<strong>the</strong>r, <strong>the</strong>re are ways <strong>in</strong> which service providers can cont<strong>in</strong>ue to<br />
deliver more bandwidth out of <strong>the</strong> copper network. For example “bond<strong>in</strong>g” techniques<br />
comb<strong>in</strong>e <strong>the</strong> capacity of multiple l<strong>in</strong>es to enhance access speeds up to 1 Gbps to users.<br />
Providers can also improve access speeds through a range of technical adjustments, and<br />
<strong>the</strong> way <strong>in</strong> which <strong>the</strong>y ma<strong>in</strong>ta<strong>in</strong> <strong>the</strong> physical <strong>in</strong>frastructure. For example, Telecom and<br />
Pacificnet recently launched software company, PacByte’s, Video on Demand software,<br />
which enables users to view virtually immediately DVD quality feature-length movies<br />
over a regular 1Mbs broadband connection 12 . In addition, software producers (<strong>in</strong>clud<strong>in</strong>g<br />
PacByte) are develop<strong>in</strong>g o<strong>the</strong>r types of technologies. Recent product releases <strong>in</strong>clude<br />
compression patches that can reduce image files to one-fifth <strong>the</strong> size of JPEG, and audio<br />
and video files to half <strong>the</strong> size of W<strong>in</strong>Zip, effectively <strong>in</strong>creas<strong>in</strong>g <strong>the</strong> speed of any Internet<br />
connection by up to 50 percent. 13<br />
12 ThePacific.net media release 29 Mar 2008. “Revolutionary Video on Demand system launched <strong>in</strong> NZ”<br />
http://www.tpnet.co.nz/<strong>in</strong>dex.php?page=Company%20<strong>New</strong>s&article=Revolutionary%20Video%20on%20Demand%20system%2<br />
0launched%20<strong>in</strong>%20NZ (accessed 28 October 2008)<br />
13 ThePacific.net media release 29 May 2008. “Revolutionary Video on Demand system launched <strong>in</strong> NZ”<br />
http://www.tpnet.co.nz/<strong>in</strong>dex.php?page=Company%20<strong>New</strong>s&article=Revolutionary%20Video%20on%20Demand%20system%2<br />
0launched%20<strong>in</strong>%20NZ (accessed 28 October 2008)<br />
17
2.4 Conclusion<br />
Our review <strong>in</strong>dicates that, currently, most people should be able to access and use <strong>the</strong><br />
applications <strong>the</strong>y want over <strong>the</strong> exist<strong>in</strong>g broadband <strong>in</strong>frastructure. The ma<strong>in</strong> exception is<br />
rural access.<br />
Where limitations <strong>in</strong> access exist, <strong>the</strong>y may be caused by a number of bottlenecks <strong>in</strong> <strong>the</strong><br />
broadband supply cha<strong>in</strong>. The “last mile” <strong>in</strong>frastructure may not be <strong>the</strong> most important<br />
bottleneck, aga<strong>in</strong> with <strong>the</strong> exception of rural areas.<br />
Recent research conducted by Phoenix Research, for <strong>the</strong> Auckland Regional <strong>Broadband</strong><br />
Advisory Group, found that people perceive <strong>the</strong> <strong>in</strong>ternet much like a utility, such as an<br />
electricity or rail network. Much as people expect cont<strong>in</strong>uous and reliable access to<br />
electricity and water, and to be supplied as much as <strong>the</strong>y need, <strong>the</strong> research found that<br />
people expect <strong>the</strong> same of <strong>in</strong>ternet services. That is, people expect <strong>in</strong>ternet <strong>in</strong>frastructure<br />
to be renewed and improved over time to ensure <strong>the</strong>y can do <strong>the</strong> th<strong>in</strong>gs <strong>the</strong>y want to,<br />
when <strong>the</strong>y want to do <strong>the</strong>m. 14<br />
Look<strong>in</strong>g forward it is likely that users will become more demand<strong>in</strong>g <strong>in</strong> terms of <strong>the</strong><br />
quality of service <strong>the</strong>y expect <strong>from</strong> broadband providers, driven by <strong>the</strong> cont<strong>in</strong>u<strong>in</strong>g<br />
expansion of Internet applications and devices. Counter<strong>in</strong>g this, advances <strong>in</strong> compression<br />
technology will enable suppliers of Internet applications to provide more over exist<strong>in</strong>g<br />
broadband networks.<br />
14 Small,J., A. Beer, C. Sweetman, D. Fougere, and C. Birch (2008) “Open Access <strong>Broadband</strong> <strong>in</strong> Auckland: Demand, Costs<br />
and Benefits” Report by Covec, Teleconsultants and Phoenix Research for <strong>the</strong> Auckland Regional <strong>Broadband</strong><br />
Advisory Group<br />
18
3 Private Benefits of <strong>Broadband</strong>: Will<strong>in</strong>gness to<br />
Pay<br />
This section exam<strong>in</strong>es <strong>the</strong> private benefits of broadband—that is <strong>the</strong> benefits that fall<br />
directly on users of broadband services. 15<br />
<strong>New</strong> Zealanders are quite rational <strong>in</strong> decid<strong>in</strong>g whe<strong>the</strong>r, and how much, to pay for<br />
broadband. They will not pay more for a broadband connection than <strong>the</strong> value <strong>the</strong>y<br />
believe <strong>the</strong>y will obta<strong>in</strong> <strong>from</strong> that connection. The best way to assess <strong>the</strong> private benefits<br />
of broadband to users is thus to exam<strong>in</strong>e actual purchas<strong>in</strong>g decisions to f<strong>in</strong>d what users<br />
are will<strong>in</strong>g, or able, to pay <strong>in</strong> practice. Accord<strong>in</strong>gly, this section reviews available data on<br />
<strong>New</strong> Zealanders’ will<strong>in</strong>gness to pay for fast broadband services, as revealed by <strong>the</strong><br />
broadband packages users subscribe to.<br />
As Section 2 discussed, <strong>the</strong> benefits of broadband access derive <strong>from</strong> <strong>the</strong> applications<br />
users are able to access. Thus, will<strong>in</strong>gness to pay for different levels of access gives an<br />
<strong>in</strong>dication of <strong>the</strong> value users place on different types of application.<br />
Our review of available data on demand for broadband shows that:<br />
• Many <strong>New</strong> Zealanders value broadband, however most <strong>New</strong> Zealanders do<br />
not place a high value on high speed broadband service even though we have<br />
some of <strong>the</strong> lowest priced broadband <strong>in</strong> <strong>the</strong> OECD (see section 3.1), and<br />
• While <strong>the</strong> value of broadband services to bus<strong>in</strong>esses clearly varies widely,<br />
depend<strong>in</strong>g on bus<strong>in</strong>ess characteristics, for many commercial and <strong>in</strong>stitutional<br />
users, will<strong>in</strong>gness to pay also appears to be low.<br />
This f<strong>in</strong>d<strong>in</strong>g has <strong>the</strong> follow<strong>in</strong>g implications:<br />
• It is likely that <strong>the</strong> perceived low use of high speed broadband <strong>in</strong> <strong>New</strong><br />
Zealand is a reasonable reflection of <strong>the</strong> private value to users at this po<strong>in</strong>t <strong>in</strong><br />
time<br />
• Given <strong>the</strong> revealed will<strong>in</strong>gness to pay, <strong>in</strong> <strong>the</strong> near term private benefits to <strong>New</strong><br />
Zealanders <strong>from</strong> government <strong>in</strong>tervention to promote <strong>in</strong>vestment <strong>in</strong> high<br />
speed broadband are likely to be relatively small. We would <strong>the</strong>refore need to<br />
believe <strong>the</strong> wider social benefits are high <strong>in</strong> order to justify <strong>the</strong> cost of<br />
<strong>in</strong>tervention.<br />
The rema<strong>in</strong>der of this section assesses will<strong>in</strong>gness to pay for broadband, based on data<br />
on actual uptake of broadband services <strong>in</strong> <strong>New</strong> Zealand:<br />
• We start by consider<strong>in</strong>g <strong>New</strong> Zealand’s take up of broadband services, relative<br />
to o<strong>the</strong>r countries (section 3.1)<br />
• Section 3.2 looks at trends <strong>in</strong> Internet access <strong>in</strong> <strong>New</strong> Zealand, and growth <strong>in</strong><br />
dial-up access and broadband usage<br />
• Section 3.3 exam<strong>in</strong>es available data on will<strong>in</strong>gness to pay for <strong>in</strong>ternet<br />
applications. We analyse data on take up of different broadband packages, at<br />
different prices, and compare <strong>the</strong> results to data on <strong>the</strong> types of applications<br />
broadband subscribers use. We f<strong>in</strong>d that many users do not place a high value<br />
15 See Appendix B for a discussion of <strong>the</strong> various types of benefits and costs <strong>from</strong> public <strong>in</strong>vestment <strong>in</strong> high speed<br />
broadband.<br />
19
on <strong>the</strong> applications high speed broadband would let <strong>the</strong>m access, and<br />
accord<strong>in</strong>gly opt to purchase lower end broadband packages<br />
• Sections 3.3 and 3.4 look at variations <strong>in</strong> broadband uptake based on <strong>in</strong>come<br />
and geography respectively<br />
• F<strong>in</strong>ally, section 3.5 reviews our f<strong>in</strong>d<strong>in</strong>gs on will<strong>in</strong>gness to pay.<br />
3.1 International Comparison of <strong>New</strong> Zealand <strong>Broadband</strong> Take Up<br />
Before look<strong>in</strong>g at detailed data on <strong>New</strong> Zealanders’ will<strong>in</strong>gness to pay for broadband, it<br />
is useful to consider our level of broadband take up, relative to o<strong>the</strong>r countries. Does <strong>the</strong><br />
available data show that <strong>New</strong> Zealanders are less (or more) likely to purchase broadband<br />
services than residents of o<strong>the</strong>r countries?<br />
International data on broadband take up across <strong>the</strong> OECD shows that <strong>New</strong> Zealand is<br />
“catch<strong>in</strong>g up” to o<strong>the</strong>r countries. In June 2008 <strong>New</strong> Zealand had 20.4 broadband<br />
subscribers per 100 <strong>in</strong>habitants, only slightly beh<strong>in</strong>d <strong>the</strong> OECD average of 21.4 (see<br />
Figure 3.1).<br />
Figure 3.1: <strong>Broadband</strong> Subscribers per 100 Inhabitants (June 2008)<br />
40<br />
35<br />
30<br />
25<br />
20<br />
15<br />
10<br />
5<br />
0<br />
Denmark<br />
Ne<strong>the</strong>rlands<br />
Norway<br />
O<strong>the</strong>r<br />
Fibre/LAN<br />
Switzerland<br />
Iceland<br />
Sweden<br />
Korea<br />
F<strong>in</strong>land<br />
Luxembourg<br />
Canada<br />
United K<strong>in</strong>gdom<br />
Belgium<br />
France<br />
Germany<br />
United States<br />
Australia<br />
Japan<br />
Austria<br />
* <strong>New</strong> Zealand<br />
Spa<strong>in</strong><br />
Ireland<br />
Italy<br />
Czech Republic<br />
Hungary<br />
Portugal<br />
Greece<br />
Poland<br />
Slovak Republic<br />
Turkey<br />
<strong>New</strong> Zealand is currently ranked 19 th out of 30 OECD countries. This is a material<br />
improvement over 2003 when <strong>New</strong> Zealand ranked 24 th out of <strong>the</strong> OECD, with 2.6<br />
broadband subscribers per 100 <strong>in</strong>habitants. Indeed, <strong>in</strong> <strong>the</strong> year to June 2008, broadband<br />
penetration grew by 4.05 percent, well above <strong>the</strong> average OECD growth rate of 2.66<br />
percent. 16<br />
When we adjust for national <strong>in</strong>come, we see that <strong>New</strong> Zealand’s broadband take up is<br />
roughly what we would expect it to be, relative to o<strong>the</strong>r OECD countries (see Figure<br />
3.2). This data clearly shows that we are not lagg<strong>in</strong>g beh<strong>in</strong>d <strong>the</strong> rest of <strong>the</strong> world when it<br />
comes to broadband usage. Indeed, when we consider <strong>the</strong> fact that <strong>New</strong> Zealand, as a<br />
Cable<br />
DSL<br />
Mexico<br />
16 OECD <strong>Broadband</strong> Statistics (oecd.org/sti/ict/broadband), accessed October 2008. Only five o<strong>the</strong>r OECD<br />
countries recorded higher growth rates <strong>in</strong> <strong>the</strong> same period: Luxembourg, Germany, Greece, Ireland, and Hungary.<br />
20
net importer of content, pays relatively high peer<strong>in</strong>g charges, this suggests that <strong>New</strong><br />
Zealanders are us<strong>in</strong>g more broadband than could be expected.<br />
Figure 3.2: <strong>Broadband</strong> Subscribers per 100 Inhabitants by GDP, June 2008<br />
45<br />
40<br />
35<br />
DK<br />
NL<br />
R 2 = 0.6026<br />
30<br />
25<br />
20<br />
15<br />
10<br />
5<br />
TR<br />
M<br />
PL<br />
SK<br />
HU<br />
KR<br />
NZ<br />
CZ<br />
PT<br />
GR<br />
IT<br />
FI<br />
DE UK<br />
FR<br />
JP<br />
ES<br />
SE<br />
IS<br />
CA<br />
BE<br />
A<br />
AT<br />
CH<br />
IE<br />
US<br />
NO<br />
0<br />
0 10,000 20,000 30,000 40,000 50,000 60,000<br />
GDP per capita (USD PPP, 2007)<br />
Note:<br />
(1) We have removed Luxembourg <strong>from</strong> <strong>the</strong> data set, as it is a significant outlier on GDP per<br />
capita, and so distorts <strong>the</strong> correlation. Luxembourg had 28.3 broadband subscribers per 100<br />
<strong>in</strong>habitants <strong>in</strong> June 2008, and a GDP per capita of USD81,781 (PPP, 2007).<br />
International benchmark<strong>in</strong>g shows that broadband prices <strong>in</strong> <strong>New</strong> Zealand are relatively<br />
low compared to o<strong>the</strong>r developed countries. The Commerce Commission’s market<br />
monitor<strong>in</strong>g shows that <strong>New</strong> Zealand’s broadband prices are significantly lower than<br />
average rates or a sample of 35 developed countries. 17 The Commission’s report shows<br />
that prices <strong>in</strong> <strong>New</strong> Zealand are only 68 percent of average <strong>in</strong>ternational prices for low<br />
usage broadband packages, and up to 76 percent of <strong>the</strong> average price for high users (with<br />
m<strong>in</strong>imum download speeds of 4 Mbps, and up to 20 GB of data each month).<br />
3.1.1 Impact of <strong>the</strong> Telecommunications Service Obligation<br />
It is likely that <strong>the</strong> Telecommunications Service Obligation (TSO) has <strong>the</strong> effect of<br />
reduc<strong>in</strong>g <strong>New</strong> Zealand’s broadband penetration compared to o<strong>the</strong>r OECD countries.<br />
The TSO provides for free local call<strong>in</strong>g for dial-up Internet access, which is likely to<br />
reduce take up of broadband services. This is because <strong>in</strong> <strong>New</strong> Zealand, <strong>the</strong> additional<br />
cost of broadband compared to dial-up access is higher than it would be o<strong>the</strong>rwise, for<br />
<strong>the</strong> same difference <strong>in</strong> quality as <strong>in</strong> o<strong>the</strong>r countries.<br />
A recent OECD study on significant determ<strong>in</strong>ants of broadband penetration found that<br />
low dial-up prices do reduce broadband take up. The study’s authors stated that “price<br />
relativity is considered to be potentially important as <strong>the</strong> most common application of<br />
Internet access is for e-mail which dial-up satisfies <strong>in</strong> many cases.” Of <strong>the</strong> 30 countries<br />
<strong>in</strong>cluded <strong>in</strong> <strong>the</strong> study eight, <strong>in</strong>clud<strong>in</strong>g <strong>New</strong> Zealand, had dial-up access that was “so<br />
17 Commerce Commission, 2007 Telecommunications Market Monitor<strong>in</strong>g Report 31 March 2008. The sample of countries<br />
<strong>in</strong>cludes each of <strong>the</strong> 30 European countries covered by <strong>the</strong> European Union, plus five additional countries<br />
(Australia, <strong>New</strong> Zealand, Japan, Canada, and <strong>the</strong> United States).<br />
21
cheap that it impedes <strong>the</strong> adoption of broadband”. 18 Fur<strong>the</strong>r, <strong>the</strong> report found that that if<br />
<strong>the</strong> relative price for broadband <strong>in</strong> <strong>New</strong> Zealand were equal to <strong>the</strong> OECD mean for<br />
price relativity, <strong>New</strong> Zealand’s broadband penetration rate would be 2.0 percent to 4.4<br />
percent higher. 19<br />
3.2 Trends <strong>in</strong> Internet Access <strong>in</strong> <strong>New</strong> Zealand<br />
Trends <strong>in</strong> Internet access over <strong>the</strong> past few years tell us <strong>the</strong> same story—<strong>the</strong> number of<br />
<strong>New</strong> Zealanders with access to <strong>the</strong> Internet is cont<strong>in</strong>u<strong>in</strong>g to <strong>in</strong>crease. At <strong>the</strong> same time<br />
we are see<strong>in</strong>g a shift <strong>from</strong> dial-up services to broadband.<br />
Statistics <strong>New</strong> Zealand data show that <strong>the</strong> total number of Internet subscribers <strong>in</strong> <strong>New</strong><br />
Zealand is <strong>in</strong>creas<strong>in</strong>g. As Figure 3.3 shows, even over <strong>the</strong> last two years take up of<br />
Internet access has grown significantly, <strong>from</strong> 1.2 million subscribers <strong>in</strong> March 2006 to 1.5<br />
million <strong>in</strong> March 2008.<br />
Figure 3.3: Internet Subscriptions by Connection Type (March 2006–March 2008)<br />
1,600<br />
1,400<br />
108<br />
135<br />
158 179<br />
1,200<br />
Subscribers ('000s)<br />
1,000<br />
800<br />
600<br />
470<br />
493 574<br />
647<br />
712<br />
O<strong>the</strong>r broadband<br />
Digital subscriber l<strong>in</strong>e (DSL)<br />
"Dial-up" and ISDN<br />
400<br />
812<br />
771 740<br />
676<br />
613<br />
200<br />
0<br />
Mar 2006 Sep 2006 Mar 2007 Sep 2007 Mar 2008<br />
Note: Data “O<strong>the</strong>r broadband” are not available for March 2006.<br />
Moreover, <strong>the</strong> proportion of subscribers with a broadband connection is grow<strong>in</strong>g<br />
(despite <strong>the</strong> impact of <strong>the</strong> TSO noted above). In <strong>the</strong> two years to March 2008, <strong>the</strong><br />
proportion of subscribers us<strong>in</strong>g broadband <strong>in</strong>creased <strong>from</strong> 37 percent to 59 percent. As<br />
at March 2008, <strong>New</strong> Zealand had a total of 891,000 broadband subscribers. Of <strong>the</strong>se,<br />
711,900 used some form of DSL connection, and 179,100 used an alternative broadband<br />
technology (for example wireless broadband or cable). 20<br />
18 OECD Work<strong>in</strong>g Party on Communication Infrastructures and Services Policy, Catch<strong>in</strong>g-up <strong>in</strong> <strong>Broadband</strong>—What Will it<br />
Take? 2007, page 8.<br />
19 Ibid, endnote 18. This analysis was based on data <strong>from</strong> 2005, when <strong>New</strong> Zealand’s broadband penetration rate was<br />
8.1 percent.<br />
20 Statistics <strong>New</strong> Zealand, Internet Service Providers Survey, March 2008.<br />
22
3.2.1 Residential broadband usage<br />
Around 80 percent of households are now connected to <strong>the</strong> <strong>in</strong>ternet, compared to only<br />
37 percent <strong>in</strong> 2001. 21 A Statistics <strong>New</strong> Zealand survey of telecommunications use <strong>in</strong><br />
households, <strong>in</strong> December 2006, showed that 33 percent of households have some type of<br />
broadband connection. 22 Given <strong>the</strong> rate of growth <strong>in</strong> broadband subscriptions over <strong>the</strong><br />
past two years, <strong>the</strong> actual proportion of households with access to broadband now is<br />
likely to be substantially higher.<br />
3.2.2 Bus<strong>in</strong>ess broadband usage<br />
Bus<strong>in</strong>esses account for 15 percent of Internet connections <strong>in</strong> <strong>New</strong> Zealand (221,200<br />
subscriptions <strong>in</strong> March 2008). Around 77 percent of bus<strong>in</strong>esses have a broadband<br />
connection, while 32 percent have a dial-up connection. 23<br />
The larger <strong>the</strong> bus<strong>in</strong>ess, <strong>the</strong> more likely it is to use broadband (see Table 3.1)<br />
Table 3.1: Percentage of Bus<strong>in</strong>esses with <strong>Broadband</strong> Connections, by Size (2006)<br />
Bus<strong>in</strong>ess size<br />
Total No. of Bus<strong>in</strong>esses<br />
Bus<strong>in</strong>esses <strong>in</strong> Each<br />
Category Us<strong>in</strong>g <strong>Broadband</strong><br />
Percent<br />
Number<br />
6–19 employees 25,974 73 % 18,961<br />
20–49 employees 6,288 86 % 5408<br />
50–99 employees 1,731 91 % 1575<br />
100+ employees 1,440 94 % 1354<br />
Notes: Data sourced <strong>from</strong> private enterprises with annual GST turnover greater than $30,000.<br />
Bus<strong>in</strong>esses with fewer than six employees were excluded <strong>from</strong> this survey.<br />
3.3 Revealed Demand for Applications—Take Up of <strong>Broadband</strong><br />
Packages<br />
The previous sections showed that an <strong>in</strong>creas<strong>in</strong>g number of <strong>New</strong> Zealanders do appear<br />
to be will<strong>in</strong>g to pay for a broadband connection. The question we address here is: to<br />
what extent are <strong>New</strong> Zealanders will<strong>in</strong>g to pay for high speed broadband?<br />
As we discussed <strong>in</strong> section 2, <strong>the</strong> benefits <strong>from</strong> broadband come <strong>from</strong> <strong>the</strong> applications it<br />
enables subscribers to use, and <strong>the</strong> ease with which subscribers can access those<br />
applications. So ano<strong>the</strong>r way of putt<strong>in</strong>g <strong>the</strong> above question is: do <strong>New</strong> Zealanders value<br />
broadband services that enable access to “bandwidth hungry” applications such as fast,<br />
high quality movie downloads, YouTube, or social network<strong>in</strong>g sites? Or are <strong>the</strong>y more<br />
<strong>in</strong>terested <strong>in</strong> access<strong>in</strong>g email and surf<strong>in</strong>g <strong>the</strong> web?<br />
Access providers offer a range of packages differentiated on upload and download<br />
speeds, and on <strong>the</strong> volume of data <strong>the</strong> user may transmit without pay<strong>in</strong>g an additional<br />
21 Source: Statistics <strong>New</strong> Zealand. In March 2008, residential customers accounted for 1,282,800 Internet<br />
subscriptions, and <strong>New</strong> Zealand had an estimated 1,598,000 households.<br />
22 The most recent available national data on residential broadband up take <strong>in</strong> <strong>New</strong> Zealand dates <strong>from</strong> December<br />
2006. Given <strong>the</strong> pace of change <strong>in</strong> <strong>the</strong> broadband market, <strong>the</strong> actual current level of broadband uptake among<br />
households is likely to be substantially higher.<br />
23 Statistics <strong>New</strong> Zealand, Bus<strong>in</strong>ess Operations Survey, 2006. Only 11 percent of bus<strong>in</strong>esses use dial-up only and 21<br />
percent use both dial-up and broadband connections. Fifty seven percent of bus<strong>in</strong>esses use broadband only.<br />
23
fee. Packages with lower speeds, and lower data caps, cost less than faster packages.<br />
Through <strong>the</strong>ir choices of which package to purchase, broadband users give us<br />
<strong>in</strong>formation about <strong>the</strong> value <strong>the</strong>y place on <strong>the</strong> types of applications <strong>the</strong>y could access<br />
us<strong>in</strong>g currently available broadband services.<br />
In this section we review available data on <strong>the</strong> types of broadband packages <strong>New</strong><br />
Zealanders are purchas<strong>in</strong>g, and draw conclusions about what this means for will<strong>in</strong>gness<br />
to pay for high speed broadband. In particular, we look at available data on demand for<br />
two key dimensions of broadband service:<br />
• The speed (or “bit rate”) users can expect to receive, and<br />
• The volume of data users can transmit or receive (without <strong>in</strong>curr<strong>in</strong>g additional<br />
fees).<br />
We <strong>the</strong>n look at which applications broadband subscribers use, and what this tells us<br />
about whe<strong>the</strong>r or not <strong>New</strong> Zealanders place a high value on high speed broadband.<br />
3.3.1 Demand for access speeds<br />
There is little evidence of substantial pent-up demand for higher bandwidth at higher<br />
prices. Despite growth <strong>in</strong> <strong>the</strong> number of broadband connections, most broadband users<br />
choose low cost broadband packages that provide relatively low speeds.<br />
Data <strong>from</strong> telecommunications service providers show that <strong>the</strong> majority of broadband<br />
users are on plans that allow maximum speeds of 4 Mbps or lower. 24 Generally, <strong>the</strong>se<br />
packages provide improved speed and reliability over <strong>the</strong> slower dial-up option, and<br />
provide access to commonly used applications such as e-mail, voice over IP applications<br />
(for example “Skype”), downloadable video on demand, digital radio, and <strong>in</strong> some cases<br />
gam<strong>in</strong>g and music downloads.<br />
For approximately $10 to $20 a month extra, <strong>the</strong>se users could purchase packages<br />
enabl<strong>in</strong>g <strong>the</strong>m to access a much wider range of applications <strong>in</strong>clud<strong>in</strong>g (potentially)<br />
desktop videoconferenc<strong>in</strong>g, fully <strong>in</strong>teractive TV and o<strong>the</strong>r television services, and real<br />
time Video on Demand. 25 The fact that <strong>the</strong>y don’t tells us that most users value <strong>the</strong>se<br />
multimedia applications at less than $10 to $20 a month.<br />
In areas where <strong>the</strong>y are available, only a very small proportion of customers are will<strong>in</strong>g to<br />
pay for high speed broadband applications at current prices. 26<br />
This is consistent with <strong>the</strong> evidence <strong>from</strong> overseas that consumers <strong>in</strong> o<strong>the</strong>r countries<br />
cont<strong>in</strong>ue to prefer low prices for lower speeds, where <strong>the</strong> choice is available. For<br />
example, up to July 2008, France Telecom had only 14,000 fibre subscribers out of a<br />
possible 344,000 connectable homes.<br />
It is possible that this low apparent will<strong>in</strong>gness to pay for high speed broadband simply<br />
reflects <strong>the</strong> fact that many users have not experienced high speed broadband before, and<br />
24 For some users this may not be a matter of choice. For technical reasons, some households experience broadband<br />
speeds substantially lower than <strong>the</strong> <strong>the</strong>oretical maximum us<strong>in</strong>g exist<strong>in</strong>g ADSL services. However, <strong>the</strong> number of<br />
users on lower speed packages is significantly larger than <strong>the</strong> number of households that are speed constra<strong>in</strong>ed,<br />
<strong>in</strong>dicat<strong>in</strong>g that <strong>the</strong> majority of users prefer lower speed packages.<br />
25 In practice even with higher speed packages customers may not be able to access all of <strong>the</strong>se applications, at an<br />
acceptable level of quality. The actual speed of <strong>the</strong> service <strong>the</strong> user experiences depends of a range of external<br />
factors, as well as on <strong>the</strong> particular characteristics of that user’s connection (<strong>in</strong>clud<strong>in</strong>g distance <strong>from</strong> <strong>the</strong> telephone<br />
exchange). In addition, <strong>the</strong> speed different applications require will also depend, among o<strong>the</strong>r th<strong>in</strong>gs, on <strong>the</strong><br />
particular technical characteristics of <strong>the</strong> application <strong>in</strong> question, and any compression technologies <strong>in</strong> use.<br />
26 By high speed broadband we mean services provid<strong>in</strong>g download speeds of 10Mbps or more, and <strong>the</strong>oretically able<br />
to support HDTV, or similarly “bandwidth hungry” applications.<br />
24
so don’t realise just how good it is. Once users try high speed broadband <strong>the</strong>y may f<strong>in</strong>d<br />
that <strong>the</strong>y place a much higher value on <strong>the</strong> additional level of service <strong>the</strong>y receive.<br />
Alternatively, <strong>the</strong> low revealed value of high speed broadband to many users may be due<br />
to a lack of content or applications that need it. In section 2 we found that most<br />
commonly used Internet applications are accessible over relatively low end broadband<br />
connections. The value of high speed broadband to users depends on <strong>the</strong> value of <strong>the</strong><br />
applications it makes available. If providers cannot provide a range of applications that<br />
require high speed broadband, <strong>the</strong>n <strong>the</strong> value users place on high speed broadband will<br />
be correspond<strong>in</strong>gly low.<br />
3.3.2 Demand for data<br />
Ano<strong>the</strong>r <strong>in</strong>dicator of <strong>the</strong> will<strong>in</strong>gness to pay for high speed broadband is current demand<br />
for data. 27<br />
<strong>High</strong> speed broadband services will enable users to access “bandwidth hungry”<br />
applications, such as real time video stream<strong>in</strong>g, movie downloads, and high def<strong>in</strong>ition<br />
television. These services all <strong>in</strong>volve transmission of huge volumes of data. For example<br />
a low quality movie typically comprises 750MB of data, whereas a DVD quality movie is<br />
around 4GB. 28 If customers wish to access this type of application, we would expect<br />
<strong>the</strong>m to purchase broadband packages with large data caps to accommodate large file<br />
downloads. However, almost 60 percent of broadband users currently purchase packages<br />
that provide for less than 5GB of data per month.<br />
27 On 1 October 2008, Telecom announced changes to its broadband offer<strong>in</strong>gs, <strong>in</strong>clud<strong>in</strong>g doubl<strong>in</strong>g data caps. The data<br />
used <strong>in</strong> this section predates that announcement, and so reflects Telecom’s prices, speeds, and data caps prior to 1<br />
October 2008.<br />
28 The Communications Market: <strong>Broadband</strong>. Digital Progress Report Ofcom, Research report, 2 April 2007.<br />
25
Figure 3.4: <strong>Broadband</strong> Subscribers by Size of Data Cap<br />
20GB or more, 42,000, 5%<br />
No cap, 67,400, 8%<br />
5GB to less than 20GB,<br />
253,200, 28%<br />
Less than 5GB, 528,600,<br />
59%<br />
Similarly, data <strong>from</strong> telecommunications service providers shows that only a m<strong>in</strong>ority of<br />
subscribers purchase data caps of 10GB per month or more. 29<br />
This suggests that a relatively small proportion of users currently value <strong>the</strong> ability to<br />
transfer <strong>the</strong> very large volumes of data required to frequently access and view high end<br />
multi-media applications, or transfer large files.<br />
This is consistent with usage patterns <strong>in</strong> o<strong>the</strong>r jurisdictions. For example, <strong>in</strong> <strong>the</strong> United<br />
K<strong>in</strong>gdom, <strong>the</strong> majority of broadband subscribers download relatively small volumes of<br />
data, while a small “tail” of subscribers is responsible for bulk of data volumes—<strong>the</strong> top<br />
10 percent of users <strong>in</strong> <strong>the</strong> United K<strong>in</strong>gdom download almost twice as much content each month<br />
as <strong>the</strong> o<strong>the</strong>r 90 percent put toge<strong>the</strong>r. 30<br />
Box 3.1: Take up of <strong>High</strong> <strong>Speed</strong> <strong>Broadband</strong> <strong>in</strong> O<strong>the</strong>r Countries<br />
Where coverage has reached a reasonable level, take-up of high speed broadband services<br />
has appeared to lag. Starhub <strong>in</strong> S<strong>in</strong>gapore and Korea Telecom <strong>in</strong> Korea have both reported<br />
that <strong>the</strong> majority of users on <strong>the</strong>ir high speed broadband networks rema<strong>in</strong> on “lite”<br />
packages (4 to 10 Mbps).<br />
In Italy <strong>the</strong> availability s<strong>in</strong>ce 2004 of a fit-for-purpose Local Loop Unbundl<strong>in</strong>g (LLU)<br />
product has seen <strong>the</strong> company Fastweb’s bus<strong>in</strong>ess expansion based <strong>in</strong>creas<strong>in</strong>gly on sell<strong>in</strong>g<br />
LLU-based DSL services ra<strong>the</strong>r than fibre. Of its approximately 1 million users, only<br />
around a quarter are believed to be us<strong>in</strong>g fibre-based products.<br />
Caio, F. 2008 “Review of Barriers to Investment <strong>in</strong> Next Generation Access” Report to <strong>the</strong> United K<strong>in</strong>gdom<br />
Government<br />
29 We note here that (for most packages we have reviewed) <strong>the</strong> price for data <strong>in</strong>creases steeply for packages provid<strong>in</strong>g<br />
more than 15GB per month of data, which will serve to reduce demand. It seems likely that this reflects <strong>the</strong> high<br />
cost of <strong>in</strong>ternational data capacity.<br />
30 The Communications Market: <strong>Broadband</strong>. Digital Progress Report Ofcom, Research report, 2 April 2007.<br />
26
3.3.3 Demand for applications<br />
We have reviewed <strong>the</strong> results of two surveys on commonly used Internet applications:<br />
• A recent onl<strong>in</strong>e survey of broadband users to f<strong>in</strong>d out more about how people<br />
are us<strong>in</strong>g <strong>the</strong> Internet, conducted by Telecom, 31 and<br />
• A survey by Phoenix Research of 299 households <strong>in</strong> Auckland, Waitakere and<br />
Manukau cities, <strong>from</strong> March–April 2008. 32<br />
Table 3.2 over <strong>the</strong> page summarises f<strong>in</strong>d<strong>in</strong>gs <strong>from</strong> both surveys on commonly used<br />
applications, and <strong>the</strong> quality of access connection each application requires.<br />
The results clearly show that most of <strong>the</strong> uses for which <strong>New</strong> Zealanders access <strong>the</strong><br />
Internet require relatively low access speeds. A broadband connection will be necessary<br />
to provide a reasonable quality of user experience <strong>in</strong> access<strong>in</strong>g most of <strong>the</strong> applications <strong>in</strong><br />
Table 3.2. However, all of <strong>the</strong> applications covered by both surveys generally require<br />
access speeds well below 1 Mbps. (Although, <strong>in</strong> practice actual speed requirements may<br />
be greater than those shown <strong>in</strong> <strong>the</strong> table, depend<strong>in</strong>g on <strong>the</strong> characteristics of <strong>the</strong><br />
particular applications <strong>in</strong> use.)<br />
In o<strong>the</strong>r words, <strong>the</strong> majority of <strong>New</strong> Zealanders can use <strong>the</strong> applications <strong>the</strong>y currently<br />
wish to over a lower end broadband connection. <strong>High</strong> speed broadband would certa<strong>in</strong>ly<br />
improve <strong>the</strong> quality of <strong>the</strong> user experience by reduc<strong>in</strong>g any delays and provid<strong>in</strong>g more<br />
consistent access performance between users, but for most users higher speed is not<br />
necessary to access <strong>the</strong> applications <strong>the</strong>y wish to use, and <strong>the</strong> improvement <strong>in</strong> customer<br />
experience does not appear to be worth <strong>the</strong> extra $10 or $20 per month.<br />
31 The survey used a 15 m<strong>in</strong>ute onl<strong>in</strong>e questionnaire. The results quoted here are <strong>from</strong> a sample of 556 broadband<br />
users (Telecom and non-Telecom customers), and have been weighted on age, gender and region based upon<br />
proportions derived <strong>from</strong> <strong>the</strong> TNS Conversa market monitor dataset (and for Telecom customers <strong>in</strong> <strong>the</strong> dataset,<br />
based on Telecom <strong>in</strong>ternal customer data).<br />
32 Small,J., A. Beer, C. Sweetman, D. Fougere, and C. Birch (2008) “Open Access <strong>Broadband</strong> <strong>in</strong> Auckland: Demand, Costs<br />
and Benefits” Report by Covec, Teleconsultants and Phoenix Research for <strong>the</strong> Auckland Regional <strong>Broadband</strong><br />
Advisory Group<br />
27
Table 3.2: Use of Applications and Implications for Access Requirements<br />
Application<br />
% of broadband<br />
subscribers (Telecom<br />
survey)<br />
% households (Phoenix<br />
research)<br />
M<strong>in</strong>imum download<br />
speed (Mbps) (1)<br />
M<strong>in</strong>imum upload<br />
speed (Mbps) (1)<br />
Email 98% 99.5% 0.064 0.064<br />
General surf<strong>in</strong>g (2) 94% -<br />
Transactions (eg onl<strong>in</strong>e bank<strong>in</strong>g, bill payments,<br />
ticket book<strong>in</strong>gs)<br />
92% -<br />
Research<strong>in</strong>g or read<strong>in</strong>g <strong>the</strong> news - 89.2%<br />
Onl<strong>in</strong>e auctions or shopp<strong>in</strong>g (eg Trade Me, Ferrit) 83% 78.5%<br />
Shar<strong>in</strong>g photos with o<strong>the</strong>r people - 60.4%<br />
Download<strong>in</strong>g software 52%<br />
Download<strong>in</strong>g music / listen<strong>in</strong>g to music or radio 51% 54.6%<br />
Access<strong>in</strong>g social network<strong>in</strong>g sites / blogg<strong>in</strong>g 52% 49.5%<br />
Work<strong>in</strong>g <strong>from</strong> home - 49.9%<br />
Play<strong>in</strong>g games (3) - 42.8%<br />
School work / education and tra<strong>in</strong><strong>in</strong>g (4) 42% 53.3%<br />
Download<strong>in</strong>g movies / watch<strong>in</strong>g TV or videos 25% 39.4%<br />
onl<strong>in</strong>e (5)<br />
0.128 0.128<br />
0.064 0.064<br />
0.128 0.128<br />
0.064 0.064<br />
0.128 0.064<br />
0.128 0.064<br />
0.128 0.128<br />
0.300 0.300<br />
0.128 0.128<br />
0.128 0.064<br />
28
Application<br />
% of broadband<br />
subscribers (Telecom<br />
survey)<br />
% households (Phoenix<br />
research)<br />
M<strong>in</strong>imum download<br />
speed (Mbps) (1)<br />
M<strong>in</strong>imum upload<br />
speed (Mbps) (1)<br />
Peer to peer file transfers (6) 25%<br />
Shar<strong>in</strong>g videos or music with o<strong>the</strong>r people - 27.9%<br />
Phone calls (7) - 27.1%<br />
0.128 0.128<br />
0.080 0.080<br />
Notes: (1) These are m<strong>in</strong>imum speeds. The quality of service users experience <strong>in</strong> practice depends on a range of factors. In general faster speeds will tend to provide a higher<br />
quality of service, although this is not always <strong>the</strong> case. Depend<strong>in</strong>g on <strong>the</strong> application, users may experience a good quality of service at <strong>the</strong> speeds <strong>in</strong>dicated here<br />
(2) <strong>Speed</strong>s shown are for “Web 2.0”, <strong>in</strong>clud<strong>in</strong>g social applications<br />
(3) Also requires low latency (that is low or no delay <strong>in</strong> <strong>the</strong> transmission of data)<br />
(4) Assumes school work generally requires web based research. More sophisticated standard def<strong>in</strong>ition TV lessons would require speeds of 1Mbps both ways, as well as<br />
low latency<br />
(5) <strong>Speed</strong>s shown are for video stream<strong>in</strong>g. Real time video on demand services would require higher download speeds (up to 5Mbps). Even for video stream<strong>in</strong>g <strong>the</strong> speeds<br />
shown represent absolute m<strong>in</strong>imums—<strong>the</strong> quality of service experienced would be low at <strong>the</strong>se speeds<br />
(6) <strong>Speed</strong>s based on required speeds for data back-up and represent absolute m<strong>in</strong>imums—<strong>the</strong> quality of service experienced would be fairly low at <strong>the</strong>se speeds. Required<br />
speeds also may be higher depend<strong>in</strong>g on <strong>the</strong> size of files been transferred<br />
(7) Exact speed requirements depend on application type.<br />
29
3.4 Regional Differences<br />
The discussion above draws <strong>from</strong> national level data. We also need to consider whe<strong>the</strong>r<br />
<strong>the</strong>re is any regional variation <strong>in</strong> will<strong>in</strong>gness to pay for broadband. This section draws on<br />
Statistics <strong>New</strong> Zealand’s survey on Household Use of Information and Communication Technology<br />
undertaken <strong>in</strong> 2006, which <strong>in</strong>cluded data on broadband take up by region.<br />
Figure 3.5 shows household uptake of broadband and dial-up access across <strong>the</strong> twelve<br />
regional government territories, and average <strong>in</strong>come data for each region. The data is for<br />
2006. As noted above, broadband take up <strong>in</strong> <strong>New</strong> Zealand has <strong>in</strong>creased significantly<br />
s<strong>in</strong>ce this time—<strong>the</strong> current level of broadband take up <strong>in</strong> each region will be higher than<br />
<strong>the</strong> figure suggests.<br />
Well<strong>in</strong>gton, Canterbury, and Auckland all had broadband uptake greater than or equal to<br />
<strong>the</strong> national average of 33.2 percent of households <strong>in</strong> 2006. In each of <strong>the</strong>se three regions<br />
broadband uptake was beg<strong>in</strong>n<strong>in</strong>g to overtake dial-up access even <strong>the</strong>n. This may not be<br />
surpris<strong>in</strong>g—<strong>the</strong>se three regions have higher average <strong>in</strong>come levels than o<strong>the</strong>r parts of <strong>the</strong><br />
country, and <strong>the</strong>ir greater broadband take up may simply reflect this.<br />
Figure 3.5: <strong>Broadband</strong> Take Up by Region, 2006<br />
100<br />
800<br />
Percent<br />
90<br />
80<br />
70<br />
60<br />
50<br />
40<br />
30<br />
20<br />
10<br />
700<br />
600<br />
500<br />
400<br />
300<br />
200<br />
100<br />
$/week<br />
0<br />
0<br />
Well<strong>in</strong>gton<br />
Canterbury<br />
Auckland<br />
Taranaki<br />
Waikato<br />
Nelson / Tasman / Marlborough / West Coast<br />
Southland<br />
Gisborne / Hawke’s Bay<br />
Otago<br />
Bay of Plenty<br />
Northland<br />
Manawatu-Wanganui<br />
<strong>Broadband</strong> Dial-up Income<br />
Notes:<br />
(1) Take up expressed as percentage of households <strong>in</strong> each region with access.<br />
(2) Households may have both broadband and dial-up access.<br />
(3) <strong>Broadband</strong> <strong>in</strong>cludes DSL, cable, wireless and o<strong>the</strong>r broadband connection types.<br />
It is likely however, that <strong>the</strong> higher levels of broadband take up <strong>in</strong> Well<strong>in</strong>gton,<br />
Canterbury and Auckland also reflect supply side factors. That is, households <strong>in</strong> <strong>the</strong>se<br />
regions were more likely to be able to access broadband than <strong>in</strong> o<strong>the</strong>r parts of <strong>the</strong><br />
country, as:<br />
• There is greater competition <strong>in</strong> <strong>the</strong>se regions. For example, parts of <strong>the</strong><br />
Well<strong>in</strong>gton and Canterbury regions have long had <strong>the</strong> option of TelstraClear’s<br />
high speed networks, <strong>in</strong> addition to Telecom’s service. Woosh offers wireless<br />
broadband <strong>in</strong> Auckland, Well<strong>in</strong>gton, Canterbury, and Southland, and<br />
30
• <strong>High</strong>er population densities <strong>in</strong> Auckland, Well<strong>in</strong>gton, and Canterbury have<br />
meant a greater proportion of households could access Telecom’s broadband<br />
offer<strong>in</strong>g.<br />
Rural–urban variation<br />
In consider<strong>in</strong>g regional variation, we also need to consider differences between urban<br />
and rural areas. Figure 3.6 shows how take up of broadband and dial-up access varied<br />
between urban and rural areas <strong>in</strong> 2006. As we would expect, broadband take up <strong>in</strong> <strong>the</strong><br />
ma<strong>in</strong> urban centres was markedly higher than <strong>in</strong> o<strong>the</strong>r areas. <strong>Broadband</strong> take up outside<br />
<strong>the</strong> ma<strong>in</strong> urban areas was fairly constant, rang<strong>in</strong>g between 22 and 24 percent of<br />
households.<br />
Figure 3.6: Variation <strong>in</strong> Take Up between Urban and Rural<br />
50<br />
45<br />
40<br />
National average<br />
(broadband)<br />
National average<br />
(dial-up)<br />
35<br />
Percent<br />
30<br />
25<br />
20<br />
<strong>Broadband</strong><br />
Dial-up<br />
15<br />
10<br />
5<br />
-<br />
Ma<strong>in</strong> urban Secondary urban M<strong>in</strong>or urban Rural centre Rural<br />
Notes:<br />
(1) Take up expressed as percentage of households <strong>in</strong> each region with access.<br />
(2) Households may have both broadband and dial-up access.<br />
(3) <strong>Broadband</strong> <strong>in</strong>cludes DSL, cable, wireless and o<strong>the</strong>r broadband connection types.<br />
As <strong>the</strong> above figure shows, households <strong>in</strong> rural areas are more likely to have a dial-up<br />
connection than urban households. The data shows that this is due to a comb<strong>in</strong>ation of<br />
availability and will<strong>in</strong>gness to pay. As Figure 3.7 shows:<br />
• 38 percent of rural households with dial-up access only <strong>in</strong>dicated that <strong>the</strong> cost<br />
of broadband was too high<br />
• 35 percent stated that broadband was not available <strong>in</strong> <strong>the</strong>ir local area, while<br />
• 22 percent felt that dial-up was sufficient for <strong>the</strong>ir household.<br />
The Statistics <strong>New</strong> Zealand survey confirms that will<strong>in</strong>gness to pay for broadband is a<br />
major factor for many households that do not have broadband. Figure 3.7 shows, for<br />
households with dial-up access only, <strong>the</strong> reasons given for not tak<strong>in</strong>g up broadband.<br />
Apart <strong>from</strong> <strong>the</strong> issue of availability, which was a significant reason for rural households,<br />
<strong>the</strong> major reasons given were:<br />
• Costs too high (51 percent of those surveyed), and<br />
31
• Dial-up access is sufficient for <strong>the</strong> household’s use (33 percent).<br />
Figure 3.7: Reasons Given for No <strong>Broadband</strong><br />
Concern about service of broadband<br />
suppliers<br />
Dial-up access is sufficient for<br />
household use<br />
Urban<br />
Rural<br />
Costs too high<br />
Not available <strong>in</strong> local area<br />
0.0 10.0 20.0 30.0 40.0 50.0 60.0<br />
Percent<br />
Notes:<br />
(1) <strong>Broadband</strong> <strong>in</strong>cludes DSL, cable, wireless and o<strong>the</strong>r broadband connection types<br />
(2) Costs too high <strong>in</strong>cludes those who had concerns about <strong>the</strong> extra costs of exceed<strong>in</strong>g plan<br />
limits.<br />
(3) Rural <strong>in</strong>cludes rural and rural centre areas.<br />
(4) Urban <strong>in</strong>cludes ma<strong>in</strong> urban, secondary urban and m<strong>in</strong>or urban areas.<br />
Interest<strong>in</strong>gly, 35 percent of respondents <strong>in</strong> rural areas gave “not available <strong>in</strong> local area” as<br />
a reason for not subscrib<strong>in</strong>g to a broadband service. In fact, satellite broadband is<br />
available now, anywhere <strong>in</strong> <strong>New</strong> Zealand, provided that <strong>the</strong> property has a “l<strong>in</strong>e of sight”<br />
to <strong>the</strong> IPStar satellite. This result <strong>the</strong>refore suggests that many people are not aware of<br />
<strong>the</strong> availability of alternative broadband options. As a result <strong>New</strong> Zealanders may<br />
overstate <strong>the</strong> extent to which broadband is unavailable.<br />
In summary, regional variation <strong>in</strong> <strong>the</strong> proportion of households with broadband is likely<br />
to arise <strong>from</strong> a comb<strong>in</strong>ation of factors. The availability of broadband is clearly a factor <strong>in</strong><br />
rural areas (and thus <strong>in</strong> regions with relatively more rural households). Will<strong>in</strong>gness to pay<br />
is clearly a factor for many households that do not have broadband access, even <strong>in</strong> rural<br />
areas.<br />
3.5 Conclusions on Will<strong>in</strong>gness to Pay<br />
Many <strong>New</strong> Zealanders are prepared to pay for broadband. However a review of<br />
purchas<strong>in</strong>g behaviour and available survey data shows that, while some users do value<br />
high speeds and large data caps, <strong>the</strong>se users are currently <strong>in</strong> <strong>the</strong> m<strong>in</strong>ority. The majority of<br />
broadband users ma<strong>in</strong>ly use <strong>the</strong> Internet for applications such as email and web surf<strong>in</strong>g<br />
that do not require high speed broadband connections. As a result most are not will<strong>in</strong>g to<br />
pay even for <strong>the</strong> faster broadband packages that are available now. Telecommunications<br />
firms report that it is difficult to attract large numbers of subscribers to high end<br />
broadband packages offer<strong>in</strong>g high speeds and large data caps.<br />
32
This is borne out by <strong>the</strong> results of a recent survey that exam<strong>in</strong>ed, among o<strong>the</strong>r th<strong>in</strong>gs,<br />
respondents’ will<strong>in</strong>gness to pay for high speed broadband. 33 When asked “how much<br />
would you be prepared to pay each month to fund <strong>the</strong> delivery of fibre-optic broadband<br />
direct to homes <strong>in</strong> <strong>New</strong> Zealand?” 65 percent of those surveyed <strong>in</strong>dicated <strong>the</strong>y would not<br />
be prepared to pay anyth<strong>in</strong>g, or any more than <strong>the</strong>y currently pay (see Figure 3.8). Of<br />
those who would be prepared to pay for fibre to <strong>the</strong> home, most would only be prepared<br />
to pay $10 to $20 a month.<br />
Figure 3.8: Will<strong>in</strong>gness to Pay for Fibre to <strong>the</strong> Home<br />
60<br />
50<br />
40<br />
Percent<br />
30<br />
20<br />
10<br />
0<br />
Noth<strong>in</strong>g<br />
The same as I currently pay<br />
$10 per month<br />
$20 per month<br />
$30 per month<br />
$50 per month<br />
$100 per month<br />
$200 or more per month<br />
Don't know<br />
Some previous surveys have produced higher estimates of will<strong>in</strong>gness to pay for high<br />
speed broadband services. For example, a recent study <strong>in</strong>to demand for broadband <strong>in</strong><br />
Auckland, led by Covec, estimated a very high will<strong>in</strong>gness to pay. 34<br />
The Covec study surveyed 299 residents of <strong>the</strong> cities of Auckland, Manukau, and<br />
Waitakere, to elicit <strong>in</strong>formation on how much respondents would be will<strong>in</strong>g to pay for<br />
two different broadband services (correspond<strong>in</strong>g to fibre to <strong>the</strong> home, and ADSL2+).<br />
Based on 250 complete responses, <strong>the</strong> Covec study found that, on average, respondents<br />
were will<strong>in</strong>g to pay an additional $77.90 per month for <strong>the</strong> additional functionality fibre<br />
to <strong>the</strong> home would provide, over and above ADSL2+.<br />
Such results, however, are not borne out by current data on what households actually<br />
decide to pay for different levels of broadband service, and should be <strong>in</strong>terpreted with<br />
care. In o<strong>the</strong>r words, if consumers’ actual behaviour was consistent with <strong>the</strong>ir proposed<br />
<strong>in</strong>tentions, as reflected <strong>in</strong> will<strong>in</strong>gness to pay surveys, <strong>the</strong>n penetration of <strong>the</strong> higher speed<br />
plans would be higher than is <strong>in</strong> fact <strong>the</strong> case. If such will<strong>in</strong>gness to pay <strong>in</strong>deed existed, it<br />
would be profitable to roll out FTTH, and <strong>the</strong> market would have done so already.<br />
33 Survey undertaken by ShapeNZ for <strong>the</strong> <strong>New</strong> Zealand Bus<strong>in</strong>ess Council for Susta<strong>in</strong>able Development and Vodafone<br />
NZ.<br />
34 Small,J., A. Beer, C. Sweetman, D. Fougere, and C. Birch (2008) “Open Access <strong>Broadband</strong> <strong>in</strong> Auckland: Demand, Costs<br />
and Benefits” Report by Covec, Teleconsultants and Phoenix Research for <strong>the</strong> Auckland Regional <strong>Broadband</strong><br />
Advisory Group<br />
33
There is considerable uncerta<strong>in</strong>ty about how much demand for high speed broadband<br />
<strong>the</strong>re will be <strong>in</strong> <strong>the</strong> future, and when this will emerge. This uncerta<strong>in</strong>ty is beh<strong>in</strong>d <strong>the</strong><br />
current, low, level of <strong>in</strong>vestment <strong>in</strong> fibre to <strong>the</strong> home—current market demand for<br />
broadband services is <strong>in</strong>sufficient to create bus<strong>in</strong>ess case for widespread fibre to <strong>the</strong><br />
home. This may change <strong>in</strong> <strong>the</strong> future—as we found <strong>in</strong> section 2, cont<strong>in</strong>u<strong>in</strong>g proliferation<br />
of Internet applications and devices that utilise high speed broadband will encourage<br />
users to demand faster broadband services <strong>in</strong> <strong>the</strong> future. Indeed it is possible that we are<br />
approach<strong>in</strong>g a tipp<strong>in</strong>g po<strong>in</strong>t, beyond which many users start to demand high speed<br />
broadband, although <strong>the</strong>re is no way to confirm whe<strong>the</strong>r this is <strong>the</strong> case or where such a<br />
tipp<strong>in</strong>g po<strong>in</strong>t may be.<br />
Even if <strong>the</strong> Government and/or telecommunications providers <strong>in</strong>vested <strong>in</strong> wide spread<br />
deployment of fibre to <strong>the</strong> premises, our review of current will<strong>in</strong>gness to pay suggests<br />
that high take up, at prices which reflect <strong>the</strong> cost of service, is unlikely.<br />
There are a number of reasons why users might not see value <strong>in</strong> high speed broadband,<br />
<strong>in</strong>clud<strong>in</strong>g:<br />
• At <strong>the</strong> moment many people may not be aware of <strong>the</strong> applications <strong>the</strong>y could<br />
access us<strong>in</strong>g high speed broadband, and <strong>the</strong> potential benefits <strong>the</strong>se could<br />
generate. As people become more aware of what high speed broadband would<br />
enable <strong>the</strong> to do, <strong>the</strong> value <strong>the</strong>y place on it may <strong>in</strong>crease<br />
• Potential users may be concerned that, for a range of reasons, <strong>the</strong>y may not<br />
actually experience <strong>the</strong> speeds <strong>the</strong>y pay for. As we discussed <strong>in</strong> section 2.1<br />
problems <strong>in</strong> any element of <strong>the</strong> “supply cha<strong>in</strong>” can reduce speeds below what<br />
users should receive<br />
34
4 The Counterfactual: What <strong>the</strong> Market will<br />
Provide<br />
This section discusses <strong>the</strong> level of broadband services that users are likely to experience if<br />
broadband provision is left to <strong>the</strong> market—that is, if no new public <strong>in</strong>vestment is made<br />
available by government to subsidise high speed broadband. This is <strong>the</strong> “counterfactual”<br />
aga<strong>in</strong>st which we will assess options for government <strong>in</strong>tervention.<br />
We develop <strong>the</strong> counterfactual by:<br />
• Review<strong>in</strong>g broadband <strong>in</strong>vestment plans publicly announced by <strong>the</strong> three major<br />
participants <strong>in</strong> <strong>New</strong> Zealand’s telecommunications market (Telecom <strong>New</strong><br />
Zealand, TelstraClear, Vodafone) and o<strong>the</strong>r market participants; and<br />
• Br<strong>in</strong>g<strong>in</strong>g <strong>the</strong> above <strong>in</strong>formation toge<strong>the</strong>r, to build a picture of what<br />
applications <strong>New</strong> Zealanders will be able to access <strong>in</strong> around five years time.<br />
While this section is based on publicly announced <strong>in</strong>vestment <strong>in</strong>tentions, we have had<br />
<strong>the</strong> benefit of work<strong>in</strong>g closely with <strong>the</strong> ma<strong>in</strong> <strong>in</strong>frastructure <strong>in</strong>vestors to understand what<br />
<strong>the</strong>ir <strong>in</strong>vestment programmes, will deliver <strong>in</strong> terms of <strong>the</strong> level and availability of<br />
broadband services to residential and bus<strong>in</strong>ess customers.<br />
4.1 Investment Plans of Service Providers<br />
The private sector has committed over $2.5 billion <strong>in</strong> <strong>in</strong>vestment to 2012 towards <strong>the</strong><br />
deployment of high speed broadband <strong>in</strong>frastructure and o<strong>the</strong>r communications based<br />
<strong>in</strong>frastructure. The majority of this <strong>in</strong>vestment has been announced by <strong>the</strong> three major<br />
players <strong>in</strong> <strong>New</strong> Zealand’s telecommunications market.<br />
Telecom <strong>New</strong> Zealand is deliver<strong>in</strong>g a $1.4 billion <strong>in</strong>vestment <strong>in</strong> deploy<strong>in</strong>g Fibre to <strong>the</strong><br />
Cab<strong>in</strong>et (FTTC) and o<strong>the</strong>r improvements to its network, deliver<strong>in</strong>g broadband download<br />
speeds of at least 10 Mbps to 20 Mbps, and upload speeds of at least 1 Mbps, to<br />
approximately 80 percent of <strong>New</strong> Zealanders by 2011. Telecom <strong>New</strong> Zealand’s<br />
<strong>in</strong>vestment leaves potential for an upgrade to FTTH <strong>in</strong> <strong>the</strong> future. Figure 4.1 illustrates<br />
Telecom’s FTTC solution. We describe <strong>the</strong> download and upload speeds Telecom<br />
expects to deliver through FTTC <strong>in</strong> Box 4.1.<br />
Figure 4.1: Chorus Fibre to <strong>the</strong> Cab<strong>in</strong>et Solution<br />
35
Box 4.1: Telecom’s <strong>Broadband</strong> Download Service Targets Follow<strong>in</strong>g Cab<strong>in</strong>etisation<br />
By 2011: ADSL2+ accessible by 80 percent of users at least 10 Mbps with average upload<br />
speeds of 1 Mbps<br />
By 2011: VDSL accessible by 80 percent of users at >10 Mbps<br />
By 2011: VDSL accessible by 20 percent of users at 50 Mbps with upload speed of up to<br />
10 Mbps<br />
Telecom has so far upgraded more than 400,000 homes and bus<strong>in</strong>esses <strong>from</strong> ADSL to<br />
<strong>the</strong> faster ADSL2+ connections, and recently <strong>in</strong>creased <strong>the</strong> data caps for its retail<br />
broadband plans. 35<br />
In addition, Telecom is also <strong>in</strong>vest<strong>in</strong>g $574 million <strong>in</strong> deploy<strong>in</strong>g a new WCDMA mobile<br />
network. Telecom’s new network will be available to 97 percent of <strong>New</strong> Zealanders by<br />
June 2009, and will provide access to advanced 3G mobile broadband services.<br />
Vodafone <strong>New</strong> Zealand announced <strong>in</strong> July 2008 that is extend<strong>in</strong>g <strong>the</strong> coverage and<br />
speed of its 3G <strong>Broadband</strong> Network to 97 percent of <strong>New</strong> Zealanders, <strong>in</strong>creas<strong>in</strong>g its<br />
total 3G <strong>in</strong>frastructure <strong>in</strong>vestment to $500 million. Vodafone expects to eventually<br />
deliver broadband download speeds rang<strong>in</strong>g up to 28.8 Mbps and upload speeds of up to<br />
11.5 Mbps through its 3G network us<strong>in</strong>g <strong>High</strong> <strong>Speed</strong> Packet Access (HSPA). 36 It expects<br />
to complete this <strong>in</strong>frastructure upgrade by April 2010.<br />
Vodafone is also expand<strong>in</strong>g <strong>the</strong> delivery of its fixed l<strong>in</strong>e services, known as <strong>the</strong> “Red<br />
Network” follow<strong>in</strong>g its announcement, <strong>in</strong> June 2008, that it is <strong>in</strong>stall<strong>in</strong>g its own ADSL2<br />
and VDSL2 capable equipment <strong>in</strong> 41 exchanges <strong>in</strong> Auckland. It expects to complete this<br />
by <strong>the</strong> end of 2008, after which it expects to move <strong>in</strong>to o<strong>the</strong>r major centres, <strong>in</strong>clud<strong>in</strong>g<br />
Well<strong>in</strong>gton, Hamilton, Tauranga, Palmerston North, Rotorua and Taupo, Christchurch<br />
and Duned<strong>in</strong>. Vodafone expects to offer a commercial VDSL2 product and plans by <strong>the</strong><br />
end of 2008, deliver<strong>in</strong>g download speeds of up to 50 Mbps and upload speeds of up to<br />
20 Mbps. 37<br />
TelstraClear’s <strong>High</strong> Fibre Coax (HFC) network currently offers users <strong>in</strong> Kapiti and<br />
Well<strong>in</strong>gton broadband download speeds of up to 10 Mbps, and up to 25 Mbps <strong>in</strong><br />
Christchurch. The HFC network delivers upload speeds of up to 2 Mbps.<br />
TelstraClear has recently announced it will <strong>in</strong>stall its own equipment <strong>in</strong> approximately 70<br />
exchanges over <strong>the</strong> next 18 months, <strong>in</strong>clud<strong>in</strong>g 44 exchanges <strong>in</strong> Auckland and <strong>the</strong><br />
rema<strong>in</strong>der <strong>in</strong> <strong>the</strong> o<strong>the</strong>r centres <strong>in</strong> which it operates. It has so far <strong>in</strong>stalled VDSL2 capable<br />
equipment <strong>in</strong> 140 of its cab<strong>in</strong>ets.<br />
TelstraClear recently became <strong>the</strong> first provider to offer VDSL <strong>in</strong> <strong>New</strong> Zealand,<br />
launch<strong>in</strong>g, <strong>in</strong> October 2008, VDSL2 services deliver<strong>in</strong>g download speeds of 30 Mbps and<br />
upload speeds of 7 Mbps to bus<strong>in</strong>ess customers <strong>in</strong> parts of Auckland City and <strong>the</strong> central<br />
bus<strong>in</strong>ess districts (CBD) of Hamilton, Tauranga, Napier, <strong>New</strong> Plymouth, Wanganui,<br />
Lower Hutt and Well<strong>in</strong>gton. 38 It also plans to extend VDSL2 services on <strong>the</strong> North<br />
35 <strong>New</strong> Zealand Herald, 27 October 2008. “Super-fast <strong>Broadband</strong> for CBDs – at a price”<br />
36 Vodafone media release, 4 July 2008. “Vodafone <strong>in</strong>vests $500 million to build nationwide mobile broadband”<br />
37 Vodafone media release, 23 July 2008 “Vodafone – deliver<strong>in</strong>g <strong>the</strong> future today”<br />
38 TelstraClear’s VDSL2 service achieved 80 Mbps download speeds and up to 25 Mbps upload speeds<br />
36
Shore, <strong>in</strong> Waitakere, Manukau, Palmerston North and Duned<strong>in</strong>, before December,<br />
2008. 39<br />
O<strong>the</strong>r <strong>in</strong>vestments <strong>in</strong>clude Vector’s announcement <strong>in</strong> February 2008 that it is extend<strong>in</strong>g<br />
its fibre network <strong>in</strong> Auckland, with coverage <strong>from</strong> Manukau through to Albany,<br />
Henderson and Pakuranga, creat<strong>in</strong>g what it calls a “fibre backbone r<strong>in</strong>g” for <strong>the</strong><br />
Auckland region. 40 In addition to provid<strong>in</strong>g wholesale services, with Vodafone as its<br />
primary customer, Vector has also announced it is deliver<strong>in</strong>g its own broadband services,<br />
deliver<strong>in</strong>g 2 Mbps download speeds and 1 Mbps upload speeds. 41 NZ Communications,<br />
previously Econet Wireless <strong>New</strong> Zealand, is roll<strong>in</strong>g out a third national 3G mobile<br />
network, which will cover 80 per cent of <strong>the</strong> population. 42<br />
There are also a range of smaller providers that are launch<strong>in</strong>g new services <strong>in</strong> <strong>New</strong><br />
Zealand’s broadband market. Woosh Wireless provides wireless broadband and call<strong>in</strong>g<br />
<strong>in</strong> Auckland, Well<strong>in</strong>gton, Canterbury and Southland. Citil<strong>in</strong>k provides a network of<br />
s<strong>in</strong>glemode fibre to build<strong>in</strong>gs, rolled out <strong>in</strong> a mesh architecture, enabl<strong>in</strong>g fast<br />
communication l<strong>in</strong>ks between users <strong>in</strong> Well<strong>in</strong>gton’s CBD. The company is also build<strong>in</strong>g a<br />
new fibre network <strong>in</strong> Auckland’s CBD. 43 ThePacific.net provides a range of broadband<br />
packages offer<strong>in</strong>g up to 2 Mbps download and upload speeds <strong>in</strong> <strong>the</strong> upper South Island.<br />
In addition, ThePacific.net is actively promot<strong>in</strong>g itself as an option for deploy<strong>in</strong>g fibre to<br />
<strong>the</strong> home (FTTH) broadband <strong>in</strong> new developments outside of urban areas. The company<br />
has recently <strong>in</strong>stalled a high speed fibre network <strong>in</strong> a retirement village <strong>in</strong> Stoke and is<br />
currently bidd<strong>in</strong>g for several o<strong>the</strong>r FTTH projects. The company has also <strong>in</strong>stalled<br />
private wireless networks for m<strong>in</strong><strong>in</strong>g companies on <strong>the</strong> South Island. 44<br />
While this summary is not exhaustive, <strong>the</strong> activities of <strong>the</strong>se private firms demonstrate<br />
that <strong>the</strong>re is an appetite by profit maximis<strong>in</strong>g entrepreneurs to enter <strong>the</strong> market and<br />
supply services <strong>in</strong> areas where <strong>the</strong>y see profit opportunities—irrespective of whe<strong>the</strong>r<br />
government support is available. In some cases, firms have made commercial decisions<br />
not to apply for government support. For example, ThePacific.net recently stated that it<br />
decided aga<strong>in</strong>st apply<strong>in</strong>g for government fund<strong>in</strong>g because it prefers to provide services<br />
over private fibre networks ra<strong>the</strong>r than supply services through open access 45 —which is<br />
often a condition of receiv<strong>in</strong>g government fund<strong>in</strong>g.<br />
The <strong>in</strong>vestment plans described above are <strong>in</strong> addition to <strong>in</strong>frastructure already <strong>in</strong> place.<br />
Almost all <strong>New</strong> Zealanders can access some form of broadband now, whe<strong>the</strong>r it be<br />
through a DSL connection, HFC or optical fibre, wireless or mobile broadband, or<br />
satellite. The <strong>in</strong>vestments detailed above will deliver huge improvements <strong>in</strong> <strong>the</strong> quality of<br />
broadband services available <strong>in</strong> <strong>New</strong> Zealand. As a result many more users will be able to<br />
access high speed broadband than is currently <strong>the</strong> case.<br />
39 <strong>New</strong> Zealand Herald, 27 October 2008. “Super-fast <strong>Broadband</strong> for CBDs – at a price”<br />
40 Vector media release, 14 February 2008. “Vector announces fibre optic network extension”<br />
41 Vector media release, 26 April 2008. “Vector Communications launches Inf<strong>in</strong>ite <strong>Broadband</strong>”<br />
42<br />
“Work starts on third mobile network” The Dom<strong>in</strong>ion Post | Monday, 17 December 2007<br />
43 Citil<strong>in</strong>k http://www.cityl<strong>in</strong>k.co.nz/<strong>in</strong>formation/locations/network-map.html (accessed 28 October, 2008)<br />
44 The Dom<strong>in</strong>ion Post, 20 October 2008. “Retirees log on with fibre optics”<br />
45 The Dom<strong>in</strong>ion Post, 20 October 2008. “Retirees log on with fibre optics”<br />
37
4.2 Projected Demand for Internet Based Applications<br />
The most “bandwidth hungry” applications currently available are those that deliver<br />
video content. Demand for higher bandwidth <strong>the</strong>refore will likely come <strong>from</strong> users that<br />
want to use enterta<strong>in</strong>ment based applications, <strong>in</strong>clud<strong>in</strong>g:<br />
• “Web 2.0” applications, such as YouTube and social network<strong>in</strong>g sites like<br />
Facebook<br />
• Interactive TV and gam<strong>in</strong>g<br />
• IPTV - multicast<br />
• Video on Demand - Real Time<br />
• HDTV - multicast<br />
• Two-way HDTV (used <strong>in</strong> eEducation and eHealth)<br />
• HD Video conferenc<strong>in</strong>g; and<br />
• Telepresence<br />
Given <strong>the</strong>se applications require greater bandwidth to operate effectively, <strong>the</strong>y will only<br />
be available to users who choose to pay more for faster broadband packages. They are<br />
<strong>the</strong>refore generally regarded as “premium content”.<br />
There is considerable uncerta<strong>in</strong>ty over <strong>the</strong> size of <strong>the</strong> market for premium content<br />
applications. For example, <strong>the</strong> recent report by Covec and o<strong>the</strong>rs on <strong>the</strong> broadband<br />
market <strong>in</strong> Auckland found that a divergence exists between different types of households<br />
and <strong>the</strong> envisioned benefits of high speed broadband. The Covec report found that<br />
higher <strong>in</strong>come groups were more likely to suggest “remote learn<strong>in</strong>g” and “work<strong>in</strong>g <strong>from</strong><br />
home”—activities that can be accommodated us<strong>in</strong>g current broadband technology—as<br />
<strong>the</strong> greatest opportunities offered by high speed broadband. In contrast, enterta<strong>in</strong>ment<br />
options, such as watch<strong>in</strong>g videos and download<strong>in</strong>g music, and social connectivity, such<br />
as mak<strong>in</strong>g phone calls and shar<strong>in</strong>g photos or videos, were more popular among lower<br />
<strong>in</strong>come households. 46<br />
4.3 What Users are Likely to Get under <strong>the</strong> Counterfactual<br />
Private <strong>in</strong>vestment <strong>in</strong> broadband is go<strong>in</strong>g to deliver considerable benefits to <strong>New</strong><br />
Zealanders over <strong>the</strong> next two to three years. Figure 4.2 illustrates how we expect <strong>the</strong><br />
supply cha<strong>in</strong> for deliver<strong>in</strong>g broadband will develop under <strong>the</strong> counterfactual. The<br />
counterfactual will deliver considerable improvements <strong>in</strong> <strong>the</strong> core and local access parts<br />
of <strong>the</strong> supply cha<strong>in</strong>.<br />
Putt<strong>in</strong>g toge<strong>the</strong>r <strong>the</strong> <strong>in</strong>vestment plans outl<strong>in</strong>ed above, we estimate that by 2012 at least<br />
80 percent of <strong>New</strong> Zealanders will have access to broadband services capable of<br />
download speeds of between 10 Mbps and 20 Mbps, and upload speeds of at least 1<br />
Mbps. Provided no o<strong>the</strong>r barriers exist, this will enable users to access almost all<br />
currently available Internet applications, at a good quality of service. The ma<strong>in</strong> exceptions<br />
will be two-way high def<strong>in</strong>ition video applications, such as high def<strong>in</strong>ition videoconferenc<strong>in</strong>g<br />
and telepresence, which will not be widely accessible under <strong>the</strong><br />
counterfactual.<br />
46 Small,J., A. Beer, C. Sweetman, D. Fougere, and C. Birch (2008) “Open Access <strong>Broadband</strong> <strong>in</strong> Auckland: Demand, Costs<br />
and Benefits” Report by Covec, Teleconsultants and Phoenix Research for <strong>the</strong> Auckland Regional <strong>Broadband</strong><br />
Advisory Group<br />
38
Bus<strong>in</strong>esses located <strong>in</strong> <strong>the</strong> central bus<strong>in</strong>ess districts of most <strong>New</strong> Zealand cities currently<br />
have access to fibre to <strong>the</strong> premises as a result of <strong>the</strong> <strong>in</strong>vestments of Telecom,<br />
TelstraClear, and o<strong>the</strong>r smaller providers, and <strong>the</strong>refore can access download and upload<br />
speeds of approximately 100 Mbps. Where this is not <strong>the</strong> case, bus<strong>in</strong>esses located <strong>in</strong><br />
central bus<strong>in</strong>ess districts will have access to download speeds of at least 30 Mbps and<br />
upload speeds of 7 Mbps through TelstraClear’s new VDSL2 service.<br />
In section 2.1 we identified a range of constra<strong>in</strong>ts that can impact on <strong>the</strong> actual level of<br />
service users experience. We believe <strong>the</strong> follow<strong>in</strong>g constra<strong>in</strong>ts will rema<strong>in</strong> under <strong>the</strong><br />
counterfactual:<br />
• The capability of hardware—that is <strong>in</strong>ternal wir<strong>in</strong>g, computers, and o<strong>the</strong>r<br />
devices—with<strong>in</strong> <strong>the</strong> user’s premises<br />
• The cost of <strong>in</strong>ternational backhaul. Prices for capacity on <strong>the</strong> Sou<strong>the</strong>rn Cross<br />
Cable recently dropped by at least 44 percent, 47 which should make a positive<br />
difference <strong>in</strong> <strong>the</strong> foreseeable future. However, it is difficult to predict how<br />
prices for <strong>in</strong>ternational capacity will change <strong>in</strong> <strong>the</strong> future as demand for<br />
<strong>in</strong>ternational capacity cont<strong>in</strong>ues to <strong>in</strong>crease.<br />
If <strong>in</strong>itiatives to negotiate new <strong>in</strong>terconnection standards for low latency applications,<br />
such as voice or videoconferenc<strong>in</strong>g over <strong>the</strong> Internet, are successful, this should deliver<br />
substantial quality improvements for users of <strong>the</strong>se services.<br />
Figure 4.2: Development of <strong>the</strong> Counterfactual on <strong>the</strong> Supply Cha<strong>in</strong><br />
Customer end<br />
hardware: still<br />
a bottleneck<br />
Local access:<br />
Improvements <strong>in</strong><br />
broadband service<br />
quality; high speed<br />
broadband to 80%<br />
<strong>High</strong> costs of<br />
<strong>in</strong>ternational backhaul<br />
& peer<strong>in</strong>g still likely to<br />
be a factor<br />
Modem<br />
Local<br />
backhaul<br />
Local IP<br />
cloud<br />
Core<br />
network<br />
International<br />
gateway<br />
International<br />
backhaul<br />
Customer<br />
equipment<br />
Internal<br />
wir<strong>in</strong>g<br />
Core network:<br />
Capacity<br />
improvements<br />
Key:<br />
Optical fibre<br />
Copper<br />
“Last mile”<br />
Street<br />
cab<strong>in</strong>et<br />
Local access<br />
network<br />
Internal wir<strong>in</strong>g<br />
47 “Bold Steps to Support Hi-<strong>Speed</strong> <strong>Broadband</strong>”, Press Release: Sou<strong>the</strong>rn Cross Cable Network, 3 November 2008.<br />
39
5 Incremental Benefits and Costs of Subsidis<strong>in</strong>g<br />
<strong>Broadband</strong><br />
In this section, we compare <strong>the</strong> proposal to subsidise <strong>the</strong> roll-out of fibre to <strong>the</strong> home to<br />
75 percent of <strong>New</strong> Zealanders to <strong>the</strong> counterfactual described <strong>in</strong> <strong>the</strong> previous section.<br />
We also review <strong>the</strong> <strong>New</strong> Zealand Institute’s analysis of <strong>the</strong> potential benefits <strong>from</strong> high<br />
speed broadband. We use <strong>the</strong> results of this analysis to draw conclusions on:<br />
• The <strong>in</strong>cremental benefits and costs of government <strong>in</strong>tervention to promote<br />
high speed broadband, and<br />
• The opportunities for greatest potential ga<strong>in</strong>s <strong>from</strong> government <strong>in</strong>tervention,<br />
and where <strong>the</strong>y are <strong>in</strong> <strong>the</strong> broadband supply cha<strong>in</strong>.<br />
5.1 Proposed <strong>Broadband</strong> Policy: Wide Scale Roll-out of Fibre to <strong>the</strong><br />
Premises<br />
Table 5.1 summarises <strong>the</strong> key elements of <strong>the</strong> Governments proposed broadband policy.<br />
The “Better <strong>Broadband</strong> for <strong>New</strong> Zealand” policy statement commits $1.5 billion of<br />
public <strong>in</strong>vestment, alongside expected private sector <strong>in</strong>vestment, to accelerate <strong>the</strong><br />
coverage of FTTH to 75 percent of <strong>New</strong> Zealanders. The policy also commits $48<br />
million to accelerate <strong>the</strong> roll out of broadband services <strong>in</strong> rural and remote areas of <strong>New</strong><br />
Zealand.<br />
Table 5.1: Public Investment <strong>in</strong> <strong>High</strong> <strong>Speed</strong> <strong>Broadband</strong><br />
Policy<br />
Better <strong>Broadband</strong> for <strong>New</strong><br />
Zealand<br />
Amount of Public<br />
Funds Committed to<br />
Subsidis<strong>in</strong>g <strong>High</strong><br />
<strong>Speed</strong> <strong>Broadband</strong><br />
Mode of <strong>High</strong><br />
<strong>Speed</strong> <strong>Broadband</strong><br />
Delivery<br />
Period of<br />
Fund<strong>in</strong>g<br />
NZ $1.5 billion Fibre to <strong>the</strong> Home Five Years<br />
Extended <strong>Broadband</strong><br />
Challenge Fund (Rural and<br />
Regional areas of <strong>New</strong><br />
Zealand)<br />
NZ $48 million<br />
Will fund a mix of<br />
fibre, satellite and<br />
wireless technologies<br />
These policy proposals are based on <strong>the</strong> follow<strong>in</strong>g pr<strong>in</strong>ciples 48 :<br />
• The public <strong>in</strong>vestment should not provide undue advantage to exist<strong>in</strong>g<br />
broadband network providers<br />
• The FTTH network is to be open-access so that many service providers can<br />
compete to provide broadband services over it<br />
• Excessive duplication of <strong>the</strong> network should be avoided<br />
• “Everyday Kiwis” should receive affordable world class broadband services<br />
• The public-private partnership engaged to deliver FTTH must be focused on<br />
<strong>New</strong> Zealand’s economic future and not on legacy assets.<br />
48 National Policy Statement “Better <strong>Broadband</strong> for <strong>New</strong> Zealand”<br />
40
5.2 Compar<strong>in</strong>g Access to Applications under <strong>the</strong> Government’s<br />
Proposed Policy to <strong>the</strong> Counterfactual<br />
The Better <strong>Broadband</strong> policy does not appear to specify where <strong>the</strong> FTTH roll-out would<br />
occur. We assume that <strong>the</strong> FTTH roll out will occur first where fibre is relatively cheap<br />
to deploy, that is <strong>in</strong> areas with high population densities. Accord<strong>in</strong>gly we assume that<br />
coverage of FTTH under <strong>the</strong> Government’s proposals will extend to urban centres,<br />
towns and regions, similar to <strong>the</strong> coverage of Telecom’s cab<strong>in</strong>etisation programme.<br />
Based on this assumption, <strong>the</strong> policy will deliver an upgrade <strong>from</strong> <strong>the</strong> services available<br />
under <strong>the</strong> counterfactual to <strong>the</strong> much higher level of broadband service that fibre can<br />
provide, for <strong>the</strong> 75 percent of users located <strong>in</strong> more densely populated parts of <strong>the</strong><br />
country.<br />
Thus <strong>the</strong> <strong>in</strong>cremental benefits <strong>from</strong> <strong>the</strong> Government’s proposals derive <strong>from</strong> <strong>the</strong><br />
difference <strong>in</strong> <strong>the</strong> quality of users’ broadband experiences <strong>in</strong> mov<strong>in</strong>g <strong>from</strong> ADSL2+,<br />
VDSL or wireless <strong>in</strong>ternet to fibre to <strong>the</strong> premise. There are two dimensions to this:<br />
• Affected users will be able to access those applications not supported by <strong>the</strong><br />
counterfactual, <strong>in</strong> particular two-way high def<strong>in</strong>ition video applications, such<br />
as high def<strong>in</strong>ition video-conferenc<strong>in</strong>g and telepresence 49<br />
• The quality of broadband service users experience <strong>in</strong> us<strong>in</strong>g Internet<br />
applications will be much greater if all <strong>the</strong> o<strong>the</strong>r factors <strong>in</strong> <strong>the</strong> value cha<strong>in</strong> have<br />
also been addressed. This will be particularly noticeable for users of<br />
applications such as YouTube, Facebook, gam<strong>in</strong>g applications, and real time<br />
video or television.<br />
5.3 Review of Benefits <strong>from</strong> <strong>the</strong> <strong>New</strong> Zealand Institute Analysis<br />
As we discussed earlier <strong>in</strong> this report, <strong>the</strong> <strong>New</strong> Zealand Institute has published several<br />
reports <strong>in</strong>clud<strong>in</strong>g assessments of <strong>the</strong> benefits to <strong>New</strong> Zealand <strong>from</strong> br<strong>in</strong>g<strong>in</strong>g forward<br />
<strong>in</strong>vestment <strong>in</strong> high speed broadband, and specifically roll<strong>in</strong>g out fibre to <strong>the</strong> home for 75<br />
percent of <strong>New</strong> Zealanders. The Institute’s f<strong>in</strong>d<strong>in</strong>gs have been widely used by<br />
commentators and policy makers to justify <strong>the</strong> case for public <strong>in</strong>vestment <strong>in</strong> broadband.<br />
It is <strong>the</strong>refore important that we exam<strong>in</strong>e <strong>the</strong> Institute’s analysis here, to form our own<br />
assessment of how <strong>the</strong>se estimated benefits stack up aga<strong>in</strong>st <strong>the</strong> costs.<br />
If we are to accept <strong>the</strong> Institute’s analysis, <strong>the</strong> estimated potential benefits for <strong>New</strong><br />
Zealand, <strong>in</strong> absolute terms, <strong>from</strong> deploy<strong>in</strong>g FTTH to 75 percent of <strong>New</strong> Zealanders is<br />
between $2.7 and $4.4 billion per year. The Institute also estimated <strong>the</strong> benefits of <strong>the</strong><br />
counterfactual we have described to be between $0.9–$1.5 billion per year. 50 Based on<br />
<strong>the</strong> Institute’s estimates, <strong>the</strong> potential <strong>in</strong>cremental benefits <strong>from</strong> factual could be <strong>in</strong> <strong>the</strong><br />
range of $1.5 to $3.5 billion per year (see Table 5.2 over <strong>the</strong> page).<br />
The Institute suggests that <strong>the</strong> annual benefit stream <strong>from</strong> <strong>the</strong> deployment of FTTH will<br />
come <strong>from</strong> six specific types of use. Table 5.2 sets out <strong>the</strong> annual <strong>in</strong>cremental benefits<br />
<strong>from</strong> each of <strong>the</strong>se usage categories, based on <strong>the</strong> Institute’s estimates, key assumptions<br />
that underp<strong>in</strong> <strong>the</strong>se calculations; and our assessment of how realistic <strong>the</strong>se estimated<br />
<strong>in</strong>cremental benefits are.<br />
49 As we discuss below, to access to this type of application, <strong>in</strong> particular telepresence, users must have <strong>the</strong> right<br />
equipment. This can <strong>in</strong>volve a potential large <strong>in</strong>vestment for users.<br />
50 As <strong>the</strong> table <strong>in</strong>dicates, <strong>the</strong> Institute considers that <strong>the</strong>se benefits <strong>from</strong> <strong>the</strong> counterfactual will come <strong>from</strong> at least<br />
partial realisation of estimated benefits <strong>from</strong> uses <strong>in</strong> health and remote work<strong>in</strong>g.<br />
41
Table 5.2: Estimated Annual Incremental Benefits <strong>from</strong> FTTH by Type of Use<br />
Assumptions <strong>Castalia</strong> Assessment Impact of bottlenecks<br />
Sector Benefits NZI<br />
($m) (1)<br />
Estimate<br />
(under <strong>the</strong> factual)<br />
Telepresence • Reduces travel costs and<br />
out of office time<br />
• Potential growth by<br />
<strong>in</strong>creas<strong>in</strong>g sales force<br />
productivity<br />
Digital<br />
media<br />
• <strong>High</strong> speed broadband<br />
will <strong>in</strong>crease <strong>the</strong><br />
productivity of “creative<br />
companies”<br />
260–430 • Requires sufficient roll out to<br />
allow 500 large bus<strong>in</strong>esses and<br />
5000 small bus<strong>in</strong>esses to take<br />
up telepresence<br />
680–1030 • Requires digital media<br />
production houses to have<br />
very fast, two-way, broadband<br />
to enable transfer of very large<br />
files (nationally and<br />
<strong>in</strong>ternationally). This would<br />
require, say, 70+Mbps<br />
• Large bus<strong>in</strong>esses are already<br />
connected to fibre<br />
• <strong>Most</strong> medium term bus<strong>in</strong>esses will<br />
be connected to fibre under<br />
counterfactual if located <strong>in</strong> ma<strong>in</strong><br />
commercial areas<br />
• Telepresence requires very high<br />
level of customer site <strong>in</strong>vestment. It<br />
is very unlikely that telepresence will<br />
be viable for small bus<strong>in</strong>esses over<br />
<strong>the</strong> next 10 years<br />
• We assess no difference between<br />
<strong>the</strong> factual and <strong>the</strong> counterfactual,<br />
and hence no benefit<br />
• Digital media production houses are<br />
likely to be located <strong>in</strong> ma<strong>in</strong><br />
commercial areas, where <strong>the</strong>y can<br />
already access fibre<br />
• To <strong>the</strong> extent that file transfer is a<br />
problem under <strong>the</strong> counterfactual,<br />
congestion <strong>in</strong> <strong>the</strong> core or backhaul<br />
networks is a more likely cause than<br />
<strong>the</strong> access network<br />
• We assess no difference between<br />
<strong>the</strong> factuals and <strong>the</strong> counterfactual,<br />
and hence no benefit<br />
• The cost <strong>in</strong>ternational<br />
capacity will affect <strong>the</strong><br />
cost and quality of<br />
<strong>in</strong>ternational<br />
telepresence meet<strong>in</strong>gs.<br />
• This is likely to reduce<br />
estimated benefits<br />
<strong>from</strong> telepresence<br />
replac<strong>in</strong>g <strong>in</strong>ternational<br />
travel<br />
• The cost of<br />
<strong>in</strong>ternational capacity<br />
will still be a factor,<br />
and may reduce <strong>the</strong><br />
estimated benefits<br />
42
Assumptions <strong>Castalia</strong> Assessment Impact of bottlenecks<br />
Sector Benefits NZI<br />
($m) (1)<br />
Estimate<br />
(under <strong>the</strong> factual)<br />
Storage and<br />
Manipulation<br />
of Data<br />
Remote<br />
Work<strong>in</strong>g and<br />
Healthcare (2)<br />
Institute identifies this as a<br />
potential growth market for<br />
<strong>New</strong> Zealand<br />
Remote Work<strong>in</strong>g:<br />
• Increased workforce<br />
participation<br />
• Reduced travel costs<br />
200–500 Assumptions <strong>in</strong>clude:<br />
• 5 (new) data centres <strong>in</strong> NZ<br />
• NZ captures 50% of growth<br />
of hosted application<br />
management and<br />
<strong>in</strong>frastructure management<br />
0–1010 Remote Work<strong>in</strong>g:<br />
• Full benefits are based on<br />
100% white collar workers<br />
tak<strong>in</strong>g up remote work<strong>in</strong>g, that<br />
is an additional 950,000<br />
workers<br />
• Assumes extra 35,000 white<br />
collar workers aged 65+yrs<br />
beg<strong>in</strong> remote work<strong>in</strong>g<br />
• S<strong>in</strong>ce fibre to <strong>the</strong> premises is already<br />
available <strong>in</strong> ma<strong>in</strong> bus<strong>in</strong>ess centres,<br />
<strong>the</strong>re are no barriers <strong>in</strong> <strong>the</strong> access<br />
network to <strong>the</strong> creation of data<br />
storage centres<br />
• We assess no difference between<br />
<strong>the</strong> factual and <strong>the</strong> counterfactual,<br />
and hence no benefit<br />
Remote Work<strong>in</strong>g:<br />
• Applications required for remote<br />
work<strong>in</strong>g, <strong>in</strong>clud<strong>in</strong>g<br />
videoconferenc<strong>in</strong>g and file<br />
exchange, will be useable over<br />
ADSL2+ and VDSL. We assess no<br />
difference <strong>in</strong> access to required<br />
applications between <strong>the</strong><br />
counterfactual and <strong>the</strong> factuals<br />
• There is little evidence that remote<br />
work<strong>in</strong>g reduces travel costs.<br />
Remote work<strong>in</strong>g is often a daily<br />
addition to on-site work<strong>in</strong>g. We<br />
assess very m<strong>in</strong>or differences<br />
between <strong>the</strong> factual and <strong>the</strong><br />
counterfactual <strong>in</strong> travel costs<br />
• Benefits unlikely to exceed $100<br />
million<br />
• Costs of <strong>in</strong>ternational<br />
capacity may reduce<br />
<strong>New</strong> Zealand’s<br />
competitiveness <strong>in</strong><br />
provid<strong>in</strong>g data<br />
warehous<strong>in</strong>g for<br />
offshore customers<br />
• Customers’ <strong>in</strong>ternal<br />
wir<strong>in</strong>g, and <strong>the</strong><br />
capacity of <strong>the</strong>ir<br />
computers, will limit<br />
<strong>the</strong> perceived value of<br />
fibre to <strong>the</strong> home,<br />
which may reduce <strong>the</strong><br />
total estimated<br />
benefits<br />
43
Assumptions <strong>Castalia</strong> Assessment Impact of bottlenecks<br />
Sector Benefits NZI<br />
($m) (1)<br />
Estimate<br />
(under <strong>the</strong> factual)<br />
Education<br />
Healthcare:<br />
• Better access to medical<br />
records (through ability to<br />
transmit large files<br />
quickly)<br />
• Preventative care<br />
• Better patient monitor<strong>in</strong>g<br />
• Improved<br />
communications<br />
• Reduced professional<br />
tra<strong>in</strong><strong>in</strong>g courses<br />
• Potential for export of<br />
education services<br />
(Remote learn<strong>in</strong>g)<br />
Total 1490–3470<br />
Healthcare:<br />
Assumes send<strong>in</strong>g data files as<br />
large as 240 MB<br />
Healthcare:<br />
• Majority of healthcare facilities<br />
already located with<strong>in</strong> reach of fibre<br />
to <strong>the</strong> premises<br />
• Low take up is a function of<br />
affordability, not lack of<br />
<strong>in</strong>frastructure<br />
• The factual is unlikely to differ <strong>from</strong><br />
<strong>the</strong> counterfactual<br />
350–500 • <strong>Most</strong> high schools, universities and<br />
o<strong>the</strong>r tertiary tra<strong>in</strong><strong>in</strong>g <strong>in</strong>stitutions<br />
are already with<strong>in</strong> reach of fibre to<br />
<strong>the</strong> premises<br />
• Export of education services does<br />
not require fibre to <strong>the</strong> home<br />
• We estimate no difference between<br />
<strong>the</strong> factual and <strong>the</strong> counterfactual<br />
Export of eEducation<br />
services may be<br />
constra<strong>in</strong>ed by <strong>the</strong> cost<br />
and capacity of<br />
<strong>in</strong>ternational backhaul <strong>in</strong><br />
<strong>the</strong> future<br />
Note: (1) The benefits shown are <strong>in</strong>cremental benefits, that is <strong>the</strong> <strong>New</strong> Zealand Institute’s estimated absolute benefits, less <strong>the</strong> benefits <strong>the</strong> Institute consider<br />
will accrue under <strong>the</strong> counterfactual.<br />
(2) The <strong>New</strong> Zealand Institute estimates absolute benefits <strong>from</strong> remote work<strong>in</strong>g of $610 million to $810 million per annum, and <strong>from</strong> health of $620<br />
million to $1100 million. The Institute estimates <strong>the</strong> counterfactual will deliver $900 million to $1500 million of <strong>the</strong>se benefits, across health and remote<br />
work<strong>in</strong>g.<br />
44
From <strong>the</strong> Institute’s analysis, <strong>the</strong> greatest benefits are expected to be delivered by<br />
bus<strong>in</strong>esses (digital media and data storage and manipulation), followed by education and<br />
telepresence. However, secur<strong>in</strong>g <strong>the</strong>se benefits ei<strong>the</strong>r does not require wide deployment<br />
of FTTH, or <strong>the</strong> benefits will be prevented by factors which are not addressed ei<strong>the</strong>r<br />
under ei<strong>the</strong>r <strong>the</strong> counterfactual or <strong>the</strong> factual. To <strong>the</strong> extent that <strong>the</strong> benefits require fibre<br />
to <strong>the</strong> bus<strong>in</strong>ess, most bus<strong>in</strong>esses located <strong>in</strong> ma<strong>in</strong> commercial areas will readily have access<br />
to such opportunities under <strong>the</strong> counterfactual. To <strong>the</strong> extent <strong>the</strong> benefits depend on<br />
o<strong>the</strong>r parts of <strong>the</strong> supply cha<strong>in</strong> that are <strong>the</strong>mselves constra<strong>in</strong>ed, <strong>the</strong>re will be no, or<br />
limited, benefit <strong>from</strong> FTTH.<br />
Similarly <strong>the</strong> benefits <strong>the</strong> Institute suggests will come <strong>from</strong> education and health would<br />
most effectively be captured by deploy<strong>in</strong>g fibre to schools and hospitals ra<strong>the</strong>r than<br />
through a roll out of FTTH. <strong>Most</strong> of that deployment can occur under <strong>the</strong><br />
counterfactual.<br />
Health and remote work<strong>in</strong>g appear to be <strong>the</strong> only areas where <strong>the</strong> deployment of FTTH<br />
to 75 percent of <strong>New</strong> Zealanders would be required to secure <strong>the</strong> benefits. However, <strong>the</strong><br />
Institute states that significant benefits (between $900 and $1500 million each year) will<br />
be captured under <strong>the</strong> counterfactual we have identified, through Telecom’s FTTC roll<br />
out, and <strong>the</strong>refore do not require FTTH. 51<br />
It <strong>the</strong>refore appears that <strong>the</strong> majority of <strong>the</strong> economic value to be ga<strong>in</strong>ed, which <strong>the</strong><br />
Institute associates with <strong>the</strong> deployment of FTTH, could <strong>in</strong> fact be captured by a more<br />
targeted deployment of fibre to premises of bus<strong>in</strong>esses, schools and hospitals ra<strong>the</strong>r than<br />
through a full deployment of FTTH to retail users.<br />
Overall, a l<strong>in</strong>e-by-l<strong>in</strong>e review of <strong>the</strong> Institute’s analysis of benefits <strong>from</strong> FTTH shows<br />
that most of <strong>the</strong> estimated benefits will largely be available—should bus<strong>in</strong>esses and<br />
households choose to <strong>in</strong>vest <strong>in</strong> <strong>the</strong> necessary customer-premises hardware—under <strong>the</strong><br />
counterfactual.<br />
Importantly, it is clear <strong>from</strong> a detailed review of <strong>the</strong> Institute’s f<strong>in</strong>d<strong>in</strong>gs that for <strong>New</strong><br />
Zealand to obta<strong>in</strong> many of <strong>the</strong> benefits <strong>from</strong> high speed broadband:<br />
• The cost of <strong>in</strong>ternational capacity will need to come down (or will<strong>in</strong>gness to<br />
pay for high speed data transmissions <strong>in</strong>crease), and<br />
• We will need to address <strong>the</strong> bottleneck created by <strong>the</strong> capacity of many<br />
customers’ <strong>in</strong>ternal wir<strong>in</strong>g, computers, and o<strong>the</strong>r hardware.<br />
5.3.1 Conclusion on <strong>in</strong>cremental benefits<br />
Estimat<strong>in</strong>g public benefits <strong>from</strong> activities such as eHealth and eEducation is <strong>in</strong>credibly<br />
speculative. However, by focus<strong>in</strong>g our analysis on access to applications we can focus on<br />
<strong>the</strong> real differences between <strong>the</strong> factual and <strong>the</strong> counterfactual. When we look at <strong>the</strong><br />
current and emerg<strong>in</strong>g applications, it is strik<strong>in</strong>g that <strong>the</strong> key differences between <strong>the</strong><br />
counterfactual and <strong>the</strong> factual lie <strong>in</strong> improved access to high def<strong>in</strong>ition television services.<br />
To <strong>the</strong> extent that <strong>the</strong>se services are ma<strong>in</strong>ly used for enterta<strong>in</strong>ment purposes, it is<br />
difficult to see what public benefits may arise. For health and education services, <strong>the</strong><br />
<strong>in</strong>cremental public benefit <strong>in</strong> mov<strong>in</strong>g <strong>from</strong> us<strong>in</strong>g ord<strong>in</strong>ary videoconferenc<strong>in</strong>g to us<strong>in</strong>g<br />
high def<strong>in</strong>ition videoconferenc<strong>in</strong>g may be small. In any case, high levels of consumer site<br />
<strong>in</strong>vestment which would be required to take advantage of this benefit would likely<br />
preclude it <strong>from</strong> aris<strong>in</strong>g unless consumers perceived significant private benefits.<br />
51 The <strong>New</strong> Zealand Institute, March 2008. “Assess<strong>in</strong>g <strong>New</strong> Zealand’s Current <strong>Broadband</strong> Path: The Need For<br />
Change) www.nz<strong>in</strong>stitute.org (accessed, 28 October 2008)<br />
45
For example, imag<strong>in</strong>e a specific example of eHealth: ability to consult a specialist<br />
remotely, without hav<strong>in</strong>g to travel to a major centre. Such a consultation may require<br />
high quality videoconferenc<strong>in</strong>g facilities, enabl<strong>in</strong>g <strong>the</strong> specialist to observe <strong>the</strong> patient. It<br />
may also require <strong>in</strong>stantaneous test<strong>in</strong>g and transmission of diagnostic results. While such<br />
a remote consultation is easy to imag<strong>in</strong>e <strong>in</strong> pr<strong>in</strong>ciple, it is hard to imag<strong>in</strong>e it be<strong>in</strong>g<br />
conducted <strong>from</strong> home. The customer site teleconferenc<strong>in</strong>g facility, as well as <strong>the</strong><br />
diagnostic equipment, is likely to be too expensive for <strong>the</strong> household, as well as generally<br />
unnecessary. It is much easier to imag<strong>in</strong>e a patient travell<strong>in</strong>g to <strong>the</strong>ir nearest health<br />
centre, which will have <strong>the</strong> necessary facilities and <strong>the</strong> necessary high speed connection.<br />
5.4 Incremental Costs of Policy Factual<br />
In this section we discuss <strong>the</strong> types of costs associated with <strong>the</strong> deployment of high<br />
speed broadband. Williamson and Marks (2008) 52 usefully categorise <strong>the</strong>se costs as:<br />
• Costs for users and companies<br />
• Wider economic costs.<br />
5.4.1 Costs for users and companies<br />
Apart <strong>from</strong> pay<strong>in</strong>g for <strong>the</strong> service itself, users are likely to face additional costs <strong>in</strong> order<br />
to use high speed broadband. As we have discussed, this may <strong>in</strong>clude purchas<strong>in</strong>g new <strong>in</strong><br />
home equipment and upgrad<strong>in</strong>g writ<strong>in</strong>g <strong>in</strong> <strong>the</strong>ir homes, <strong>in</strong> particular <strong>in</strong> <strong>the</strong> case of older<br />
homes. Companies too will need to upgrade <strong>the</strong> ma<strong>in</strong> elements of <strong>the</strong>ir core networks to<br />
support <strong>the</strong> delivery of high speed broadband. Without address<strong>in</strong>g <strong>the</strong>se limitations,<br />
users would not be able to enjoy <strong>the</strong> benefits of high speed broadband.<br />
Where public <strong>in</strong>vestment accelerates <strong>the</strong> adoption of high speed broadband to <strong>the</strong> po<strong>in</strong>t<br />
where it displaces <strong>the</strong> ability to utilise current technologies, consumers will be forced to<br />
pay <strong>the</strong>se costs if <strong>the</strong>y want to use onl<strong>in</strong>e applications. 53 For example, if an FTTH<br />
network was built us<strong>in</strong>g exist<strong>in</strong>g trenches, and replac<strong>in</strong>g <strong>the</strong> current copper<br />
<strong>in</strong>frastructure, market participants would no longer be able to provide cheaper dial up or<br />
DSL services as it is not possible to provide <strong>the</strong>se services us<strong>in</strong>g fibre technology.<br />
5.4.2 Wider economic costs<br />
There are a number of wider economic costs associated with public <strong>in</strong>vestment<br />
subsidis<strong>in</strong>g <strong>the</strong> deployment of high speed broadband which we must consider:<br />
• Strand<strong>in</strong>g sunk <strong>in</strong>vestments: Exist<strong>in</strong>g <strong>in</strong>vestments are <strong>in</strong> effect written off<br />
or devalued, where public <strong>in</strong>vestment leads to <strong>the</strong> construction and purchase<br />
of new <strong>in</strong>frastructure and equipment that displaces exist<strong>in</strong>g assets prior to <strong>the</strong><br />
end of <strong>the</strong>ir economic life. This outcome, often referred to as “asset<br />
strand<strong>in</strong>g”, is a cost for all <strong>New</strong> Zealanders, not just for <strong>the</strong> shareholders of<br />
companies that own <strong>the</strong> <strong>in</strong>frastructure and equipment. The value of exist<strong>in</strong>g<br />
<strong>in</strong>frastructure and equipment to <strong>New</strong> Zealanders is <strong>in</strong> <strong>the</strong> benefits <strong>the</strong>y would<br />
forego if <strong>the</strong>se assets were no longer available to use<br />
52 Williamson, M. & Marks, P. (2008) “A Framework for Evaluat<strong>in</strong>g <strong>the</strong> Value of Next Generation <strong>Broadband</strong>: A Report to <strong>the</strong><br />
<strong>Broadband</strong> Stakeholder Group” PLUM Consult<strong>in</strong>g. We discuss <strong>the</strong> categorisation of costs and benefits fur<strong>the</strong>r <strong>in</strong><br />
Appendix B.<br />
53 A precedent for this occurr<strong>in</strong>g can be drawn with <strong>the</strong> proposed switch off of <strong>the</strong> analogue television network. The<br />
<strong>New</strong> Zealand has mandated that <strong>the</strong> analogue television network will be “switched off” once 75 per cent of<br />
households have digital television or by 2012, whichever is sooner. (<strong>New</strong> Zealand Government media release, 29<br />
November 2007)<br />
46
• Displac<strong>in</strong>g of private <strong>in</strong>vestment: Public <strong>in</strong>vestment which subsidises<br />
outcomes that would have o<strong>the</strong>rwise been delivered commercially effectively<br />
displaces private <strong>in</strong>vestment and <strong>the</strong>refore reduces economic activity. This<br />
represents a transfer of cost <strong>from</strong> <strong>the</strong> private sector to <strong>the</strong> taxpayer. As public<br />
funds are scarce, allocat<strong>in</strong>g public funds to outcomes that could be delivered<br />
commercially would also come at <strong>the</strong> cost of not fund<strong>in</strong>g—or fund<strong>in</strong>g to a<br />
lesser extent—o<strong>the</strong>r public policy priorities. 54<br />
There are also welfare costs associated with us<strong>in</strong>g taxpayers’ funds to pay for<br />
subsidies. For example, if <strong>the</strong> policy makers were forced to <strong>in</strong>crease taxes (or<br />
were unable to reduce taxes) because of <strong>the</strong> need to fund subsidies, we need<br />
to account for <strong>the</strong> deadweight loss <strong>from</strong> tax collection<br />
• Externality: Public <strong>in</strong>vestment <strong>in</strong> accelerat<strong>in</strong>g <strong>the</strong> deployment of high speed<br />
broadband will affect users and bus<strong>in</strong>esses <strong>in</strong> <strong>in</strong>direct ways. For example, <strong>the</strong><br />
lay<strong>in</strong>g of buried fibre may require roads to be closed and new trenches to be<br />
dug, caus<strong>in</strong>g road traffic congestion and disruption to people and bus<strong>in</strong>esses.<br />
Us<strong>in</strong>g this framework, we now turn to <strong>the</strong> <strong>in</strong>cremental costs associated with <strong>the</strong> policy<br />
factual.<br />
5.4.3 Incremental costs of <strong>the</strong> Policy Factual<br />
Figure 5.1 presents <strong>the</strong> components required to deliver a FTTH broadband network.<br />
Figure 5.1: Depiction of an FTTH Network<br />
The market is already deliver<strong>in</strong>g fibre to <strong>the</strong> cab<strong>in</strong>et (FTTC). Hence, <strong>the</strong> ma<strong>in</strong> cost <strong>in</strong><br />
deploy<strong>in</strong>g FTTH is <strong>in</strong> lay<strong>in</strong>g and connect<strong>in</strong>g fibre <strong>from</strong> <strong>the</strong> cab<strong>in</strong>et to <strong>the</strong> home (<strong>the</strong><br />
aggregation segment), replac<strong>in</strong>g <strong>the</strong> copper sub loop that market participants currently<br />
use to deliver broadband services. We understand that on current estimates this will cost<br />
approximately $6.2 billion (<strong>in</strong>clusive of <strong>the</strong> promise of public <strong>in</strong>vestment of $1.5 billion<br />
to fund FTTH). The Government’s proposal anticipates <strong>in</strong>vestment by market<br />
54 Economists refer to this as “opportunity cost”<br />
47
participants to provide <strong>the</strong> $4.7 billion difference between <strong>the</strong> proposed public subsidy<br />
and <strong>the</strong> total cost of FTTH.<br />
The key components of <strong>the</strong> total estimated cost of FTTH are presented below <strong>in</strong> Table<br />
5.3.<br />
Table 5.3: Components of Cost of Deliver<strong>in</strong>g FTTH<br />
Type of Cost<br />
Distribution costs<br />
Common equipment costs<br />
Basic house costs (not <strong>in</strong>clud<strong>in</strong>g <strong>in</strong>ternal<br />
house wir<strong>in</strong>g)<br />
Description of Components of Cost<br />
• Cost of fibre<br />
• Lay<strong>in</strong>g <strong>the</strong> fibre <strong>in</strong> exist<strong>in</strong>g distribution<br />
ducts<br />
• Project management costs.<br />
• An ONU (Optical Network Unit)<br />
term<strong>in</strong>ates <strong>the</strong> optical signals at <strong>the</strong> user side<br />
• A fibre splitter, which separates <strong>the</strong><br />
transmission fibre <strong>in</strong>to multiple fibres for<br />
delivery to street kerbs outside homes.<br />
• This <strong>in</strong>volves <strong>the</strong> connection of <strong>the</strong> fibre<br />
<strong>from</strong> <strong>the</strong> street (kerb) to <strong>the</strong> house. It<br />
<strong>in</strong>volves bury<strong>in</strong>g a fibre lead <strong>in</strong> to a HONT<br />
(Home Optical Network Term<strong>in</strong>at<strong>in</strong>g Unit)<br />
• Power is also required to operate <strong>the</strong><br />
HONT.<br />
While we have not been able to verify <strong>the</strong> total cost of roll<strong>in</strong>g-out of FTTH—and <strong>the</strong>re<br />
are certa<strong>in</strong>ly some who argue that new fibre lay<strong>in</strong>g techniques could reduce costs<br />
dramatically—it seems clear that <strong>the</strong> <strong>in</strong>frastructure costs will fall <strong>in</strong> <strong>the</strong> $3 billion to $6<br />
billion range.<br />
In addition to <strong>the</strong> above direct costs, <strong>the</strong> policy to subsidise <strong>the</strong> deployment of FTTH<br />
would have <strong>the</strong> follow<strong>in</strong>g additional costs:<br />
• Internal house wir<strong>in</strong>g and equipment upgrade: <strong>Most</strong> homes <strong>in</strong> <strong>New</strong><br />
Zealand cont<strong>in</strong>ue to operate with <strong>in</strong>ternal copper wir<strong>in</strong>g. As discussed above,<br />
unless upgraded, outdated <strong>in</strong>ternal house wir<strong>in</strong>g will restrict <strong>the</strong> ability of users<br />
to enjoy <strong>the</strong> full speed, capacity, and benefits offered by FTTH. Without an<br />
<strong>in</strong>ternal wir<strong>in</strong>g upgrade, <strong>the</strong> effects of FTTH on customer experience may not<br />
differ materially ADSL2+ and VDSL. At present, <strong>the</strong>re are no policy<br />
proposals to subsidise <strong>the</strong> upgrade of <strong>in</strong>ternal wir<strong>in</strong>g <strong>in</strong> users’ homes.<br />
Therefore, users will need to balance <strong>the</strong> cost of rewir<strong>in</strong>g <strong>the</strong>ir homes—<strong>in</strong><br />
addition to <strong>the</strong> cost of access<strong>in</strong>g high speed broadband—with <strong>the</strong> perceived<br />
benefits delivered by FTTH. We estimate that it would cost approximately<br />
$400 per home to upgrade wir<strong>in</strong>g and purchase <strong>in</strong> home equipment to ensure<br />
users receive <strong>the</strong> full benefits of FTTH once <strong>the</strong>y take it up. We present <strong>the</strong><br />
components of our cost estimate below.<br />
48
Table 5.4: Cost of Upgrad<strong>in</strong>g Internal House Wir<strong>in</strong>g and Equipment<br />
Cost Value ($)<br />
Rewir<strong>in</strong>g of house $300<br />
Internal equipment $108<br />
Cost per house $408<br />
Number of houses likely to be covered by<br />
Factual 2<br />
Total cost of replac<strong>in</strong>g <strong>in</strong>ternal house<br />
wir<strong>in</strong>g and equipment<br />
1,360,500 houses<br />
$555.1 million<br />
• Asset strand<strong>in</strong>g of exist<strong>in</strong>g sunk <strong>in</strong>vestments by market participants:<br />
Deployment of FTTH will displace <strong>the</strong> exist<strong>in</strong>g copper sub loop, owned by<br />
Telecom (Chorus), and currently accessed by all market participants <strong>in</strong><br />
deliver<strong>in</strong>g DSL based broadband services. Deployment of FTTH will also<br />
make redundant <strong>the</strong> equipment operat<strong>in</strong>g <strong>in</strong> cab<strong>in</strong>ets, known as DSLAMs,<br />
which have recently been upgraded by all market participants <strong>in</strong> order to<br />
enable <strong>the</strong>m to provide ADSL and VDSL high speed broadband services. All<br />
of <strong>the</strong> major market participants own and operate equipment of this type <strong>in</strong><br />
deliver<strong>in</strong>g <strong>the</strong>ir broadband services.<br />
Deployment of FTTH will also devalue TelstraClear’s sunk <strong>in</strong>vestment <strong>in</strong> its<br />
Hybrid Fibre Coax (HFC) network. The extent to which <strong>the</strong> HFC network<br />
may be devalued will depend on whe<strong>the</strong>r users choose to migrate <strong>from</strong> <strong>the</strong><br />
HFC network to new high speed broadband packages offered over FTTH. As<br />
most applications can currently be delivered effectively us<strong>in</strong>g <strong>the</strong> HFC<br />
network, users are likely to base <strong>the</strong>ir decision on <strong>the</strong> price of FTTH<br />
broadband packages relative <strong>the</strong> broadband packages offered by TelstraClear<br />
delivered though <strong>the</strong> HFC Network.<br />
FTTH will also devalue Vodafone’s sunk <strong>in</strong>vestment <strong>in</strong> its 3G Mobile<br />
<strong>Broadband</strong> Network and Telecom’s new <strong>in</strong>vestment <strong>in</strong> a WCDMA network,<br />
although to a lesser extent than for fixed l<strong>in</strong>e assets.<br />
• Non quantifiable costs: <strong>the</strong> deployment of FTTH will create externalities<br />
for users and bus<strong>in</strong>esses, as we described <strong>in</strong> section 5.4.2.<br />
• Risk of “gett<strong>in</strong>g it wrong”: Through act<strong>in</strong>g now and <strong>in</strong>vest<strong>in</strong>g <strong>in</strong> FTTH,<br />
<strong>New</strong> Zealand loses <strong>the</strong> option of wait<strong>in</strong>g to see how new technologies evolve,<br />
<strong>in</strong>creas<strong>in</strong>g <strong>the</strong> risk of “gett<strong>in</strong>g it wrong”. The deployment of FTTH may<br />
deliver benefits to <strong>New</strong> Zealand <strong>in</strong> <strong>the</strong> longer term. However, we suggest that<br />
<strong>the</strong>re is a large benefit attached to <strong>the</strong> option of wait<strong>in</strong>g to <strong>in</strong>vest <strong>in</strong> FTTH.<br />
As Williamson and Marks (2008) suggest, uncerta<strong>in</strong>ty on <strong>the</strong> types of benefits<br />
that can be delivered by FTTH will be reduced as new <strong>in</strong>ternet based<br />
applications, requir<strong>in</strong>g higher bandwidth and speed levels, are developed. In<br />
particular, <strong>the</strong> ma<strong>in</strong> uncerta<strong>in</strong>ty associated with deployment of FTTH—<br />
will<strong>in</strong>gness of users to pay for high speed broadband services—is likely to<br />
decl<strong>in</strong>e as <strong>in</strong>formation about will<strong>in</strong>gness to pay and take-up <strong>in</strong> relation to high<br />
49
speed broadband will expand considerably as more data becomes available<br />
<strong>from</strong> deployments of FTTC and FTTH trials <strong>in</strong> <strong>New</strong> Zealand and <strong>in</strong> o<strong>the</strong>r<br />
countries. In addition, as technologies develop fur<strong>the</strong>r, service providers will<br />
ga<strong>in</strong> more and better <strong>in</strong>formation on <strong>the</strong> optimal architecture for FTTH<br />
access networks. 55<br />
Overall, <strong>the</strong> total <strong>in</strong>cremental costs of <strong>the</strong> policy factual is likely to be well <strong>in</strong> excess of<br />
$6.0 billion.<br />
5.5 Comparison of Costs and Benefits<br />
We summarise <strong>the</strong> potential costs and benefits associated with <strong>the</strong> counterfactual and <strong>the</strong><br />
factual below <strong>in</strong> Table 5.5.<br />
55 Williamson, M. & Marks, P. (2008) “A Framework for Evaluat<strong>in</strong>g <strong>the</strong> Value of Next Generation <strong>Broadband</strong>: A Report to <strong>the</strong><br />
<strong>Broadband</strong> Stakeholder Group” PLUM Consult<strong>in</strong>g<br />
50
Table 5.5: Costs and Benefits of <strong>Broadband</strong> Scenarios—Summary<br />
Counterfactual<br />
Key features Benefits Costs<br />
• Delivery of high speed broadband with<br />
download speeds of between 10Mbps and<br />
20Mbps to 80% of <strong>New</strong> Zealanders<br />
• At least 80% of <strong>New</strong> Zealanders will be able<br />
to access all available <strong>in</strong>ternet based<br />
applications, accept for those that require<br />
high def<strong>in</strong>ition video content<br />
• Outcome delivered commercially without<br />
public <strong>in</strong>vestment distort<strong>in</strong>g market outcome<br />
• Based on estimates by The <strong>New</strong> Zealand<br />
Institute, <strong>the</strong> additional benefits stream <strong>from</strong><br />
Telecom <strong>New</strong> Zealand’s cab<strong>in</strong>etisation<br />
<strong>in</strong>vestment could be between $0.9 and $1.5<br />
billion.<br />
• Publically announced private <strong>in</strong>vestments by<br />
market participants total over $2.5 billion to<br />
2012<br />
• Ongo<strong>in</strong>g operat<strong>in</strong>g costs of new <strong>in</strong>vestments<br />
• Cost of externalities caused through<br />
“cab<strong>in</strong>etisation” process and o<strong>the</strong>r network<br />
<strong>in</strong>vestments.<br />
51
Key features Benefits Costs<br />
Policy factual • Objective to deliver FTTH network to 75%<br />
of <strong>New</strong> Zealanders over six years,<br />
commenc<strong>in</strong>g with health and education<br />
<strong>in</strong>stitutions and first tranche of homes.<br />
• Based on estimates made by The <strong>New</strong><br />
Zealand Institute, ultimately, National’s plan<br />
may deliver an <strong>in</strong>cremental benefits stream<br />
to <strong>the</strong> market led scenario of between $1.5<br />
and $2.9 billion (<strong>Castalia</strong> assesses <strong>the</strong><br />
<strong>in</strong>cremental benefits to be much lower)<br />
• Once implemented, 75% of <strong>New</strong> Zealanders<br />
will have access to 100 Mbps upload and<br />
download speeds—far <strong>in</strong> excess of <strong>the</strong><br />
required capacity to use any application<br />
currently available effectively<br />
• Users will benefit <strong>from</strong> higher broadband<br />
speed, capacity and network reliability than<br />
offered under ei<strong>the</strong>r <strong>the</strong> market led scenario<br />
or Labour’s policy<br />
• National’s policy provides users with <strong>the</strong><br />
ability to access all applications currently<br />
available, <strong>in</strong>clud<strong>in</strong>g ‘bandwidth hungry’<br />
applications<br />
• The excess speed and bandwidth capacity of<br />
FTTH means that it will cope with any new<br />
‘bandwidth hungry’ applications that come to<br />
market for <strong>the</strong> foreseeable future.<br />
• Deployment of FTTH estimated to be $6.0<br />
billion. 1.5 billion funded by taxpayers<br />
• Asset strand<strong>in</strong>g of exist<strong>in</strong>g network <strong>in</strong>vestments<br />
• Cost of upgrad<strong>in</strong>g <strong>in</strong>ternal house wir<strong>in</strong>g needed<br />
to secure benefits delivered by FTTH estimated<br />
as up to $555 million<br />
• Cost of externalities caused through network<br />
construction<br />
• Risk of “gett<strong>in</strong>g it wrong”.<br />
52
Our analysis suggests that simply deploy<strong>in</strong>g fibre to <strong>the</strong> premises to a wide group of users<br />
is unlikely to deliver <strong>the</strong> anticipated <strong>in</strong>cremental benefits, relative to what would occur<br />
under <strong>the</strong> counterfactual. Bottlenecks <strong>in</strong> o<strong>the</strong>r part of <strong>the</strong> broadband supply cha<strong>in</strong> would<br />
still constra<strong>in</strong> <strong>the</strong> potential benefits, while <strong>the</strong> costs of such a wide scale deployment<br />
would be extremely high. The key reasons for this f<strong>in</strong>d<strong>in</strong>g are:<br />
• A majority of broadband users are still demand<strong>in</strong>g low data cap (and<br />
lower cost) plans: The value <strong>New</strong> Zealanders place on broadband (and what<br />
it enables <strong>the</strong>m to do) currently rema<strong>in</strong>s relatively low. While will<strong>in</strong>gness to<br />
pay may <strong>in</strong>crease <strong>in</strong> <strong>the</strong> future (as we discussed <strong>in</strong> section 3.5) <strong>the</strong>re is<br />
considerable uncerta<strong>in</strong>ty over when, and to what extent. As a result, even if<br />
fibre to <strong>the</strong> home was available, many users may not take it up, or may not be<br />
prepared to pay prices that reflect <strong>the</strong> cost of provision<br />
• The market is deliver<strong>in</strong>g <strong>in</strong>vestment <strong>in</strong> high speed broadband without<br />
new public <strong>in</strong>vestment: Private companies have publically committed to<br />
<strong>in</strong>vest<strong>in</strong>g over $2.5 billion to 2012 56 <strong>in</strong> deploy<strong>in</strong>g high speed broadband and<br />
o<strong>the</strong>r communications based <strong>in</strong>frastructure. Each of <strong>the</strong> three ma<strong>in</strong> market<br />
participants provid<strong>in</strong>g broadband services <strong>in</strong> <strong>New</strong> Zealand has announced<br />
major <strong>in</strong>vestments directed at deliver<strong>in</strong>g high speed broadband services. This<br />
<strong>in</strong>dicates that <strong>the</strong> deployment of high speed broadband <strong>in</strong> <strong>New</strong> Zealand <strong>in</strong> <strong>the</strong><br />
short to medium term is likely to accelerate. In addition, a number of smaller<br />
private providers have entered <strong>the</strong> market, provid<strong>in</strong>g competitive high speed<br />
broadband solutions targeted to specific consumer groups. In some cases<br />
<strong>the</strong>se firms have opted not to apply for government subsidies, preferr<strong>in</strong>g<br />
<strong>in</strong>stead to provide broadband services on <strong>the</strong>ir own terms without open access<br />
limitations<br />
• <strong>High</strong> speed broadband delivered by <strong>the</strong> market will support most<br />
applications: The most popular <strong>in</strong>ternet based applications demanded by<br />
users (e-mail and general web surf<strong>in</strong>g), and even “bandwidth hungry”<br />
applications such as videoconferenc<strong>in</strong>g, will be accommodated by <strong>the</strong> high<br />
speed broadband services and associated compression technologies that will<br />
be available to most <strong>New</strong> Zealanders under <strong>the</strong> counterfactual<br />
• Constra<strong>in</strong>ts <strong>in</strong> o<strong>the</strong>r areas of <strong>the</strong> supply cha<strong>in</strong> will constra<strong>in</strong> <strong>the</strong> delivery<br />
of high speed broadband: The quality of service users obta<strong>in</strong> <strong>from</strong> high<br />
speed broadband depends on <strong>the</strong> capability of all <strong>the</strong> elements <strong>in</strong>volved <strong>in</strong><br />
supply<strong>in</strong>g <strong>the</strong> service. These <strong>in</strong>clude not only <strong>the</strong> telecommunications<br />
network, but also on <strong>the</strong> <strong>in</strong>ternational l<strong>in</strong>k, backhaul <strong>in</strong>frastructure, and user’s<br />
own wir<strong>in</strong>g and hardware.<br />
It is likely that <strong>the</strong> <strong>in</strong>ternet will always suffer <strong>from</strong> congestion. The <strong>in</strong>ternet is a<br />
collection of networks. Thus <strong>the</strong> limits of o<strong>the</strong>r networks, wherever <strong>the</strong>y are<br />
located, will always impact on user experience. The overall <strong>in</strong>ternet experience<br />
for users will only significantly improve with global improvements <strong>in</strong> capacity,<br />
even where significant public <strong>in</strong>vestment to deploy high speed broadband<br />
domestically is made available<br />
• Public <strong>in</strong>vestment subsidis<strong>in</strong>g <strong>the</strong> deployment of fibre to <strong>the</strong> premises<br />
risks devalu<strong>in</strong>g exist<strong>in</strong>g sunk <strong>in</strong>vestments by private companies: This<br />
outcome would also add uncerta<strong>in</strong>ty to <strong>New</strong> Zealand’s <strong>in</strong>vestment climate.<br />
56 “Digital Strategy 2.0 http://www.digitalstrategy.govt.nz/Digital-Strategy-2/ (accessed 25 September, 2008)<br />
53
Public policies that subsidise <strong>the</strong> deployment of fibre to <strong>the</strong> home will devalue<br />
exist<strong>in</strong>g sunk <strong>in</strong>vestments. This is likely to discourage market participants<br />
<strong>from</strong> <strong>in</strong>vest<strong>in</strong>g <strong>in</strong> <strong>in</strong>frastructure <strong>in</strong> <strong>the</strong> future<br />
• The Government can capture <strong>the</strong> anticipated economic value <strong>from</strong> fibre<br />
to <strong>the</strong> premises through targeted <strong>in</strong>frastructure upgrades and/or<br />
subsidies: Where not captured under <strong>the</strong> counterfactual, <strong>the</strong> economic<br />
benefits associated with <strong>the</strong> deployment of fibre (digital media, data storage<br />
and manipulation, telepresence, education and health) come, <strong>in</strong> <strong>the</strong> most part,<br />
<strong>from</strong> bus<strong>in</strong>ess users, education providers, and health facilities. Captur<strong>in</strong>g <strong>the</strong>se<br />
benefits does not require <strong>the</strong> deployment of fibre to <strong>the</strong> home. In fact, <strong>the</strong>se<br />
benefits would be most effectively captured through deploy<strong>in</strong>g fibre directly to<br />
bus<strong>in</strong>esses, schools and hospitals, through reduc<strong>in</strong>g <strong>the</strong> cost (or <strong>in</strong>creas<strong>in</strong>g <strong>the</strong><br />
availability) of <strong>in</strong>ternational bandwidth, and by reduc<strong>in</strong>g bottlenecks <strong>in</strong> o<strong>the</strong>r<br />
areas of <strong>the</strong> network. In addition, most bus<strong>in</strong>esses, tertiary education<br />
<strong>in</strong>stitutions and hospitals are likely to have access to fibre to <strong>the</strong> premises<br />
under <strong>the</strong> counterfactual. Importantly, fibre networks have already been<br />
deployed and are operat<strong>in</strong>g <strong>in</strong> most central bus<strong>in</strong>ess districts <strong>in</strong> <strong>New</strong> Zealand.<br />
Overall, it is likely that significant public <strong>in</strong>vestment <strong>in</strong> <strong>the</strong> short term will generate a<br />
large over supply of broadband <strong>in</strong>frastructure for retail users, where demand <strong>from</strong> <strong>New</strong><br />
Zealanders currently does not exist. In o<strong>the</strong>r words, <strong>New</strong> Zealand could repeat <strong>the</strong><br />
experience of countries such as S<strong>in</strong>gapore and Korea. Such policies are based on <strong>the</strong><br />
hope that build<strong>in</strong>g new <strong>in</strong>frastructure to deliver high speed broadband (particularly fibre<br />
to <strong>the</strong> home), will attract demand for it. Current demand patterns for broadband services<br />
<strong>in</strong> <strong>New</strong> Zealand suggest this is unlikely to be <strong>the</strong> case for some time. The simple reason<br />
is that <strong>the</strong> applications people actually want to use do not require such <strong>in</strong>frastructure, and<br />
<strong>the</strong> new applications are <strong>in</strong>creas<strong>in</strong>gly economical with bandwidth.<br />
5.6 Policy Conclusions<br />
In summary, our analysis shows that simply subsidis<strong>in</strong>g an immediate wide scale roll out<br />
of fibre to <strong>the</strong> premises may not deliver <strong>the</strong> “step change” <strong>the</strong> Government is look<strong>in</strong>g<br />
for, with <strong>the</strong> costs of <strong>the</strong> <strong>in</strong>tervention exceed<strong>in</strong>g <strong>the</strong> benefits. This is not to an argument<br />
aga<strong>in</strong>st any Government <strong>in</strong>tervention, or that <strong>the</strong> time will not come when public sector<br />
support for fibre to <strong>the</strong> home will become justified. Ra<strong>the</strong>r, our careful analysis of <strong>the</strong><br />
supply cha<strong>in</strong>, and of <strong>the</strong> limits to <strong>the</strong> use of Internet applications, suggests that a policy<br />
which focuses on <strong>the</strong> replacement of <strong>the</strong> “last mile” <strong>in</strong>frastructure may be too blunt <strong>in</strong><br />
address<strong>in</strong>g <strong>the</strong> constra<strong>in</strong>ts on <strong>the</strong> use of high speed broadband <strong>in</strong> <strong>New</strong> Zealand.<br />
There are some key problems that <strong>the</strong> market will not address—and where real<br />
opportunities exist for government <strong>in</strong>tervention to deliver significant benefits <strong>in</strong> <strong>the</strong><br />
short term. These are:<br />
• Low will<strong>in</strong>gness to pay for high speed broadband, and uncerta<strong>in</strong>ty<br />
around how this will evolve: This is one of <strong>the</strong> reasons why private <strong>in</strong>vestors<br />
are not currently plann<strong>in</strong>g to deploy fibre to <strong>the</strong> home on a wide scale. If <strong>the</strong><br />
Government wishes to stimulate additional deployment and up take of high<br />
speed broadband, <strong>the</strong>n it will need to address <strong>the</strong> low will<strong>in</strong>gness to pay<br />
currently exhibited by most users<br />
• International backhaul: Costs and capacity of <strong>in</strong>ternational data<br />
transmission impact on <strong>the</strong> overall quality of service users experience. If not<br />
addressed, this will substantially limit <strong>the</strong> potential benefits <strong>from</strong> any<br />
<strong>in</strong>vestments <strong>in</strong> high speed broadband <strong>in</strong> <strong>New</strong> Zealand<br />
54
• User equipment and wir<strong>in</strong>g: Users will only see benefits <strong>from</strong> high speed<br />
broadband to <strong>the</strong> extent permitted by <strong>the</strong> capacity of <strong>the</strong>ir <strong>in</strong>ternal wir<strong>in</strong>g and<br />
o<strong>the</strong>r hardware. For <strong>the</strong> full benefits of high speed broadband to accrue, many<br />
users will need to <strong>in</strong>vest <strong>in</strong> new hardware such as wireless modems, upgraded<br />
<strong>in</strong>ternal wir<strong>in</strong>g, and possibly new computers. Any policies to promote high<br />
speed broadband will need to take account of <strong>the</strong> cost of such upgrades<br />
• Cont<strong>in</strong>u<strong>in</strong>g slow service for rural users: Under both <strong>the</strong> counterfactual and<br />
<strong>the</strong> Government’s proposed broadband policy, around 20 percent of users—<br />
<strong>in</strong> rural and prov<strong>in</strong>cial parts of <strong>the</strong> country—will not be able to access high<br />
speed broadband. These users will still be able to access broadband us<strong>in</strong>g<br />
satellite, wireless, or broadband mobile services. However <strong>the</strong> speeds <strong>the</strong>y will<br />
enjoy, and thus <strong>the</strong> range of applications <strong>the</strong>y will be able to use, will be more<br />
limited.<br />
Overall, our analysis suggests that <strong>the</strong> Government should consider a flexible policy,<br />
which progressively draws more and more <strong>New</strong> Zealanders <strong>in</strong>to fast broadband, and<br />
which addresses bottlenecks to productivity improvement <strong>in</strong> order of “bang for <strong>the</strong><br />
buck”: pick <strong>the</strong> low hang<strong>in</strong>g fruit first. This policy may still have a place for subsidis<strong>in</strong>g<br />
<strong>the</strong> roll-out of widespread fibre to <strong>the</strong> home, but such a subsidy is likely to come fur<strong>the</strong>r<br />
down <strong>the</strong> track.<br />
55
6 Structur<strong>in</strong>g Public Investment <strong>in</strong> <strong>Broadband</strong><br />
While our analysis <strong>in</strong> <strong>the</strong> previous section suggests that <strong>the</strong>re is little justification for<br />
significant short-term public <strong>in</strong>vestment <strong>in</strong> broadband <strong>in</strong>frastructure, we appreciate <strong>the</strong>re<br />
is considerable uncerta<strong>in</strong>ty over public benefits. Our analysis also shows that <strong>the</strong>re are<br />
strong arguments to target subsidies at specific supply cha<strong>in</strong> bottlenecks, and to reta<strong>in</strong><br />
flexibility to subsidise <strong>in</strong>vestment <strong>in</strong> <strong>the</strong> “last mile” as <strong>the</strong> market evolves. For example,<br />
one can easily imag<strong>in</strong>e a situation where <strong>the</strong> emergence of new applications, or<br />
reductions <strong>in</strong> <strong>the</strong> cost of customer site equipment could put <strong>the</strong> spot-light on <strong>the</strong> “last<br />
mile” <strong>in</strong>frastructure. Equally, it is possible that new data compression techniques, and<br />
<strong>in</strong>creased demand for mobility, will see <strong>the</strong> market evolve towards greater reliance on<br />
wireless <strong>in</strong>frastructure.<br />
In this section, we consider how <strong>the</strong> Government could structure a public-private<br />
partnership which builds on commercial <strong>in</strong>centives fac<strong>in</strong>g <strong>the</strong> private sector, on changes<br />
<strong>in</strong> technologies and demand patterns, and on <strong>the</strong> evolv<strong>in</strong>g ability and will<strong>in</strong>gness to pay<br />
to deliver <strong>the</strong> most effective <strong>in</strong>tervention <strong>from</strong> <strong>the</strong> Government.<br />
We do not aim to provide def<strong>in</strong>itive answers. Our analysis for this paper suggests that<br />
<strong>the</strong>re is no s<strong>in</strong>gle silver bullet to ensure that fast broadband makes <strong>the</strong> maximum<br />
contribution to <strong>New</strong> Zealand’s productivity. The detailed design of any subsidy<br />
programme will depend on <strong>the</strong> specific objectives <strong>the</strong> Government <strong>in</strong>tends to achieve,<br />
and more work needs to be undertaken to formulate <strong>the</strong>se detailed objectives given <strong>the</strong><br />
grow<strong>in</strong>g understand<strong>in</strong>g of <strong>the</strong> market bottlenecks. Instead, we highlight <strong>the</strong> important<br />
questions that will need to be answered to ensure that a subsidy for high speed<br />
broadband delivers <strong>the</strong> desired outcomes <strong>in</strong> <strong>the</strong> most efficient way possible.<br />
This section is set out as follows:<br />
• Section 6.1 provides a summary of what subsidies are and how <strong>the</strong>y should be<br />
structured to deliver efficient outcomes. The section also outl<strong>in</strong>es <strong>the</strong><br />
importance of clarify<strong>in</strong>g <strong>the</strong> objectives of policy <strong>in</strong>tervention if <strong>the</strong> most<br />
efficient results are to be achieved<br />
• Sections 6.2 highlights and assesses different approaches to public fund<strong>in</strong>g for<br />
<strong>the</strong> deployment of high speed broadband<br />
• Section 6.3 discusses <strong>in</strong> more detail what we believe to be <strong>the</strong> best option—a<br />
unit subsidy structure, and raises important implementation questions, and<br />
• F<strong>in</strong>ally, <strong>in</strong> section 6.4 we summarise our conclusions on delivery options, and<br />
on questions that will require fur<strong>the</strong>r work if <strong>the</strong> Government decides to<br />
proceed down this track.<br />
6.1 Subsidies and Match<strong>in</strong>g Policy Objectives<br />
The purpose of a subsidy is to <strong>in</strong>crease <strong>the</strong> consumption of a good or a service where <strong>the</strong><br />
price customers are will<strong>in</strong>g to pay is lower than <strong>the</strong> price suppliers are prepared to accept.<br />
Figure 2 illustrates this concept. The figure shows a situation where <strong>the</strong> market is<br />
demand<strong>in</strong>g a level of broadband that is lower than <strong>the</strong> government’s target (as is <strong>the</strong> case<br />
<strong>in</strong> <strong>New</strong> Zealand). The gap between what it costs to deliver <strong>the</strong> service and what <strong>the</strong><br />
market is will<strong>in</strong>g to pay means that <strong>the</strong> social target will not be achieved.<br />
56
Figure 2: Topp<strong>in</strong>g Up<br />
This is where subsidies can help. Subsidies can be used to close <strong>the</strong> gap between <strong>the</strong> full<br />
cost of provid<strong>in</strong>g <strong>the</strong> desired level of service and <strong>the</strong> available commercial revenues,<br />
where:<br />
• At current <strong>in</strong>come levels, <strong>the</strong>re may be limited ability or will<strong>in</strong>gness to pay for<br />
access to high speed broadband<br />
• There are important positive economic externalities.<br />
However, <strong>the</strong>re are many possible ways for <strong>the</strong> Government to def<strong>in</strong>e its broadband<br />
access objectives. The most critical question is whe<strong>the</strong>r <strong>the</strong> objectives relate to <strong>the</strong><br />
availability of technology or to its take up. The high level objectives which tend to be<br />
enunciated <strong>in</strong> <strong>the</strong> <strong>New</strong> Zealand policy debate actually provide little guidance to <strong>the</strong><br />
specific policy objectives. Examples of such high level policy announcements are<br />
presented <strong>in</strong> <strong>the</strong> table below.<br />
Table 6.1: What do Policy Makers <strong>in</strong> <strong>New</strong> Zealand Perceive as <strong>the</strong> Problem?<br />
“We need widespread broadband to fully access <strong>the</strong> power of <strong>the</strong> new<br />
digital world. <strong>Broadband</strong> is necessary to support Next Generation<br />
Networks (NGN), which underlie enriched and highly <strong>in</strong>teractive web<br />
services.”<br />
“<strong>New</strong> Zealand has fallen beh<strong>in</strong>d its global competitors when it comes<br />
to broadband. As a result, we are miss<strong>in</strong>g out on <strong>the</strong> opportunities of<br />
this century’s lead<strong>in</strong>g technology – <strong>the</strong> Internet.”<br />
“Fibre will deliver huge economic benefits for our country <strong>in</strong> terms of<br />
enhanced productivity, improved global connectivity, and enhanced<br />
capacity for <strong>in</strong>novation.”<br />
But what does access to fast broadband mean? Should <strong>the</strong> government be more<br />
concerned about households which currently have no access to broadband <strong>in</strong>frastructure,<br />
or <strong>the</strong> households which have <strong>the</strong> technological access, but are not able or will<strong>in</strong>g to take<br />
up that opportunity? At present, less than half <strong>the</strong> households that can technically take<br />
up broadband do so, and most of those take up limited options. Should <strong>the</strong> first priority<br />
of <strong>the</strong> government be to roll out access to new technology, or to ensure that people<br />
derive full benefits <strong>from</strong> <strong>the</strong> exist<strong>in</strong>g <strong>in</strong>frastructure?<br />
57
<strong>High</strong> level pr<strong>in</strong>ciples provide little guidance to such specific questions. Keep<strong>in</strong>g <strong>the</strong><br />
policy discussion at <strong>the</strong> high level contributes to confusion, and <strong>in</strong>creases <strong>the</strong> risk of poor<br />
quality outcomes.<br />
A clear def<strong>in</strong>ition of <strong>the</strong> <strong>in</strong>tended policy objectives is go<strong>in</strong>g to be critical to <strong>the</strong> success of<br />
any proposed <strong>in</strong>tervention. This <strong>in</strong>volves decid<strong>in</strong>g who <strong>the</strong> recipients of any subsidies<br />
should be and what <strong>the</strong> subsidised service should be. The policy objective should drive<br />
<strong>the</strong> subsidy structure, ra<strong>the</strong>r than <strong>the</strong> o<strong>the</strong>r way around. Broad commitment to public<br />
<strong>in</strong>vestment <strong>in</strong> <strong>the</strong> fibre <strong>in</strong>frastructure pre-def<strong>in</strong>es policy objectives, even if those<br />
objectives turn out to be <strong>in</strong>appropriate. If <strong>the</strong> objective is unclear, <strong>the</strong>n <strong>the</strong> subsidy will<br />
fail to deliver.<br />
6.1.1 Understand<strong>in</strong>g what should be subsidised<br />
Both <strong>the</strong> policy rationale for public fund<strong>in</strong>g and budgetary constra<strong>in</strong>ts will <strong>in</strong>fluence<br />
decisions on what to subsidise. Where public fund<strong>in</strong>g is <strong>in</strong>tended to <strong>in</strong>troduce new<br />
services for <strong>New</strong> Zealanders generally, <strong>the</strong> pool of <strong>in</strong>tended beneficiaries could<br />
potentially be very large and may <strong>in</strong>clude almost everyone <strong>in</strong> <strong>New</strong> Zealand. In many<br />
cases, <strong>the</strong> beneficiaries of such subsidies may have been will<strong>in</strong>g to pay for <strong>the</strong> full cost of<br />
<strong>the</strong> service at <strong>the</strong> appropriate time, or <strong>the</strong>y may attach very little value to <strong>the</strong> service<br />
which will be offered.<br />
Where subsidies are aimed at mak<strong>in</strong>g services more affordable or accessible for particular<br />
population groups, <strong>the</strong> targeted pool is likely to be smaller—for example low <strong>in</strong>come<br />
households or those liv<strong>in</strong>g <strong>in</strong> rural areas. In that case, <strong>the</strong> deadweight loss <strong>from</strong> any<br />
subsidy regime is likely to be lower.<br />
There are two important dist<strong>in</strong>ctions underp<strong>in</strong>n<strong>in</strong>g decisions on what to subsidise:<br />
• Does <strong>the</strong> government want to promote coverage or take-up?<br />
– Promot<strong>in</strong>g coverage of high speed broadband services makes <strong>the</strong> service<br />
available to more people. But <strong>the</strong> benefits <strong>from</strong> this will not accrue unless<br />
people actually decide to use <strong>the</strong> service<br />
• Does <strong>the</strong> government want to promote particular technologies or services,<br />
or take a technology neutral approach?<br />
– Promot<strong>in</strong>g particular technologies or services is more direct, and simpler to<br />
implement, but risks clos<strong>in</strong>g out alternative technologies (<strong>in</strong>clud<strong>in</strong>g those<br />
that may emerge <strong>in</strong> <strong>the</strong> future). In <strong>the</strong> longer run this may do more harm<br />
than good.<br />
Roll out of particular technologies<br />
If <strong>the</strong> government has <strong>the</strong> specific objective of <strong>in</strong>creas<strong>in</strong>g <strong>the</strong> deployment of a particular<br />
technology, such as fibre to <strong>the</strong> home, this would raise a number of questions such as:<br />
• Should <strong>the</strong> government fund deployment only <strong>in</strong> high-cost locations, where<br />
commercial provision is commercially unviable?<br />
– This makes sense <strong>in</strong> pr<strong>in</strong>ciple, but raises difficult issues about where exactly<br />
to draw <strong>the</strong> l<strong>in</strong>e between areas which should (and should not) be eligible<br />
for fund<strong>in</strong>g<br />
• What will <strong>the</strong> government do if take-up of <strong>the</strong> subsidised service is low?<br />
– Subsidis<strong>in</strong>g roll out of a particular technology will not necessarily mean that<br />
<strong>the</strong> technology is widely used. If users do not see <strong>the</strong> value <strong>in</strong> it for <strong>the</strong>m,<br />
58
<strong>the</strong>y will not choose to subscribe and <strong>the</strong> expected benefits will be lost. In<br />
design<strong>in</strong>g <strong>the</strong> subsidy policy makers need to take account of <strong>the</strong> likely takeup<br />
by users<br />
• What about alternative technologies?<br />
– As noted above, if <strong>the</strong> government promotes deployment of a specific<br />
technology (or technologies), this will skew market outcomes <strong>in</strong> favour of<br />
that technology (this effect is sometimes referred to as “pick<strong>in</strong>g w<strong>in</strong>ners”).<br />
No one has perfect <strong>in</strong>formation on how broadband technologies will<br />
develop <strong>in</strong> <strong>the</strong> future, which means <strong>the</strong>re is a real chance of gett<strong>in</strong>g it<br />
wrong, and promot<strong>in</strong>g a technology or comb<strong>in</strong>ation of technologies that is<br />
not <strong>the</strong> most economically efficient solution for <strong>New</strong> Zealand over time.<br />
The concerns raised above about <strong>the</strong> risk of gett<strong>in</strong>g it wrong apply <strong>in</strong> particular if <strong>the</strong><br />
subsidy aims to promote take up of particular technologies.<br />
Def<strong>in</strong><strong>in</strong>g how much utilisation is enough<br />
It is unlikely that 100 percent take up of high speed broadband will be an efficient<br />
outcome for <strong>New</strong> Zealand. Not all households and bus<strong>in</strong>ess need or would use high<br />
speed broadband. For example subsidis<strong>in</strong>g broadband for users who ei<strong>the</strong>r do not have<br />
access to a computer or high def<strong>in</strong>ition television would clearly be a waste of public<br />
funds. It is likely that at least some users would use a high speed broadband connection<br />
to do <strong>the</strong> same activities that <strong>the</strong>y could over a lower speed connection (email, web<br />
brows<strong>in</strong>g, onl<strong>in</strong>e transactions). While high speed broadband would deliver some marg<strong>in</strong>al<br />
benefits <strong>in</strong> terms of <strong>the</strong> speed and quality of <strong>the</strong>se applications, it is hard to see how this<br />
would warrant a subsidy.<br />
The problem here is how to determ<strong>in</strong>e <strong>the</strong> “optimal” level of uptake of broadband, after<br />
which <strong>the</strong> costs of subsidis<strong>in</strong>g new connections would outweigh <strong>the</strong> benefits.<br />
Where a product or service carries very high fixed costs, as is <strong>the</strong> case for broadband<br />
services, it is often efficient to price discrim<strong>in</strong>ate. Price discrim<strong>in</strong>ation makes it possible<br />
to maximise take-up of <strong>the</strong> service, despite wide differences between users’ preferences<br />
and will<strong>in</strong>gness to pay. 57<br />
Policy makers and o<strong>the</strong>r commentators often oppose efficient price discrim<strong>in</strong>ation as it<br />
appears to unfairly target particular groups of customers. However, price discrim<strong>in</strong>ation<br />
is generally economically efficient, and enables service suppliers to maximise take up by<br />
users. If <strong>the</strong> government wishes to maximise take up <strong>the</strong>n any policies restrict<strong>in</strong>g price<br />
discrim<strong>in</strong>ation would run counter to that goal.<br />
Access to technical capabilities<br />
If <strong>the</strong> government wishes to maximise coverage of high speed broadband, and thus<br />
access to emerg<strong>in</strong>g high end applications, <strong>the</strong> technologically neutral option of<br />
subsidis<strong>in</strong>g access capabilities is an attractive one. However, this approach raises a<br />
number of complex challenges that would require careful attention. In particular:<br />
• What quality compromises are acceptable?<br />
57 In simple terms, price discrim<strong>in</strong>ation is where a seller of goods or services charges different prices to different<br />
groups of customers, and <strong>the</strong> difference between <strong>the</strong>se prices does not reflect any difference <strong>in</strong> <strong>the</strong> cost of serv<strong>in</strong>g<br />
those customers. Common examples are lower entry rates for students and pensioners at movie <strong>the</strong>atres, or higher<br />
airfares for bus<strong>in</strong>ess class or first class passengers. Price discrim<strong>in</strong>ation allows firms to recover high fixed costs,<br />
while m<strong>in</strong>imis<strong>in</strong>g <strong>the</strong> negative impact on demand <strong>from</strong> pric<strong>in</strong>g above marg<strong>in</strong>al costs (and <strong>the</strong> associated loss of<br />
economic benefit that would result).<br />
59
As we discussed earlier <strong>in</strong> <strong>the</strong> report, different access technologies have widely<br />
different characteristics. In addition to different technical characteristics,<br />
external factors can impact variably on different technologies. Electric fences<br />
and distance can reduce <strong>the</strong> quality of DSL services, while <strong>the</strong> wea<strong>the</strong>r and<br />
local geography can impact on <strong>the</strong> quality of wireless broadband. Important<br />
questions <strong>in</strong>clude: what m<strong>in</strong>imum quality characteristics must a technology<br />
have to qualify for <strong>the</strong> subsidy? What quality compromises due to localised<br />
factors outside <strong>the</strong> provider’s control would be accepted? and how would <strong>the</strong><br />
government monitor and enforce <strong>the</strong>se quality standards once <strong>the</strong> subsidy has<br />
been allocated?<br />
• How do technologies fit toge<strong>the</strong>r?<br />
An important feature of telecommunications networks is that <strong>in</strong> order to<br />
operate <strong>the</strong>y need to <strong>in</strong>terconnect with each o<strong>the</strong>r. This means subsidised<br />
technologies must be able to <strong>in</strong>terconnect with o<strong>the</strong>r networks (without<br />
caus<strong>in</strong>g technical problems for <strong>the</strong> o<strong>the</strong>r networks or <strong>the</strong>ir users).<br />
Take up of particular services<br />
If <strong>the</strong> government wishes to encourage take up by users of particular services or<br />
applications, this raises questions about target<strong>in</strong>g:<br />
• Are <strong>the</strong> government’s priorities related to particular social groups or sectors?<br />
This question relates not just to who is eligible for <strong>the</strong> subsidy, but also which<br />
services <strong>the</strong> government should subsidise<br />
• Is <strong>the</strong>re still a technology deficit?<br />
Overall, we would recommend a work programme which would:<br />
• Identify <strong>the</strong> groups <strong>in</strong> <strong>New</strong> Zealand society which would benefit <strong>from</strong> tak<strong>in</strong>g<br />
up fast broadband, and <strong>the</strong> level of broadband access <strong>the</strong>y need <strong>from</strong> <strong>the</strong><br />
public policy po<strong>in</strong>t of view. For example, such analysis may <strong>in</strong>dicate that <strong>the</strong><br />
biggest <strong>in</strong>itial returns would come <strong>from</strong> subsidis<strong>in</strong>g access by lower <strong>in</strong>come<br />
urban population to <strong>the</strong> exist<strong>in</strong>g broadband <strong>in</strong>frastructure. The result<strong>in</strong>g<br />
subsidy program may <strong>in</strong>clude both assistance with purchase of customer<br />
premise equipment, and support for monthly access fees<br />
• Identify <strong>the</strong> groups <strong>in</strong> society which would most benefit <strong>from</strong> access to fibre<br />
to <strong>the</strong> premises, and develop a subsidy program which supports a progressive<br />
roll-out to different categories of customers.<br />
6.1.2 Fibre <strong>in</strong> <strong>New</strong> Zealand<br />
Importantly, fibre is not <strong>the</strong> only solution to deliver next generation broadband to <strong>New</strong><br />
Zealand. As evidenced by <strong>the</strong> recent rollouts of 3G broadband, technology cont<strong>in</strong>ues to<br />
evolve as do <strong>the</strong> capabilities of <strong>in</strong>dividual platforms with it. Globally, DSL cont<strong>in</strong>ues to<br />
be <strong>the</strong> most commonly taken up broadband technology. In <strong>the</strong> European Union for<br />
example, it accounts for 80 per cent of broadband subscriptions while fibre accounts for<br />
only two per cent. A range of technology platforms can provide <strong>the</strong> broadband capacity<br />
to satisfy demand for current and most emerg<strong>in</strong>g applications and uses. A mix of<br />
technologies should always be <strong>the</strong> start<strong>in</strong>g po<strong>in</strong>t for connect<strong>in</strong>g <strong>New</strong> Zealand to fast and<br />
scalable broadband. What will suffice <strong>in</strong> metropolitan or urban <strong>New</strong> Zealand is very<br />
unlikely to be <strong>the</strong> optimum solution for <strong>the</strong> most remote parts of <strong>the</strong> country.<br />
Clearly, <strong>the</strong> availability of broadband is not <strong>the</strong> only <strong>in</strong>dicator. The relatively low take-up<br />
of broadband over fibre <strong>in</strong> South Korea demonstrates that consumers will access what<br />
60
<strong>the</strong>y need at a price po<strong>in</strong>t <strong>the</strong>y can afford and via a technology that suits <strong>the</strong>ir <strong>in</strong>dividual<br />
needs.<br />
<strong>Most</strong> consumers are largely <strong>in</strong>different to <strong>the</strong> technology used to deliver <strong>the</strong>ir broadband.<br />
They are <strong>in</strong>terested <strong>in</strong> its ability to connect <strong>the</strong>m to <strong>the</strong> services <strong>the</strong>y need and that it lets<br />
<strong>the</strong>m perform <strong>the</strong> tasks <strong>the</strong>y want, when <strong>the</strong>y want and where <strong>the</strong>y want. It is highly<br />
unlikely that <strong>the</strong> majority of consumers will want to pay for capacity <strong>the</strong>y will not use.<br />
6.2 Public Investment Options<br />
Any <strong>in</strong>tervention to ensure <strong>the</strong> deployment of faster and more reliable <strong>in</strong>ternet services<br />
will require a subsidy structure that helps to mobilise commercial fund<strong>in</strong>g <strong>from</strong> Telecom,<br />
Vodafone, TelstraClear and o<strong>the</strong>rs, whilst at <strong>the</strong> same time ensur<strong>in</strong>g accountability for<br />
results. It is also important to design schemes <strong>in</strong> ways that build and re<strong>in</strong>force good<br />
governance, particularly <strong>in</strong> award<strong>in</strong>g and monitor<strong>in</strong>g performance contracts, and that<br />
ensure cost-effective adm<strong>in</strong>istration. In this section we assess <strong>the</strong> advantages and<br />
limitations of various public fund<strong>in</strong>g approaches.<br />
While <strong>the</strong>re is a wide range of possible subsidy models, all of <strong>the</strong>m broadly fall <strong>in</strong>to four<br />
categories:<br />
• Subsidies delivered through equity <strong>in</strong>vestment <strong>in</strong> <strong>the</strong> enterprise which<br />
provides <strong>the</strong> desired services. By def<strong>in</strong>ition, <strong>the</strong> subsidy must imply that <strong>the</strong><br />
return on such <strong>in</strong>vestment is less than <strong>the</strong> commercial return. In o<strong>the</strong>r words,<br />
<strong>the</strong> subsidy is <strong>the</strong> difference between <strong>the</strong> commercial return on equity and <strong>the</strong><br />
return which is acceptable to <strong>the</strong> government to ensure <strong>the</strong> desired outcomes.<br />
In most cases, subsidised equity <strong>in</strong>vestment <strong>in</strong>volves 100 percent ownership of<br />
<strong>the</strong> enterprise<br />
• Subsidies delivered through low <strong>in</strong>terest debt. In this case, aga<strong>in</strong>, <strong>the</strong> subsidy is<br />
<strong>the</strong> difference between <strong>the</strong> <strong>in</strong>terest rate and o<strong>the</strong>r terms at which loans are<br />
commercially available, and <strong>the</strong> terms offered by <strong>the</strong> government. Subsidised<br />
debt could, for example, <strong>in</strong>volve <strong>the</strong> government on-lend<strong>in</strong>g to private<br />
enterprises at its own cost of borrow<strong>in</strong>g, or even below it. Subsidies through<br />
low <strong>in</strong>terest debt do not require government ownership of <strong>the</strong> enterprise<br />
• Lump sum subsidies, where <strong>the</strong> government provides overall support to <strong>the</strong><br />
enterprise for <strong>the</strong> losses <strong>in</strong>curred <strong>in</strong> provid<strong>in</strong>g <strong>the</strong> socially desired services.<br />
The subsidy is based on <strong>the</strong> difference between <strong>the</strong> total costs <strong>in</strong>curred, and<br />
<strong>the</strong> total revenue earned by <strong>the</strong> bus<strong>in</strong>ess<br />
• Unit subsidies, where <strong>the</strong> subsidy is provided for <strong>the</strong> performance of a specific<br />
obligation by <strong>the</strong> bus<strong>in</strong>ess. For example, <strong>the</strong> government may pay a bounty for<br />
each new broadband connection, or provide a voucher to reduce <strong>the</strong> price to<br />
<strong>the</strong> customers.<br />
The figure below presents <strong>the</strong>se four <strong>in</strong>vestment options.<br />
61
Figure 6.3: Public Investment Options<br />
In pr<strong>in</strong>ciple, subsidies can be structural or contractual and <strong>the</strong> divid<strong>in</strong>g l<strong>in</strong>e between any<br />
one of <strong>the</strong> highlighted option for deliver<strong>in</strong>g public <strong>in</strong>vestment is not strict. However,<br />
<strong>the</strong>re is one key difference under a structural subsidy approach: <strong>the</strong> government <strong>in</strong>vests<br />
<strong>in</strong> an economic activity on <strong>the</strong> expectation that it will not be able to earn <strong>the</strong> commercial<br />
rate of return on such <strong>in</strong>vestment.<br />
Regardless of <strong>the</strong> return that <strong>the</strong> government will or will not be mak<strong>in</strong>g it will still need<br />
to understand <strong>the</strong> underly<strong>in</strong>g bus<strong>in</strong>ess of <strong>the</strong> state-owned or controlled service provider<br />
Structural approaches have <strong>the</strong> potential to create governance problems, and it may be<br />
difficult to disentangle an efficient subsidy component <strong>from</strong> subsidis<strong>in</strong>g <strong>the</strong> <strong>in</strong>efficiency<br />
of a state-owned or controlled service provider. Options one and two <strong>in</strong> general<br />
represent a structural subsidy approach by <strong>the</strong> government.<br />
Options 3 and 4 represent contractual approaches. A contractual approach would<br />
<strong>in</strong>volve:<br />
• Leav<strong>in</strong>g <strong>the</strong> private sector to deliver fur<strong>the</strong>r broadband <strong>in</strong>vestment where this<br />
is commercially viable, and<br />
• Contract<strong>in</strong>g for <strong>the</strong> delivery of non-commercially justified outcomes, with <strong>the</strong><br />
government tak<strong>in</strong>g f<strong>in</strong>ancial responsibility for <strong>the</strong> gap between what<br />
consumers are will<strong>in</strong>g to pay, and what <strong>the</strong> government wants to see delivered.<br />
The table below compares and contrasts <strong>the</strong> structural and contractual approaches<br />
aga<strong>in</strong>st a range of criteria:<br />
• Governance: what effect would <strong>the</strong> mode of deliver<strong>in</strong>g subsidy have on<br />
corporate governance, and <strong>the</strong> <strong>in</strong>centives for <strong>the</strong> performance of <strong>the</strong><br />
enterprise?<br />
• Competition: what effect will <strong>the</strong> mode have on promot<strong>in</strong>g market<br />
competition, or distort<strong>in</strong>g competitive conduct?<br />
• Regulation: will <strong>the</strong> mode of deliver<strong>in</strong>g subsidy require additional regulation,<br />
or could it provide a basis for lessen<strong>in</strong>g <strong>the</strong> regulatory burden on <strong>the</strong> <strong>in</strong>dustry?<br />
• Deadweight loss: how likely is <strong>the</strong> subsidy to be applied to services which<br />
would have been provided anyway, or to consumers who would have<br />
purchased <strong>the</strong>m anyway?<br />
62
Table 6.2: Comparison of Subsidy Options<br />
Governance Competition Regulation Deadweight<br />
Loss<br />
Option 1: Lower return<br />
GovernmentComplex share<br />
structure<br />
equity<br />
Less commercial<br />
Option 2: Service provider can<br />
rema<strong>in</strong> more<br />
Cheap loans<br />
commercial<br />
Option 3:<br />
Lump-sum<br />
subsidy<br />
Option 4:<br />
Unit<br />
subsidy<br />
Overall subsidy for<br />
provid<strong>in</strong>g noncommercial<br />
services<br />
Subsidy for specified<br />
outputs (e.g.<br />
connections)<br />
Would reduce<br />
competition<br />
Risk of government<br />
protect<strong>in</strong>g its <strong>in</strong>terests<br />
Would still distort<br />
competition<br />
Subsidy can be<br />
provided to any<br />
number of providers,<br />
with less effect on<br />
competition<br />
Subsidy can be<br />
competitively bid out<br />
Non-commercial<br />
objectives may allow<br />
for less <strong>in</strong>trusive<br />
regulation<br />
Loans would need to<br />
be l<strong>in</strong>ked to regulated<br />
service targets and<br />
prices<br />
May still require tighter<br />
regulation to ensure<br />
subsidy well spent<br />
No need for fur<strong>the</strong>r<br />
regulation<br />
May change def<strong>in</strong>ition<br />
of regulated services<br />
Difficult to ensure<br />
good corporate<br />
performance given<br />
social demands<br />
In effect a lump-sum<br />
subsidy<br />
Difficult to conta<strong>in</strong><br />
subsidy demands<br />
Least amount of<br />
subsidy required<br />
International experience suggests that contractual approaches are preferable to structural<br />
approaches. A more efficient approach is an explicit performance-based subsidy or<br />
unit subsidy to promote <strong>the</strong> delivery of new (or improved) broadband connections. This<br />
subsidy would be a “top up” <strong>in</strong> addition to user charges, sufficient to make <strong>the</strong><br />
<strong>in</strong>vestment viable. Payment of <strong>the</strong> subsidy would be tied to <strong>the</strong> actual delivery of <strong>the</strong> new<br />
connections.<br />
This approach has become <strong>in</strong>creas<strong>in</strong>gly popular <strong>in</strong>ternationally <strong>in</strong> recent years, and is<br />
now used <strong>in</strong> a number of jurisdictions to promote access to <strong>in</strong>frastructure <strong>in</strong> areas, or for<br />
groups of customers, that are not commercially viable.<br />
A key benefit of this approach is that <strong>the</strong> structure of <strong>the</strong> subsidy ensures that<br />
telecommunications service providers are actively encouraged to deliver new<br />
connections. The amount and tim<strong>in</strong>g of <strong>the</strong> subsidy would be set out <strong>in</strong> a contract<br />
between <strong>the</strong> government and <strong>the</strong> telecommunications service provider (or providers),<br />
giv<strong>in</strong>g providers <strong>the</strong> certa<strong>in</strong>ty <strong>the</strong>y need to <strong>in</strong>vest.<br />
In <strong>the</strong> table below, we briefly outl<strong>in</strong>e <strong>the</strong> examples of how <strong>the</strong> four options of deliver<strong>in</strong>g<br />
subsidy have worked <strong>in</strong> various jurisdictions.<br />
Table 6.3: Practical Examples of Subsidy Options<br />
Option 1:<br />
Government<br />
equity<br />
Experience<br />
In <strong>the</strong>ory, fits <strong>the</strong> SOE model, but no<br />
work<strong>in</strong>g examples<br />
Logical extension is full government<br />
ownership<br />
A common PPP option is an<br />
<strong>in</strong>frastructure lease:<br />
Government owns core assets<br />
Private operator leases assets, owns<br />
operat<strong>in</strong>g assets<br />
Implementation issues<br />
No established PPP models for<br />
partial government equity<br />
participation<br />
Lease contracts require complex<br />
governance<br />
63
Option 2:<br />
Cheap loans<br />
Option 3:<br />
Lump-sum<br />
subsidy<br />
Option 4:<br />
Unit subsidy<br />
Relatively common under concession<br />
contracts <strong>in</strong> Europe and Asia<br />
NSW rail system:<br />
Loss-mak<strong>in</strong>g corporation<br />
Regulator sets efficient cost<br />
Subsidy to cover difference between<br />
efficient cost and fare revenue<br />
Common model for procur<strong>in</strong>g subsidised<br />
<strong>in</strong>frastructure services:<br />
Shadow tolls<br />
<strong>New</strong> Zealand primary health care<br />
Requires common f<strong>in</strong>ancial<br />
model.<br />
“Open book” negotiations<br />
“Open book” negotiations<br />
Service requirements need to be<br />
l<strong>in</strong>ked to <strong>the</strong> subsidy<br />
Competitive procurement, but<br />
requires network architecture<br />
which is consistent<br />
6.3 Unit Subsidy<br />
As a general pr<strong>in</strong>ciple policy makers want to ensure that <strong>the</strong>ir objectives are go<strong>in</strong>g to be<br />
achieved at least cost, which makes l<strong>in</strong>k<strong>in</strong>g public f<strong>in</strong>d<strong>in</strong>g to actual service delivery<br />
important. A unit subsidy approach achieves this.<br />
This approach has been used <strong>in</strong> a number of sectors <strong>in</strong>clud<strong>in</strong>g water, sanitation,<br />
electricity, transport, telecommunications, education, and health care. The two key<br />
features that dist<strong>in</strong>guish a unit subsidy approach <strong>from</strong> o<strong>the</strong>r forms of tax payer fund<strong>in</strong>g is<br />
that unit subsidies are explicit, and <strong>the</strong>y are performance based.<br />
A unit subsidy approach is explicit because it articulates <strong>the</strong> follow<strong>in</strong>g:<br />
• Why <strong>the</strong> fund<strong>in</strong>g is be<strong>in</strong>g provided<br />
• Who is receiv<strong>in</strong>g <strong>the</strong> fund<strong>in</strong>g<br />
• Who is provid<strong>in</strong>g <strong>the</strong> fund<strong>in</strong>g, and<br />
• What is be<strong>in</strong>g funded—both <strong>the</strong> activity and <strong>the</strong> f<strong>in</strong>ancial sums <strong>in</strong>volved.<br />
This approach is performance based because it l<strong>in</strong>ks outcomes to fund<strong>in</strong>g. Fur<strong>the</strong>r a unit<br />
subsidy approach can help to improve <strong>the</strong> effectiveness of tax payer fund<strong>in</strong>g generally by:<br />
• Increas<strong>in</strong>g accountability, by transferr<strong>in</strong>g performance risk to <strong>the</strong> service<br />
provider, which ma<strong>in</strong>ta<strong>in</strong>s pressure on <strong>the</strong> provider to deliver <strong>the</strong> pre-specified<br />
outputs<br />
• Improv<strong>in</strong>g transparency, through explicit recognition and identification of<br />
fund<strong>in</strong>g flows, specified publicly<br />
• Increas<strong>in</strong>g value for money, through competitive award of unit subsidy<br />
fund<strong>in</strong>g which, toge<strong>the</strong>r with <strong>the</strong> transfer of performance risk to <strong>the</strong> service<br />
provider, can <strong>in</strong>crease <strong>the</strong> value for money, and<br />
• Reduc<strong>in</strong>g economic distortions, by clearly recognis<strong>in</strong>g and identify<strong>in</strong>g <strong>the</strong><br />
fund<strong>in</strong>g.<br />
A key benefit of this approach is that <strong>the</strong> structure of <strong>the</strong> subsidy actively encourages<br />
ISPs to deliver new connections. A contract between <strong>the</strong> government and <strong>the</strong> ISPs<br />
would set out <strong>the</strong> amount and tim<strong>in</strong>g of <strong>the</strong> subsidy, giv<strong>in</strong>g providers <strong>the</strong> certa<strong>in</strong>ty <strong>the</strong>y<br />
need to <strong>in</strong>vest.<br />
64
6.3.1 The role of transitional subsidies<br />
<strong>High</strong> speed broadband services are what we might call an “experiential service”. Before<br />
people use high speed broadband <strong>the</strong>y may not really appreciate <strong>the</strong> potential benefits.<br />
For some users at least, once <strong>the</strong>y have used high speed broadband <strong>the</strong>y may be very<br />
keen to keep on us<strong>in</strong>g it. 58<br />
Earlier <strong>in</strong> this report we identified will<strong>in</strong>gness to pay as an important contributor to low<br />
uptake of fast broadband services. Will<strong>in</strong>gness to pay for high speed broadband could<br />
<strong>in</strong>crease over time under a transitional subsidy approach. This would <strong>in</strong>volve subsidis<strong>in</strong>g<br />
take up of high speed broadband for a limited period, with <strong>the</strong> idea that at <strong>the</strong> end of <strong>the</strong><br />
transition users would, hav<strong>in</strong>g experienced high speed broadband, be more will<strong>in</strong>g to pay<br />
<strong>the</strong> full cost of <strong>the</strong> service (see Figure 6.4).<br />
Figure 6.4: Transitional Subsidy<br />
A unit subsidy approach provides <strong>the</strong> greatest potential for deliver<strong>in</strong>g <strong>the</strong> highest level of<br />
return on tax payer funded outcomes. This is because:<br />
• Performance risk can be transferred to service providers by <strong>in</strong>troduc<strong>in</strong>g<br />
subsidies with<strong>in</strong> a competitive regime or by develop<strong>in</strong>g specific, performancebased<br />
subsidy contracts<br />
• The creation of competitive pressures on providers want<strong>in</strong>g to bid for <strong>the</strong><br />
right to provide services will help to ensure value for money, by m<strong>in</strong>imis<strong>in</strong>g<br />
<strong>the</strong> subsidy required, or maximiz<strong>in</strong>g <strong>the</strong> benefit <strong>from</strong> a given subsidy amount.<br />
A big challenge <strong>in</strong> design<strong>in</strong>g performance based regimes is determ<strong>in</strong><strong>in</strong>g what outputs to<br />
l<strong>in</strong>k <strong>the</strong> payment of subsidies to—that is, which outputs will deliver <strong>the</strong> desired<br />
outcomes.<br />
6.4 Conclusions and Next Steps<br />
The Government is seek<strong>in</strong>g to achieve a significant uplift <strong>in</strong> <strong>New</strong> Zealand’s productivity.<br />
Our analysis shows that an immediate <strong>in</strong>jection of funds <strong>in</strong>to support<strong>in</strong>g a fibre to <strong>the</strong><br />
home roll-out may be a blunt <strong>in</strong>strument <strong>in</strong> improv<strong>in</strong>g access to fast broadband<br />
58 In some cases <strong>the</strong> converse may be true—after try<strong>in</strong>g out a new service users may decide that actually it does not<br />
live up to <strong>the</strong>ir expectations, and <strong>the</strong>y would ra<strong>the</strong>r use a lower cost option.<br />
65
applications, while <strong>the</strong> result<strong>in</strong>g market distortions and risks to <strong>the</strong> quality of market<br />
governance could actually underm<strong>in</strong>e productivity.<br />
At <strong>the</strong> same time, <strong>the</strong>re are clearly important bottlenecks to greater utilisation of fast<br />
broadband <strong>in</strong> <strong>New</strong> Zealand, which will not be solved by <strong>the</strong> market. There are strong<br />
arguments for a flexible <strong>in</strong>tervention framework, designed to address bottlenecks<br />
progressively, and to provide support <strong>in</strong> ways which creates greatest social value at least<br />
costs.<br />
The analysis <strong>in</strong> this paper shows that any future partnership between <strong>the</strong> Government<br />
and providers will need to clearly def<strong>in</strong>e <strong>the</strong> services to be provided and <strong>the</strong> key<br />
standards of performance. The approach that is adopted will have important<br />
consequences for <strong>the</strong> costs of <strong>the</strong> scheme, <strong>the</strong> <strong>in</strong>centives faced by service providers, and<br />
<strong>the</strong> strategy for monitor<strong>in</strong>g and verify<strong>in</strong>g performance. The partnership will also need to<br />
be structured <strong>in</strong> a way that m<strong>in</strong>imises governance risks, and ensures that subsidies do not<br />
become unnecessarily entrenched.<br />
The process of design<strong>in</strong>g a subsidy approach would require decisions on <strong>the</strong> follow<strong>in</strong>g<br />
po<strong>in</strong>ts:<br />
• The role and susta<strong>in</strong>ability of public fund<strong>in</strong>g. What is <strong>the</strong> rationale for<br />
public fund<strong>in</strong>g? How might budgetary constra<strong>in</strong>ts and susta<strong>in</strong>ability issues<br />
<strong>in</strong>fluence design?<br />
• Who will be eligible to receive services that attract public fund<strong>in</strong>g. Who<br />
are <strong>the</strong> <strong>in</strong>tended recipients? How will <strong>the</strong>y be targeted?<br />
• Who will be eligible to provide services. What criteria should govern<br />
eligibility?<br />
• The market environment. Will services be provided <strong>in</strong> a competitive or<br />
monopolistic market?<br />
• Def<strong>in</strong>ition of performance. What should <strong>the</strong> service package <strong>in</strong>clude? How<br />
should key performance standards be def<strong>in</strong>ed?<br />
• How to l<strong>in</strong>k payment to performance. What should be <strong>the</strong> form and size of<br />
payment? How will payments be structured?<br />
• The shape of o<strong>the</strong>r aspects of <strong>the</strong> contract. What should be <strong>the</strong> form and<br />
duration of <strong>the</strong> contract? How will issues of contractual adaptation and<br />
dispute settlement be addressed?<br />
• How to structure <strong>the</strong> adm<strong>in</strong>istration of <strong>the</strong> scheme. What should be <strong>the</strong><br />
scope of <strong>the</strong> scheme? Who should be responsible for adm<strong>in</strong>ister<strong>in</strong>g <strong>the</strong><br />
scheme?<br />
We recommend that <strong>the</strong> Government and <strong>the</strong> <strong>in</strong>dustry work toge<strong>the</strong>r to address <strong>the</strong>se<br />
questions, and to lay <strong>the</strong> foundations for an effective partnership.<br />
66
Appendix A: International Trends <strong>in</strong> Fast <strong>Broadband</strong><br />
Deployment<br />
International experiences provide useful <strong>in</strong>sight <strong>in</strong>to <strong>the</strong> benefits and challenges of<br />
different regulatory and <strong>in</strong>vestment approaches for broadband connectivity. However, it<br />
is <strong>in</strong>evitable that <strong>the</strong>re will be differences <strong>in</strong> approach and technologies which reflect <strong>the</strong><br />
unique geography, population base and market conditions <strong>in</strong> each country. It is<br />
important when compar<strong>in</strong>g countries that <strong>the</strong>se differences are taken <strong>in</strong>to account.<br />
A.1 Australia<br />
In Australia, <strong>the</strong> two major cable networks only reach 2.7 million premises and Telstra<br />
owns one of <strong>the</strong>se networks. As a result, <strong>the</strong>re is only one ubiquitous national fixed l<strong>in</strong>e<br />
network <strong>in</strong> Australia—<strong>the</strong> predom<strong>in</strong>antly copper network—which is also owned by<br />
Telstra.<br />
A.2 United States of America<br />
The United States currently has two providers roll<strong>in</strong>g out different technological<br />
solutions: Verizon are deploy<strong>in</strong>g <strong>the</strong>ir FiOS service over FTTH; while AT&T are roll<strong>in</strong>g<br />
out <strong>the</strong>ir U-serve service over FTTC. Verizon aims to pass 18 million homes by 2010 as<br />
part of a US$23bn deployment, while AT&T plan to reach 18m homes by <strong>the</strong> end of<br />
2008, at an estimated cost of US$6bn. 59<br />
The ma<strong>in</strong> rationale for <strong>the</strong> deployment of <strong>the</strong>se fibre networks is <strong>the</strong> competitive<br />
pressure created by <strong>the</strong> presence of <strong>the</strong> cable network. Competition <strong>in</strong> <strong>the</strong> provision of<br />
TV services with<strong>in</strong> <strong>in</strong>dividual states <strong>in</strong>creased <strong>the</strong> pressure on copper network operators<br />
and <strong>in</strong>creased <strong>the</strong> need to build out fibre closer to <strong>the</strong> home. 60<br />
Roll-out has been aided by regulatory forbearance, as <strong>the</strong> regulator decided <strong>the</strong><br />
competition between fibre and cable networks was sufficient that mandat<strong>in</strong>g wholesale<br />
access on <strong>the</strong> fibre network was not required.<br />
A.3 Japan<br />
The Japanese broadband market was built upon a strong platform of competition<br />
follow<strong>in</strong>g <strong>the</strong> split of NTT East and West and <strong>the</strong> unbundl<strong>in</strong>g of <strong>the</strong> local loop. The two<br />
NTT bus<strong>in</strong>esses hold a comb<strong>in</strong>ed market share of around 45 percent, up <strong>from</strong> around 32<br />
percent <strong>in</strong> 2004, <strong>in</strong> part attributable to <strong>the</strong>ir <strong>in</strong>vestment <strong>in</strong> fibre access without a<br />
requirement to unbundle. S<strong>in</strong>ce 2005, Japan has seen more new FTTH/B subscribers<br />
than DSL subscribers, with 800,000 add<strong>in</strong>g a quarter and more than 10 million <strong>in</strong> total.<br />
FTTH now accounts for 38 percent of <strong>the</strong> total broadband market. 61<br />
The Government has set a target of 30m subscribers by 2010, although at current rates<br />
of growth this will prove very challeng<strong>in</strong>g. The Government is now reported to be<br />
exam<strong>in</strong><strong>in</strong>g <strong>the</strong> potential for establish<strong>in</strong>g unbundl<strong>in</strong>g <strong>in</strong> fibre last mile access <strong>in</strong> densely<br />
populated areas (<strong>from</strong> Japan Telecom, KDDI and PoweredCom, albeit mostly targeted at<br />
bus<strong>in</strong>ess customers).<br />
59 http://onl<strong>in</strong>e.wsj.com/article/SB117856112849694724-<br />
search.html?KEYWORDS=AT%26T&COLLECTION=wsjie/6month<br />
60<br />
For a fuller discussion of evidence <strong>from</strong> <strong>the</strong> US, see Appendix C, pp 99-103, <strong>in</strong> ‘A Framework for Evaluat<strong>in</strong>g <strong>the</strong><br />
Value of Next Generation <strong>Broadband</strong>’, <strong>Broadband</strong> Stakeholder Group, June 2008.<br />
61 Source IDATE<br />
67
The Government, through its u-Japan broadband strategy, provides money for cities to<br />
wire schools and community centres, provides zero-<strong>in</strong>terest or low-<strong>in</strong>terest loans for<br />
cities and bus<strong>in</strong>esses to deploy broadband, and provides tax breaks for <strong>the</strong> purchase of<br />
network<strong>in</strong>g equipment. The universal service requirements on <strong>the</strong> NTTs are currently<br />
provided for by charg<strong>in</strong>g all subscribers. There are though proposals to allow <strong>the</strong> NTTs<br />
to cover remote areas through wireless. 62<br />
A.4 Korea<br />
In Korea, often cited as <strong>the</strong> world leaders <strong>in</strong> broadband, <strong>the</strong> government has taken an<br />
active role <strong>in</strong> <strong>in</strong>vest<strong>in</strong>g <strong>in</strong> <strong>in</strong>frastructure. The Government sought to offset costs of<br />
upgrad<strong>in</strong>g <strong>the</strong> access network by fund<strong>in</strong>g its own backbone network connect<strong>in</strong>g<br />
Government departments, on which SPs can rent capacity. 63<br />
It has additionally funded R&D for US$700m and provided low <strong>in</strong>terest loans of around<br />
£1bn, mostly targeted at access networks <strong>in</strong> remote areas.<br />
Additionally, <strong>the</strong> Korean government provided low <strong>in</strong>terest loans to Service providers,<br />
<strong>in</strong>itially for urban roll-out and <strong>the</strong>n <strong>in</strong>creas<strong>in</strong>gly to facilitate roll-out <strong>in</strong> remote areas. By<br />
contrast with Japan, <strong>the</strong> strategy has not been built upon local loop unbundl<strong>in</strong>g, which is<br />
not a major feature of <strong>the</strong> market, but low barriers to market entry and a relaxed licens<strong>in</strong>g<br />
structure have provided for a number of competitors.<br />
A.5 France<br />
In France, fibre deployment is happen<strong>in</strong>g as result of fierce competition <strong>in</strong> current<br />
generation broadband services, brought about pr<strong>in</strong>cipally by <strong>the</strong> <strong>in</strong>troduction of a<br />
rigorously-enforced local loop unbundl<strong>in</strong>g regime <strong>in</strong> <strong>the</strong> early part of this decade. 64 A<br />
number of companies responded to this regulatory development by enter<strong>in</strong>g <strong>the</strong> market<br />
to offer bundled broadband packages <strong>in</strong>clud<strong>in</strong>g VoIP, IPTV and a home gateway to<br />
provide <strong>in</strong> home-connectivity between different devices such as TVs and PCs.<br />
An entrepreneurial startup firm, Iliad (ILD.PA), which offers broadband services under<br />
<strong>the</strong> name Free, launched DSL service <strong>in</strong> October 2002, and now has over 2.5 million<br />
subscribers, all of whom use VoIP and get 90 channels of IPTV through <strong>the</strong> company’s<br />
Freebox offer<strong>in</strong>g. This service is offered for a monthly subscription of €29.99, a price<br />
po<strong>in</strong>t that has stayed <strong>the</strong> same throughout <strong>the</strong> period s<strong>in</strong>ce launch although <strong>the</strong> offer<strong>in</strong>g<br />
itself has expanded very substantially dur<strong>in</strong>g that time.<br />
Iliad, and fellow new entrant Neuf Cegetel, have subsequently moved to replace <strong>the</strong>ir<br />
leased copper loops with self-provided fibre connections. This is particularly attractive <strong>in</strong><br />
larger urban conurbations <strong>in</strong> France where population density is generally high, most<br />
people liv<strong>in</strong>g <strong>in</strong> apartment blocks, and per customer costs of upgrad<strong>in</strong>g to fibre hence<br />
relatively low. Iliad is plann<strong>in</strong>g to deploy fibre <strong>in</strong> Paris (although this may be delayed<br />
pend<strong>in</strong>g resolution of some regulatory issues). The City has provided low cost access to<br />
<strong>the</strong> sewers. The solution—a po<strong>in</strong>t-to-po<strong>in</strong>t fibre-to-<strong>the</strong>-home architecture—might be<br />
rolled out <strong>in</strong> o<strong>the</strong>r major French cities. The overall cost is estimated to be around EUR<br />
1bn. At <strong>the</strong> end of 2007, Iliad had passed 240,000 homes with fibre.<br />
62<br />
Source on strategy Global Insight<br />
63 At a cost of US$25.3 bn (source McK<strong>in</strong>sey)<br />
64<br />
French details draw on http://lw.pennnet.com/display_article/321309/63/ARTCL/none/none/1/France-<br />
Telecom-plans-massive-FTTH-roll-out-<strong>in</strong>-2009/; figures for rollout and homes passed <strong>from</strong> IDATE<br />
68
The operator Neuf is also offer<strong>in</strong>g FTTH <strong>in</strong> Paris (po<strong>in</strong>t-to-po<strong>in</strong>t) and a GPON offer<strong>in</strong>g<br />
<strong>in</strong> o<strong>the</strong>r cities, and reported 17,000 customers by <strong>the</strong> end of 2007. It plans to spend EUR<br />
300m to pass 1m homes, and by end 2007 was reported to have passed 120,000. This<br />
competition has prompted France Telecom <strong>in</strong>to deploy<strong>in</strong>g fibre, on a GPON basis, with<br />
a major roll-out planned for 2009. By <strong>the</strong> end of 2008, France Telecom plans to have 1<br />
million homes passed and 150,000 homes connected (by end 2007 it was reported to<br />
have passed 146,000). The French regulator ARCEP is also active <strong>in</strong> secur<strong>in</strong>g access to<br />
France Telecom’s duct space for its competitors, <strong>in</strong>clud<strong>in</strong>g by undertak<strong>in</strong>g an audit of<br />
FT’s ducts to establish whe<strong>the</strong>r <strong>the</strong>re is space for additional fibre. ARCEP has now<br />
stated its <strong>in</strong>tention to mandate access to FT’s ducts.<br />
Actual numbers of subscribers to fibre products <strong>in</strong> France rema<strong>in</strong> reasonably low—less<br />
than 50,000 <strong>in</strong> total.<br />
A.6 Italy<br />
One of <strong>the</strong> most strik<strong>in</strong>g scale deployments of fibre <strong>in</strong> Europe is that of Fastweb, a<br />
Milan-based new entrant which, IDATE estimates had passed more than two million<br />
homes with fibre connections by <strong>the</strong> end of <strong>the</strong> 2007. Its orig<strong>in</strong>al operations <strong>in</strong>volved<br />
build<strong>in</strong>g a new, overlay fibre network <strong>in</strong> municipal ducts, <strong>in</strong>itially <strong>in</strong> Milan and<br />
subsequently extend<strong>in</strong>g to o<strong>the</strong>r nor<strong>the</strong>rn Italian cities. The Milan municipality was an<br />
orig<strong>in</strong>al partner <strong>in</strong> <strong>the</strong> Fastweb consortium, and subsequently <strong>the</strong> <strong>in</strong>frastructure and civil<br />
works were split off <strong>in</strong>to a separate entity, Metroweb, <strong>in</strong> which <strong>the</strong> City of Milan reta<strong>in</strong>ed<br />
a controll<strong>in</strong>g <strong>in</strong>terest up to a sale to private equity <strong>in</strong>vestors <strong>in</strong> 2007.<br />
In contrast to <strong>the</strong> French experience, Fastweb did not enter <strong>the</strong> market as an unbundler<br />
and <strong>the</strong>n upgrade to provid<strong>in</strong>g its own fibre connections, but <strong>the</strong> exact opposite – with<br />
<strong>the</strong> availability s<strong>in</strong>ce 2004 of a fit for purpose LLU product <strong>in</strong> Italy, Fastweb’s bus<strong>in</strong>ess<br />
expansion has been <strong>in</strong>creas<strong>in</strong>gly based on sell<strong>in</strong>g LLU-based DSL services, and of its<br />
circa 1m customers, only around a quarter are believed to be us<strong>in</strong>g fibre-based products.<br />
None<strong>the</strong>less, <strong>the</strong> competitive pressure <strong>from</strong> Fastweb has prompted a competitive<br />
response <strong>from</strong> <strong>the</strong> <strong>in</strong>cumbent Telecom Italia, which <strong>in</strong> 2007 announced a plan to<br />
upgrade its network us<strong>in</strong>g pr<strong>in</strong>cipally FTTC technology, with an <strong>in</strong>itial target of mak<strong>in</strong>g<br />
<strong>the</strong> new platform available to around 5 percent of Italian households by <strong>the</strong> end of 2009,<br />
and a target to cover 65 percent of <strong>the</strong> population with<strong>in</strong> 10 years. 65<br />
In Italy too <strong>the</strong> regulator has required <strong>the</strong> <strong>in</strong>cumbent to open its civil access<br />
<strong>in</strong>frastructure to competitors.<br />
A.7 Germany<br />
In Germany, Deutsche Telekom has been engaged <strong>in</strong> a debate over regulatory<br />
forbearance. In 2005 it announced a strategy to deploy FTTC and VDSL <strong>in</strong> Germany’s<br />
50 largest cities cover<strong>in</strong>g 10.6m households at a cost of EUR3bn. 66 The German<br />
regulator BNetzA has removed <strong>the</strong> obligation on DT to unbundle fibre, but has<br />
proposed new obligations to share duct<strong>in</strong>g. The European Commission has reacted to<br />
this by launch<strong>in</strong>g a legal challenge. The resultant uncerta<strong>in</strong>ty has led to DT scal<strong>in</strong>g back<br />
its <strong>in</strong>vestment plans.<br />
The regulator has, meanwhile, required DT to provide access to fibre duct<strong>in</strong>g and dark<br />
fibre.<br />
65 Source: http://www.telecomsitaly.com/2007/03/telecom_italias_ngn2_ultrabroa.html<br />
66 Information on Germany drawn <strong>from</strong> Analysys (see http://www.analysys.com/pdfs/FTTx_product_pack.pdf) and<br />
McK<strong>in</strong>sey<br />
69
A.8 Sweden<br />
Sweden has one of <strong>the</strong> highest rates of broadband penetration <strong>in</strong> <strong>the</strong> world, based on a<br />
highly diverse and competitive market featur<strong>in</strong>g <strong>in</strong>cumbent DSL offer<strong>in</strong>gs, alternative<br />
operators us<strong>in</strong>g LLU and bitstream access and cable broadband offer<strong>in</strong>gs.<br />
The Swedish market has <strong>the</strong> highest total number of fibre subscribers of any EU country,<br />
estimated as around 300,000 by IDATE at <strong>the</strong> end of 2007. The European Commission’s<br />
13th Implementation Report puts <strong>the</strong> number of fibre connections higher, at 475,000 <strong>in</strong><br />
total as of January 2008. 67<br />
Much of this high rate of fibre connections <strong>in</strong> Sweden can be attributed to <strong>the</strong> existence<br />
of municipal fibre schemes. The Commission notes that 150 such companies or schemes<br />
are currently <strong>in</strong> existence, but also highlighted concerns of <strong>the</strong> Swedish regulator, PTS,<br />
that <strong>the</strong>re was no consistent bus<strong>in</strong>ess model <strong>in</strong> <strong>the</strong>se schemes and less than half offered<br />
wholesale access to third party providers, thus reduc<strong>in</strong>g <strong>the</strong> scope for effective<br />
competition.<br />
67 http://ec.europa.eu/<strong>in</strong>formation_society/policy/ecomm/doc/library/annualreports/13th/SEC(200)356DTSVol1fi<br />
nal.pdf<br />
70
Appendix B: Understand<strong>in</strong>g <strong>the</strong> Benefits and Costs<br />
<strong>from</strong> Public Investment <strong>in</strong> <strong>High</strong> <strong>Speed</strong><br />
<strong>Broadband</strong><br />
Policies to promote high speed broadband will have a range of impacts, both positive<br />
and negative. In this Appendix, we discuss <strong>the</strong> types of benefits and costs that could arise<br />
<strong>from</strong> subsidis<strong>in</strong>g high speed broadband. The way <strong>in</strong> which we def<strong>in</strong>e and categorise <strong>the</strong><br />
benefits and costs here draws heavily on Williamson and Marks (2008) 68 .<br />
B.1 Possible benefits<br />
The benefits of broadband technology come <strong>from</strong> <strong>the</strong> ability for users to transmit data<br />
between locations quickly, enabl<strong>in</strong>g <strong>the</strong>m to use applications effectively. Thus broadband<br />
only delivers real benefits to <strong>the</strong> extent that people use broadband to assist <strong>the</strong>m <strong>in</strong> do<strong>in</strong>g<br />
<strong>the</strong> activities <strong>the</strong>y want to do.<br />
Private benefits<br />
Ultimately <strong>the</strong> benefits <strong>from</strong> <strong>in</strong>creased usage of broadband come <strong>from</strong>:<br />
• Faster, more reliable, and/or better quality access to <strong>the</strong> applications people<br />
already use, and<br />
• The ability for people to access and use applications that <strong>the</strong>y don’t currently<br />
use (ei<strong>the</strong>r because <strong>the</strong>ir exist<strong>in</strong>g connection does not support exist<strong>in</strong>g<br />
applications or because <strong>the</strong> applications are not yet available).<br />
Williamson and Marks break <strong>the</strong>se private benefits <strong>from</strong> high speed broadband <strong>in</strong>to three<br />
categories:<br />
• Sav<strong>in</strong>g time—By do<strong>in</strong>g what <strong>the</strong>y do now, but <strong>in</strong> less time, users would<br />
benefit personally <strong>from</strong> hav<strong>in</strong>g more time to spend on o<strong>the</strong>r th<strong>in</strong>gs<br />
• Do<strong>in</strong>g more on l<strong>in</strong>e—Reduced time required to upload and download data<br />
may attract users towards applications that already exist, but that are “too<br />
hard” or “too slow” to access without a high speed broadband connection.<br />
Some <strong>New</strong> Zealanders currently do access “bandwidth hungry” applications<br />
(such as video conferenc<strong>in</strong>g, or shar<strong>in</strong>g and view<strong>in</strong>g multimedia content) over<br />
exist<strong>in</strong>g <strong>in</strong>frastructure. However, with access to faster, more reliable,<br />
connections is likely that usage of this type of application would <strong>in</strong>crease<br />
• Do<strong>in</strong>g new th<strong>in</strong>gs—Commentators widely recognize that, <strong>in</strong> <strong>the</strong> long run,<br />
<strong>the</strong> capability provided by high speed broadband will transform <strong>the</strong> way that<br />
we do th<strong>in</strong>gs, <strong>in</strong>clud<strong>in</strong>g <strong>the</strong> way <strong>in</strong> which we create, share, and distribute<br />
<strong>in</strong>formation. As high speed broadband becomes more widely available<br />
<strong>in</strong>ternationally, new applications are likely to emerge to take advantage of this<br />
development. To <strong>the</strong> extent that users access such applications <strong>in</strong> order to do<br />
new th<strong>in</strong>gs, this will deliver benefits. (This category of benefits is not available<br />
<strong>in</strong> <strong>the</strong> short term, as it depends on <strong>in</strong>novations that have not yet occurred)<br />
The above three categories of benefit are generally private benefits. That is <strong>the</strong> benefit<br />
accrues to <strong>the</strong> person us<strong>in</strong>g high speed broadband to access particular applications. We<br />
68 Williamson, M. & Marks, P. (2008) “A Framework for Evaluat<strong>in</strong>g <strong>the</strong> Value of Next Generation <strong>Broadband</strong>: A Report to <strong>the</strong><br />
<strong>Broadband</strong> Stakeholder Group” PLUM Consult<strong>in</strong>g<br />
71
would <strong>the</strong>refore expect people’s will<strong>in</strong>gness to pay for high speed broadband services to<br />
reflect <strong>the</strong> value of <strong>the</strong>se private benefits.<br />
Wider economic and social benefits<br />
In addition to <strong>the</strong> private benefits that users <strong>the</strong>mselves could ga<strong>in</strong>, greater take up of<br />
high speed broadband services could deliver wider economic benefits for <strong>New</strong> Zealand.<br />
For example, greater availability of high speed broadband services may:<br />
• Enable network effects—Network effects occur where <strong>the</strong> value of a service<br />
grows with <strong>the</strong> number of people us<strong>in</strong>g it. For example <strong>the</strong> value to a local<br />
bus<strong>in</strong>ess of hav<strong>in</strong>g <strong>in</strong>-house videoconferenc<strong>in</strong>g capability will depend on<br />
whe<strong>the</strong>r <strong>the</strong> people it wishes to communicate with (for example customers<br />
and suppliers) have access to <strong>the</strong> same capability. The more bus<strong>in</strong>esses are<br />
able to use videoconferenc<strong>in</strong>g, <strong>the</strong> greater <strong>the</strong> value of this application to<br />
everybody who uses it<br />
• Drive greater competition—Deployment of high speed broadband is part of<br />
an evolution <strong>in</strong> <strong>the</strong> telecommunications sector that has <strong>the</strong> potential to<br />
significantly change <strong>the</strong> competitive environment for <strong>the</strong> sector. 69 In addition,<br />
it is possible that wider deployment high speed broadband may enable<br />
bus<strong>in</strong>esses to operate more efficiently, and to access wider markets, lead<strong>in</strong>g to<br />
greater competition <strong>in</strong> o<strong>the</strong>r sectors of <strong>the</strong> economy as well, and<br />
• Improve productivity—To <strong>the</strong> extent that <strong>in</strong>dividuals and bus<strong>in</strong>esses take up<br />
high speed broadband services, this should lead to better <strong>in</strong>formation flows<br />
and more effective collaboration (<strong>in</strong>clud<strong>in</strong>g non-local collaboration), <strong>the</strong>reby<br />
improv<strong>in</strong>g productivity.<br />
B.2 Possible costs<br />
Williamson and Marks (2008) usefully categorise <strong>the</strong> costs associated deploy<strong>in</strong>g high<br />
speed broadband <strong>in</strong>to:<br />
• Costs for users and companies, and<br />
• Wider economic costs.<br />
Costs for users and companies<br />
Apart <strong>from</strong> pay<strong>in</strong>g for <strong>the</strong> service itself, users are likely to face additional costs <strong>in</strong> order<br />
to use high speed broadband. This may <strong>in</strong>clude purchas<strong>in</strong>g new <strong>in</strong> home equipment and<br />
upgrad<strong>in</strong>g wir<strong>in</strong>g <strong>in</strong> <strong>the</strong>ir homes, <strong>in</strong> particular <strong>in</strong> <strong>the</strong> case of older homes. Companies too<br />
will need to upgrade <strong>the</strong> ma<strong>in</strong> elements of <strong>the</strong>ir core networks to support <strong>the</strong> delivery of<br />
high speed broadband. Without address<strong>in</strong>g <strong>the</strong>se limitations, users would not be able to<br />
enjoy <strong>the</strong> benefits of high speed broadband.<br />
Where public <strong>in</strong>vestment accelerates <strong>the</strong> adoption of high speed broadband to <strong>the</strong> po<strong>in</strong>t<br />
where it displaces <strong>the</strong> ability to utilise current technologies, consumers will be forced to<br />
pay <strong>the</strong>se costs if <strong>the</strong>y want to use onl<strong>in</strong>e applications. 70 For example, if an FTTH<br />
69 The Commerce Commission has recognized <strong>the</strong> potential significance of <strong>the</strong> transition to “next generation<br />
networks” for <strong>the</strong> sector, and has launched a study <strong>in</strong>to next generation network issues to <strong>in</strong>vestigate <strong>the</strong><br />
commercial and competitive implications of <strong>the</strong>se developments (see<br />
http://www.comcom.govt.nz/IndustryRegulation/Telecommunications/Inquiries,ReviewsandStudies/DecisionsLis<br />
t.aspx#916).<br />
70 A precedent for this occurr<strong>in</strong>g can be drawn with <strong>the</strong> proposed switch off of <strong>the</strong> analogue television network. The<br />
<strong>New</strong> Zealand has mandated that <strong>the</strong> analogue television network will be “switched off” once 75 per cent of<br />
households have digital television or by 2012, whichever is sooner. (<strong>New</strong> Zealand Government media release, 29<br />
72
network was built us<strong>in</strong>g exist<strong>in</strong>g trenches, and replac<strong>in</strong>g <strong>the</strong> current copper<br />
<strong>in</strong>frastructure, market participants will no longer be able to provide low cost dial up or<br />
DSL services, as it is not possible to provide <strong>the</strong>se services over fibre technology.<br />
Wider economic costs<br />
There are a number of wider economic costs associated with public <strong>in</strong>vestment<br />
subsidis<strong>in</strong>g <strong>the</strong> deployment of high speed broadband which we must consider:<br />
• Strand<strong>in</strong>g sunk <strong>in</strong>vestments: Where public <strong>in</strong>vestment leads to <strong>the</strong><br />
construction and purchase of new <strong>in</strong>frastructure and equipment that displaces<br />
exist<strong>in</strong>g assets prior to <strong>the</strong> end of <strong>the</strong>ir economic life, those exist<strong>in</strong>g assets<br />
become redundant. The value of <strong>the</strong>se exist<strong>in</strong>g assets is lost as a result. This<br />
outcome, often referred to as “asset strand<strong>in</strong>g”, is a cost for all <strong>New</strong><br />
Zealanders, not just for <strong>the</strong> shareholders of companies that own <strong>the</strong><br />
<strong>in</strong>frastructure and equipment. The value of exist<strong>in</strong>g <strong>in</strong>frastructure and<br />
equipment to <strong>New</strong> Zealanders is <strong>in</strong> <strong>the</strong> benefits <strong>the</strong>y would forego if <strong>the</strong>se<br />
assets were no longer available to use.<br />
• Displac<strong>in</strong>g of private <strong>in</strong>vestment: Public <strong>in</strong>vestment which subsidises<br />
outcomes that would have o<strong>the</strong>rwise been delivered commercially, effectively<br />
displace private <strong>in</strong>vestment and <strong>the</strong>refore reduce economic activity. This<br />
represents a transfer of cost <strong>from</strong> <strong>the</strong> private sector to <strong>the</strong> taxpayer. As public<br />
funds are scarce, allocat<strong>in</strong>g public funds to outcomes that could be delivered<br />
commercially also would also come at <strong>the</strong> opportunity cost of not fund<strong>in</strong>g—<br />
or fund<strong>in</strong>g to a lesser extent—o<strong>the</strong>r public policy priorities. 71<br />
Rais<strong>in</strong>g taxes imposes “deadweight costs” on <strong>the</strong> economy. For example, if<br />
<strong>the</strong> policy makers were forced to <strong>in</strong>crease taxes (or were unable to reduce<br />
taxes) because of <strong>the</strong> need to fund subsidies, <strong>New</strong> Zealanders would have less<br />
<strong>in</strong>centive to participate <strong>in</strong> <strong>the</strong> workforce or work to <strong>in</strong>crease <strong>the</strong>ir <strong>in</strong>come.<br />
• Negative externalities: Public <strong>in</strong>vestment <strong>in</strong> br<strong>in</strong>g<strong>in</strong>g forward <strong>the</strong><br />
deployment of high speed broadband will also impact upon users and<br />
bus<strong>in</strong>esses <strong>in</strong> <strong>in</strong>direct ways. For example, <strong>the</strong> lay<strong>in</strong>g of buried fibre may<br />
require roads to be closed and new trenches to be dug, caus<strong>in</strong>g road traffic<br />
congestion and disruption to people and bus<strong>in</strong>esses.<br />
Policy makers must <strong>the</strong>refore carefully consider <strong>the</strong> potential impacts and distortions of<br />
market outcomes which could occur because of public <strong>in</strong>tervention, and look for ways to<br />
m<strong>in</strong>imize <strong>the</strong>se costs. We exam<strong>in</strong>e options for structur<strong>in</strong>g public <strong>in</strong>vestments <strong>in</strong> high<br />
speed broadband <strong>in</strong> section 5.<br />
November 2007) This means that at least 25 percent of households, and possibly more, will have to purchase a new<br />
digital television set earlier than <strong>the</strong>y o<strong>the</strong>rwise would have, or stop watch<strong>in</strong>g television.<br />
71 Economists refer to this as “opportunity cost”<br />
73
T: +1 (202) 466-6790<br />
F: +1 (202) 466-6797<br />
1700 K Street NW Suite 450<br />
WASHINGTON DC 20006<br />
United States of America<br />
T: +61 (2) 9231 6862<br />
F: +61 (2) 9231 3847<br />
Level 10, 1 Castlereagh Street<br />
SYDNEY NSW 2000<br />
Australia<br />
T: +64 (4) 913 2800<br />
F: +64 (4) 913 2808<br />
Level 2, 88 The Terrace<br />
PO Box 10-225<br />
WELLINGTON 6143<br />
<strong>New</strong> Zealand<br />
T: +33 (1) 45 27 24 55<br />
F: +33 (1) 45 20 17 69<br />
7 Rue Claude Chahu<br />
PARIS 75116<br />
France<br />
------------- www.castalia.fr<br />
I:\Projects\C08064 Telecom Policy\F<strong>in</strong>als\<strong>Castalia</strong> F<strong>in</strong>al Report Sent to clients 11 December.doc