Confidence Intervals Worksheet Name
Confidence Intervals Worksheet Name
Confidence Intervals Worksheet Name

Create successful ePaper yourself
Turn your PDF publications into a flip-book with our unique Google optimized e-Paper software.
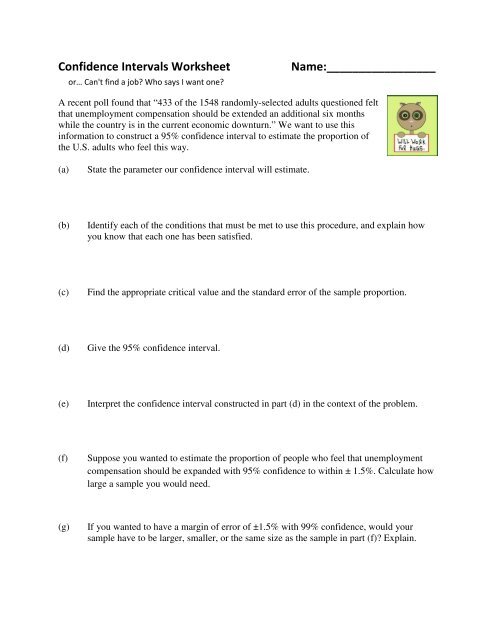
<strong>Confidence</strong> <strong>Intervals</strong> <strong>Worksheet</strong><br />
or… Can't find a job? Who says I want one?<br />
<strong>Name</strong>:_________________<br />
A recent poll found that “433 of the 1548 randomly-selected adults questioned felt<br />
that unemployment compensation should be extended an additional six months<br />
while the country is in the current economic downturn.” We want to use this<br />
information to construct a 95% confidence interval to estimate the proportion of<br />
the U.S. adults who feel this way.<br />
(a)<br />
State the parameter our confidence interval will estimate.<br />
(b)<br />
Identify each of the conditions that must be met to use this procedure, and explain how<br />
you know that each one has been satisfied.<br />
(c)<br />
Find the appropriate critical value and the standard error of the sample proportion.<br />
(d)<br />
Give the 95% confidence interval.<br />
(e)<br />
Interpret the confidence interval constructed in part (d) in the context of the problem.<br />
(f)<br />
Suppose you wanted to estimate the proportion of people who feel that unemployment<br />
compensation should be expanded with 95% confidence to within ± 1.5%. Calculate how<br />
large a sample you would need.<br />
(g)<br />
If you wanted to have a margin of error of ±1.5% with 99% confidence, would your<br />
sample have to be larger, smaller, or the same size as the sample in part (f)? Explain.
National Fuelsaver Corporation manufactures the<br />
Platinum Gasaver, a device they claim “may increase gas<br />
mileage by 30%.” Here are the percent changes in gas<br />
mileage for 15 identical, randomly-selected vehicles, as<br />
presented in one of the company’s advertisements:<br />
–2.4 6.9 10.4 10.8 24.8<br />
28.7 28.7 33.7 34.6 38.5<br />
40.2 44.6 46.8 46.9 48.3<br />
(a)<br />
The sample mean is ̅ = 29.43 and the sample standard deviation is s=16.23. Calculate<br />
and interpret the standard error of the mean for these data.<br />
(b)<br />
Construct and interpret a 90% confidence interval to estimate the mean change (in<br />
percent) in gas mileage. Does the data support the company’s claim? Use the four-step<br />
process. Don't forget to check your IRONS.