sap258entire
sap258entire
sap258entire

You also want an ePaper? Increase the reach of your titles
YUMPU automatically turns print PDFs into web optimized ePapers that Google loves.
Lin Roberts, Ann Brower, Geoff Kerr, Simon Lambert, Wendy McWilliam,<br />
Kevin Moore, John Quinn, David Simmons, Simon Thrush, Mike Townsend,<br />
Paul Blaschke, Robert Costanza, Ross Cullen, Ken Hughey and Steve Wratten
This report was written by:<br />
Lin Roberts 1 , Ann Brower 1 , Geoff Kerr 1 , Simon Lambert 1 , Wendy McWilliam 1 , Kevin Moore 1 , John Quinn 2 , David Simmons 1 , Simon Thrush 2,3 ,<br />
Mike Townsend 2 , Paul Blaschke 4 , Robert Costanza 5 , Ross Cullen 1 , Ken Hughey 1 , Steve Wratten 1<br />
1<br />
Lincoln University, PO Box 85084, Lincoln 7647, Canterbury, New Zealand.<br />
Email: Lin.Roberts@Lincoln.ac.nz<br />
2<br />
NIWA, PO Box 11115, Hillcrest, Hamilton 3251, New Zealand.<br />
3<br />
Current address: Institute of Marine Science, University of Auckland, Private Bag 92019, Auckland 1142, New Zealand.<br />
4<br />
Blaschke & Rutherford Environmental Consultants, 34 Pearce Street, Vogeltown, Wellington 6021, New Zealand.<br />
5<br />
Australian National University, Canberra ACT 0200, Australia.<br />
It may be cited as:<br />
Roberts, L.; Brower, A.; Kerr, G.; Lambert, S.; McWilliam, W.; Moore, K.; Quinn, J.; Simmons, D.; Thrush, S.; Townsend, M.; Blaschke, P.; Costanza,<br />
R.; Cullen, R.; Hughey, K.; Wratten, S. 2015: The nature of wellbeing: how nature’s ecosystem services contribute to the wellbeing of New Zealand<br />
and New Zealanders. Department of Conservation, Wellington. 145 p.<br />
Cover photo: Herb Christophers.<br />
This report is available from the departmental website in pdf form. Titles are listed in our catalogue on the website, refer<br />
www.doc.govt.nz under Publications, then Science & technical.<br />
© Copyright March 2015, New Zealand Department of Conservation<br />
ISBN<br />
978–0–478–15034–6 (web PDF)
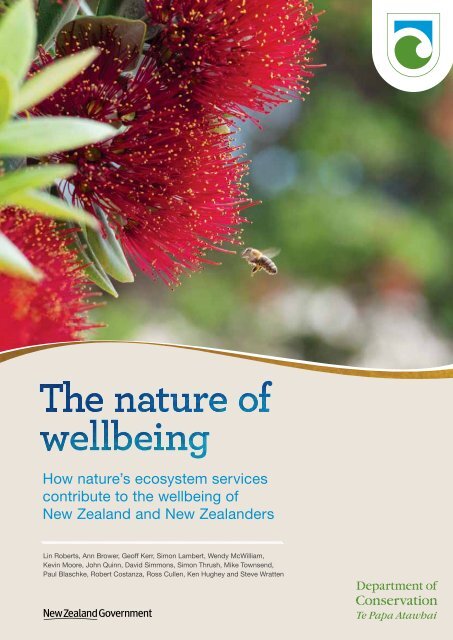
The nature of wellbeing<br />
How nature’s ecosystem services contribute<br />
to the wellbeing of New Zealand and<br />
New Zealanders<br />
Lin Roberts<br />
Ann Brower, Geoff Kerr, Simon Lambert, Wendy McWilliam,<br />
Kevin Moore, John Quinn, David Simmons, Simon Thrush,<br />
Mike Townsend, Paul Blaschke, Robert Costanza, Ross Cullen,<br />
Ken Hughey and Steve Wratten
Contents<br />
Executive summary 1<br />
Prologue: Ki uta ki tai—from the mountains to the sea 6<br />
1. Introduction 10<br />
1.1 Context: the decline of native biodiversity in New Zealand 10<br />
1.2 What are ecosystem services? 11<br />
1.3 Native biodiversity and ecosystem services in New Zealand 12<br />
1.4 Ecosystem services and the link to wellbeing in New Zealand 13<br />
2. The good life—what is wellbeing? 15<br />
2.1 Introduction 15<br />
2.2 Wellbeing and happiness 15<br />
2.3 Basic human needs 20<br />
2.4 Measuring progress—wellbeing and policy 24<br />
2.4.1 International developments 24<br />
2.4.2 New Zealand developments 31<br />
2.5 Wellbeing and natural capital 34<br />
2.6 Wellbeing and sustainability 37<br />
2.7 Wellbeing and ecosystem services 38<br />
3. How do ecosystem services contribute to our wellbeing? 40<br />
3.1 Subsistence 40<br />
3.1.1 Fresh water to drink, grow our food and provide electricity 40<br />
3.1.2 Clean air to breathe 42<br />
3.1.3 Food to nourish our bodies 43<br />
3.1.4 Associated services that make food production possible 46<br />
3.1.5 Health 50<br />
3.1.6 Energy to power our lives 52<br />
3.1.7 Shelter, storage and furnishings 53<br />
3.1.8 Clothing 53<br />
3.1.9 Other resources 54<br />
3.2 Protection 54<br />
3.2.1 Flood and erosion protection, and water purification 55<br />
3.2.2 Gas and climate regulation 59<br />
3.2.3 Diversity, resilience and insurance 61<br />
3.2.4 Habitat structure and ecological community services 63<br />
3.2.5 Medicine 63<br />
3.2.6 Air filtration 63<br />
3.2.7 Noise reduction 65<br />
3.2.8 Liquid and solid waste treatment, processing and storage 65<br />
3.3 Affection 67<br />
3.4 Understanding 69
3.5 Participation 72<br />
3.6 Leisure 74<br />
3.6.1 Leisure and environmental quality 78<br />
3.6.2 Tourism 79<br />
3.7 Creation 81<br />
3.8 Identity 83<br />
3.9 Freedom 84<br />
3.10 Material wealth 87<br />
3.10.1 Employment opportunities and ecosystem services 88<br />
3.10.2 New Zealand’s economy and ecosystem services 89<br />
3.10.3 Avoided costs and ecosystem services 91<br />
3.10.4 Risks to economic wealth in New Zealand 91<br />
4. How do we measure the contribution of ecosystem services? 93<br />
4.1 Valuation—monetary and non-monetary 93<br />
4.2 The role of monetary valuation 94<br />
4.3 Defining and categorising ecosystem services 95<br />
4.4 Conceptual principles and frameworks for valuation 96<br />
4.4.1 Total and marginal ecosystem service values 96<br />
4.4.2 Direct and indirect services 98<br />
4.4.3 Economic valuation frameworks 99<br />
4.5 Non-market valuation methods 101<br />
4.6 New Zealand applications 102<br />
5. Conclusions 107<br />
6. Acknowledgements 110<br />
7. References 111<br />
Appendix 1<br />
Glossary of wellbeing terms 140<br />
Appendix 2<br />
Summary of major approaches to wellbeing and human needs 144
executive summary<br />
No matter who we are or where we live, our well-being depends on the way ecosystems work<br />
(Haines-Young & Potschin 2010: 110)<br />
What do we need for a ‘good life’? At one level, the answer to this question will differ for each<br />
person. Yet at a deeper level, we all share a common set of fundamental needs that must be<br />
met for us to experience wellbeing. Understanding those needs and the crucial contribution of<br />
nature’s services in enabling us to meet them is the subject of this report.<br />
The report brings together research on wellbeing and research on ecosystem services, focusing<br />
principally on the services that come from indigenous ecosystems in New Zealand. There has<br />
been a massive upsurge in research on ecosystem services in the last 20 years, including much<br />
detailed research and discussion about how to classify and categorise the types of ecosystem<br />
services that contribute to wellbeing, and numerous studies attempting to determine the<br />
monetary value of various ecosystem services.<br />
However, the question of how to categorise and understand the types or aspects of wellbeing that<br />
ecosystem services may contribute to has not been explored to anywhere near the same extent.<br />
This may be a reflection of the fact that much of the impetus for studying ecosystem services<br />
has come from ecologists and economists, rather than from social scientists who are more<br />
familiar with the rapidly expanding wellbeing literature. To date, much of the work of ecologists<br />
has focused on the supply of ecosystem services, while that of economists has focused on the<br />
demands for ecosystem services, both marketed and non-marketed. However, there has been little<br />
focus on what is driving our demand for ecosystem services—a desire for enhanced wellbeing.<br />
What are ecosystem services?<br />
‘Ecosystem services’ can most simply be defined as the benefits people obtain from ecosystems.<br />
Ecosystems are widely considered to provide four categories of services: supporting (e.g. nutrient<br />
cycling, soil formation and primary production); provisioning (e.g. food, fresh water, wood, fibre<br />
and fuel); regulating (e.g. climate regulation, flood and disease regulation, and water purification);<br />
and cultural (aesthetic, spiritual, educational and recreational).<br />
What is wellbeing?<br />
The last 20 years have also seen a significant increase in research on wellbeing. Some of this<br />
research has focused on happiness, looking at the different contributors to happiness and how<br />
its different aspects can be measured. Other research has come from a policy perspective: as<br />
the limitations of using gross domestic product (GDP) as a measure of societal wellbeing and<br />
progress have become more widely debated, researchers and governments have been exploring<br />
how best to measure whether the wellbeing of a nation is improving. In the field of international<br />
development, there has been much research exploring whether a universal set of basic human<br />
needs can be identified and how the satisfaction of these needs results in wellbeing. In the<br />
sustainable development field, the limits of a finite natural system to cater for infinite wants is<br />
beginning to generate interest in the distinctions between needs, wants and wellbeing, and the<br />
possibilities of living a good life (perhaps even a better life) with a smaller ecological footprint.<br />
After reviewing the various strands of wellbeing research, we concluded that the most useful<br />
framework for assessing how ecosystem services contribute to wellbeing both globally and<br />
within New Zealand is Max-Neef’s (1991) theory of Human Scale Development. Max-Neef<br />
concluded that all humans have the same nine fundamental needs—subsistence, protection,<br />
The nature of wellbeing<br />
1
affection, understanding, participation, leisure, creation, identity and freedom. However, how<br />
these needs are satisfied will vary between individuals and cultures. Max-Neef also recognised<br />
that not all ‘satisfiers’ are equally effective at allowing people to meet their needs. For example,<br />
some satisfiers might allow the simultaneous satisfaction of many needs (e.g. breastfeeding may<br />
satisfy subsistence, protection and affection), while others may only appear to satisfy needs, or<br />
may satisfy one need but make it harder to satisfy other needs. If our fundamental needs are not<br />
met, we experience a range of poverties; if our needs are fully met, we achieve wellbeing.<br />
The choices we make about how to satisfy our needs have an impact on both how much<br />
wellbeing we achieve and how much impact we have on ecosystem services. Recognising that<br />
we have some universal needs, but that there are a variety of ways (with varying effectiveness<br />
and impacts on nature) of satisfying those needs, allows us to explore how we might achieve<br />
the ‘double dividend’ of enhanced wellbeing and flourishing ecosystem services. In a world in<br />
which economic consumption is threatening to erode the integrity of global ecosystems, it is<br />
particularly vital that we identify which types of consumption contribute to the satisfaction of<br />
human needs and hence wellbeing, and which simply operate as pseudo-satisfiers, or worse,<br />
impair our ability to satisfy our needs.<br />
How do ecosystem services contribute to wellbeing?<br />
We examined each of Max-Neef’s nine fundamental needs in turn and examined how ecosystem<br />
services contribute to the satisfaction of these needs, leading to enhanced wellbeing.<br />
Subsistence: The essentials for our subsistence—fresh air to breathe, clean water to drink, food<br />
to eat, shelter and clothing—all come from nature. Marine phytoplankton and native and exotic<br />
plant species generate the oxygen we breathe. In New Zealand, the food species we farm and<br />
hunt on our land are nearly all imported, but indigenous biodiversity has a key role in delivering<br />
clean water to our farmlands, nutrients to our crops, and providing food for the pollinators of our<br />
crops and natural enemies for our crop pests. By contrast, our food from the sea almost entirely<br />
consists of species whose natural habitat is here in the South Pacific, living in ecosystems that<br />
depend on a whole suite of ecosystem processes and services. For Māori, the importance of<br />
gathering food from their tribal lands and waters—mahinga kai—is argued through Treaty claims<br />
and increasingly reasserted in the post-Treaty settlement era. Nutritious food from healthy<br />
ecosystems, and opportunities to spend time in, recreate in and be inspired by green and blue<br />
spaces contribute to our physical and psychological human health. The energy to power our<br />
lives—from basic needs to high consumer lifestyles—also comes from nature. Fossil fuels are<br />
stores of energy that were originally trapped by plants living millions of years ago, while biofuels<br />
contain energy that has more recently been trapped by plants; and hydroelectricity, wind,<br />
geothermal and tidal power are all derived from natural systems. Timber and wood fibre for our<br />
housing, furniture, paper and sometimes heating comes from exotic and native forests, which are<br />
served by and produce a suite of ecosystem services. Although most clothing fibre production in<br />
New Zealand uses imported species and materials, the merino sheep and possums that produce<br />
the fibre for warm elegant fabrics graze on native tussocks and forests, respectively.<br />
Protection: Ecosystem services help to protect us from floods, droughts and disease. Native<br />
forests and other types of plant cover store the carbon we release, and so play a significant role<br />
in helping to stabilise and moderate the climate. Forest, tussocks and mosses capture and hold<br />
water, reducing the risk of landslides and floods downstream, while wetlands and swamps play a<br />
critical role in absorbing floodwaters and purifying our waters. When ecosystems are degraded,<br />
they are not as resilient in the face of natural and technological disasters, and our sense of<br />
safety and security can be affected due to further degradation of ecosystems, economic loss, and<br />
increased reliance on social safety nets and recovery services. Trees filter our air and dampen<br />
noise, and plants and microorganisms form the basis of many medicines and play a significant<br />
role in rongoa, the traditional medicinal practices of Māori.<br />
2 The nature of wellbeing
Affection: The need to give and receive affection is a fundamental component of wellbeing.<br />
Although we did not locate any research demonstrating that ecosystem services have a direct<br />
impact on how loving our relationships are, a positive impact would not be surprising given the<br />
well-documented relaxing and restorative aspects of natural environments, and the fact that<br />
positive emotions and shared activities facilitate social bonds and associated affection. Certainly,<br />
there is abundant anecdotal evidence that youthful shared experiences in natural environments<br />
can be the foundation of enduring lifelong friendships. Further, there is evidence that individuals<br />
who place importance on their relations with others also place importance on their relationship<br />
with nature, and the biophilia hypothesis suggests that there is an instinctive bond between<br />
human beings and other living systems.<br />
Understanding: Ecosystems provide a plethora of learning opportunities at many levels<br />
of education and there is evidence that some forms of learning are enhanced in natural<br />
settings. Research and the formal and informal transfer of knowledge and skills lead to greater<br />
understanding of how ecosystems function and how our actions affect the provisioning of these<br />
services—essential for our continued wellbeing.<br />
Participation: Being involved with others in activities and sharing particular experiences<br />
with them develops the bonds that tie people together in society, enhancing feelings of<br />
connectedness, trust, mutual obligation and belonging. New Zealand’s natural spaces provide<br />
a wide range of settings for shared activities such as tramping, climbing, sailing, swimming,<br />
picnicking, walking and cycling. Thousands of New Zealanders volunteer each year to join with<br />
others in biodiversity restoration projects throughout the country.<br />
Leisure: Ecosystems provide a wealth of leisure and recreational opportunities in rural and urban<br />
contexts, which enhance the health and wellbeing of participants. Mountains, forests, rivers, lakes<br />
and beaches provide tranquil settings for some forms of leisure and exhilarating opportunities<br />
for others. Natural places provide key settings for New Zealand recreation and tourism, which, in<br />
turn, underpin social capital, societal resilience and our standard of living.<br />
Creation: Many artists, including Māori carvers and weavers, painters, photographers, poets,<br />
fiction and non-fiction writers, cinematographers, architects, and musicians, have drawn<br />
inspiration from New Zealand landscapes and wildlife. New Zealand art came of age in the 1930s,<br />
when the depicted landscapes no longer looked like Europe, but instead captured the biodiversity<br />
and landscapes that could only be found in this country. The shapes of the koru and the kiwi and<br />
the shell of the paua are fashioned into numerous craftworks that can be found in every tourist<br />
gift store. Our natural world also inspires creativity in science, technology, engineering and<br />
business, from the Hamilton jet engine to Icebreaker merino garments and world-leading pest<br />
control techniques.<br />
Identity: New Zealanders’ sense of self-definition, and how we portray ourselves to customers,<br />
tourists, immigrants and the rest of the world, is heavily bound up with our natural world. Though<br />
most of us may live in cities, we name ourselves after a native bird, our top sports teams wear<br />
the silver fern, a fern koru adorns our national airline, and the heroes we identify with, such as<br />
Sir Edmund Hillary and Sir Peter Blake, were shaped by our rugged mountains or our coastal<br />
waters. For Māori, whakapapa links to particular mountains, waters and resources are fundamental<br />
markers of identity, which remain regardless of where individuals or whānau are domiciled.<br />
Freedom: Max-Neef defined this need in terms of autonomy, open-mindedness, equal rights,<br />
and the right to dissent, run risks, develop awareness, be different from and experience different<br />
settings. In New Zealand, the opportunity to test oneself and take risks is readily available.<br />
Access to the coastline is available to nearly every New Zealander, and access to parks and<br />
reserves is a ‘free’ public good, which means that everyone has an equal right to use and benefit<br />
from these spaces, creating greater equality than if one had to pay. However, inequality of income<br />
means that some New Zealanders are unable to access the natural estate, in particular those parts<br />
The nature of wellbeing<br />
3
that require extended travel or costly equipment to explore safely. The income we earn from our<br />
natural capital contributes to the freedom that many New Zealanders experience to explore their<br />
own country and the rest of the world.<br />
Material wealth: Nature’s services also make a significant contribution to the material wealth of<br />
New Zealand and New Zealanders. Max-Neef (1991) did not consider material wealth as one of our<br />
fundamental needs, but for most of us wealth is an important means to meeting at least some of<br />
those needs (e.g. food, shelter, clothing). The Millennium Ecosystem Assessment also recognises<br />
that income may be needed to provide the ‘basic material for good life’. The economic wealth of<br />
New Zealand is heavily dependent on the natural environment. In 2012, 13 of our top 20 commodity<br />
exports (accounting for 77.4% of income) came from biologically based sectors (dairy, meat, timber,<br />
fruit, seafood, wine, wool, etc.) 1 which depend heavily on functioning intact ecosystems for both<br />
production and processing generated wastes. Tourism generates similar export earnings to dairy,<br />
and again our natural landscapes and unique flora and fauna are key drawcards. Further, in 2011,<br />
76.7% of our electricity and 39% of our total energy supply came from renewable energy sources<br />
(principally hydro, geothermal, biogas, wood and wind). However, happiness research suggests<br />
that beyond a certain income, the happiness returns on additional income steadily taper off, and<br />
that a focus on material goods is actually linked with decreased wellbeing. As a society, we are<br />
using the goods and services provided by nature to gain material wealth beyond the level needed<br />
to satisfy Max-Neef’s nine fundamental needs, and continue to do so even when we move into<br />
very low or negative happiness returns. However, unbundling ‘necessary’ consumption from<br />
‘excessive’ consumption is a task that as a society we do not yet have the experience, tools or even<br />
language to do. It is not within the scope of this work to identify which nature-dependent incomegenerating<br />
activities on balance contribute to wellbeing, and which may impose ecosystem costs<br />
that exceed their wellbeing benefits. We simply note that it cannot be assumed that all incomegenerating<br />
activities add to wellbeing and that this is a subject for debate—a debate we believe<br />
our society needs to have.<br />
How do we value ecosystem services?<br />
The question of how the value of these services should be calculated has generated much debate<br />
over the last 10 years. Consensus has been emerging that final ecosystem services (provisioning,<br />
cultural and regulating) should be valued, but that the contributing supporting services should<br />
not, to avoid double counting—although which services are considered ‘final’ will depend on the<br />
context of the analysis. Also, while estimates of the total value of ecosystem services may be<br />
useful in raising awareness of our dependence on these services, in the decision-making context,<br />
valuation should address the implications of policy-relevant changes in ecosystem services.<br />
A range of economic valuation methods is available, although not all services are easily valued,<br />
and valuation can be both costly and time consuming. Applications have typically concentrated<br />
on a limited range of Max-Neef’s fundamental needs, but those applications underscore the<br />
importance of ecosystem services and of accounting for services that are not manifested in the<br />
marketplace.<br />
1 www.nzte.govt.nz/en/invest/statistics/<br />
4 The nature of wellbeing
Conclusion<br />
The ecosystem services delivered by indigenous biodiversity and natural ecosystems contribute<br />
in a wide variety of ways to the wellbeing of New Zealand and New Zealanders. They not only<br />
provide many of our basic needs and enhance our safety, they also breathe the fundamental<br />
essence into what it means to be a New Zealander.<br />
Some New Zealanders appear to be highly aware (either consciously or intuitively) that their<br />
own wellbeing is linked to the health of the indigenous biodiversity that delivers so many of<br />
these services, and are actively participating in restoration projects around the country. However,<br />
many others appear to be unaware of these connections. The ecosystem services concept has<br />
proven to be an invaluable tool internationally and in New Zealand for communicating our<br />
dependence on ecosystem services, and is leading to improved policy and practice. We look<br />
forward to its increased use in New Zealand, greatly increased research to support its use, and<br />
the incorporation of ecosystem services as a key component in the Department of Conservation’s<br />
engagement with its many partners across the community and in education at all levels.<br />
However, we believe that a clearer understanding of the main contributors to wellbeing, and the<br />
ways in which our choices can affect both the level of wellbeing and the level of environmental<br />
impact, is equally important.<br />
There is increasing interest both in New Zealand and internationally for improved measurement<br />
of wellbeing and for public decision making to more effectively take account of the impacts on<br />
wellbeing. This report shows that any account of how wellbeing in New Zealand is produced<br />
and sustained must include as a major element a comprehensive and robust accounting of the<br />
contribution of ecosystem services. It also suggests that consideration of impacts on different<br />
ecosystem services, and hence on different aspects of wellbeing, should be a more prominent part<br />
of public decision making, for instance in resource use applications.<br />
We believe that fostering discussion, research and education on the different components of<br />
wellbeing (e.g. what really does make us happy?) will broaden New Zealanders’ understanding<br />
of the many factors that contribute to personal and national wellbeing, including a greater<br />
awareness of the irreplaceable contribution of ecosystem services. Further exploration of the<br />
impact of our individual and collective choices of satisfiers on both our own wellbeing and on<br />
the wellbeing of ecosystems (and hence the wellbeing of our descendants)—and recognition that<br />
we have many more choices than we currently exercise—will equip us to make more thoughtful<br />
decisions about how we use, manage and protect our ecosystems and indigenous biodiversity.<br />
If we can become better at identifying and choosing high-happiness-return/low-impact<br />
consumption over high-impact/low-happiness-return consumption, we will not only improve our<br />
own wellbeing and that of supporting ecosystems, but will also enhance the opportunity for our<br />
grandchildren and others on the planet to meet their basic needs and enjoy ‘the good life’.<br />
The nature of wellbeing<br />
5
Prologue: Ki uta ki tai—from the mountains<br />
to the sea<br />
To set the scene and illustrate the contribution of ecosystem services to New Zealanders’<br />
wellbeing, we will take you on a journey from the mountains to the sea. Conservation landscapes<br />
surround all New Zealanders 2 , and are the beginning and end of our transect, being prominent<br />
at the summits and along the coastlines of the three main islands of New Zealand. They envelop<br />
New Zealanders in ecosystem services that we are aware of only occasionally, but from which we<br />
benefit both physically and psychologically.<br />
Tekapo<br />
We start our journey in the heart of the Southern Alps/Kā Tiritiri o te Moana in Aoraki/Mt Cook<br />
National Park, at the source of water for Lake Tekapo. In these high, permanently snow-capped<br />
mountains, species such as that the Mt Cook lily and mountain wētā thrive, and the geography<br />
of the landscape has a major influence on the ecosystems downstream. For it is here that the<br />
dominating westerly flow of air rises from the Tasman Sea to cross the Alps, releasing its moisture<br />
as snow and rain in enormous quantities, before descending again and warming and drying as it<br />
crosses the Canterbury Plains to the coast and the Pacific Ocean. The snow provides the storehouse<br />
for the water that flows into Lake Tekapo; the energy from floodwaters moves the eroding sediment<br />
downstream; and the rivers and lakes provide a host of in- and out-of-stream services.<br />
Lake Tekapo is just west of Tekapo township. Here, you will notice the craggy peaks towering<br />
over the lake, the obvious glacial history of the basin and a lake that is so blue that it looks<br />
surreal. If this is your first visit to the high country, you are likely to search your memory and<br />
realise that you have never seen water so blue. The blues of the lake, the golds of the hills and the<br />
greys of the sometimes angry-seeming sky are not soon forgotten.<br />
After a few minutes, you will slowly start to notice something that you cannot identify straight<br />
away. It is not a presence but an absence—the absence of noise. There are no tourism amenities<br />
for the guidebooks to describe at this place. All you can see is pure, unadulterated space.<br />
But the space is far from empty. As your ears become accustomed, you pick up the chirp of<br />
grasshoppers and the exultant song of a skylark far overhead. Though the peaks look abrupt<br />
and the sky may appear angry, the space welcomes New Zealanders and international visitors<br />
alike. The Te Araroa Trail passes nearby on its long and often arduous route along the length<br />
of New Zealand. As you look down the lake you will see sheep and deer production, Round Hill<br />
ski field, and a private alpinism concession serving international and domestic clients. On the<br />
true left of the lake, you can see the steep slopes of ridge after ridge of the Two Thumb Range,<br />
which host independent and guided trampers, hunters and Nordic skiers who might travel up<br />
the seemingly never-ending Snake Ridge to traverse Stag Saddle into Mesopotamia Station. The<br />
expansive skies and ‘lost world’ character of Mesopotamia inspired Samuel Butler’s fantastical<br />
satire, Erewhon—an anagram of Nowhere. Formerly Crown pastoral leasehold land, Mesopotamia<br />
is now largely conservation land that has a lucrative exclusive hunting concession over much<br />
of it. Visitors—be they New Zealanders exploring their homeland or adventurous tourists from<br />
other countries—might fish for trout, or hunt for deer or tahr on the rolling tussock slopes. On the<br />
2 Many conservation landscapes are owned and managed in partnership with local authorities, iwi, private landowners,<br />
leaseholders, concessionaires and non-government organisations, rather than by the Department of Conservation alone. This<br />
defiance of the ‘myth of the big green blob’ (Cowart & Fairfax 1988) often allows for more provision of ecosystem services, from<br />
more land, for more New Zealanders and our guests. The inter-connectedness of these partnerships can also provide more<br />
stability and resilience in the landscape-level provision of ecosystem services than the monolithic ‘big green blob’ model of<br />
management (Brower & Page 2011).<br />
6 The nature of wellbeing
shore of the lake by the Tekapo township sits the renowned Church of the Good Shepherd, where<br />
thousands of couples come for their weddings, combining their love for each other with their love<br />
of this spectacular landscape. 3<br />
High above the lake on the true right, you will see the University of Canterbury’s Mt John<br />
Observatory, which is visited by 14 000 people per year (90% of whom are international visitors)<br />
(Wood 2012). The observatory depends on the crystalline air that Tekapo’s Nowhere provides.<br />
The uninterrupted night time darkness of this place was protected in 2012 by the Aoraki<br />
Mackenzie Dark Sky Preserve, the biggest starlight preserve in the world (Gorman 2012).<br />
While appearing empty at first glance, Tekapo’s Nowhere contributes to the wellbeing of<br />
New Zealanders and our guests in many ways: the sheep and deer farming provides raw materials<br />
for our basic needs of food and clothing; the broad expanses of deep-rooted tussock sequester<br />
carbon, host nitrogen-fixing microbiota (Line & Loutit 1973), and burn into the mind’s eye of<br />
many New Zealanders as one of their essential mental images of ‘home’; the undammed braided<br />
rivers flowing into Lake Tekapo provide habitat for native and sports fish, and endemic birds,<br />
invertebrates and plants, and clean water for drinking and teeth-chattering swimming; the water<br />
flowing out of the lake spins turbines to generate electricity and irrigates pastures; the cliffs,<br />
ridges, nooks and valleys provide recreation, leisure and tourism opportunities that contribute to<br />
visitors’ fitness, health and happiness.<br />
Between the mountains and the sea<br />
Below Lake Tekapo and above Timaru City on Caroline Bay there are a diversity of landscapes—<br />
productive, protective and lived-in lands that are connected by roads and also by a wide variety of<br />
rivers.<br />
Rivers play a significant role in the culture of New Zealanders. They form the central focus of<br />
David Young’s 1986 book Faces of the River, in the foreword of which Eddie Durie, former Chief<br />
Judge of the Maori Land Court, wrote: ‘Faces of the River is an invitation to confront ourselves.<br />
The river teaches us where we have been, where we are now, and where we might be going.’ In<br />
his 2013 book on New Zealand rivers, Young stated: ‘Rivers, therefore, are both repository and<br />
metaphor for our wider cultural attitudes. There is no reason why rivers should divide us and<br />
every reason why they should bring us together’ (Young 2013: 11).<br />
Water from Lake Tekapo provides life-supporting services that help safeguard threatened<br />
endemic birds (such as the kakī or black stilt) and endangered insects (such as the robust<br />
grasshopper). Its water replenishes the hydro lakes that supply a significant proportion of<br />
New Zealand’s renewable energy, and are home to an important recreational trout fishery, a<br />
tourism resource in its own right.<br />
Further downstream, below the lakes, the Waitaki River drives the rural hinterland, providing<br />
high-quality water to major irrigation schemes, which supply highly productive dairy farms,<br />
horticultural operations and cropping ventures. This river water also replenishes the renewable<br />
groundwater resources that are used by farmers, industry and domestic water users; and the same<br />
braided river is home to threatened birds and native fish, including large numbers of endangered<br />
tara pirohe/black-fronted terns and tuna/long-finned eels. The rolling hill country’s valleys<br />
support remnant areas of native forest and wetlands, which store and purify water, and which<br />
harbour important components of our biodiversity, including pekapeka/short-tailed bats.<br />
On its journey to the sea, the river picks up and transports a lot of sediment—but not enough<br />
to stop the landward erosion of the shoreline between here and Timaru. Thus, while there are<br />
mountains, headwater tributaries and man-made lakes, there remains an important continuity<br />
3 www.tekapotourism.co.nz/weddings.html; www.laketekapoweddings.co.nz/Lake%20Tekapo%20location.htm<br />
The nature of wellbeing<br />
7
that assures at least partial fulfilment of all the ecosystem service roles the Waitaki can bring.<br />
Such roles were immortalised in the song ‘The Ballad of the Waitaki’, made popular in the 1960s<br />
by ‘The Plainsmen’:<br />
So flow on again Waitaki,<br />
on your journey to the sea,<br />
making power for all New Zealand,<br />
better life for folks like me. 4<br />
Perhaps, though, we should think not only about the connecting role of the rivers (and roads), but<br />
also of the air we breathe, as this provides the biggest, most all-encompassing and continuous,<br />
and clearest connection between the mountains and sea. It is this air, which is picked up along<br />
the West Coast of the South Island, lifted above the Southern Alps/Kā Tiritiri o te Moana and<br />
hurled at us by Canterbury’s famous föhn wind (the Canterbury nor’wester), that links directly<br />
and indirectly to many of the services we so hugely rely on. The nor’wester not only controls our<br />
climate, but also our rivers and therefore, ultimately, our coastline.<br />
Caroline Bay<br />
We finish our journey at Caroline Bay, a popular coastal landscape bordering the city of Timaru,<br />
on the east coast of the South Island. This small bay will help illustrate the tangible contributions<br />
that conservation landscapes make to the wellbeing of New Zealanders.<br />
In New Zealand, our coasts connect us to the marine environment and the oceans connect us to<br />
the rest of the world. Our history and future are strongly influenced by the sea. We are a highly<br />
maritime nation with an extensive marine environment—more than 20 times larger than the land<br />
area. Marine activities are central to our culture and spiritual wellbeing, and we derive direct<br />
economic benefits from fishing, tourism, aquaculture, power generation, mining, and oil and gas<br />
extraction. Our coastal ecosystems are for most of us the key point for direct engagement with<br />
the marine environment, with 75% of our population living within 10 km of the sea. Picnicking,<br />
walking the dog, swimming, fishing, diving and paddling along the coast, and breathing in sea air<br />
are activities that many of us enjoy—and these activities are supported by a wide range of marine<br />
ecosystem services that are derived from a marine environment that has unique biota and a<br />
fantastically rich biodiversity.<br />
Caroline Bay is the only safe swimming beach between Oamaru to the south and Banks<br />
Peninsula to the north, yet some of its ongoing wellbeing and supporting services are essentially<br />
‘man-made’. From south of Oamaru to just south of Banks Peninsula, almost the entire length<br />
of coast is eroding to the sea at rates of around 1–2 m per year. So, although the Waitaki<br />
contributes sediment to the coast (as do other large rivers, such as the Rangitata and Rakaia),<br />
this is enough only to slow the erosion rate. At Caroline Bay, however, something different<br />
is happening—the beach is growing. Since Timaru city’s port construction began in 1878,<br />
approximately 30 000 m 3 of sand has accumulated annually in the shelter of the North Mole, and<br />
the shoreline has advanced seaward by more than 650 m. The fauna of Caroline Bay is similar<br />
to that of Pegasus Bay: crustaceans dominate inshore habitats; species diversity increases with<br />
depth; and bivalves, including the filter-feeding wedge shell, are common in the surf zone. This<br />
biodiversity is different from that found in the rest of the Canterbury Bight and is contributing to<br />
the biodiversity of the area (see Hart et al. 2008). This is also the single most popular beach along<br />
this vast stretch of coastline—it supports a thriving summertime community, triathlons, boating<br />
and fishing.<br />
4<br />
Hear this at www.youtube.com/watch?v=uS0aqdbIQz8.<br />
8 The nature of wellbeing
There are almost no fences separating the recreational, cultural, ecological, residential and<br />
heritage services offered by the Caroline Bay ecosystem. In fact, the only locked fences are in<br />
place to protect recreationists from rock-fall danger and a fledgling colony of threatened kororā/<br />
little blue penguins from predators. So seamless are the boundaries of ownership of ecosystem<br />
services provision at Caroline Bay that the public walking track from the north passes in front of<br />
privately owned properties.<br />
Both the summery bustle and wintery desolation of Caroline Bay contribute to wellbeing in<br />
manifold ways. The Bay contributes to health and leisure by providing opportunities for surfing,<br />
swimming (and shivering after swimming!), walking, running, mountain biking, picnicking,<br />
paragliding and kayaking. The grass-cloaked hills overlooking the sea moderate the local<br />
microclimate, capture rain and filter the air we breathe.<br />
Caroline Bay also offers other ecosystem services that are less obvious to the untrained eye<br />
than these recreational, cultural and health benefits. The penguins, which are doggedly hanging<br />
on, are symbols of other biodiversity (such as fish). The vegetation sequesters carbon, and<br />
intercepts rain and mist, bolstering soil moisture content to buffer the often long, dry summers.<br />
The vegetation also provides refuges for native beetles and other insects, some of which benefit<br />
farming operations near and far by controlling agricultural pests.<br />
At the land-sea interfaces (at the Waitaki River and Lake Wainono to the south, and at the Opihi<br />
and Rangitata Rivers to the north, for example), the semi-estuarine and lagoon environments<br />
form highly productive systems. These areas are well known for recreation, offering opportunities<br />
for angling, boating, sight-seeing and spiritual renewal. Beneath the surface, the rivers and their<br />
lagoons disperse and recycle nutrients, and host fish breeding grounds and bird moulting sites.<br />
The native reeds, plants and algae regulate water quality, providing a last-ditch effort to filter<br />
urban and rural run-off before it runs out to sea.<br />
Though most New Zealanders think of our nation as two or more islands poking out of the vast<br />
Pacific Ocean, 90% of New Zealand lies beneath that ocean. What is known as New Zealand is<br />
the above-sea part of a continent known as Zealandia, which comprises 3.5 million km 2 of mostly<br />
submerged land (Mortimer et al. 1999). As the flat beach of Caroline Bay slopes into the sea,<br />
the marine environment takes over in providing commercial and recreational fish harvest, and<br />
potential pharmaceutical discoveries. It supports aquaculture by dispersing nutrients around<br />
the bays and estuaries; and it regulates the sand dunes of Caroline Bay and other beaches with<br />
beach nourishment, providing a modicum of flood protection in neap tides. Marine biodiversity<br />
is supported by a wide range of habitats, from estuaries to deep-sea abyssal plains, with<br />
oceanographic variation across 30 o of latitude.<br />
Conclusion<br />
This mountains to the sea story delivers multiple messages about nature’s services. Everywhere<br />
they are of value and everywhere they are connected, and water is one of the most important<br />
of these connectors. These connections can be damaged and/or broken—by dams, pollution,<br />
farmland and roads, for example. However, these damaged or broken connections can be repaired,<br />
allowing them to continue to provide most of the services that are still largely uninterrupted in the<br />
mountains and the sea. These repairs can take many forms, including environmental flows in rivers,<br />
riparian plantings along stream banks and native shelter belts on farmland. It is the beneficial<br />
native insects, the shelter of the native trees, the seed-dispersing value of native birds, and the<br />
cultural and other values of our native fish (both freshwater and marine) that demonstrate the<br />
health of our ecosystem services and the roles they play not only in the productive environment,<br />
but also in all the other contexts that make our home Aotearoa/New Zealand. In addition, the<br />
seemingly empty spaces at both ends of this journey are important in their own right—time spent<br />
in such unadulterated yet bounteous spaces can provide New Zealanders with shelter from the<br />
proverbial storms of urban life.<br />
The nature of wellbeing<br />
9
1. Introduction<br />
If we are to discover and describe fully the importance of biodiversity to human well-being then<br />
we have to understand just how the connections to well-being are made.<br />
(Haines-Young & Potschin 2010: 120)<br />
1.1 Context: the decline of native biodiversity in New Zealand<br />
The New Zealand Biodiversity Strategy (DOC & MfE 2000) tells the story of the ongoing decline<br />
of biodiversity in New Zealand since the arrival of humans. As one of the last places on Earth to<br />
be settled by humans, our country has one of the worst records of indigenous biodiversity loss<br />
(e.g. see Hitchmough 2002; MfE 2007). While biodiversity varies in natural cycles, nothing since<br />
the extinction of the dinosaurs 65 million years ago compares with the decline in indigenous<br />
biodiversity in New Zealand over the last century (DOC & MfE 2000). More recently, changes<br />
in attitudes to the natural environment and an increase in active conservation management,<br />
particularly over the last three decades, appear to have slowed the rate of decline. However, this<br />
has not been sufficient to halt it (DOC & MfE 2000; Green & Clarkson 2005).<br />
A recent internal Department of Conservation (DOC) report (Roberts 2013) assessed the<br />
current state of indigenous biodiversity in New Zealand. It used the most recent literature and<br />
unpublished data to provide evidence of the decline that had been depicted conceptually in<br />
the New Zealand Biodiversity Strategy. The report concluded that indigenous taxa and the<br />
ecosystems in which they live continue to be under immense pressure from human-induced<br />
changes, predators, weed invasions, land use and, more recently, the intensification of indigenous<br />
vegetation clearance for farming, and that it is likely that climate change will exacerbate these<br />
pressures. It noted that deterioration in the status of threatened species has continued and the<br />
rate of deterioration is possibly increasing; for example, the status of 13 bird species deteriorated<br />
between 2005 and 2008 due to declines in population trend or size (Miskelly et al. 2008); the<br />
status of two skink species declined between 2005 and 2009 (Hitchmough et al. 2010); the<br />
number of threatened vascular plants rose from 243 in 2008 to 289 in 2012 (de Lange et al. 2013);<br />
and the proportion of freshwater fish classified as Threatened or At Risk rose from 53% in 2005 to<br />
67% in 2009 (Allibone et al. 2010).<br />
However, despite the accumulating evidence of ongoing loss of New Zealand’s biodiversity,<br />
the New Zealand public appear to be largely ignorant of this. In their 2010 biennial survey of<br />
Public Perceptions of New Zealand’s Environment, Hughey et al. (2010) noted that, although<br />
the evidence indicated that the state of New Zealand’s biodiversity can be regarded as bad or<br />
very bad, survey respondents continued to rate the condition and diversity of native land and<br />
freshwater plants and animals as adequate to good:<br />
Why respondents continue to rate the condition of New Zealand’s native plants and animals as<br />
‘adequate’ or ‘good’ remains surprising when clearly it is not the case … We continue to suggest<br />
the need for more research in this area, but it can be hypothesised that the enormous amount<br />
of apparently ‘good’ news about endangered species management projects (e.g., increases in<br />
kakapo numbers, high profile investments in growing numbers of fenced sanctuaries) is masking<br />
the true gravity of the biodiversity crisis in New Zealand.<br />
(Hughey et al. 2010; 33)<br />
Therefore, it seems likely that the time, energy, commitment, funding and attitude changes that<br />
are needed to reverse this decline will not be found without greater awareness of the trends and<br />
of the significance of these trends to human wellbeing.<br />
10 The nature of wellbeing
1.2 What are ecosystem services?<br />
‘Ecosystem services’ can most simply be defined as the benefits people obtain from ecosystems<br />
(MEA 2005a) 5 . The term ‘ecosystem services’ was first coined by Ehrlich & Ehrlich (1981), but it<br />
was not until the late 1990s that the concept received wide public attention, following publication<br />
of the work of Costanza et al. (1997) and Daily (1997). At the same time, the interdisciplinary field<br />
of ecological economics developed the concept of natural capital (Costanza & Daly 1992; Jansson<br />
et al. 1994; Dasgupta et al. 2000), defining it as the stock of renewable and non-renewable<br />
resources from which ecosystem goods and services flow, to demonstrate the significance of<br />
ecosystems in providing the biophysical underpinnings for societal development and all human<br />
economies (Common & Perrings 1992; Arrow et al. 1995).<br />
Since the late 1990s, there has been an explosion of research and policy focused on ecosystem<br />
services. The most ambitious integrated research project to date has been the Millennium<br />
Ecosystem Assessment (MEA 2005a), a comprehensive assessment of the world’s ecosystems<br />
carried out by more than 1300 natural and social scientists from 95 countries (Kumar 2010).<br />
This project concluded that human activity is having a significant and escalating impact on<br />
the biodiversity of world ecosystems, reducing both their resilience 6 and their biocapacity 7 .<br />
The report refers to natural systems as humanity’s ‘life-support system’, providing essential<br />
ecosystem services. The assessment measured 24 ecosystem services, and concluded that only<br />
four have shown improvement over the last 50 years, 15 are in serious decline and five are in a<br />
stable state overall but under threat in some parts of the world (MEA 2005a).<br />
The MEA recognised four categories of services: supporting (e.g. nutrient cycling, soil formation<br />
and primary production); provisioning (e.g. food, fresh water, wood, fibre and fuel); regulating<br />
(e.g. climate regulation, flood and disease regulation, and water purification); and cultural<br />
(aesthetic, spiritual, educational and recreational). Variations on this categorisation are discussed<br />
in more detail in Section 4.2.<br />
The MEA has been followed by a number of other major initiatives, including the Economics<br />
of Ecosystems and Biodiversity (TEEB 2010a), the UK National Ecosystem Assessment (UK<br />
NEA 2011) and the Intergovernmental Platform on Biodiversity and Ecosystem Services 8 . The<br />
classification used by The Economics of Ecosystems and Biodiversity project is given in Table 1<br />
(Kumar 2010).<br />
The consistent message coming from scientists and other disciplines involved in these<br />
programmes is that planetary resources are finite, and we are depleting the natural capital that<br />
underpins our subsistence and the other elements of human wellbeing. One of the reasons for<br />
the increased research interest in this area is that the concept of ecosystem services is providing<br />
a language for raising awareness about this dependence on nature that so many of us have<br />
forgotten or do not recognise, and for identifying, describing and discussing the various ways<br />
in which our wellbeing is linked to the wellbeing of our natural systems. Developing ways to<br />
quantify the relative contribution of different ecosystem services is also starting to prove a useful<br />
input into decision-making about ecosystem management. Largely, however, this research has<br />
been focused on the services themselves and how the delivery of these services is dependent<br />
on the functioning of integrated healthy ecosystems. The hope is that if we can gain a better<br />
understanding of how ecosystems work, their resilience and their fragility, and how important<br />
their services are to our survival, we will be motivated to take better care of them before they are<br />
irreparably degraded.<br />
5<br />
Exactly how to define ecosystem services remains a subject of active debate. Since the concept was first introduced, numerous<br />
definitions and frameworks have been proposed. This is discussed in greater details in Section 4.3.<br />
6<br />
Resilience is defined as the capacity of a system—be it a forest, city or economy—to deal with change and to continue to<br />
develop, not only withstanding shocks and disturbances (such as climate change or financial crisis), but also using such events<br />
to catalyse renewal and innovation (Stockholm Resilience Centre 2011). (See further discussion in Section 3.2.3)<br />
7<br />
Biocapacity is the capacity of an area to provide resources and absorb waste.<br />
8<br />
www.ipbes.net/about-ipbes.htm<br />
The nature of wellbeing<br />
11
Table 1. Typology of ecosystem services in The Economics of Ecosystems and<br />
Biodiversity project (2010).<br />
Main service types<br />
Provisioning services<br />
1 Food (e.g. fish, game, fruit)<br />
2 Water (e.g. for drinking, irrigation, cooling)<br />
3 Raw materials (e.g. fibre, timber, fuelwood, fodder, fertilizer)<br />
4 Genetic resources (e.g. for crop-improvement, medicinal purposes)<br />
5 Medicinal resources (e.g. biochemical products, models, test organisms)<br />
6 Ornamental resources (e.g. artisan work, decorative plants, pet animals, fashion)<br />
Regulating services<br />
7 Air quality regulation (e.g. capturing (fine) dust, chemicals)<br />
8 Climate regulation (including C-sequestration, influence of vegetation on rainfall, etc.)<br />
9 Moderation of extreme events (e.g. storm protection, flood prevention)<br />
10 Regulation of water flows (e.g. natural drainage, irrigation, drought prevention)<br />
11 Waste treatment (especially water purification)<br />
12 Erosion prevention<br />
13 Maintenance of soil fertility (including soil formation) and nutrient cycling<br />
14 Pollination<br />
15 Biological control (e.g. seed dispersal, pest and disease control)<br />
Habitat services<br />
16 Maintenance of life cycles of migratory species (including nursery service)<br />
17 Maintenance of genetic diversity (especially through gene pool protection)<br />
Cultural and amenity services<br />
18 Aesthetic information<br />
19 Opportunities for recreation and tourism<br />
20 Inspiration for culture, art and design<br />
21 Spiritual experience<br />
22 Information for cognitive development<br />
Source: Kumar (2010: 26).<br />
1.3 Native biodiversity and ecosystem services in New Zealand<br />
As in other parts of the world, there has also been an increasing interest in New Zealand in<br />
improving understanding of the services and benefits provided by native biodiversity and<br />
ecosystems to human wellbeing. The Department of Conservation has commissioned a series<br />
of research projects that aim to establish an evidence base supporting the links between<br />
New Zealand native biodiversity and the ecosystem services that contribute to human wellbeing.<br />
As part of this work, McAlpine & Wotton (2009) reviewed the literature on ecosystem services<br />
in New Zealand, focussing on those services that are most likely to be affected by conservation<br />
activities but are least likely to be within the realms of general public awareness. This review<br />
covered a subset of regulating and supporting ecosystems services, namely air quality, climate<br />
regulation, water quality, quantity and flow, soil fertility and stability, pest and disease regulation,<br />
pollination, natural hazard protection, and nutrient cycling, as well as the provisioning service of<br />
fish stocks. They concluded that there is good evidence to suggest that intact natural vegetation<br />
in New Zealand improves water quality, helps to maintain a regular water supply, preserves<br />
soil fertility, reduces soil erosion and provides flood protection. However, they also noted that<br />
ecosystem services research in New Zealand is still in its infancy, and so while, for example,<br />
the notion that biodiversity per se is fundamental for all ecosystem services is largely accepted<br />
as a general concept in the international literature, further research is required to understand<br />
12 The nature of wellbeing
the complex relationships and to establish the specific mechanisms by which New Zealand’s<br />
indigenous biodiversity contributes to the maintenance of ecosystem services.<br />
DOC is also producing a separate report that examines the role of indigenous biodiversity in<br />
ecosystem service provision in New Zealand by exploring three interrelated questions:<br />
••<br />
Do we need indigenous biodiversity and healthy functioning ecosystems in order to<br />
receive the ecosystem services we depend on?<br />
••<br />
What are the consequences of biodiversity decline for service provision?<br />
••<br />
How does conserving indigenous biodiversity affect the supply of services in the long term?<br />
A range of other agencies, including most of the country’s Crown Research Institutes and<br />
universities, have also contributed to recent ecosystem services research in New Zealand.<br />
Specific research programmes include the Ministry for Primary Industry’s project on mapping<br />
the values of New Zealand’s coastal waters (Beaumont et al. 2008 and 2009; Allen et al. 2009;<br />
Batstone et al. 2009; Samarasinghe et al. 2009; MacDiarmid et al. 2008) and Landcare Research’s<br />
Ecosystem services for multiple outcomes 9 research programme. One product of the latter<br />
programme is the publication Ecosystem Services in New Zealand: Conditions and Trends (edited<br />
by Dymond, 2013). Research projects include research focussed on specific ecosystem services,<br />
such as pollination (by Plant and Food Research) 10 ; and on ecosystem services associated with<br />
particular locations, such as the Hauraki Gulf (Townsend & Thrush 2010; Townsend et al. 2014).<br />
1.4 Ecosystem services and the link to wellbeing in New Zealand<br />
Just as there has been an upsurge in research on biodiversity and ecosystem services in the<br />
last 20 years, there has also been a significant increase in research on wellbeing. However there<br />
has been comparatively little research focused on the interface between ecosystem services and<br />
wellbeing—how different aspects of our wellbeing may be influenced by the state and supply<br />
of ecosystem services, and how some of the ways we attempt to achieve wellbeing impact on<br />
ecosystem services.<br />
This report therefore explores what we currently know about wellbeing, and the links between<br />
different aspects of our wellbeing and the services delivered by the full range of ecosystems in<br />
New Zealand. It also examines how we assess the value of ecosystem services.<br />
The main focus of this report is on services that are delivered by indigenous ecosystems and<br />
biodiversity. However, in the case of some services, there is simply insufficient knowledge of<br />
how particular indigenous ecosystems deliver their services to allow us to limit ourselves to<br />
indigenous systems. It can also be argued that for those New Zealanders who lack awareness<br />
of their dependence on any ecosystem services, the first step to appreciation of the value<br />
of ecosystem services is to understand services in general, whether they come from exotic<br />
or indigenous biodiversity, or from natural or managed ecosystems, and recognition that<br />
indigenous ecosystems deliver particularly valued services may follow on from that.<br />
We begin, in Chapter 2, with a review of the literature and the evolution of thinking around what<br />
wellbeing is, how we should measure it and how the satisfaction of basic human needs leads to<br />
wellbeing.<br />
In Chapter 3 the theory of human needs developed by Max-Neef (1991) is used as a framework<br />
for exploring the various ways in which ecosystem services allow us to satisfy our basic needs<br />
9<br />
www.landcareresearch.co.nz/science/soils-and-landscapes/ecosystem-services/ecosystem-services-for-multiple-outcomes<br />
(accessed 8 August 2014)<br />
10<br />
www.plantandfood.co.nz/page/our-research/sustainable-production/products-systems/pollination-systems (accessed 8 August<br />
2014)<br />
The nature of wellbeing<br />
13
and hence achieve wellbeing The aim here is not to give a comprehensive compilation of all the<br />
connections but, rather, to provide a broad overview of each area and some selected examples as<br />
a prompt for further discussion and research. Given its topical nature and the pervasiveness of<br />
water in our lives, we have given particular emphasis to the role of our freshwater systems.<br />
Chapter 4 explores how we estimate the value of ecosystem services, including the different<br />
ways in which services can be categorised and the different valuation methods that are available,<br />
together with the results of some of these valuations.<br />
The report concludes in Chapter 5 with a discussion of some of the implications and applications<br />
of our findings for research, policy and practice.<br />
14 The nature of wellbeing
2. The good life—what is wellbeing?<br />
2.1 Introduction<br />
Seeking to understand what leads to happiness, wellbeing and the good life has been a focus of<br />
philosophy and poetry for most of human history. Recently, however, there has been a massive<br />
upsurge in research on happiness and wellbeing, with the number of published papers on the<br />
topic increasing from less than ten per year in the 1960s to more than 2000 per year in the last<br />
decade (Diener 2008: chapter 24).<br />
This upsurge in interest was partly triggered by the publication of an essay by Easterlin (1974),<br />
who reported that although the per capita income in the USA had doubled in the period between<br />
1946 and 1974, individuals’ levels of happiness (measured as self-reported overall life satisfaction)<br />
were unchanged. In the 40 years since then, two complementary and overlapping fields of<br />
research have blossomed:<br />
••<br />
What is wellbeing? How do we measure happiness and what are the main contributors to<br />
happiness and human wellbeing?<br />
••<br />
How do we measure progress? If the implicit assumption that economic growth<br />
automatically leads to enhanced wellbeing is flawed, what should we be measuring if we<br />
want to check that our policies and practices are heading in the right direction? Should<br />
improving wellbeing be a more explicit focus of government policy?<br />
Over much the same period—partly because of the persistence of poverty around the world—<br />
there has been a burgeoning of research into how to define and understand human needs, and<br />
how the satisfaction of human needs is linked to wellbeing and development.<br />
The desire to increase human wellbeing is the driver for most of the negative impacts that<br />
humans have on ecosystems and ecosystem services. However, there is increasing evidence<br />
that when ecosystem services are reduced, human wellbeing also declines—and so, some of<br />
the actions we take in striving to improve our wellbeing may in fact be jeopardising it. It is<br />
therefore very important that we gain a much better understanding of the key contributors to<br />
human wellbeing so that we can explore whether wellbeing can be enhanced without negatively<br />
impacting on ecosystems and their services.<br />
This chapter therefore explores recent developments in understanding and measuring wellbeing<br />
and happiness, and the main factors that contribute to enhancing them.<br />
2.2 Wellbeing and happiness<br />
Wellbeing can be defined as:<br />
… a positive physical, social and mental state; it is not just the absence of pain, discomfort and<br />
incapacity. It requires that basic needs are met, that individuals have a sense of purpose, that<br />
they feel able to achieve important personal goals and participate in society. It is enhanced by<br />
conditions that include supportive personal relationships, strong and inclusive communities,<br />
good health, financial and personal security, rewarding employment, and a healthy and<br />
attractive environment.<br />
(Defra & National Statistics 2007: 111)<br />
… a positive and sustainable state that allows individuals, groups or nations to thrive and flourish.<br />
(Huppert et al. 2004: 1331)<br />
Many disciplines have become engaged in wellbeing and happiness research, but there is<br />
surprisingly little cross-fertilisation between them. The work on wellbeing has acquired a basic<br />
armoury of concepts from the fields of psychology, ethics and welfare economics (seen in the<br />
The nature of wellbeing<br />
15
work of, for example, Ed Diener, Derek Parfit and Amartya Sen), but still lacks a standard shared,<br />
integrative and tested set of terms (Gough et al. 2007). Different authors, for example, often use<br />
the same terms to mean different things—e.g. ‘wellbeing’ is often used interchangeably with<br />
‘subjective wellbeing’, ‘life satisfaction’ or ‘happiness’—and as a result, some of the distinctions<br />
being established by some authors (e.g. that life satisfaction and happiness measures respond<br />
differently to increasing income) are not being noticed by others. Appendix 1 provides a Glossary<br />
to guide readers through this varied terminology, and Appendix 2 summarises the major<br />
approaches to wellbeing and human needs in psychology.<br />
Orthodox neo-classical economics 11 relies overwhelmingly on the ‘preference satisfaction’<br />
account of wellbeing, in which wellbeing comprises the freedom and resources to meet one’s<br />
wants and desires. The assumption is that individuals will maximise their ‘utility’, that the range<br />
of things they might desire is unlimited and that a larger income will mean that they can attain<br />
more of their desires (Jackson et al. 2004; MacKerron 2012; Green 2013). Dodds (1997) and<br />
Jackson et al. (2004) detail some of the criticisms and limitations of this approach.<br />
The newer fields of ecological economics (e.g. Dodds 1997), behavioural economics (e.g. Schwartz<br />
et al. 2002), neuroeconomics (e.g. Jamison 2008) and happiness economics (e.g. Frey & Stutzer<br />
2002) are bringing a more nuanced understanding of human functioning and behaviour.<br />
Happiness economics concerns itself predominantly with ‘subjective wellbeing’, i.e. how an<br />
individual assesses his or her own life—mainly focusing on how satisfied they are with their<br />
life and sometimes with how happy they are. Economists have primarily been interested in<br />
how happiness varies with relative income parameters (both time-lagged and peer incomes)<br />
and macroeconomic variables, including unemployment, inflation and governance. Most of<br />
the happiness research published in mainstream economics journals to date has concerned<br />
itself with these explanatory factors, but there is growing interest in other influences, such as<br />
indicators of social and environmental capital (MacKerron 2012).<br />
In psychology, research has traditionally focused on either ‘normal’ psychological and emotional<br />
functioning, or psychological dysfunction and disturbance. However, since the work of Abraham<br />
Maslow, Carl Rogers, Rollo May and others in the 1940s and 1950s, there has been an increased<br />
focus on people’s positive psychological potential. This attention to the positive psychological<br />
functioning is found in Maslow’s (1954) notion of a distinctive need for self-actualisation, Rogers’<br />
(1961) emphasis on the process of self-directed ‘becoming’ and May’s (1953) concern with the<br />
central role of meaning in human life expressed in his book Man’s search for himself.<br />
Against that backdrop, work on wellbeing from a psychological perspective explicitly began with<br />
Diener’s (1984) exploration of what he termed ‘subjective wellbeing’. It is ‘subjective’ because<br />
instead of evaluating a person’s wellbeing by independently observing various aspects of their<br />
life that are thought to contribute to wellbeing (such as health, income and hours of work—<br />
objective wellbeing), the approach is simply to ask the person how they are finding their life and<br />
11<br />
Neoclassical economics is a particular school of economic thinking that dominates microeconomics and, together with<br />
Keynesian economics, forms the neoclassical synthesis that dominates mainstream economics today (Clark 1998).<br />
As expressed by Weintraub (2007), neoclassical economics rests on three assumptions (although certain branches of<br />
neoclassical theory may have different approaches):<br />
• People have rational preferences among outcomes that can be identified and associated with a value<br />
• Individuals maximise utility and firms maximise profits<br />
• People act independently on the basis of full and relevant information<br />
From these three assumptions, neoclassical economists have built a structure that is aimed at understanding the allocation of<br />
scarce resources among alternative ends. Over the last 15 years, and particularly since the 2008 Global Financial Crisis, there<br />
have been a growing number of critiques of neoclassical economics (e.g. Keen 2001; Aldred 2009; Chang 2010; Hill & Myatt<br />
2010; Korten 2010; Solow 2010; Adler 2011; Soros 2011), including many that suggest that the neoclassical economic model<br />
does not reflect biophysical reality and so is incompatible with sustainability (e.g. Daly 1997; Davies 2004; Hall & Klitgaard<br />
2006; Smith & Max-Neef 2010; Jackson 2011; Rist 2011). In 2010, the World Economic Association was formed to provide<br />
a forum for a greater diversity of economic thinking, and after only 28 months it had gained over 12 000 members (www.<br />
worldeconomicsassociation.org), making it the world’s second largest professional organisation for the study of economics.<br />
At around the same time, the Institute of New Economic Thinking (http://ineteconomics.org/) was formed with similar goals.<br />
16 The nature of wellbeing
to let them be the judge. Subjective wellbeing is generally understood to include three aspects,<br />
and different surveys will ask about some or all of these: life satisfaction (e.g. ‘How satisfied are<br />
you with your life as a whole?’), happiness (e.g. ’How happy are you now?’) and unhappiness<br />
(e.g. ‘Are you experiencing negative emotions such as sadness, guilt and anger?’).<br />
Studies of ‘life satisfaction’ are often being reported as studies of ‘happiness’. However, there is<br />
an important distinction between the two—questions about life satisfaction tend to elicit how<br />
people think their life is going, whereas the response to a happiness question tends to be based<br />
on how they feel it is now 12 . When people are asked how satisfied they are with their life, there<br />
tends to be a positive correlation with material things, such as a higher standard of living and<br />
the possession of luxury items (or ‘economic prosperity’). By contrast, when people are asked<br />
how happy they are feeling, once they have enough to cover their basic needs, the correlation<br />
is strongest with immaterial things, such as having close friends, feeling respected and being<br />
able to count on others in an emergency (or ‘social psychological prosperity’; Diener et al. 2010).<br />
However, since the majority of studies on the relationship between ‘happiness’ and income (or<br />
standard of living) are actually ‘life satisfaction’ studies, the importance of social psychological<br />
prosperity for wellbeing is frequently discounted. See Box 1 for further discussion around the<br />
relationship between wealth, wellbeing and happiness.<br />
Subjective wellbeing as it is usually defined is generally said to be a hedonistic theory of<br />
wellbeing, i.e. it emphasises the attainment of pleasure and the avoidance of pain as the central<br />
characteristics of wellbeing. Another philosophical school dating back to Aristotle supports a<br />
eudaimonic theory of happiness and wellbeing—eudaimonia is Greek for ‘good spirit’ or ‘true<br />
nature’ and this view sees happiness or ‘the good life’ not as a state, but more as a process of<br />
fulfilling one’s best and truest potential 13 .<br />
Interestingly, the approach of psychologist Martin Seligman, who developed the field that is now<br />
known as ‘positive psychology’, has evolved over the last 10 years from hedonistic, pleasure-based<br />
theories of psychological wellbeing to more eudaimonic approaches. His latest book Flourish<br />
(Seligman 2011) introduced an approach that goes beyond ‘happiness’ to present a theory of<br />
human wellbeing under the acronym PERMA, which stands for the independent elements of<br />
wellbeing: Positive affect, Engagement, positive Relationships, Meaning and Accomplishment.<br />
A number of commentators (Sointu 2005; Carlisle et al. 2009; Kjell 2011) have argued that<br />
over the last 20 years, concepts of wellbeing in psychology and in much public discourse have<br />
increasingly reflected the individualistic nature of Western cultures, which ‘places the onus<br />
of wellbeing on the individual’ (Christopher 1999). When the focus is inward on oneself and<br />
one’s own happiness, the pleasure, fulfilment and long-term wellbeing gained from caring<br />
for others and for the environment are missed. Kellert & Wilson (1993) argued that humans<br />
receive psychological benefits from caring for other species—a hypothesis that was tested by<br />
Ferrer-i-Carbonell & Gowdy (2007), who found that people who show concern about positive<br />
environmental features (e.g. nature landscapes, interactions with animals and plants) have<br />
higher wellbeing. Carlisle et al. (2009) and Kjell (2011) suggested that giving more attention to<br />
interdependencies with other people and with nature could enhance both our understanding of<br />
wellbeing and wellbeing itself.<br />
12<br />
While ‘life satisfaction’ is often explained as a cognitive evaluation of how one’s life is going (rather than a report on feelings<br />
about life), Seligman (2011: 13) argued, ‘[a]veraged over many people, the mood you are in determines more than 70 percent of<br />
how much life satisfaction you report and how well you judge your life to be going at that moment determines less than<br />
30 percent’.<br />
13<br />
Given that philosophers have been grappling with how to attain eudaimonia or happiness for at least 2000 years, we cannot do<br />
justice to all the nuances of the debate in this brief document. Of recent scholars, Ryff (1989), Waterman (1993) and Deci & Ryan<br />
(2008) have helped develop this view of wellbeing.<br />
The nature of wellbeing<br />
17
Box 1—Wealth, wellbeing and happiness<br />
It is a common assumption that increased income will bring us greater happiness. Indeed, it is such<br />
an entrenched idea that for decades many governments have simply taken it for granted that an<br />
increase in GDP per capita will lead to greater happiness for all.<br />
However, it turns out that the relationship is more complex—more income may make us feel more<br />
satisfied with our life, but it only has a significant impact on our day-to-day happiness when<br />
our current income is low (Diener & Oishi 2000; Diener & Biswas-Diener 2002; Diener et al. 2010;<br />
Kahneman & Deaton 2010). If we previously did not have enough to meet our basic needs, then<br />
having more money definitely makes us happier. Also, it is well known that being unemployed<br />
reduces wellbeing—for both financial and social reasons—while a steady income from employment<br />
provides greater financial security (Diener 2008, see also section 3.10.1). This plays out both<br />
within countries and between countries—people in richer countries are significantly happier on<br />
average than people in poorer ones (Bradburn 1969; Inglehart & Klingemann 2000). But once we<br />
have enough to meet our basic needs 14 —and it turns out we need surprisingly little to do that—<br />
the happiness returns on more income steadily taper off. This relationship has been found around<br />
the world (Veenhoven 1995; Frey & Stutzer 2002; Helliwell 2003; Cummins 2012), including in<br />
New Zealand, where Sengupta et al. (2012) found that the increase in happiness with income was<br />
greatest as people moved from $10,000 to $30,000 a year and started to plateau after that. For<br />
people with an above-median household income ($65,000), and even more so beyond a salary of<br />
$125,000, increases in income had only a trivial incremental effect on increased happiness.<br />
One explanation for the diminishing happiness dividend of greater income is that while more money<br />
does tend to make us happier in the short term, the human capacity to adapt to new situations<br />
means that we quickly adapt to the higher income, and so over time we tend to revert to our<br />
previous level of happiness (Brickman & Campbell 1971; Easterlin 2002; Easterlin et al. 2010).<br />
What the increased income is spent on also makes a difference (Pchelin & Howell 2014). If additional<br />
income is spent on increasing material goods (e.g. bigger house, flasher car, more gear, especially if<br />
in an unending attempt to retain status relative to others), then wellbeing does not reliably increase,<br />
and may actually decline. Psychologists have found repeatedly that individuals who put a big<br />
premium on higher incomes generally are less happy and more vulnerable to other psychological ills<br />
than individuals who do not crave higher incomes (see Kasser 2002). In the Western cultural context,<br />
the evidence is now very strong that those who focus on extrinsic goals, such as financial success<br />
and social recognition, report lower levels of happiness, less vitality and self-actualisation, poorer<br />
interpersonal relationships and more depression and anxiety than people who focus on intrinsic<br />
goals, such as affiliation, self-acceptance and community feeling (Kasser & Ryan 1993, 1996, 2001;<br />
Ryan et al. 1999; Nickerson et al. 2003; Kasser et al. 2004; Eckersley 2005; Carlisle et al. 2009;<br />
Pchelin & Howell 2014). These findings have recently been confirmed in a New Zealand study of<br />
Otago students (Yamaguchi & Halberstadt 2012). In other words, while higher income may raise<br />
happiness to some extent, the quest for higher income may actually reduce one’s happiness—it may<br />
be nice to have more money but not so nice to crave it.<br />
In their paper ‘If money doesn’t make you happy, consider time’, Aaker et al. (2010) summed up<br />
the research on the problems of such a money focus like this: ‘A growing number of studies show<br />
that simply thinking about money fosters behaviours that are misaligned with happiness. The mere<br />
mention of money leads individuals to be less likely to help others (Vohs et al. 2006), donate to<br />
charity (Liu & Aaker 2008), and socialise with friends and family (Mogilner 2010)—behaviors that<br />
are tied to personal happiness (Lyubomirsky et al. 2005). Priming money also motivates individuals<br />
to work more (Mogilner 2010) which—although productive—tends to be associated with the least<br />
happy part of one’s day (Kahneman et al. 2004). Finally, subtle reminders of wealth impair people’s<br />
Continued on next page<br />
14<br />
Here we are using basic needs to refer to fundamentals such as food and shelter. What people consider as ‘basic needs’ or<br />
‘everyday needs’ appears to escalate as they get wealthier. Sengupta et al. (2012) found that an increase in household income<br />
had the greatest impact on a person’s perception of their ability to meet their everyday needs if they were in the poorest quartile<br />
of the population, and flattened off somewhat for those above the income median, but did not ever plateau. Even among those<br />
who earn around $200,000, an increase in household income led to an increase in the perception of the ability ‘to meet everyday<br />
needs’, suggesting that people shift their reference point for what constitutes everyday needs and life necessities.<br />
18 The nature of wellbeing
Box 1 continued<br />
ability to savour everyday experiences (Notorious B.I.G. 1997 15 ; Quoidbach et al. 2010) which is<br />
disconcerting in light of research showing that small pleasures (like a cold beer on a warm day)<br />
constitute some of life’s most salient instances of happiness (Gilbert 2006).’<br />
However, if the increased income is spent on ‘inconspicuous consumption’, such as moving house<br />
or job to achieve a shorter commute, longer holidays, or more time with family and friends (Frank<br />
2004), on others (Dunn et al. 2008; Aknin et al. 2013), or on experiences, including spending time<br />
in natural areas (Howell et al. 2012; MacKerron & Mourato 2013), then wellbeing does increase.<br />
But why you make a purchase is still important—Zhang et al. (2013) demonstrated that those who<br />
spend money on experiences because they are intrinsically motivated (e.g. engaging in behaviours<br />
because they are enjoyable, challenging, or interesting) report more autonomy, competence,<br />
relatedness, flourishing, and vitality; while those who do it because they are externally motivated<br />
(e.g. ‘for the recognition I’ll get from others’) or amotivated (e.g. ‘I don’t really know’) reported less<br />
autonomy, competence and relatedness.<br />
Dunn et al. (2011) drew on empirical research to propose eight principles to help people get more<br />
happiness for their money. Specifically, they suggested that consumers should: 1. buy more<br />
experiences and fewer material goods; 2. use their money to benefit others rather than themselves;<br />
3. buy many small pleasures rather than fewer large ones; 4. eschew extended warranties and<br />
other forms of overpriced insurance; 5. delay consumption; 6. consider how peripheral features<br />
of their purchases may affect their day-to-day lives; 7. beware of comparison shopping; and 8.<br />
pay close attention to the happiness of others. Indeed, cultures where consumption practices are<br />
more aligned with these principles tend to report higher levels of happiness (Veenhoven 2010)—for<br />
example, in Italy, savouring an espresso and playing bocce ball defines happy Sundays (Weiner<br />
2008); and in Costa Rica (which frequently tops world happiness surveys), social networks are tight,<br />
allowing individuals to feel happy with their lot—regardless of financial success (Diener et al. 2010).<br />
Other factors influencing happiness play out at a society-wide level. In 1974, Easterlin observed<br />
that, while at any particular time richer individuals are happier than poorer ones, over time society<br />
did not become happier as it became richer. In the USA, for example, although per capita income<br />
had doubled in the period between 1946 and 1974, levels of happiness were unchanged. This<br />
‘Easterlin Paradox’ has generated much research, and it appears there are four main reasons for it<br />
(Helliwell et al. 2012):<br />
• Individuals compare themselves to others. It is our relative standing rather than absolute levels<br />
of income that matter to people, so when everybody rises together, relative status and average<br />
happiness remains unchanged.<br />
• The gains have not been evenly shared, but have gone disproportionately to those at the top<br />
of the income and education distribution. Wilkinson & Pickett (2009) reviewed a wide range of<br />
studies and international data sources and identified the many ways in which income and wealth<br />
inequalities adversely affect numerous health, social and psychological indicators of wellbeing.<br />
• Other societal factors, such as insecurity, loss of social trust and a declining confidence in<br />
government, have counteracted any benefits felt from the higher incomes.<br />
• Adaptation—as mentioned above, while we may experience an initial jump in happiness when<br />
our income rises, we rapidly adapt and soon cannot imagine how we coped on less.<br />
These phenomena put a clear limit on the extent to which rich countries can become happier<br />
through the simple device of economic growth (Helliwell et al. 2012).<br />
15<br />
Notorious B.I.G. 1997: ‘Mo Money Mo Problems’, second single in album Life After Death. www.wikipedia.org/wiki/Mo_Money_<br />
Mo_Problems.<br />
The nature of wellbeing<br />
19
2.3 Basic human needs<br />
Psychologists working on wellbeing in the developed world tend to assume that the basic<br />
elements that are essential for an individual’s wellbeing (such as food, water and air) are met<br />
and so these tend not to appear in formulations of what is needed for wellbeing. However, those<br />
working on poverty in the developing world appear to be much more conscious of the extent<br />
to which wellbeing is dependent on access to ecosystem goods and services—and such an<br />
awareness is not surprising when they are confronted on a daily basis with evidence of the impact<br />
that a lack of access to good food and clean water, safety from floods, etc. has on wellbeing.<br />
A cornerstone of development thinking is that there is a core set of basic needs that must be<br />
satisfied if we are to consider development to have taken place (Gough et al. 2007). In the 1970s,<br />
international bodies such as the International Labour Organisation and the World Bank had<br />
programmes of work that addressed basic needs. However, in the 1980s, ‘basic needs theory’ fell<br />
out of favour for a period and economic growth became the main focus of development efforts<br />
(see Box 2). By the late 1990s, there had been considerable refinement and strengthening of<br />
the concept of needs, and the Millennium Development Goals—a blueprint agreed to by all the<br />
world’s countries and leading development institutions—gave priority to the fulfilment of these<br />
basic needs (Gasper 2007; Gough et al. 2007).<br />
A leading contributor to the development of thinking about human needs is the Chilean<br />
development economist Manfred Max-Neef. Max-Neef (1991) argued that we all have the same<br />
fundamental set of needs, which encompasses more than the basic needs of food and shelter:<br />
‘fundamental human needs are finite, few and classifiable … [and] are the same in all cultures<br />
and in all historical periods’. What differs between individuals, cultures and time periods is how<br />
we satisfy—or attempt to satisfy—those needs. Thus, cultural change, in this perspective, can be<br />
construed as the process of dropping a traditional satisfier or set of satisfiers in favour of a new or<br />
different one (Max-Neef et al. 1989).<br />
Max-Neef identified nine fundamental needs: subsistence, protection, affection, understanding,<br />
participation, idleness, creation, identity and freedom. It is important to note that these needs are<br />
not solely, or even mainly, economic needs. Accordingly, the alleviation of poverty (traditionally<br />
Box 2—Basic needs and development<br />
Over the last 50 years there has been a significant evolution in thinking about whether humans have<br />
a common set of basic needs, and the relationship between meeting those needs and achieving<br />
‘development’.<br />
The idea that there is a core set of basic needs that must be satisfied if we are to consider<br />
development to have taken place stretches back to colonial government policy and underpins<br />
national strategies for development in major developing countries such as China and India (Gough<br />
et al. 2007). However, it did not gain notable momentum in international development policy<br />
until 1976, when the International Labour Organisation adopted a Declaration of Principles and<br />
Programme of Action for a Basic Needs Strategy of Development; and in 1978, when the World<br />
Bank initiated work on basic needs. These initiatives marked some of the first global institutional<br />
responses to the inadequacies of gross domestic product and economic growth as measures of<br />
development or human welfare (Gough et al. 2007).<br />
In the late 1980s, basic needs thinking came under attack from two quite different sources:<br />
neoclassical economists, who argued that needs can only be determined by seeing how people<br />
express their individual preferences and choices in markets; and criticisms that supposed ‘facts<br />
of human nature’ are actually arbitrary assumptions that are relative to particular times, places<br />
and societies (Doyal & Gough 1991; Gough et al. 2007). At the time, basic needs theory lacked the<br />
conceptual depth, technical refinement and an appealing political language to effectively respond<br />
to these views. As a result, the focus on basic needs was displaced in development policy by an<br />
orthodox economic perspective, and the principal focus of development effort became increasing<br />
Continued on next page<br />
20 The nature of wellbeing
Box 2 continued<br />
incomes as a means to increase wellbeing (Gasper 2007; Gough et al. 2007). However, in 1987<br />
needs were central to the newly emerging concept of sustainable development, which the World<br />
Commission on Environment and Development (WCED) defined as:<br />
… development that meets the needs of the present without compromising the ability of<br />
future generations to meet their own needs. It contains within it two key concepts:<br />
the concept of needs, in particular the essential needs of the world’s poor, to which overriding<br />
priority should be given; and<br />
the idea of limitations imposed by the state of technology and social organization on the<br />
environment’s ability to meet present and future needs.<br />
(WCED 1987: 43)<br />
By the late 1990s, basic needs were firmly back on the international agenda, and the Millennium<br />
Development Goals—a blueprint agreed to by all the world’s countries and leading development<br />
institutions—gave priority to basic needs fulfilment (Gasper 2007; Gough et al. 2007). In part, this<br />
revitalisation of the basic needs concept was driven by the accumulating evidence that extreme<br />
poverty was persisting around the world despite significant economic growth in some countries,<br />
and that there was only very modest growth in other countries despite years of experimenting and<br />
spending on development programmes (Gough et al. 2007). It was also assisted by the considerable<br />
refinement and strengthening of the concept of needs during the 1980s and 1990s by a number of<br />
determined and creative theorists, including Penz, Max-Neef, Sen, Nussbaum, Doyal and Gough.<br />
In conceptualising a theory of needs, a number of relevant distinctions were introduced or<br />
standardised (Gasper 2007). The three most significant distinctions recognised were between needs<br />
and satisfiers of those needs—satisfiers vary enormously, whereas the needs they serve can be<br />
shared and stable (this was principally the work of Max-Neef, e.g. Max-Neef 1986, 1991, 1992—see<br />
further discussion below); between functionings (the various things a person manages to do or be<br />
in leading a life) and their capabilities to achieve those functionings; and between guaranteeing<br />
attainments and strengthening capabilities (these were principally the work of the Nobel prize<br />
winning welfare economist Amartya Sen (e.g. Sen 1985, 1999, 2005) and the philosopher Martha<br />
Nussbaum (Nussbaum 2001)). There was also greater focus on identifying the best order of priority<br />
for addressing needs (for example, education, health and physical security are often given the<br />
highest priority, even above employment and housing) and on distinguishing between various types<br />
of policy-relevant activities.<br />
Sen’s capability approach has been very influential in human development theories, with the process<br />
of development now generally understood to be not simply about meeting basic needs (e.g. for food<br />
and shelter) but about enhancement of human freedom and capability. In turn, this has influenced the<br />
development of new ways to measure development, such as the Human Development Index (see section<br />
2.4.1). However, while the capability approach has proved useful in the context of individual freedoms and<br />
intra-generational justice, a number of scholars have identified a variety of difficulties in applying it to the<br />
issue of sustainability and sustainable development, including how to incorporate inter-generational justice<br />
and responsibilities to society, nature and future generations. These limitations and some possible solutions<br />
are discussed by the various authors in Rauschmayer et al. (2011) and in the 2013 special issue of the<br />
Journal of Human Development and Capabilities (Vol.14(1)): ‘The capability approach and sustainability’<br />
understood as a lack of income) is replaced by the alleviation of poverties as the central idea of<br />
development. When these poverties are not adequately addressed, they give rise to individual<br />
and collective pathologies—fears and frustrations that may undermine individual and social<br />
wellbeing, despite apparent improvements in average incomes and other traditional indicators of<br />
economic development (Dodds 1997).<br />
However, while a need can be seen as a deprivation in the sense of something lacking, Max-Neef<br />
also conceived it as a potential. The perception of unmet needs becomes not only a goal, but a<br />
motor of development, motivating and mobilising people to achieve the fulfilment of the need<br />
(Jackson et al. 2004; Cruz 2012). By contrast, satisfiers represent different forms of being, having<br />
(in the sense of possessing rights or skills), doing or interacting (see Table 2), which allow people<br />
to meet their needs and achieve their potential.<br />
The nature of wellbeing<br />
21
It should be noted that the matrix shown in Table 2 does not contain any material elements. So,<br />
in the ‘Having’ column there are no objects; instead, there are principles, institutions, norms,<br />
traditions, etc. In conventional economics, there are only two links (wants and goods), whereas<br />
in Max-Neef’s Human Scale Development Theory, there are three links (needs, satisfiers and<br />
goods—for instance, a need for understanding, whose satisfier is literature and whose ‘good’ is a<br />
book). The idea here is that we all have the same needs, but we can choose different material and<br />
immaterial ways to satisfy those needs.<br />
Another feature of Max-Neef’s analysis is that needs are not arranged in a hierarchy. This<br />
contrasts with Maslow (1954), who suggested that physiological and safety needs must be<br />
satisfied before needs higher in the hierarchy (the need to belong and be loved, and ‘higher’<br />
cognitive, aesthetic and moral needs) become important sources of motivation which suggests<br />
that personal development is dependent on reaching a certain level of material wealth. However,<br />
there is plenty of evidence against this notion (Jackson et al. 2004) and, in a review of a range<br />
of models of human needs (or ‘human ends’, as he termed them) from diverse disciplines, Alkire<br />
(2002) noted that they generally assume a non-hierarchical arrangement and that all needs<br />
must be satisfied for flourishing to occur. This conclusion was confirmed by a survey of 60 865<br />
participants in 123 countries, which found, among other things, that while people tend to achieve<br />
basic and safety needs before other needs, a person can gain wellbeing by meeting needs for<br />
Table 2. Max-Neef’s matrix of needs and satisfiers (source: Smith & Max-Neef 2010: 143).<br />
Needs<br />
Satisfiers<br />
Being (qualities) Having (things) Doing (actions) Interacting<br />
(settings)<br />
Subsistence<br />
Physical, emotional<br />
and mental health<br />
Food, shelter, work<br />
Work, feed, procreate,<br />
clothe, rest/sleep<br />
Living environment,<br />
social setting<br />
Protection<br />
Care, adaptability,<br />
autonomy<br />
Social security, health<br />
systems, rights,<br />
family, work<br />
Cooperate, plan,<br />
prevent, help, cure,<br />
take care of<br />
Living space, social<br />
environment, dwelling<br />
Affection<br />
Respect, tolerance,<br />
sense of humour,<br />
generosity, sensuality<br />
Friendships, family,<br />
relationships with<br />
nature<br />
Share, take care of,<br />
make love, express<br />
emotions<br />
Privacy, intimate<br />
spaces of<br />
togetherness<br />
Understanding<br />
Critical capacity,<br />
receptivity, curiosity,<br />
intuition<br />
Literature, teachers,<br />
educational and<br />
communication<br />
policies<br />
Analyse, study,<br />
meditate, investigate<br />
Schools, families,<br />
universities,<br />
communities<br />
Participation<br />
Adaptability, receptivity,<br />
dedication, sense of<br />
humour<br />
Responsibilities,<br />
duties, work, rights,<br />
privileges<br />
Cooperate, propose,<br />
dissent, express,<br />
opinions<br />
Associations,<br />
parties, churches,<br />
neighbourhoods<br />
Idleness<br />
Imagination, curiosity,<br />
tranquillity, spontaneity<br />
Games, parties,<br />
spectacles, clubs,<br />
peace of mind<br />
Day-dream, play,<br />
remember, relax, have<br />
fun<br />
Landscapes, intimate<br />
spaces, places to be<br />
alone, free time<br />
Creation<br />
Imagination, boldness,<br />
curiosity, inventiveness,<br />
autonomy,<br />
determination<br />
Skills, work, abilities,<br />
method, techniques<br />
Invent, build, design,<br />
work, compose,<br />
interpret<br />
Spaces for expression,<br />
workshops, audiences,<br />
cultural groups<br />
Identity<br />
Sense of belonging,<br />
self-esteem,<br />
consistency<br />
Symbols, language,<br />
religion, values, work,<br />
customs, norms,<br />
habits, historical<br />
memory<br />
Get to know oneself,<br />
grow, commit oneself,<br />
recognise oneself<br />
Places one belongs<br />
to, everyday settings,<br />
maturation stages<br />
Freedom<br />
Autonomy, passion,<br />
self-esteem, openmindedness,<br />
tolerance<br />
Equal rights<br />
Dissent, choose,<br />
run risks, develop<br />
awareness, be<br />
different from, disobey<br />
Temporal/spatial<br />
plasticity (anywhere)<br />
22 The nature of wellbeing
social support and love, feeling respected and taking pride in activities, mastery, and selfdirection<br />
and autonomy, regardless of whether his or her basic needs are fully met (Tay & Diener<br />
2011). Another criticism of the Maslovian approach is that it over-emphasises the individualistic<br />
nature of needs satisfaction, and understates the importance of society, culture and the natural<br />
environment, treating these as secondary in importance to individual motivation (Jackson et al.<br />
2004). Tay & Deiner’s (2011) study confirmed that collective societal wellbeing was an important<br />
contributor to individual wellbeing, and that a person whose own needs are met to a certain level<br />
will be more satisified with their life if living in a society where others’ basic needs are met, than a<br />
person whose own needs are met to exactly the same level but who is living in a society in which<br />
others’ needs are not as frequently fulfilled.<br />
There are an infinite number of ways in which we can satisfy our needs, but not all satisfiers<br />
are equally effective. Max-Neef (1991) identified five different types of satisfiers (Table 3). In a<br />
consumer society, we commonly assume that economic goods and/or commodities are the main<br />
satisfiers of needs; however, they are simply objects related to particular conditions in time and<br />
history, and represent only one type of satisfier among a vast range (Max-Neef 1991).<br />
Jackson & Marks (1999) and Jackson et al. (2004) have argued that Max-Neef’s matrix of human<br />
needs is particularly useful when considering wellbeing in the context of sustainability. In a<br />
world in which economic consumption is threatening to erode the integrity of global ecosystems,<br />
it is particularly vital to be able to identify which elements of consumption contribute to the<br />
satisfaction of human needs and hence wellbeing, and which simply operate as pseudo-satisfiers,<br />
Table 3. Types of satisfiers according to Max-Neef’s human-scale development approach<br />
(source: Max-Neef et al. 1989; Max-Neef 1991).<br />
Satisfier type Explanation Example<br />
Synergetic<br />
satisfiers<br />
Violating or<br />
destructive<br />
satisfiers<br />
Singular satisfiers<br />
Pseudo-satisfiers<br />
Inhibiting satisfiers<br />
Satisfiers that, as a result of the way<br />
in which they satisfy a given need,<br />
stimulate and contribute to the<br />
simultaneous satisfaction of another<br />
need.<br />
Satisfiers that are imposed<br />
arbitrarily and are likely to<br />
prevent a second need from being<br />
fulfilled.<br />
Satisfiers that aim to satisfy a single<br />
need and are neutral with regard to<br />
the satisfaction of other needs.<br />
Elements that stimulate a false<br />
sensation of satisfying a given need.<br />
Satisfiers that over-satisfy a need,<br />
which might eventually cause<br />
difficulty in the satisfaction of other<br />
needs.<br />
Breastfeeding satisfies a baby’s need for subsistence,<br />
but also stimulates protection, affection and identity.<br />
Direct democracy satisfies the need for participation, but<br />
also stimulates protection, understanding, identity and<br />
freedom.<br />
Preventive medicine satisfies the need for protection,<br />
but also stimulates understanding, participation and<br />
subsistence.<br />
Arms race supposedly satisfies the need for protection,<br />
but impairs meeting the need for subsistence, affection,<br />
participation and freedom.<br />
Censorship supposedly satisfies the need for protection,<br />
but impairs the need for understanding, participation,<br />
leisure, creation, identity and freedom.<br />
Programmes to provide food satisfy the need for<br />
subsistence.<br />
Insurance systems satisfy the need for protection.<br />
Fashions and fads seemingly satisfy the need for identity.<br />
Charity seemingly satisfies the need for subsistence.<br />
Over-exploitation of natural resources seemingly satisfies<br />
the need for subsistence.<br />
Prostitution seemingly satisfies the need for affection.<br />
Paternalism satisfies the need for protection, but inhibits<br />
meeting the need for understanding, participation,<br />
freedom and identity.<br />
Unlimited permissiveness satisfies the need for freedom,<br />
but inhibits the need for protection, affection, identity and<br />
participation.<br />
Obsessive economic competitiveness satisfies the need<br />
for freedom, but can inhibit the need for subsistence,<br />
protection, affection, participation and leisure.<br />
The nature of wellbeing<br />
23
or worse, impair our ability to satisfy our needs. We do not yet have the language, skills or<br />
concepts to evaluate our consumption in this way, or even good data to allow us to understand<br />
the environmental and wellbeing impact of different consumption choices. However, simply<br />
recognising that we have a common set of needs, but multiple ways in which we can meet those<br />
needs that vary in their effectiveness and environmental impact, provides a starting point for<br />
developing the capabilities to make those evaluations. Max-Neef’s framework, which recognises<br />
this distinction between needs and satisfiers, and the varying effectiveness of different satisfiers,<br />
has therefore been used in the following analysis of the connections between ecosystem services<br />
and the wellbeing of New Zealand and New Zealanders.<br />
What satisfiers we choose and how effectively we can satisfy our needs will be influenced by a<br />
wide range of factors, including where we live, our economic, social and political systems, the<br />
resources we have access to, and our personal preferences. People with good access to the full<br />
range of capitals—natural, human, social, cultural, financial and physical—will have a wider range of<br />
options available to them, and more skills available to make wise decisions about which satisfiers<br />
to choose. As a result, they are more likely to be able to fully satisfy their needs. Meeting some<br />
of our most basic subsistence needs, e.g. air to breathe and water to drink, requires only access to<br />
(undamaged) natural capital, but effectively satisfying other needs will involve drawing on various<br />
other forms of capital. For example, satisfying our need for understanding and participation will<br />
draw on (and potentially build) social and human capital, and some forms of sharing and growing<br />
our understanding (e.g. research institutes and universities) also require significant financial<br />
and physical capital. Food production is impossible without natural capital providing ecosystem<br />
services, but we can only get the yields we do through applying human and social capital (labour,<br />
and accumulating and developing knowledge of effective farming techniques for particular<br />
locations), and financial capital (e.g. to buy machinery). Costanza et al. (2007) explored the<br />
importance of these other capitals as inputs to the satisfiers of the various human needs.<br />
In the discussion that follows, we have focused on the contribution of natural capital and<br />
ecosystem services, whilst being conscious that other forms of capital will also be involved<br />
in allowing the full benefits to be realised. Figure 1 shows how natural capital provides the<br />
ecosystem services that feed into the satisfaction of human needs, and that our needs drive us to<br />
find ways to satisfy them in order to achieve wellbeing. As mentioned above, how we choose to<br />
satisfy our needs is influenced by a range of social, cultural, psychological and economic factors,<br />
and these choices in turn impact positively or negatively on ecosystems and their capacity to<br />
provide services now and into the future.<br />
2.4 Measuring progress—wellbeing and policy<br />
2.4.1 International developments<br />
We should measure what we want, rather than wanting what we measure.<br />
(The Gross Domestic Problem—Fioramonti 2013)<br />
We have wound up mistaking our representations of wealth for the wealth itself, and our<br />
representations of reality for reality itself. But reality always ends up having the last word.<br />
(Nicolas Sarkosy, in Preface to Mismeasuring our Lives—Stiglitz et al. 2010)<br />
A primary concern of any government is the wellbeing of its citizens. Social policy, and indeed<br />
public policy more generally, are largely concerned with questions of public wellbeing (Brown<br />
et al. 2012). However, until very recently, there have been no agreed methods for measuring<br />
wellbeing and in their absence, economic indicators have taken their place as the main tools<br />
for measuring progress, based on the common assumption that a growing economy will lead to<br />
greater wellbeing.<br />
24 The nature of wellbeing
Human Needs<br />
Subsistence, Protection, Affection, Understanding,<br />
Participation, Leisure, Creation, Identity, Freedom<br />
Needs drive behaviour<br />
Choice of satisfiers<br />
How we go about satisfying our needs will affect both our level of<br />
wellbeing and the extent of our impact on ecosystem services.<br />
Our choice of satisfiers is influenced by where we live, our economic,<br />
social & political systems, the resources we have access to, our culture<br />
& our lifestyle choices, i.e. by our human, social, cultural and financial<br />
capital.<br />
Provisioning<br />
WELLBEING<br />
Ecosystem Services<br />
Regulating<br />
Cultural<br />
Human choices<br />
and actions<br />
impact on<br />
ecosystems,<br />
which then<br />
affects the flow<br />
of ecosystem<br />
services<br />
Supporting<br />
Natural Capital<br />
Biodiversity, landscape and ecosystem structure and processes<br />
Figure 1. Interactions between ecosystem services, human needs, satisfiers and wellbeing.<br />
Since the Second World War, the principal measure has been gross domestic product (GDP),<br />
which represents the market value of all officially recognised final goods and services produced<br />
within a country in a given period of time. However, the limitations of GDP as a measure of<br />
national wellbeing have been known since its conception. In his first report to the US Congress<br />
in 1934, Simon Kuznets, the economist who developed the first comprehensive set of measures of<br />
national income, stated in a section titled Uses and abuses of national income measurements 16 :<br />
‘The welfare of a nation can scarcely be inferred from a measurement of national income’<br />
(Kuznets 1934: 7). Later, in 1962, he stated (emphasis added):<br />
Distinctions must be kept in mind between quantity and quality of growth, between costs and<br />
returns, and between the short and long run. Goals for more growth should specify more growth of<br />
what and for what. (Kuznets 1962: 29)<br />
16<br />
Congress commissioned Kuznets to create a system that would measure the nation’s productivity, in order to better understand<br />
how to tackle the Great Depression (Kuznets 1934).<br />
The nature of wellbeing<br />
25
Similarly, Robert Kennedy gave an eloquent summary of the limitations of GDP in an address to<br />
Kansas University in 1968 17 :<br />
Too much and too long, we seem to have surrendered personal excellence and community<br />
values in the mere accumulation of material things. Our Gross National Product ... if we judge<br />
the United States of America by that—counts air pollution and cigarette advertising, and<br />
ambulances to clear our highways of carnage. It counts special locks for our doors and the<br />
jails for the people who break them. It counts the destruction of our redwoods and the loss of<br />
our natural wonder in chaotic sprawl. It counts napalm and the cost of a nuclear warhead, and<br />
armored cars for police to fight the riots in our cities. It counts Whitman’s rifle and Speck’s knife,<br />
and the television programs which glorify violence in order to sell toys to our children.<br />
Yet the gross national product does not allow for the health of our children, the quality of their<br />
education, or the joy of their play. It does not include the beauty of our poetry or the strength<br />
of our marriages; the intelligence of our public debate or the integrity of our public officials.<br />
It measures neither our wit nor our courage; neither our wisdom nor our learning; neither our<br />
compassion nor our devotion to our country; it measures everything, in short, except that which<br />
makes life worthwhile.<br />
Many of the criticisms of GDP relate to what it does include (as a positive) and what it does<br />
not include. It includes many items that do not help national wellbeing, such as depreciation,<br />
income going to foreigners and ‘regrettables’ like security expenditure (Bergheim 2006), and it<br />
‘counts oil spills and wars as contributors to economic growth, while [unpaid] child-rearing and<br />
housekeeping are deemed valueless’ (Waring 1999). Expenditures are counted as positive without<br />
any regard for the total amount of public and private debt incurred to make those expenditures<br />
and without any regard for the increase in the money supply (ignoring the potential for future<br />
price inflation and/or debt deflation) (Leed 2013).<br />
Other criticisms of using GDP as a measure of our progress and wellbeing stem from the findings<br />
from happiness research that growth in per capita income and GDP has not led to any significant<br />
improvement in life satisfaction in developed countries (see Box 1). There has also been a<br />
growing realisation that a misleading picture of a country’s overall wealth is obtained when the<br />
destruction of natural capital (e.g. the felling of forests or overharvesting of fish) is counted as a<br />
positive addition to GDP, and that not distinguishing between ‘good growth’ and ‘bad growth’ is<br />
providing an incentive for unsustainable resource use.<br />
Over the last 20 years, a variety of alternative measures have been experimented with, but none<br />
has as yet succeeded in replacing the long-standing primacy of GDP per capita.<br />
Some measures have focused on how to get a more inclusive picture of the true economic<br />
situation: for example, the Index of Sustainable Economic Welfare (Daly & Cobb 1989), its variant<br />
the Genuine Progress Indicator (GPI) (Cobb et al. 1995) and the Measure of Domestic Progress<br />
(New Economics Foundation 2004a) all attempt to address many of the above criticisms by<br />
taking the same raw information supplied for GDP and then adjusting for income distribution,<br />
adding the value of household and volunteer work, and subtracting for crime and pollution,<br />
amongst other things. Kubiszewski et al. (2013) synthesised estimates of GPI over the period<br />
1950–2003 for 17 countries and concluded that for most countries, GPI per capita plateaued in the<br />
1970s, and in some has decreased since 1978.<br />
Others have attempted to develop composite measures that include either objective or subjective<br />
measures of wellbeing together with economic indicators. The UN Human Development Index 18<br />
(introduced in 1990 and amended in 2010) includes life expectancy, literacy, education and<br />
standards of living. Up until the 2009 report, the living standards component was based on<br />
17<br />
www.jfklibrary.org/Research/Research-Aids/Ready-Reference/RFK-Speeches/Remarks-of-Robert-F-Kennedy-at-the-Universityof-Kansas-March-18-1968.aspx<br />
18<br />
http://hdr.undp.org/en/statistics/hdi/<br />
26 The nature of wellbeing
GDP, but in 2010 the GDP component was replaced by Gross National Income. Bhutan’s Gross<br />
National Happiness 19 uses a complex set of subjective and objective indicators to measure<br />
‘national happiness’ in various domains (living standards, health, education, ecosystem diversity<br />
and resilience, cultural vitality and diversity, time use and balance, good governance, community<br />
vitality, and psychological wellbeing); this set of indicators is to be used to assess progress<br />
towards gross national happiness, which they have already identified as being the nation’s<br />
priority, above GDP.<br />
Further measures have focused on environmental indicators. The Ecological Footprint<br />
(Wackernagel & Rees 1996) is a standardised measure of demand for land that may be contrasted<br />
with the planet’s ecological capacity to regenerate 20 ; it represents the amount of biologically<br />
productive land and sea area that is necessary to supply the resources a human population<br />
consumes without recourse to underground resources or nuclear energy, and to assimilate<br />
associated waste. The Happy Planet Index (New Economics Foundation 2012a) combines the<br />
ecological footprint with a measure of subjective life satisfaction and life expectancy to measure the<br />
environmental efficiency with which human wellbeing is achieved within a given country or group.<br />
By the early 2000s, there was a growing international consensus calling both for a<br />
reconceptualisation of ‘progress’ in terms of wellbeing and for the development of appropriate<br />
measurement tools. In the last 10 years, policy interest in wellbeing has grown in line with<br />
academic interest. For example, in the UK, the New Economics Foundation has been particularly<br />
Box 3—Recent international policy developments in measuring<br />
progress<br />
In the last 10–15 years, there has been a considerable increase in interest and activity by public<br />
policy agencies in measuring and fostering wellbeing, particularly in the UK and Europe. 21<br />
In the UK, the Local Government Act 2000 gave local authorities in England and Wales the power<br />
to ‘promote the economic, social and environmental well-being of their area’, acknowledging that<br />
policy should be concerned with people holistically and cover a broad range of positive outcomes<br />
(New Economics Foundation 2004a). In Europe, the first European Quality of Life Survey was<br />
published in 2005; this assessed quality of life across European countries through a series of<br />
questions on overall subjective life satisfaction, satisfaction with different aspects of life, and sets<br />
of questions that were used to calculate deficits of time, loving, being and having (Böhnke 2005).<br />
Also in 2005, the Economist Intelligence Unit released its own ‘quality of life’ index (see Box 4).<br />
The publication of the UK national sustainable development strategy in 2005 led to the first<br />
official attempt to define wellbeing in UK policy. The strategy stated that a key component of<br />
sustainable development included ‘promoting personal well-being, social cohesion and inclusion<br />
and creating equal opportunity for all’. As a result, the cross-governmental Whitehall Well-being<br />
Working Group (W3G) was formed, commissioning research to help conceptualise and define<br />
wellbeing and its links to sustainability, and publishing a ‘shared understanding’ of wellbeing<br />
(Defra & National Statistics 2007). They defined wellbeing as:<br />
… a positive physical, social and mental state; it is not just the absence of pain, discomfort<br />
and incapacity. It requires that basic needs are met, that individuals have a sense of purpose,<br />
that they feel able to achieve important personal goals and participate in society. It is<br />
enhanced by conditions that include supportive personal relationships, strong and inclusive<br />
communities, good health, financial and personal security, rewarding employment, and a<br />
healthy and attractive environment.<br />
Defra & National Statistics 2007: 111<br />
Continued on next page<br />
19<br />
www.gnhbhutan.org/<br />
20<br />
http://en.wikipedia.org/wiki/Ecological_footprint<br />
21<br />
Much of the following summary of these developments is taken from the New Economics Foundation’s reports Measuring our<br />
progress—the power of well-being (2011a) and Well-being evidence for policy: a review (2012e).<br />
The nature of wellbeing<br />
27
Box 3 continued<br />
In 2007, the Statistical Office of the European Communities (Eurostat) committed funding to<br />
consider options for the measurement of wellbeing at an EU level (Michaelson et al. 2009). In the<br />
same year, the Organisation for Economic Co-operation and Development (OECD) hosted an<br />
international conference on Measuring and Fostering the Progress of Societies, which was<br />
attended by 1200 people from about 130 countries. This culminated in the Istanbul Declaration, a<br />
declaration on the part of the OECD, the European Commission (EC), the United Nations (UN), the<br />
UN Development Programme and the World Bank (and since signed by many other organisations)<br />
affirming their ‘commitment to measuring and fostering the progress of societies in all dimensions,<br />
with the ultimate goal of improving policy making, democracy and citizens’ wellbeing’ 22 . Later that<br />
same year, the EC, the European Parliament, Club of Rome, OECD and the World Wildlife Fund<br />
hosted Beyond GDP—another international conference, with the objectives of ‘clarifying which<br />
indices are most appropriate to measure progress, and how these can best be integrated into the<br />
decision-making process and taken up by public debate’ 23 . Both of these leading conferences have<br />
taken forward the wellbeing measurement agenda in the form of continued projects working to<br />
improve the understanding and measurement of progress.<br />
Further significant research on wellbeing was commissioned by the UK Government Office for<br />
Science, in the form of the Foresight Project on Mental Capital and Well-being. The resulting<br />
report, which was published in 2008, outlined the findings of an extensive 2-year study that<br />
examined the policy factors influencing the development of wellbeing (Department for Business<br />
Innovation and Skills 2008).<br />
Perhaps most significantly, in 2008 the French President Nicolas Sarkozy set up a high-level<br />
Commission on the Measurement of Economic Performance and Social Progress (the<br />
Stiglitz Commission), which was led by Nobel prize winners Joseph Stiglitz and Amartya Sen. It<br />
was motivated by ‘increasing concerns … about the adequacy of current measures of economic<br />
performance … [and] about the relevance of these figures as measures of societal well-being, as<br />
well as measures of economic, environmental, and social sustainability’ (Stiglitz et al. 2009). The<br />
release of the Commission’s report in 2009 attracted huge international attention, and the report was<br />
quickly viewed by statistical offices around Europe as setting an agenda to which they needed to<br />
respond. The report included detailed recommendations on improvements to measures of economic<br />
performance; fuller measurement of environmental issues; and the collection of objective and<br />
subjective data on wellbeing.<br />
In 2010, the Directors General of Europe’s National Statistical Offices signed the Sofia<br />
Memorandum: this recognised the importance of ‘measuring progress, well-being and sustainable<br />
development’ and mandated further work on the issue by Eurostat (DGINS & ESSC 2010). The<br />
following month, in October 2010, the UK Prime Minister David Cameron announced that the<br />
UK Office for National Statistics was going to start measuring subjective wellbeing, as well as<br />
constructing an index of national wellbeing, which would be decided following public and expert<br />
consultation:<br />
We have got to recognise officially, that economic growth is a means to an end.<br />
(Prime Minister David Cameron, November 2010)<br />
Since then, there have been further developments in the UK Government’s wellbeing agenda,<br />
notably the publication of a Treasury working paper discussing how wellbeing analysis can be<br />
used in policy evaluation (Fujiwara & Campbell 2011) and an update to the Government’s ‘policy<br />
evaluation bible’, The Green Book, to reflect the new technique.<br />
International momentum has continued since 2010. In 2011, a UN General Assembly declaration<br />
invited member states ‘to pursue the elaboration of additional measures that better capture the<br />
importance of the pursuit of happiness and well-being in development with a view to guiding their<br />
public policies’ 24 .<br />
22<br />
www.oecd.org/site/worldforum06/istanbulworldforum-measuringandfosteringtheprogressofsocieties.htm<br />
23<br />
Retrieved from www.beyond-gdp.eu/ (‘About Beyond GDP’).<br />
24<br />
www.un.org/ga/search/view_doc.asp?symbol=A/65/L.86<br />
28 The nature of wellbeing
active in promoting a wellbeing agenda and pushing for better measures of progress (New<br />
Economics Foundation 2004a, b, c, 2008, 2009, 2011a, b, 2012a, b, c, d, e; Abdallah 2011). Recent<br />
international developments in measuring progress are summarised in Box 3.<br />
The work that is underway in many countries to develop and apply wellbeing and happiness<br />
measures is sometimes led by government agencies and sometimes by citizen-initiated processes<br />
or academic/business partnerships. Measures that have been developed include the Canadian<br />
Index of Wellbeing 25 , the Australian Unity Wellbeing Index 26 and the State of the USA 27 Other<br />
countries, including Germany and Italy, are working to develop and use wellbeing measures<br />
in policy and politics (Kroll 2011), and the Australian and US Treasuries and the IMF are<br />
undertaking similar thinking (Gleisner et al. 2012). Jon Gertner, writing in The New York Times<br />
in 2010, provided an interesting summary of the international debate on ‘The Rise and Fall of the<br />
G.D.P.’ and the new developments, along with some descriptive cartoons of the happier looking<br />
life of the ‘low-GDP man’ compared with the hard working, hard spending ‘high-GDP’ man<br />
(Gertner 2010).<br />
In 2011, the OECD first published its Better Life Index 28 , which reflects some 10 years of work by the<br />
organisation to develop a wider of set of indicators that is more closely attuned to the measurement<br />
of wellbeing or welfare outcomes. This index includes 11 factors (housing, income, jobs, community,<br />
education, environment, civic engagement, health, life satisfaction, safety and work-life balance)<br />
and an interactive website allows users to decide what weighting to give each factor.<br />
In this recent OECD diagram (Fig. 2), the non-financial elements of the Better Life Index are<br />
depicted under the heading ‘Quality of Life’ and financial elements under the heading ‘Material<br />
Conditions’. The fact that some of the things that GDP measures are actually not conducive to<br />
Figure 2. Components of the OECD Better Life Index and wellbeing (www.oecd.org/statistics/measuringwellbeingand<br />
progressunderstandingtheissue.htm).<br />
25<br />
https://uwaterloo.ca/canadian-index-wellbeing/<br />
26<br />
http://www.australianunity.com.au/about-us/wellbeing/auwbi<br />
27<br />
http://stateoftheusa.org/<br />
28<br />
www.oecdbetterlifeindex.org<br />
The nature of wellbeing<br />
29
wellbeing is acknowledged by showing GDP as partly measuring material wellbeing and partly<br />
‘regrettables’ outside the wellbeing frame. The Better Life Index website provides a summary of<br />
how various countries score 29 , and New Zealand has one of the highest scores (see Box 4).<br />
Box 4—How does New Zealand score in international wellbeing surveys?<br />
A number of international surveys rank wellbeing and quality of life in different countries. Three of<br />
these are The Economist’s Quality of Life index, the OECD’s Better Life Index and the Social Progress<br />
Index.<br />
The ‘quality of life’ index developed by the Economist Intelligence Unit, a sister company of<br />
The Economist magazine, links the results of subjective life-satisfaction surveys to a selection of<br />
objective determinants of quality of life across countries—GDP per person, life expectancy at birth,<br />
political stability and security, divorce rate, community life (based on rate of church attendance or<br />
trade-union membership), latitude (to distinguish between warmer and colder climes), unemployment<br />
rate, political and civil liberties, and gender equality (ratio of average male and female earnings). In<br />
2005 the index was calculated for 111 countries, with New Zealand ranking 25th for GDP per person<br />
but 15th for quality of life 30 . The Index was recalculated in 2013, and New Zealand’s ranking for<br />
quality of life had risen to 7 th 31 .<br />
The OECD Better Life Index website provides a summary of how various countries score 32 . For<br />
New Zealand, it states that ‘New Zealand performs exceptionally well in overall well-being, as shown<br />
by the fact that it ranks among the top countries in a large number of topics in the Better Life Index’.<br />
New Zealand is below the OECD average in average household net-adjusted disposable income,<br />
has a considerable gap between the richest and poorest individuals, and has more people<br />
working very long hours than the OECD average.<br />
However, for all the other indicators, New Zealand is at or above the OECD average: the percentage<br />
of people aged 15 to 64 with a paid job; average work hours per year (people in New Zealand<br />
work 1762 hours a year, slightly less than the OECD average of 1776 hours); percentage of adults<br />
aged 25–64 who have completed high school; average student scores in reading literacy,<br />
maths and science; life expectancy at birth; level of atmospheric PM10 (particulate matter<br />
smaller than 10 microns which can be inhaled into the deepest part of the lung); satisfaction with<br />
water quality; strong sense of community; and high levels of civic participation and voter turnout<br />
(a measure of public trust in government and of citizens’ participation in the political process).<br />
Perhaps most importantly, we are happier—in general, 83% of people in New Zealand say they<br />
have more positive experiences in an average day (feelings of rest, pride in accomplishment,<br />
enjoyment, etc.) than negative ones (pain, worry, sadness, boredom, etc.), which is higher than the<br />
OECD average of 80%. 33<br />
The Social Progress Imperative (Advisory Board chaired by competitiveness guru Michael E.<br />
Porter) has developed a Social Progress Index, with a ‘beta’ version released in 2013 and<br />
a new improved version in 2014 34 . This index scores each country out of 100 for how well<br />
the country provides for ‘basic human needs’ (nutrition and basic medical care, water and<br />
sanitation, shelter, personal wellbeing), ‘foundations of wellbeing’ (access to basic knowledge,<br />
access to information and communication, health and wellness, ecosystem sustainability), and<br />
‘opportunity’ (personal rights, personal freedom and choice, tolerance and inclusion, access<br />
to advanced education). The Index aims to measure social progress directly, rather than use<br />
economic proxies which make it difficult to disentangle cause and effect, and draws on<br />
54 exclusively social and environmental indicators. In the 2014 Index New Zealand was<br />
ranked first, followed by Switzerland, Iceland, Netherlands and Norway.<br />
29<br />
www.oecdbetterlifeindex.org/countries/new-zealand/<br />
30<br />
www.economist.com/media/pdf/QUALITY_OF_LIFE.pdf<br />
31<br />
www.economist.com/news/21566430-where-be-born-2013-lottery-life<br />
32<br />
www.oecdbetterlifeindex.org/countries/new-zealand/<br />
33<br />
Note, however, that this tells us nothing about whether we are heading in the right direction—we could score higher or rank<br />
higher than other countries but still be getting less happy, and these types of figures do not specify the margin of error.<br />
34<br />
www.socialprogressingimperative.org/data/spi<br />
30 The nature of wellbeing
In 2013, the World Bank launched a new Shared Prosperity Indicator, which will track income<br />
growth among each nation’s bottom 40% 35 .<br />
2.4.2 New Zealand developments<br />
Alongside the increased focus on wellbeing in policies around the globe, wellbeing is also being<br />
factored into policies in New Zealand.<br />
In New Zealand, the term ‘wellbeing’ has been widely used in the health sector and in social<br />
development since at least the 1990s 36 . However, in general, these uses of wellbeing have been<br />
focused on its social and economic determinants—the role that ecosystem services play in<br />
contributing to wellbeing has not been considered. A clear exception to this is the Maori health<br />
models developed by Mason Durie. In Te Whare Tapa Wha model (Fig. 3), developed in 1982<br />
(Durie 1998), health is seen to be composed of four equal contributors—Tinana (physical health,<br />
the capacity for growth and development), Wairua (spiritual health, the capacity for faith and<br />
wider communication), Whanau (family health, the capacity to belong, care and share, where<br />
individuals are part of wider social systems) and Hinengaro (mental health, the capacity to<br />
communicate, to think, and to feel the mind and body are inseparable)—all of which are built<br />
on a strong foundation of whenua/the earth/the environment. Later Durie developed a second<br />
Taha Whenua: appreciating the land, the beauty of nature around us, e.g. plants, animals,<br />
birds, clouds, winds, different light, sun, moon and stars.<br />
Figure 3. Maori Health Model: Te Whare Tapa Wha, developed by Mason Durie.<br />
(Image reproduced with permission of Ministry of Health.)<br />
model (Fig. 4) which used the four central stars of Te Pae Māhutonga (the Southern Cross) to<br />
represent the four key tasks of health promotion: Mauriora, Waiora, Toiora, Te Oranga, with the<br />
two pointers representing two important prerequisites: Nga Manukura (leadership) and Te Mana<br />
Whakahaere (autonomy). Mauriora, Toiora, and Te Oranga recognise the importance to health<br />
of cultural identity, healthy lifestyles and participation in society respectively, while Waiora<br />
addresses the importance of environment (Durie 1999):<br />
In this context health promotion is about harmonising people with their environments. It is about<br />
protecting the environment so that:<br />
••<br />
water is free from pollutants<br />
35<br />
www.worldbank.org/en/news/feature/2013/05/08/shared-prosperity-goal-for-changing-world<br />
36<br />
Cotterell & Crothers (2011) provided an interesting account of the history of social indicators and social reporting by<br />
New Zealanders (including an interest in social wellbeing), from the 1970s, through a decline in interest in the 80s and early<br />
90s, to its revival in the late 1990s. The first two objectives of the initial 2001 annual Social Report of the Ministry of Social<br />
Development were to provide and monitor over time measures of wellbeing and quality of life that complement existing<br />
economic and environmental indictors; and to compare New Zealand with other countries on measures of wellbeing<br />
(MSD 2001). The 2002 Briefing to the incoming Minister of Social Development was entitled Improving wellbeing for all<br />
New Zealanders (MSD 2002). The term ‘wellbeing’ is also frequently used in the health sector.<br />
The nature of wellbeing<br />
31
Figure 4. Maori Health Promotion Model: Te Pae Mahutonga, developed by Mason Durie.<br />
(Image reproduced with permission of Canterbury and West Coast District Health Board.)<br />
••<br />
air can be breathed without fear of inhaling irritants or toxins<br />
••<br />
earth is abundant in vegetation<br />
••<br />
noise levels are compatible human frequencies and harmonies<br />
••<br />
opportunities are created for people to experience the natural environment.<br />
(Durie 1999: 3)<br />
In those parts of central and local government that have a responsibility for aspects of the<br />
environment, the various factors contributing to wellbeing are usually considered more broadly.<br />
Soon after the UK Local Government Act was passed in 2000, giving local government a<br />
responsibility to promote wellbeing, the New Zealand Local Government Act 2002 was passed<br />
with reference to local authorities’ role in promoting the ‘four well-beings’—social, economic,<br />
environmental and cultural. Section 3 of the Act states that:<br />
The purpose of this Act is to provide for democratic and effective local government that<br />
recognises the diversity of New Zealand communities; and, to that end, this Act—<br />
…<br />
(d) provides for local authorities to play a broad role in promoting the social, economic,<br />
environmental, and cultural well-being of their communities, taking a sustainable development<br />
approach<br />
The community outcomes work of the Long Term Council Community Plans that were<br />
developed under this Act led to the production of community-level social, cultural, economic and<br />
environmental wellbeing and sustainability indicators that placed New Zealand at the forefront<br />
of the development of progress indicators internationally (Anew 2006).<br />
In December 2012, the Local Government Act was amended, and the reference to wellbeing was<br />
removed in an attempt to tighten the focus of local authorities, so that section 3d now reads:<br />
(d) provides for local authorities to play a broad role in meeting the current and future needs of<br />
their communities for good-quality local infrastructure, local public services, and performance of<br />
regulatory functions.<br />
New Zealand fares fairly well in international surveys of wellbeing (see Box 4), but a number<br />
of projects that measure subjective wellbeing and some aspects of objective wellbeing are also<br />
currently underway in New Zealand:<br />
••<br />
The Quality of Life project is a collaborative project focused on improving the quality<br />
of life and wellbeing outcomes for six of the country’s largest cities, from Auckland to<br />
32 The nature of wellbeing
Dunedin. The reporting structure includes a 5-yearly report, which draws on a biennial<br />
Quality of Life survey that measures the perceptions of wellbeing of over 5000 residents<br />
and data from secondary sources 37 .<br />
••<br />
The Sovereign Wellbeing Index is the result of a recent partnership between the insurance<br />
company Sovereign and Auckland University of Technology’s Human Potential Centre.<br />
The first report was published in 2013 (Human Potential Centre 2013) and was based on<br />
a survey of the personal and social wellbeing of close to 10 000 New Zealanders in late<br />
2012 38 .<br />
••<br />
The New Zealand Attitudes and Values Study, which is being run by Chris Sibley of the<br />
Department of Psychology, University of Auckland, aims to survey New Zealanders each<br />
year for 20 years, looking at how people’s opinions, values and levels of satisfaction with<br />
their lives may change gradually over time 39. .<br />
••<br />
Councillor Martin Visser of Wanganui District Council is developing a city-based version<br />
of the Social Progress Index (see Box 4) and applying it to New Zealand’s 19 main urban<br />
areas (M. Visser, pers. comm.). He is currently including 34 variables and is adding quality<br />
of life dimensions of particular importance to New Zealanders, for example access to the<br />
great outdoors.<br />
Other initiatives are exploring alternatives, or additions, to GDP as a measure of national<br />
progress:<br />
••<br />
The New Zealand Genuine Progress Indicator Research Project, led by Dr Murray<br />
Patterson at Massey University and funded by the Foundation for Research, Science and<br />
Technology and the Parliamentary Commissioner for the Environment, began in 2005<br />
and developed a GPI index for New Zealand from 1970 to 2006. As with similar studies<br />
elsewhere, it has shown that GDP has risen much more steeply than GPI since around 1970.<br />
••<br />
Anew New Zealand 40 is a community group that, for the last decade, has been very actively<br />
working in collaboration with the public and various interested government departments<br />
to promote community engagement in the development of national visions and a set of<br />
wellbeing and sustainability indicators to measure progress on these visions.<br />
Statistics New Zealand has a mandate to coordinate and collate the measurements of wellbeing<br />
and sustainable development made by central government departments. The framework it uses<br />
for this was published in 2009, and it’s most recent report, Key findings on New Zealand’s progress<br />
using a sustainable development approach: 2010, measured New Zealand’s environmental,<br />
economic and social progress using 16 key indicators. The findings from these indicators were<br />
used to answer four main questions, based around four key concepts:<br />
••<br />
Meeting needs—How well do we live?<br />
••<br />
Fairness—How well are resources distributed?<br />
••<br />
Efficiency—How efficiently are we using our resources?<br />
••<br />
Preserving resources—What are we leaving behind for our children?<br />
Like other economic agencies that are emphasising goals and measures beyond economic<br />
growth, the New Zealand Treasury has acknowledged that our quality of life and wellbeing (or<br />
‘living standards’, as they call it) are determined by a range of material and non-material factors.<br />
In May 2011, New Zealand Treasury released their new Living Standards Framework 2011 (Fig. 5),<br />
37<br />
www.qualityoflifeproject.govt.nz/<br />
38<br />
www.mywellbeing.co.nz/mw/<br />
39<br />
www.psych.auckland.ac.nz/uoa/new-zealand-attitudes-and-values-study<br />
40<br />
www.anewnz.org.nz<br />
The nature of wellbeing<br />
33
CAPITAL<br />
FINANCIAL & PHYSICAL<br />
HUMAN<br />
SOCIAL<br />
NATURAL<br />
Stocks<br />
(examples)<br />
Financial Wealth<br />
Housing<br />
Infrastructure<br />
Skills<br />
Health<br />
Institutions<br />
Trust<br />
Climate<br />
Biodiversity<br />
Water<br />
create<br />
affect<br />
Flows<br />
(examples)<br />
Income<br />
Consumptions<br />
In‐kind services<br />
Employment<br />
Leisure<br />
Innovation<br />
Freedom<br />
Security<br />
Environmental services<br />
Amenities<br />
Figure 5. New Zealand Treasury’s ‘Living Standards’ framework (source: Gleisner et al. 2011: 18).<br />
which was based on a stocks and flows model—ecosystem services are one of the flows to and<br />
from the four capital stocks (financial and institutional, human, social, and natural capital) ‘that<br />
make up the national wealth of New Zealand’. This framework was described as:<br />
… a complementary input to the policy process, rather than an analytical, prioritisation or<br />
decision-making tool in its own right. It can be used to illustrate the potential trade-offs and<br />
synergies that exist within public policy issues, as well as informing Ministers of distributional<br />
outcomes.<br />
(Gleisner et al 2011: 18)<br />
In November 2012, the economic and public policy research group Motu was awarded a<br />
3-year Marsden grant by the Royal Society of New Zealand. Their study, Testing the validity<br />
and robustness of national wellbeing and sustainability measures, will address a fundamental<br />
question: are a country’s policies and actions sustainably increasing its wellbeing? 41<br />
2.5 Wellbeing and natural capital<br />
Alongside the development of new measures of progress and feeding into them has been a<br />
growing recognition that the maintenance of progress and wellbeing is dependent on sustaining<br />
natural capital and ecosystem services.<br />
In the 1990s, the World Bank began to recognise that current rates of depletion and degradation<br />
of natural resources could undermine any progress achieved in reducing poverty, and so started<br />
to develop their own measures of wealth that attempted to take into account the depletion of<br />
natural and physical capital (World Bank 2006). As a result, they developed two indicators<br />
(Adjusted Net Savings and Wealth), both of which link the macro-economy with the environment<br />
and sustainability, and are built on the idea that a nation’s ability to sustain the wellbeing of its<br />
citizens is determined by its asset base and how the components of its asset base vary over time—<br />
where the asset base includes natural resources, as well as produced, social and human capital 42 .<br />
The World Bank’s Adjusted Net Savings (ANS) measure, which was initially known as the<br />
Genuine Saving Rate, was first published in the late 1990s (Hamilton & Clemons 1999; Ferreira<br />
et al. 2008; Hess 2010; Greasley et al. 2014). It is derived from standard national accounting<br />
measures of Gross National Savings, and measures changes in real wealth from one year to the<br />
41<br />
www.motu.org.nz/news-media/detail/motu_researchers_awarded_marsden_grant<br />
42<br />
http://web.worldbank.org/WBSITE/EXTERNAL/TOPICS/ENVIRONMENT/EXTEEI/0,,contentMDK:20487830~menuPK:118<br />
7769~pagePK:148956~piPK:216618~theSitePK:408050,00.html<br />
34 The nature of wellbeing
next by looking at increases in produced capital (through investments), the depletion of natural<br />
resources (e.g. through the extraction of oil or timber from forests), investments in human<br />
capital (e.g. through education) and damages to health as a result of pollution. An advantage<br />
of the ANS is that it makes the growth-environment trade-off quite explicit, as those countries<br />
that are planning to grow today and protect the environment tomorrow will be notable by their<br />
depressed rates of adjusted net saving 43 . However, a severe limitation of the ANS is that it is<br />
based on the assumption that there can be perfect substitutability between the different capital<br />
stocks (Pillarisetti & van den Bergh 2007; Dupuy 2012). In other words, it assumes that we have<br />
the capacity to completely substitute natural capital and biodiversity with other forms of capital,<br />
and so the specific role and importance of natural capital receives no additional weight in the<br />
calculations.<br />
The World Bank’s Wealth Estimate was developed over a number of years. Related publications<br />
include Expanding the measure of wealth (World Bank 1997), Where is the wealth of nations?<br />
(World Bank 2006) and The changing wealth of nations: measuring sustainable development in<br />
the new millennium (World Bank 2011). The World Bank describes these estimates as follows 44 :<br />
In speaking of wealth we are returning to the ideas of the classical economists, who viewed land,<br />
labor, and produced capital as the primary factors of production. The estimates … measure total<br />
wealth as composed by:<br />
••<br />
Produced capital—the sum of machinery, equipment, structures (including infrastructure),<br />
and urban land;<br />
••<br />
Natural capital—including land resources, forests and sub-soil assets;<br />
••<br />
Intangible capital—a wide array of assets such as human capital, quality of institutions, and<br />
governance.<br />
••<br />
The OECD also now recognises natural capital as a factor of production and its role in<br />
enhancing wellbeing, and so requires estimates of natural capital stocks as part of each<br />
nation’s national accounts.<br />
This, of course, raises the question of how best to measure natural capital. The OECD Green<br />
Growth Agenda launched in 2011 (with ‘Green Growth’ defined as ‘promoting economic growth<br />
while reducing pollution and greenhouse gas emissions, minimising waste and inefficient use<br />
of natural resources, and maintaining biodiversity’ 45 ), has generated considerable research<br />
and a number of reports exploring how best to measure natural capital, wellbeing and related<br />
matters. The OECD’s (2011b) report Towards green growth—monitoring progress: OECD indicators<br />
provided an overview of a framework and proposed indicators to track the progress of the Green<br />
Growth agenda, including 15 indicators for aspects of natural capital, covering environmental<br />
and resource productivity, natural asset base (including some measures of biodiversity) and<br />
environmental quality of life. This work was progressed in the 2013 report Moving towards<br />
a common approach on green growth indicators, which was produced by the Green Growth<br />
Knowledge Platform (2013)—a joint effort by the OECD, UNEP, the World Bank and the Global<br />
Green Growth Institute. The framework they used to show the connections between the natural<br />
asset base, wellbeing and future wealth is depicted in Fig. 6.<br />
An international statistical standard for environmental-economic accounting has also now been<br />
developed, which is known as the System of Environmental-Economic Accounting (SEEA)<br />
Central Framework (European Commission et al. 2012). This focuses on the interactions between<br />
the economy and the environment (excluding the atmosphere and oceans), and describes stocks<br />
43<br />
http://web.worldbank.org/WBSITE/EXTERNAL/TOPICS/ENVIRONMENT/EXTEEI/0,,contentMDK:20502388~menuPK:118<br />
7778~pagePK:148956~piPK:216618~theSitePK:408050,00.html<br />
44 http://web.worldbank.org/WBSITE/EXTERNAL/TOPICS/ENVIRONMENT/EXTEEI/0,,contentMDK:20487828~menuPK:118<br />
7788~pagePK:148956~piPK:216618~theSitePK:408050,00.html<br />
45<br />
www.oecd.org/environment/green.htm<br />
The nature of wellbeing<br />
35
Figure 6. The production framework for Greening Growth / Greening Economy indicators and wealth accounting<br />
(source: Green Growth Knowledge Platform 2013). Note: ovals represent indicator categories.<br />
and changes in stocks of those environmental assets (including renewable and non-renewable<br />
natural resources and land) that are already included within the asset boundary of the System of<br />
National Accounts used to calculate GDP. SEEA covers only financial transactions, i.e. it covers<br />
activities such as expenditure on biodiversity protection, but not the value of the biodiversity<br />
itself (Green Growth Knowledge Platform 2013). It is hoped that the value of the biodiversity will<br />
be covered in the companion SEEA Experimental Ecosystem Accounts, which is currently under<br />
development. This will not be a statistical standard, but will provide a consistent and coherent<br />
summary of the state of the art for measuring the flow of benefits to humanity that are provided<br />
by ecosystems, and the capacity of ecosystems to provide these benefits. It will cover the status of<br />
overall ecosystem condition and capacity (including the atmosphere and oceans), accounting for<br />
biodiversity, carbon, economic instruments used by government in relation to the management of<br />
ecosystems and techniques for the valuation of ecosystems (European Commission et al. 2012) 46 .<br />
Three other related initiatives are developing tools and providing guidance on the valuation<br />
of biodiversity and ecosystem services—the World Bank-initiated Wealth Accounting and<br />
Valuation of Ecosystem Services (WAVES) Global Partnership; The Economics of Ecosystems<br />
and Biodiversity (TEEB) 47 and its offshoot, the Natural Capital Coalition 48 ; and UNEP, who, in<br />
December 2012, published a framework document Measuring progress towards an inclusive<br />
green economy and is also preparing a manual on the use of indicators to develop green<br />
economy policies.<br />
46<br />
https://unstats.un.org/unsd/envaccounting/White_cover.pdf<br />
47<br />
www.teebweb.org/<br />
48<br />
www.naturalcapitalcoalition.org/<br />
36 The nature of wellbeing
2.6 Wellbeing and sustainability<br />
Alongside and relating to all of the developments described above, another strand of research<br />
has focused on the connections between wellbeing and sustainability.<br />
Much research has concluded that the global economy and current human demands are far<br />
exceeding the planet’s sustainable limits (e.g. MEA 2005a), yet even the richest nations on<br />
the planet seek to grow their economies further (Purdey 2010; Alexander 2012). One proposed<br />
solution is the adoption of Green Growth, i.e. a continuation of economic growth but with much<br />
greater focus on decoupling that growth from negative environmental impacts and addressing<br />
income inequality (e.g. OECD 2011a, b 49 ; AtKisson & AtKisson 2013). This approach implicitly<br />
acknowledges that our economies are currently designed around growth and require growth to<br />
function, and that when growth-based economies do not grow, people suffer.<br />
Others argue that while some economic growth is still required in the least developed countries,<br />
basic physics dictates that resource consumption cannot continue to grow forever on a finite<br />
planet, so at some stage we need to level off consumption rates, or even reduce them if we have<br />
exceeded planetary carrying capacity (e.g. Daly 1997; Victor 2008; Jackson 2011). Indeed, early<br />
economists such as Smith (1776) and later Keynes (1963) assumed that growth was a transition<br />
phase towards a steady state economy.<br />
A number of analysts consider that the era of growth is already near an end (e.g. Morgan 2013) as<br />
a result of rising resource costs—principally oil 50 . Traditional concepts of growth and development<br />
would conclude that a reduction in economic growth and resource use will constrain human<br />
welfare and threaten our quality of life. However, the evidence from psychology that at least<br />
some of our consumption is not contributing positively to our wellbeing suggests that a ‘double<br />
dividend’ (or even a triple or quadruple dividend) could flow from reducing consumption (Brown &<br />
Kasser 2005; Gowdy 2005; Jackson 2005; Princen 2005; Dolan et al. 2006; Marks et al. 2006; Kasser<br />
2009; Welsch 2009; Alexander 2012; Reid & Hunter 2013). In other words, a greater focus on what<br />
really brings us improved wellbeing could not only make us happier, but would also reduce the<br />
impact we have on the ecosystems and ecosystem services on which we depend.<br />
Despite how important it is to both reduce environmental impact and increase wellbeing,<br />
surprisingly few studies have examined the connection between an individual’s subjective<br />
wellbeing and his or her environmental impact (Ferrer-i-Carbonell & Gowdy 2007; Lenzen &<br />
Cummins 2011). However, three recent studies have investigated whether higher personal<br />
greenhouse gas (GHG) emissions are linked with greater wellbeing. Wilson et al. (2013)<br />
surveyed people in Halifax, Nova Scotia, and found that respondents that generated higher GHG<br />
emissions did not report to be healthier, happier or more connected with their communities,<br />
suggesting that individuals can experience similar degrees of wellbeing regardless of GHG<br />
emissions associated with their lifestyles. Similarly, a study of 1000 Swedish respondents found<br />
no strong link between an individual’s emissions and subjective wellbeing or between specific<br />
emission-intensive activities and subjective wellbeing, but did find that materialistic values<br />
correlated with lower subjective wellbeing and to some extent with higher GHG emissions<br />
(Andersson et al 2014). In an Australian study, Lenzen & Cummins (2013) found that household<br />
GHG emissions continued to increase as incomes rose into higher income ranges, but that<br />
wellbeing levelled off; consequently, they concluded that increasing gross household income over<br />
about $100,000 on average creates more commons harm than personal good.<br />
49<br />
These and other OECD Green Growth reports are available at www.oecd.org/greengrowth/towardsgreengrowth.htm<br />
50<br />
Following earlier researchers such as Odum (1969), Odum (2004) and Daly (1996), Morgan (2013) argued that the economy is<br />
a surplus energy equation, not a monetary one, and that growth in output (and in the global population) since the Industrial<br />
Revolution has resulted from the harnessing of ever-greater quantities of cheap fossil fuel energy. However, production from<br />
the cheapest, most accessible fossil fuel reserves has now peaked (see also Smith 2010), with the result that the Energy Return<br />
on Energy Invested is steadily declining (from 100:1 in the early days of gushing Texan Oil wells to around 3:1 for Canadian oil<br />
sands, deep offshore oil wells and most biofuels), meaning that the surplus capital that has powered growth for the last<br />
200 years will soon be no longer available.<br />
The nature of wellbeing<br />
37
2.7 Wellbeing and ecosystem services<br />
While there has been much detailed research and discussion about how to classify and categorise<br />
the types of ecosystem services that contribute to wellbeing (see Chapter 4), the question of<br />
how to categorise and understand the types or aspects of wellbeing that ecosystem services<br />
may contribute to has not been explored to anywhere near the same extent. This may reflect the<br />
fact that much of the impetus for studying ecosystem services has come from ecologists and<br />
economists, rather than from social scientists who are familiar with the wellbeing literature.<br />
Many researchers assume that the meaning of wellbeing is self-evident and needs no<br />
explanation, while others have simply divided wellbeing into social, cultural and economic<br />
categories. The MEA (2005b) stated that:<br />
… human well-being is assumed to have multiple constituents, including the basic material for<br />
a good life, such as secure and adequate livelihoods, enough food at all times, shelter, clothing,<br />
and access to goods; health, including feeling well and having a healthy physical environment,<br />
such as clean air and access to clean water; good social relations, including social cohesion,<br />
mutual respect, and the ability to help others and provide for children; security, including<br />
secure access to natural and other resources, personal safety, and security from natural and<br />
human-made disasters; and freedom of choice and action, including the opportunity to achieve<br />
what an individual values doing and being. Freedom of choice and action is influenced by<br />
other constituents of well-being (as well as by other factors, notably education) and is also a<br />
precondition for achieving other components of well-being, particularly with respect to equity<br />
and fairness.<br />
(MEA 2005b: v)<br />
The UK National Ecosystem Assessment (2011) has taken another approach, dividing the value<br />
to human wellbeing into economic value, health value and shared (social) value. The relationship<br />
between ecosystem services and ‘the good life’, specifically in terms of human health, is<br />
examined by McMichael et al. (2005).<br />
One study that has taken a more in-depth look at the components of wellbeing in the context of<br />
ecosystem services is Smith et al. (2013b). These authors (from the US Environment Protection<br />
Agency and the University of West Florida) noted that local, regional and national policy makers<br />
lack the means to track the impact of ecosystem management decisions on human wellbeing, and<br />
suggested the need for an index that is conceptualised in terms of existing wellbeing measures,<br />
but is responsive to changes in ecosystem services. To develop such an index, they carried out a<br />
literature search to identify some common ‘domains’ of wellbeing that appeared in the majority<br />
of previously published indices for such things as wellbeing and quality of life. As a result<br />
of this, they proposed that nine domains be included in the index for the USA: health, social<br />
cohesion, spiritual and cultural fulfilment, education, safety and security, living standards, life<br />
satisfaction and happiness, leisure time, and connection to nature. In their paper, they provided a<br />
good summary of the ways in which ecosystem services can be linked to each of these domains.<br />
Performance in these nine domains of wellbeing was then used to evaluate three ‘well-being<br />
elements’, which they identified as environmental wellbeing, societal wellbeing and economic<br />
wellbeing, all of which are combined to describe human wellbeing (Smith et al. 2013b).<br />
This list of domains chosen by Smith et al. (2013b) has some limitations, however. Personally<br />
assessed subjective wellbeing (life satisfaction and happiness) really provides a summary<br />
statement of how well an individual believes that all of the domains are being satisfied, rather<br />
than being a domain in itself. It appears that this has been recognised in a more recent paper by<br />
the same authors (Smith et al. 2013a), where subjective wellbeing now appears as a component<br />
of the societal wellbeing element rather than as a domain contributing to societal wellbeing.<br />
However, that means that there is no longer any domain covering a key area of wellbeing—<br />
fulfilment of the need for affection and loving relationships. The list also includes a domain<br />
(living standards) in which enhanced levels of material consumption presumably generate<br />
a higher score, even though this is not strongly linked with enhanced wellbeing (once basic<br />
38 The nature of wellbeing
consumption needs are met) and may be linked with reduced wellbeing (see Section 2.2).<br />
Furthermore, the principal focus on measurable wellbeing ends does not facilitate any<br />
exploration of alternative means to achieve these ends.<br />
In Chapter 3, we have chosen to use Max-Neef’s theory of human needs (Max-Neef 1991) to<br />
explore the relationship between ecosystem services and wellbeing, as we believe that its focus<br />
on universal needs makes the framework more widely applicable, and its recognition that we<br />
have options about how to satisfy our needs provides greater scope for exploring how we might<br />
achieve the ‘double dividend’ of enhanced wellbeing and flourishing ecosystem services.<br />
The nature of wellbeing<br />
39
3. How do ecosystem services contribute to<br />
our wellbeing?<br />
In this chapter, we explore the ways in which ecosystem services contribute to our wellbeing by<br />
allowing us to satisfy our needs. We categorise human needs according to Max-Neef’s (1991)<br />
classification, which recognises nine fundamental needs: subsistence, protection, affection,<br />
understanding, participation, leisure, creation, identity and freedom. The aim of this chapter is<br />
not to give a comprehensive account of all the connections, but rather a broad overview of each<br />
area and some selected examples as a prompt for further discussion and research. Given its<br />
topical nature and the pervasiveness of water in our lives, we have given particular emphasis to<br />
the role of our freshwater systems.<br />
Some ecosystem services clearly relate directly to a particular human need, e.g. clean air to<br />
breathe relates to the need for subsistence. By contrast, other services help to satisfy many<br />
needs. For example, the provision of clean water allows us to satisfy our need for subsistence<br />
(clean drinking water), as well as our need for leisure, participation and identity through fishing,<br />
swimming, family picnics by a river and pride in our clean green reputation as a nation. Similarly,<br />
the benefits we get from being in green spaces could be argued to contribute to subsistence<br />
(basic physical and mental health), protection (e.g. by enhancing our immune system, protecting<br />
us from diseases), leisure and many of the other needs. In these instances, we have chosen to<br />
discuss the benefits primarily under one need, and then cross-referenced back to this section<br />
when the discussing the other relevant needs.<br />
Some services, such as the provision of food and water for irrigation, contribute to our subsistence<br />
needs for food, and also provide income to cover other important needs such as health, education<br />
and shelter. However, the income generated from some of these services also supports our very<br />
high level of material consumption, which may be unsustainable (see Section 2.7), may not be<br />
conducive to wellbeing (see Section 2.2), and can be to the detriment of these and other ecosystem<br />
services in the future. As such, it can be argued that these uses are not contributing to the broader<br />
wellbeing of New Zealanders. Since it is beyond the scope of this document to determine which<br />
uses fall into this category, we have largely included any revenue generation under the most<br />
closely related needs heading. However, we also recognise that many New Zealanders place a high<br />
value on any increase in income. Therefore, since this report aims to recognise all of the ecosystem<br />
services that indigenous biodiversity provides, even if their use does not necessarily increase our<br />
wellbeing, we include a final section in this chapter (‘Material wealth’) that summarises some of<br />
the financial benefits we gain from our ecosystem services.<br />
3.1 Subsistence<br />
To survive and flourish, we need nutritious food, clean water to drink, fresh air to breathe, and the<br />
ability to grow our food, create shelter and produce energy, all of which are provided by nature.<br />
3.1.1 Fresh water to drink, grow our food and provide electricity<br />
Our mountains and high country play vital roles in providing freshwater services to the nation.<br />
Since rainfall and snowfall increase with altitude, these upland areas receive a disproportionate<br />
amount of precipitation relative to the land area they occupy (Griffiths & McSaveney 1983; Owens<br />
& Fitzharris 2004). These high inputs, combined with high levels of vegetation cover (in the form<br />
of forests and native grasslands) and low densities of grazing animals, result in these conservation<br />
lands providing large yields of high-quality water (clear, with low levels of pathogens, nutrients and<br />
toxicants) (Davies-Colley 2013). Streams, rivers and aquifers are the arteries of the landscape—they<br />
deliver the water supply services of the high country to the more heavily populated lowlands and<br />
40 The nature of wellbeing
coastal areas. For example, in 2009–2010, they provided water for livestock (c. 810 million m 3 /year),<br />
industry (c. 5800 million m 3 /year), and households (c. 1835 million m 3 /year), and also supported<br />
agriculture through irrigation (> 5800 million m 3 /year) (Rajanayaka et al. 2010).<br />
The natural water storage service of high-country lakes is augmented by outlet control on some<br />
natural lakes (such as Tekapo, Pukaki and Taupo (Taupomoana)), and artificial dams (such as<br />
Lakes Dunstan and Ruataniwha, the eight Waikato River hydro lakes, 158 drinking water storage<br />
dams (Leathwick et al. 2010) and many thousands of farm dams). For example, in the main South<br />
Island hydroelectricity supply catchments, 17% of the average annual water yield is held in<br />
controlled lake storage, with seasonal snow storing a further 15% (Owens & Fitzharris 2004). The<br />
behaviour of snow and ice storages is crucial in determining the seasonal timing and amount of<br />
flow available for hydroelectricity generation and irrigation. In glaciated catchments, such as the<br />
Clutha, Rakaia and Ahuriri, flows are typically lowest in winter (July/August), which is not ideal<br />
for meeting peak winter hydroelectric power demand, and greatest in early summer (December/<br />
January), enhancing their suitability for ‘run of the river’ irrigation—although artificial storage<br />
may also be needed to support late summer/autumn irrigation (Duncan & Woods 2004). In the<br />
non-glacial Manukerikia catchment, runoff peaks in October when spring temperatures melt the<br />
substantial winter snow cover (Owens & Fitzharris 2004). By contrast, runoff is highest in winter<br />
in most North Island rivers that lack significant snow and ice storage in their mountain and<br />
upland headwaters (Duncan & Woods 2004).<br />
These different water storage and flow patterns are reflected in the provisioning services<br />
provided by different types of rivers and groundwater systems. Lake-fed rivers are able to store<br />
runoff that occurs at any time of the year and account for 86% of New Zealand’s hydroelectric<br />
generation capacity (Robb & Bright 2004); and mountain- and hill-fed rivers without lakes<br />
provide an additional 7% and 5%, respectively, of our hydroelectricity (Robb & Bright 2004).<br />
By contrast, glacial-fed rivers only account for 1% of hydroelectricity generation, but provide<br />
13% of the water abstracted for irrigation (Robb & Bright 2004), reflecting their high summer<br />
flows. Other upland areas provide irrigation water via hill-fed rivers (35% of total) and lakes<br />
(9%), and indirectly by recharging groundwaters, which provide 30% of irrigation water. Notably,<br />
low-elevation rivers provide only 11% of allocated irrigation water (Robb & Bright 2004). In 2010,<br />
irrigation used 13 billion m 3 of water, with surface water contributing four times more supply<br />
volume than groundwater, although two-thirds of consents were for groundwater takes 51 .<br />
Our freshwaters support approximately 620 000 ha of irrigated land (84% in the South Island),<br />
contributing an estimated $920 million to gross domestic production in 2002 (Doak 2005). The<br />
economic benefit of irrigation of pastoral land was estimated to average $2000/ha / year in 2004<br />
(Doak 2004) and $2500/ha / year in 2012 (Dymond et al. 2012). With 0.6 million ha currently being<br />
irrigated (Rajanayaka et al. 2010), this equates to a current irrigation contribution to GDP of<br />
$1.5 billion.<br />
The city of Christchurch is particularly well served by the natural services of the Canterbury Plains’<br />
deep aquifers, which provide its citizens with drinking water that is pure enough to drink without<br />
costly treatment. It is also delivered under pressure, so there is no need for costly pumping. In the<br />
west of Christchurch lie indigenous gravel and sand deposited by the Waimakariri River, while<br />
underneath Christchurch and to the east lie alternating layers of gravel and marine deposits. These<br />
layers, which are up to 350 m thick in places, absorb, filter and store rainwater.<br />
Some of the value of the ecosystem services that Christchurch receives from its groundwater<br />
aquifers can be seen by examining the recent cost of treating and piping water from the Waikato<br />
River to Auckland. Auckland City needs 370 million litres of water each day and, until 2002, was<br />
dependent on the drinking water provided by the forested upland catchments of the Waitakere<br />
and Hunua Ranges (currently 80% of supply). However, following a period of extended severe<br />
51<br />
www.mfe.govt.nz/environmental-reporting/fresh-water/freshwater-demand-indicator/freshwater-demand-allocation.html<br />
The nature of wellbeing<br />
41
water use restrictions as a result of droughts in 1994 and 1997–98, Auckland’s water supply<br />
system was redesigned to cope with a drought with a 0.05% return period, mainly by abstraction<br />
of 75 million litres/day from the Waikato River. Water treatment (including membrane filtration)<br />
and installation of a 37-km-long pipeline from Tuakau to Auckland cost $100 million. This was<br />
expanded to 125 million litres/day in December 2012 and Watercare is currently embarking on<br />
a $48 million project to increase the capacity to 150 million litres/day (Thompson 2013). This<br />
Waikato supply is vital for both drought-proofing the existing Auckland supply and providing for<br />
the needs of the 1 million extra residents by 2030 that Statistics NZ predicted in a high-growth<br />
projection in the Auckland Unitary Plan (Auckland Council 2012).<br />
Dunedin is another city that benefits from natural filtering services. Water flowing from<br />
Te Papanui Catchment, much of which is captured from clouds by tussock grasses, was valued at<br />
$136 million per year to the people of Dunedin in 2005 (DOC 2006b; Butcher Partners Ltd 2006).<br />
Clearly, there would be no modern economy in our urban centres without the provisioning<br />
ecosystem service of fresh water for drinking and industrial use, which is generated in our uplands<br />
and transported, largely for free, to the lowland metropolitan centres via rivers and aquifers.<br />
3.1.2 Clean air to breathe<br />
An ecosystem service that most of us take for granted is the provision of the air we breathe.<br />
Respiration is an essential activity for all living things, and for humans and other animals this<br />
involves breathing in oxygen. The oxygen is then transported by our blood to our cells, where it<br />
reacts with glucose to form water and carbon dioxide (CO 2 ), in the process releasing the energy<br />
in the glucose for us to use. The start of the story, not only the source of the oxygen but also the<br />
original source of the high-energy bonds in the glucose which power not only our bodies but<br />
most other activity on the planet, is the green plant. Our planet is a closed system for matter and<br />
the second law of thermodynamics decrees that without a constant source of energy, everything<br />
would gradually break down. However, the Earth is an open system for energy, with 1–35 MJ/m 2 52<br />
of solar energy arriving every day—and, fortunately for us, the green plant has evolved a way of<br />
trapping the sun’s energy into high-energy bonds between carbon atoms via photosynthesis.<br />
Using only carbon dioxide from the atmosphere and water, the green cell manufactures long<br />
carbon chains of sugars, carbohydrates, proteins, etc. and, in the process, releases oxygen.<br />
The oxygen that makes up 20% of Earth’s atmosphere has accumulated over billions of years<br />
from the activity of green plants. As a result of climate change, we are now paying much closer<br />
attention to the amount of carbon dioxide our trees absorb (16.76 million tonnes in New Zealand<br />
in 2011; MfE 2013) and we know that for every 1 tonne of carbon dioxide absorbed by plants<br />
approximately 0.73 tonnes of oxygen are released (Fiona Carswell, Landcare Research, pers. comm.),<br />
so we can calculate that New Zealand’s forests (indigenous and plantation) are producing around<br />
12.24 million tonnes of oxygen per year. Unfortunately, we do not yet know as much about what<br />
happens in the ocean; however, because of its vast size and the productivity of phytoplankton, it is<br />
estimated that half the annual oxygen production comes from phytoplankton in the open ocean<br />
(Field et al. 1998), and that coastal waters also play a role because of their high rates of productivity<br />
and gas exchange. The air-sea exchange of carbon dioxide on the continental shelf suggests that<br />
this region generally produces oxygen and absorbs carbon dioxide (Borges et al. 2005; Cai et al.<br />
2006).<br />
Another less commonly recognised contribution that nature makes to providing us with clean<br />
air is the service that vegetation provides by filtering pollution and particulates from the air,<br />
particularly in urban areas. This is discussed further in Section 3.2—‘Protection’.<br />
52<br />
www.bom.gov.au/climate/austmaps/solar-radiation-glossary.shtml<br />
42 The nature of wellbeing
3.1.3 Food to nourish our bodies<br />
Food from the land<br />
The production and harvesting of food in New Zealand allows us to satisfy many needs, the most<br />
fundamental of which is our need for nourishment so that we can grow and survive. However, it<br />
also allows us to satisfy a range of cultural, social and recreational needs, and the income from<br />
food exports contributes significantly to our high material standard of living (see Section 3.10).<br />
Human labour and skill, and capital and energy inputs all contribute to the production of food,<br />
but none of these would deliver anything without the contribution of nature’s ecosystem services.<br />
In New Zealand, all of the food species we farm on our land are imported. However, natural<br />
ecosystems and indigenous biodiversity play a key role in delivering clean water to our farmlands<br />
(see above), and fertile soil and nutrients for our crops, and providing food for the pollinators of<br />
our crops and natural enemies for the pests of our crops.<br />
The terrestrial animal species we hunt are also nearly all introduced. It is estimated that several<br />
million rabbits (Oryctolagus cuniculus) and possums (Trichosurus vulpecula) are killed each year,<br />
although most of those are not eaten; 463 000 introduced mallard ducks (Anas platyrhynchos)<br />
are harvested each year, which is significantly greater than the harvest of native Paradise duck<br />
(Tadorna variegata) (116 000 per year); and the bulk of wild animal meat that is harvested is<br />
likely to come from deer (Cervidae) and pigs (Sus scrofa), with approximately 100 000 of each<br />
being killed each year, although not all of these are eaten (King et al. 2013).<br />
For Māori, the importance of gathering food from their tribal lands and waters—mahinga kai—is<br />
being argued through Treaty of Waitangi claims and increasingly being reasserted in the post-<br />
Treaty-settlement era. The annual harvesting of tītī (sooty shearwater, Puffinus griseus) is one of<br />
the last remaining large-scale customary uses of native wildlife in New Zealand (Kitson 2004;<br />
Newman et al. 2009), but there are calls for the reinstatement of customary use of a range of other<br />
native birds, plants and traditional materials (NZCA 1997).<br />
Food from rivers, wetlands and lakes<br />
Rivers, wetlands and lakes sustain fisheries of indigenous<br />
species (e.g. tuna/eel (Anguilla spp.), whitebait (Galaxias<br />
spp.), kanakana/piharau/lamprey (Geotria australis), kōura/<br />
freshwater crayfish (Paranephrops spp.)) and introduced<br />
salmonids (trout and salmon), and support waterfowl that are<br />
valued for hunting and bird watching. They also provide a<br />
range of resources that are used in Māori cultural and spiritual<br />
practices, including wetland and riparian plants that are used<br />
in weaving and medicine (Tipa & Teirney 2006); and support a<br />
wide range of recreational activities and provide the backdrop<br />
to many key tourist attractions (Robb & Bright 2004), which, in<br />
the 2012/13 financial year, attracted 2.64 million international<br />
visitors who spent $5,491 million (MBIE 2013a).<br />
Photo: Lucy Roberts.<br />
Māori have particularly strong cultural and historic links to<br />
freshwaters. Some tribes consider their river as an ancestor (tīpuna) (NIWA 2010). Some waters<br />
are considered to be tapu, or sacred, while other water bodies have special taonga value because<br />
of special uses that are not restricted by the prohibitions of tapu. The tapu or taonga status of<br />
a waterway is dependent on the preservation of its purity and the avoidance of unprotected<br />
contact with humans (MfE 2001). Traditionally, Māori consider freshwaters in a holistic ‘Ki uta<br />
ki tai’ (‘mountains to the sea’) manner and believe that small shifts in the mauri, or life force,<br />
of any part of the environment, through misuse, will cause shifts in the mauri of immediately<br />
related components, which could eventually affect the whole system (Harmsworth et al. 2011).<br />
An index of cultural stream health measures has been shown to be strongly positively correlated<br />
The nature of wellbeing<br />
43
with the percentage of indigenous vegetation upstream of river sites in the Motueka catchment<br />
(Harmsworth et al. 2011) and negatively correlated with the percentage of developed land in three<br />
other river catchments (Tipa & Teirney 2006), clearly demonstrating the link between indigenous<br />
ecosystems and Māori cultural values.<br />
Use of and respect for freshwater fisheries are key aspects of Māori culture. The key fishery<br />
species vary with availability, with tuna/eels, kakakana/piharau/lampreys, whitebait (inanga/<br />
matamata Galaxias maculatus), kākahi/freshwater mussels (Echyridella menziesi), kōura/<br />
freshwater crayfish and kōaro (Galaxias brevipinnis) all regionally important (McDowall 2011).<br />
However, eels are generally considered the most important freshwater fish for Māori (McDowall<br />
2011). Historically, many Māori settlements were located near these fishery resources, and tribes’<br />
mātauranga Māori (knowledge) provided deep understanding of the fish and methods for<br />
catching and preserving them that was passed down through generations as cultural knowledge<br />
(McDowall 2011). Thus, the ability to practice kaitiakitanga (broadly defined as sustainable<br />
protection of resources through responsible actions, behaviour, conduct and practices) in relation<br />
to freshwater fisheries is vital for maintaining Māori cultural traditions. Indigenous ecosystems<br />
support these cultural services by maintaining natural habitats and fluxes of water and materials,<br />
to which native fish are adapted, and by delivering high-quality water with low levels of<br />
contaminants, enhancing the safety of fishing and the consumption of fish.<br />
The eel fishery is the most important commercial freshwater fishery in New Zealand, with<br />
annual export sales of $0.8–3.5 million between 1990 and 2004 (Schallenberg et al. 2013), and<br />
with 670 tonnes landed in 2007/08 and c. 500 tonnes in 2011/12 (Jellyman 2012). This catch has<br />
declined by 50% since the mid-1990s, despite being under a quota management system since<br />
the early 2000s, and the Parliamentary Commissioner for the Environment recently called for<br />
a moratorium on commercial fishing of the endemic longfin eel (Anguilla dieffenbachia) 53 ,<br />
which has experienced a particularly sharp decline. Eels are an important part of the freshwater<br />
ecosystem for intrinsic (endemic species), ecological (apex predators and scavengers), customary<br />
(extremely important to Māori in legends and whakapapa, and as a food source) and commercial<br />
values (Jellyman 2012). Eels have been impacted by habitat loss through wetland drainage<br />
(particularly shortfin eels A. australis), loss of cover habitat, and engineering works that have<br />
reduced the connectivity between rivers and floodplains and with headwater habitats above<br />
dams, which restrict longfin eels’ access to c. 36% of their potential habitat (Jellyman 2012).<br />
The latter effect has recently been partially offset by the release of elvers above dams, and<br />
through the trapping and transfer of adult migrants below hydroelectric dam turbines that cause<br />
high mortality (Jellyman 2012).<br />
Juvenile galaxiids (whitebait) move into freshwater following their marine larval phase, and<br />
these runs provide the basis of the traditional and recreational whitebait fishery, which has<br />
an informal market and is managed by DOC without a total catch regulation. Both Māori and<br />
Pākehā have strong traditions of whitebait harvesting on the lowland reaches of many rivers.<br />
For example, a 2013 survey found 869 whitebait ‘stands’ on the banks of the lower Waikato River<br />
and its islands, including 80 with small baches and 192 with 2–3-room dwellings attached (Cheri<br />
van-Schlavendijk-Goodman, Waikato River Raupatu Trust, pers. comm.). The juveniles of inānga<br />
generally comprise 70–100% of the total catch (McDowall & Eldon 1980; Rowe et al. 1992).<br />
Inānga lay their eggs in riparian vegetation at the high-tide mark near the upper end of the ‘salt<br />
wedge’ in coastal streams and rivers. Spawning is dependent on shaded, moist riparian habitat<br />
conditions (Hickford & Schiel 2011), which can be provided by native or exotic vegetation.<br />
However, these areas have been greatly degraded by the grazing of livestock (Hickford & Schiel<br />
2011). Other galaxiid species spawn further upriver on riparian vegetation or litter at the top<br />
53<br />
www.pce.parliament.nz/media/media-releases/stop-commercial-fishing-or-longfin-eels-will-perish-environment-commissioner;<br />
www.sciencemediacentre.co.nz/2013/04/17/longfin-eels-pce-calls-for-commercial-fishing-moratorium/<br />
44 The nature of wellbeing
of flood flows, but also likely require the shaded, moist habitat conditions that are provided<br />
by native riparian vegetation for successful hatching when the eggs are next inundated by<br />
flood flows. There is a lack of quantitative information on trends in whitebait abundance, but<br />
anecdotal evidence of a decline in the Waikato catchment has been associated with the draining<br />
of wetlands, degradation of lowland lakes, trout predation, increased pest fish abundance, flood<br />
protection works, and migration barriers such as weirs and culverts (NIWA 2010). It is also<br />
likely that the clearance of forest for pasture has increased the dominance of inānga over more<br />
forest-dependent whitebait species, such as kōaro (G. brevipinnis), banded kōkopu (G. fasciatus),<br />
shortjaw kōkopu (G. postvectis) and giant kōkopu (G. argenteus) (Rowe et al. 1992; NIWA 2010).<br />
Many iwi are developing fishery plans for whitebait and other taonga species (kōura/freshwater<br />
crayfish, kākahi/kaeo/freshwater mussels, kanakana/piharau/lamprey, kōaro, and tuna/eels) in<br />
their rohe.<br />
There is limited freshwater aquaculture of introduced salmon (central South Island) and native<br />
kōura (Alexandra and Wairau Valley, Blenheim) 54 . The much larger sea-based salmon aquaculture<br />
industry, however, is reliant on freshwater for breeding replacement stock.<br />
Food from the sea<br />
Our food from the sea comes almost entirely from species whose natural habitat is here in the<br />
South Pacific, living in ecosystems that depend on a whole suite of ecosystem processes and<br />
services for their effective functioning. We extract food such as fish and shellfish from the sea not<br />
only to feed our hunger, but also for cultural and recreational benefits.<br />
Akroyd Walshe Ltd et al. (2002) explored the extent of subsistence fishing in the upper North<br />
Island of New Zealand, defining an economic subsistence fisher as one who harvests for him/<br />
herself and/or immediate descendants, and who uses the surplus for small-scale commerce,<br />
including bartering or trading fish for goods, other foods, or skills or equipment. Their indicative<br />
estimate was that 3.8% of those adults actively fishing in saltwater in a given 12-month period<br />
were economic subsistence fishers.<br />
Akroyd Walshe Ltd et al. (2002) also identified people who were social/cultural subsistence fishers,<br />
i.e. those who gifted fish for reciprocity and mutual support purposes (excluding reciprocity<br />
for immediate or near-term material benefit). These people were fishing for cultural, church or<br />
community occasions, for family, ceremonies/celebrations (e.g. births, funerals/tangi, weddings,<br />
hui), or for assistance with illness, misfortune or condition (e.g. pregnancy). Fishing for these<br />
reasons was much more common, with 25.8% of adults who actively fished saltwater in a given<br />
year estimated as being engaged in social/cultural subsistence fishing in that year. Slightly over<br />
half (38/60) of the social/cultural fishers identified themselves as having Māori ancestry (Akroyd<br />
Walshe et al. 2002). Fisheries regulated by Māori include mātaitai reserves, within which Māori<br />
manage non-commercial fishing through bylaws; there are currently ten of these in New Zealand.<br />
Similarly, taiāpure are local fisheries that are governed by local management, and there are eight<br />
of these in New Zealand. The customary take for Māori is estimated at 4813 tonnes 55 .<br />
Commercial fishing and aquaculture also contribute to our economy, with coastal and ocean<br />
waters supplying 99% of the worldwide annual commercial fish catch. Many different benthic<br />
and pelagic species are targeted for consumption, and the maintenance of stocks requires the<br />
preservation of habitats and healthy ecosystems. For New Zealand, the Freight on Board export<br />
value of this industry was $1.568 billion in 2012 (Seafood New Zealand 2013).<br />
54<br />
www.clearwatercrayfish.co.nz/koura.html<br />
55<br />
www.fish.govt.nz/en-nz/Fisheries+at+a+glance/default.htm<br />
The nature of wellbeing<br />
45
A total of 130 species are commercially fished in New Zealand, with a total quota value of over<br />
$4 billion. New Zealand has 1278 commercial fishing vessels, and 220 processors and licensed fish<br />
receivers, which provide the equivalent of 5680 full time jobs 56 . Māori have a substantial stake<br />
and now influence more than 30% of our commercial fisheries following Treaty settlements.<br />
3.1.4 Associated services that make food production possible<br />
We could not grow nutritious food without a whole suite of other ecosystem services. Fresh water<br />
and clean air are mentioned above (Sections 3.1.1 and 3.1.2), and protection services such as flood<br />
mitigation and climate regulation are mentioned below (Sections 3.2.1 and 3.2.2). Here, we discuss<br />
several other key services—nutrient cycling, pollination, biological control and shelter.<br />
Nutrient cycling<br />
Food production on land and in rivers, lakes and the ocean depends on the continuous cycling of<br />
nutrients. Sixteen nutrients are commonly recognised as being essential for plant growth 57 and<br />
these same atoms have been cycling on the planet for billions of years, providing the building<br />
blocks for successive generations of plants and for the animals and microbes that eat them.<br />
This cycling process that makes the nutrients available again and again is powered by solar<br />
energy captured by green plants, and is carried out by a range of living organisms. Without<br />
the organisms that break down plants and animals when they die, releasing the nutrients for<br />
subsequent plant and animal growth, life on Earth would very rapidly come to a halt.<br />
On land, nutrient cycling mainly occurs within the soil—a process that involves both<br />
microorganisms, such as bacteria, fungi and protozoa, and invertebrates, such as nematodes,<br />
micro-arthropods and earthworms. We can increase the supply of nutrients by adding fertilisers,<br />
which we are doing in increasing amounts, but the natural nutrient cycles and the capacity of the<br />
soil to hold the added nutrients in the soil and convert them into forms that are suitable for plant<br />
nutrition are highly dependent on the complex suite of soil biota. We know that soil microbes are<br />
very important in cycling nitrogen (both in terms of fixing nitrogen from the atmosphere, and<br />
moving organic nitrogen from decayed plants and animals back into plants), in helping the soils<br />
to store carbon (New Zealand soils store about four times more carbon than plants; Hewitt 2012),<br />
in helping to minimise the release of carbon dioxide into the air and in cycling phosphorus, yet<br />
we know remarkably little about which species are involved or how the soil ecosystem functions.<br />
The staggering diversity of soil biota may be orders of magnitude higher than the above-ground<br />
diversity of plants and animals, but no one has yet made an exhaustive census of even one<br />
natural habitat (Holmes 1996). Bacteria are the most abundant species. According to the Global<br />
Biodiversity Assessment 1995 58 , ‘a single gram of temperate forest soil could contain 10,000<br />
million individual cells comprising 4,000–5,000 bacterial types, of which less than 10% have been<br />
isolated and are known to science’. Our relative ignorance about the biodiversity in our soils<br />
means that while we know, for instance, that 171 of the 194 species of earthworms in our soils are<br />
endemic (Yeates 2012), we have no idea what proportion of the microorganisms are (J. Aislabie,<br />
Landcare Research, pers.comm.). The miracle that is soil is described in Graeme Buchan’s<br />
wonderful Ode to Soil (Box 5).<br />
Ecological theory has only begun to be applied to microbes in the last 5 years (J. Aislabie, pers.<br />
comm.; Fierer et al. 2012), and questions such as the significance of microbial biodiversity for<br />
ecosystem functioning (e.g. see Fierer et al. 2012; Hallin et al. 2012; Philippot et al. 2013) and the<br />
56<br />
www.fish.govt.nz/en-nz/Fisheries+at+a+glance/default.htm<br />
57<br />
Carbon, hydrogen, oxygen, nitrogen, phosphorus, potassium, calcium, magnesium, sulphur, boron, copper, iron, chlorine,<br />
manganese, molybdenum and zinc; e.g. see http://ifa-coop.com/agronomy-articles/roles-of-the-16-essential-nutrients-in-cropdevelopment.<br />
Another six elements (nickel, silicon, cobalt, sodium, selenium, iodine) are also recognised as beneficial (Lavelle<br />
et al. 2005).<br />
58<br />
P. 406, cited in www.fao.org/sd/epdirect/epre0045.htm<br />
46 The nature of wellbeing
Box 5—Ode to soil<br />
Imagine being given this task: ‘Design a life-enabling planet’. One major sub-task: you must ‘invent’<br />
a material to cover the land and support its life. Specifications include: it must store and release<br />
water and gases, and drain away excess water; it must act as a chemical ‘factory’, generating,<br />
storing and releasing nutrients; and as a ‘bioreactor’, cycling Nature’s huge annual yields of dead<br />
organic material back into the biosphere; it must help regulate microclimate; it should be strong<br />
enough to support plants and animals, and resist erosion, yet weak enough to enable penetration by<br />
roots and worms. You would surely design...... soil: that marvellous, ‘holesome’ material, a myriad of<br />
tiny particles and pores. Crops can be grown in ‘soil-less’ media: in hydroponics (roots dangling in<br />
nutrient solution); or even aeroponics! (roots dangling in air, sprayed by nutrient solution). However<br />
these high-tech methods suit only small-scale growth of high-value crops. Our major foodstocks will<br />
always require large-scale cropping of field soils.<br />
Soil is the ‘terra incognita’, the hidden half. We spend large resources exploring outer space, while<br />
much remains unknown of the ‘inner space’ of the soil, especially at the soil-root interface. Soil is<br />
the very source of civilisation: ‘Culture begins with cultivation’. It is the beginning and end place<br />
for land-borne life, a vital link in the cycles of life: the digester of the dead and the birthplace of the<br />
new. Life should be a covenant between people and the land. Just as soil gives us life, we should be<br />
custodians of the life of the soil. Let us value and conserve soil, ‘the place of our nativity’.<br />
(Buchan 2010)<br />
implications of farm management practices on indigenous microorganisms are now beginning<br />
to receive increased attention. Aislabie & Deslippe (2013) recently reviewed the role of soil<br />
bacteria, fungi and algae with respect to the cycling of carbon, nitrogen and phosphorus, and the<br />
degradation of contaminants.<br />
Our farming systems depend heavily on a healthy, diverse soil biota, which influences the<br />
capacity of the soil to hold nutrients (both added fertilisers, and stock urine and faeces) within<br />
the soil so that it remains available to plants and does not cause downstream contamination<br />
problems, as well as its capacity to hold and filter water. An increasing amount of research<br />
is examining how we can assess and measure the natural capital of our soils (e.g. Dominati<br />
et al. 2010), including whether the natural capital stock of particular soils is adequate to<br />
support the soil services (e.g. carbon storage, water storage, aeration, capillary rise and cation<br />
fertility) required by a specified land use (Hewitt et al. 2010) and whether the value of inherent<br />
characteristics of soils is reflected in land values (Samarasinghe & Greenhalgh 2013). An<br />
ongoing programme of soil quality assessment in the Waikato region is allowing identification<br />
of the impacts of land use and associated key soil quality issues. The 2009 report identified<br />
improvement over the last 7 years with respect to compaction, but ongoing loss of soil organic<br />
matter (originally built up over hundreds of years of podocarp forests), excessively high fertility<br />
levels, erosion risk in areas that are being deforested and in some horticulture areas, and<br />
accumulation of diffuse soil contaminants, e.g. cadmium (under horticulture, dairying and other<br />
pasture) and zinc (under dairying and other pasture) (Taylor 2011).<br />
Nutrient recyclers also provide an essential service in the oceans. Nitrogen is one of the most<br />
important nutrients driving production in marine ecosystems (Blackburn & Sorensen 1988),<br />
which means that we cannot live without it. However, too much nitrogen over stimulates<br />
productivity, leading to eutrophication, the prevalence of harmful algal blooms and dead zones,<br />
all of which detract from human wellbeing due to increased risk of illness, fewer recreational<br />
opportunities or lower quality of experiences, and reduced feeding opportunities (e.g. more<br />
shellfish bans because of the algal toxins, and fewer fish). Nitrogen is mainly removed from<br />
aquatic ecosystems by the process known as denitrification, in which inorganic forms of nitrogen<br />
(NH 4<br />
+, NO 3<br />
– and NO 2<br />
–) are transformed to nitrogen gas (N 2 ) and, to a lesser extent (but more<br />
so with eutrophication), the greenhouse gas nitrous oxide (N 2 O). Denitrification is mediated<br />
by specialist bacteria that are present 2–20 mm beneath the surface of coastal sediments. Thus,<br />
these sediments behave like our kidneys and are a vital organ in human wellbeing, removing<br />
nitrogen before it reaches toxic levels. The process of denitrification is helped along by animals<br />
The nature of wellbeing<br />
47
that live in the sediment, pumping water and oxygen, translocating material, and increasing the<br />
surface area for exchange between oxic and anoxic zones. Biogeochemical interactions among<br />
an array of sediment-dwelling organisms (e.g. bacteria, microalgae and macrofauna) are of<br />
central importance to this ecosystem service. Estimates show that at least 80% of the terrestrial<br />
dissolved inorganic nitrogen will be denitrified in the ocean margin (Middelburg et al. 1996;<br />
Seitzinger et al. 2006). Recycled inorganic nutrients, i.e. NH 4<br />
+ released from sediments, supply a<br />
significant proportion (in some cases, 100%) of the nutrient demand for primary production on<br />
the continental shelf (Sundback et al. 2003). Shallow coastal waters tend to be productive, not<br />
only because of nutrient runoff from the land, but also because of the recycling of nutrients in the<br />
sediments that are closely connected to the water column (Rowe et al. 1975). Most New Zealand<br />
estuaries are not yet badly affected by excessive loadings of nutrients and organic matter, but this<br />
is a significant environmental problem in many estuaries in other countries and the permanent<br />
removal of excess nutrients from estuaries is a valuable ecosystem service.<br />
Pollination<br />
Pollination is a critical ecosystem service across the globe. In some estimates, over 75% of the<br />
world’s crop plants, as well as many plants that are source species for pharmaceuticals, rely on<br />
pollination by animal vectors (Nabhan & Buchmann 1997). In many agricultural and horticultural<br />
systems, pollination is actively managed by establishing populations of honey bees (Apis mellifera).<br />
In New Zealand, pollination provided by the bee industry contributes at least $4.5 billion annually<br />
to the economy, and in the 2011/12 season more than 10 000 tonnes of honey was produced<br />
(O’Connor 2013). In this case, ensuring the maintenance of the pollination ecosystem service also<br />
supports a further ecosystem service in the form of honey supply—a provisioning service with<br />
direct economic value.<br />
Mid-Canterbury alone supplies half of the world’s radish seed, one-third of the world’s carrot seed<br />
and 80% of New Zealand’s total vegetable seed exports, valued at over $50 million, all of which are<br />
dependent on insect pollinators. In addition, there is a burgeoning trade in high-value pastoral<br />
clover seed, and seeds of brassica and forage crops 59 .<br />
The use of mānuka (Leptospermum scoparium) to produce mānuka honey, a product with<br />
accepted nutritional and medical benefits (Stephens et al. 2005; Bogdanov et al. 2008), is<br />
changing public perception of its value from ‘a bit of scrub fit only for firewood’ to a highly<br />
valued and farmed native species. A new industry is being created, providing an additional<br />
source of income in rural areas. This change in attitude is a great success story in terms of<br />
New Zealand’s indigenous biodiversity, especially where mānuka is being retained or planted in<br />
preference to pine trees on eroding hill country.<br />
As honey bee populations have declined, there has been increased interest in ensuring that<br />
honey bees have access to plenty of food all year round, including from suitable native plants.<br />
Trees for Bees 60 is a recent Federated Farmers initiative aimed at ensuring that honey bees have<br />
the opportunity to gather sufficient pollen (a protein and vitamin source) and nectar (for energy)<br />
to maintain optimum hive strength and a viable pollinating bee force. Farmers and gardeners are<br />
encouraged to plant bee-friendly trees and shrubs in waterway margins, windbreaks, field edges,<br />
under pivots and along roadsides, with suggestions for a range of native and exotic species that<br />
will provide a sequence of flowers for bees throughout the year. Huryn (1995) found that honey<br />
bees collect pollen or nectar from 224 native New Zealand plant taxa.<br />
The decline in honey bee populations globally (briefly reviewed by McAlpine & Wotton 2009)<br />
has also led to renewed interest and recognition of the importance of wild pollinators, such as<br />
bats, bees, flies, moths, beetles, thrips, birds and butterflies, (e.g. Westerkamp & Gottsberger 2000;<br />
Kremen et al. 2007). Wild pollinators may also interact synergistically with managed bees to<br />
increase crop yields (Greenleaf & Kremen 2006).<br />
59<br />
www.midlands.co.nz/news/10-bees-hold-the-key-to-canterburys-growing-success<br />
60<br />
www.treesforbees.org.nz<br />
48 The nature of wellbeing
McAlpine & Wotton (2009) reviewed the literature around the nature of pollination in<br />
New Zealand, including some of the research aimed at encouraging and sustaining populations<br />
of wild pollinators on farmland. More recently, Rader et al. (2009, 2011, 2012, 2013) conducted a<br />
series of studies on the pollinators of Brassica rapa crops in Canterbury and Otago, and found<br />
that unmanaged pollinators (including native bees Leioproctus spp. and a variety of flies) were<br />
providing efficient and effective pollination services, and that the maintenance of biodiversity<br />
on agro-ecosystems may be critical to ensure that pollinator taxa are available in the face of<br />
future environmental change. Wratten et al. (2012) reviewed a range of global initiatives aimed<br />
at enhancing pollination, principally through the establishment of flower-rich habitat within or<br />
around intensively farmed landscapes to increase the availability of pollen and nectar resources.<br />
While the primary objective of such measures is to increase the ecological fitness of pollinator<br />
populations through enhanced larval and adult nutrition, they found that such strategies<br />
also provide secondary benefits to the farm and the surrounding landscape—specifically, the<br />
conservation of pollinator habitat can enhance overall biodiversity and the ecosystem services<br />
it provides (including pest population reduction), protect soil and water quality by mitigating<br />
runoff and protecting against soil erosion, and enhance rural aesthetics.<br />
Biological control of pests and diseases<br />
As farmers and gardeners, we tend to be much more conscious of the pest control that we carry<br />
out ourselves. However, it is estimated that 99% of agricultural pests and diseases are controlled<br />
by their natural enemies—predators, parasites and pathogens (Sandhu et al. 2005). Natural pest<br />
control services prevent outbreaks of pests and stabilise agricultural systems the world over.<br />
In New Zealand, some of our major pests are imported species that flourish because they have<br />
arrived without their usual natural enemies. As a consequence, early on New Zealand became a<br />
world leader in identifying and importing appropriate natural enemies of insect and plant pests<br />
(R.L. Hill, Research Associate, Landcare Research, pers. comm.). Cameron et al. (1989) provide a<br />
review of biological control of invertebrate pests and weeds in New Zealand from 1874 to 1987.<br />
Grundy (1989), Goldson et al. (1993) and Jarvis et al. (2006) provided estimates of the value of<br />
biocontrol of the rose grain aphid (Metopolophium dirhodum) 61 , Sitona weevil (Sitona discoideus)<br />
and Scotch broom (Cytisus scoparius) 62 , respectively. These and other studies show that a small<br />
investment in returning nature’s balance can often be extremely cost effective. For example, in<br />
Australia, up to 300:1 returns on investment have been achieved following the introduction of<br />
appropriately selective insects for the biological control of weeds (Page & Lacy 2006).<br />
An alternative to importing a pest’s natural enemies is to make it easier for the existing natural<br />
control agents to flourish. When we simplify habitats, such as in the creation of vineyards,<br />
orchards or pastures, we often remove suitable habitat for natural enemies (Nicholls et al. 2008;<br />
Hogg & Daane 2010), making it harder for the natural pest control services to be delivered. When<br />
natural habitat is available, it can increase the abundance and diversity of the natural enemies<br />
of both imported and native pests by providing food resources, shelter and nesting sites, and<br />
alternative parasite hosts (Landis et al. 2000). As a result, increasing plant diversity has become<br />
an integral part of integrated pest management (IPM) theory and practice (Bugg & Waddington<br />
1994; Landis et al. 2000; Gurr et al. 2004, 2012). Increased rates of biological control under these<br />
conditions have often been attributed to the more diverse system providing natural enemies with<br />
61<br />
Grundy (1989) estimated that the cost of DSIR research into the biological control of the rose grain aphid was approximately<br />
$264,000 (in 1988 dollars). Against this figure, estimates of the annual benefit of the biocontrol achieved by the parasitoid<br />
Aphidius rhopalosiphi imported in 1985 ranged from $300,000 to $5 million. This meant that the DSIR’s initial investment in the<br />
entire research integrated pest control programme ($1.32 million) was likely to be repaid in savings to the community within at<br />
most 7 years under a 10% discount rate and conservative assumptions. If the biocontrol component of the research were treated<br />
separately, the costs of biocontrol were already repaid.<br />
62<br />
Jarvis et al (2006), using conservative assumptions, estimated that the benefits of a proposed biocontrol programme against<br />
Scotch broom would outweigh costs by 2.9:1 (the weighted ratio of benefits to costs), with an annual net benefit to New Zealand<br />
of $5.99 million, once biological control agents are fully established nationwide. Using discounting techniques over 50 years,<br />
they calculated an internal rate of return of 52%, and a net present value of $61.49 million at the 5% discount rate and $21.95<br />
million at the 10% discount rate<br />
The nature of wellbeing<br />
49
esource subsidies, including alternative food and shelter (Landis et al. 2000; Altieri & Nicholls<br />
2004; Gurr et al. 2004; Zehnder et al. 2007). Alternative food includes not only plant resources<br />
of nectar and pollen, but also non-pest arthropods hosted by the plant which supplement the<br />
diets of natural enemies (Landis et al. 2000; Zehnder et al. 2007). These can maintain or increase<br />
natural enemy populations and efficacy, especially when pest populations are small or absent<br />
from the agricultural system (Jonsson et al. 2009). This approach can reduce the need for other<br />
pest control techniques, including pesticides (Gurr et al. 2004). McAlpine & Wotton (2009)<br />
reviewed some of the international literature in this field.<br />
In New Zealand and Australia, the planting of strips of flowering buckwheat (Fagopyrum<br />
esculentum (Moench.)) between vine rows provide nectar in an otherwise virtual monoculture,<br />
thereby improving the ecological fitness of parasitoid wasps that attack grape-feeding<br />
caterpillars. This in turn leads to the pest population being brought below the economic<br />
threshold. An investment of US$3/ha/year in buckwheat seed and minimal sowing costs can lead<br />
to savings in variable costs of US$200/ha/year, as well as fewer pesticide residues in the wine<br />
and enhanced ecotourism (Barnes et al. 2009, 2010).<br />
Shelter<br />
In many parts of New Zealand, crops and stock would not prosper without trees and shrubs to<br />
act as wind breaks (e.g. Sturrock 1969, 1981), and often also as refuges for natural enemies of<br />
pests (see above). Early settlers tended to use species they were familiar with from their home<br />
countries in Europe, such as willow and poplar, but the benefits of using native evergreen<br />
species that are well adapted to the local conditions, and can double as biodiversity reservoirs,<br />
are increasingly being recognised. Meurk & Swaffield (2000) described an ‘integrated biodiverse<br />
landscape vision’ specifically for the South Island high country (but adaptable for other parts<br />
of the country), in which currently segregated protected and productive components are much<br />
more closely integrated, and native hedgerow species are an important interlinking component<br />
of the ecosystem instead of simply being a structural element of shelter.<br />
Greening Waipara is a project that aims to value and enhance all of the supporting services<br />
described above (Box 6).<br />
3.1.5 Health<br />
Nutritious food from healthy ecosystems is a requisite for human survival (as discussed above).<br />
However, opportunities to spend time in and exercise in green spaces also contribute to physical<br />
and psychological human health (see also Section 3.6—‘Leisure’). An increasingly sedentary<br />
indoor lifestyle has been linked with issues such as obesity in both adults and children. In his<br />
book ‘Last child in the woods: saving our children from nature deficit disorder’, Richard Louv<br />
(2005) documented decreased exposure of children to nature in North American society and,<br />
in particular, to opportunities for independent play and unstructured, solitary experience, and<br />
how this ‘nature-deficit disorder’ harms children and society. He cited research indicating that<br />
attention disorders, obesity, a dampening of creativity and depression are associated with a<br />
nature-deficient childhood, and concluded that direct exposure to nature is essential for healthy<br />
childhood development, and for the physical and emotional health of children and adults. Louv<br />
also suggested solutions for the problems he described (Louv 2005, 2011, 2012) and is credited<br />
with sparking a growing ‘No Child Left Inside’ movement to remedy the problem 63 . Actions<br />
promoted by this movement have included legislation in a number of US states and a Federal<br />
Bill aimed at enhancement of environmental literacy between kindergarten and 12th grade, and<br />
fostering understanding and analysis of and solutions to environmental challenges 64 .<br />
63<br />
www.audubon.org/newsroom/press-releases/2008/author-richard-louv-honored-50th-audubon-medal<br />
64<br />
http://en.wikipedia.org/wiki/No_Child_Left_Inside_(movement)<br />
50 The nature of wellbeing
Box 6—Greening Waipara<br />
The Greening Waipara 65 initiative started in 2005 in vineyards of the Hurunui District and quickly<br />
achieved international attention. The project is a research-driven collaboration between wine<br />
growers, Lincoln University, Hurunui District Council and Landcare Research. Greening Waipara<br />
aims to calculate the value of services that are provided for free by nature in the agricultural and<br />
horticultural sectors, such as biological control of pests and weeds, pollination, and soil quality,<br />
and to enhance these services through ecological engineering. At the start, only four vineyards were<br />
involved, but now the project involves 50 vineyards from northern Canterbury.<br />
In addition to the benefits this brings to conservation and the vineyards, the construction of ecotrails<br />
on four vineyards (Pegasus Bay, Mudhouse, Waipara Springs and Torlesse Wines) and a fifth<br />
planned for Omihi School also provides a wellbeing benefit for the public. Close to the tasting rooms<br />
or restaurants of the wine companies, a biodiversity trail begins, complete with information boards<br />
and educational quizzes for children. The trails wind through the vines and native plants, providing<br />
the benefit of a green experience and valuable ecological information for visitors.<br />
Project leader, Professor Steve Wratten from the Bio-Protection Research Centre, Lincoln University,<br />
continues to work with vineyard owners, other researchers and a suite of Master’s and PhD<br />
students to achieve the project goals. Some of this work includes past PhD students’ research on<br />
incorporating New Zealand butterfly conservation as part of the agricultural landscape (Gillespie<br />
2010) and the value of New Zealand native plants for ecosystem services (Tompkins 2010).<br />
Numerous other studies have confirmed the decline in children’s independent mobility and<br />
physical activity levels in Western countries, including New Zealand. Witten et al. (2013) reported<br />
that in the past 20 years, New Zealand children’s active travel (walking and cycling) has dropped<br />
on average from 130 to 72 minutes per week, the proportion of children travelling by car to<br />
school has increased from 31% to 58%, and 9–11-year-old primary school children in suburban<br />
Auckland are less likely to walk to school and play unsupervised outdoors than their parents did<br />
as children.<br />
Blaschke (2013) recently reviewed the health and wellbeing benefits of conservation in<br />
New Zealand, with a particular focus on benefits associated with public conservation areas<br />
managed by DOC. This review focused on three potential pathways via which contact with natural<br />
environments might influence health (some of which are discussed in later sections of this report):<br />
••<br />
Green space provides opportunities to partake in physical activity, which is strongly<br />
associated with better physical and mental health outcomes, and can play a role in both<br />
preventing and managing chronic disease.<br />
••<br />
Green space may facilitate the development of social capital by providing places to<br />
interact with other members of the public and undertake activities with groups, and by<br />
strengthening people’s sense of attachment to their living environment.<br />
••<br />
It has been proposed that nature has direct effects on health and wellbeing, especially<br />
through so-called ‘restoration’ effects, such as recovery from stress and attention fatigue.<br />
Blaschke (2013) commented that although there has been some research on the health and<br />
wellbeing benefits associated with the green spaces managed by DOC, most research has<br />
inadequately characterised the types of green spaces or natural areas being assessed. Thus, it is<br />
currently not possible to generalise about which types of benefits are associated with which types<br />
of green space—for example, whether a particular benefit can arise from a small urban reserve, or<br />
even a view of green space, as opposed to the ‘wild nature’ that is found in an iconic New Zealand<br />
national park.<br />
65<br />
http://bioprotection.org.nz/greening-waipara<br />
The nature of wellbeing<br />
51
Innovative new research methods could help us to better understand the impact of location on<br />
wellbeing. A recent study by MacKerron & Mourato (2013) used a smartphone app that signalled<br />
participants at random moments, presenting them with a brief questionnaire while using satellite<br />
positioning (GPS) to determine their geographical location. Over a million responses from more<br />
than 20 000 participants were collected, and the study found that, on average, participants were<br />
significantly and substantially happier outdoors in all green or natural habitat types than they<br />
were in urban environments.<br />
3.1.6 Energy to power our lives<br />
All of the energy that powers our lives—from basic needs to high consumer lifestyles—comes<br />
from nature. Fossil fuels are stores of energy trapped from the sun’s energy by plants living<br />
millions of years ago, while biofuels contain energy that has been similarly trapped more<br />
recently. Hydroelectricity, wind energy, geothermal energy, biofuels and tidal power are all<br />
derived from natural systems. In 2011, such renewable sources made the greatest contribution<br />
yet to New Zealand’s primary energy supply, both in terms of the proportion of total supply<br />
(39%) and in absolute terms (321 PJ), making New Zealand second in the OECD (after Iceland)<br />
in terms of the proportion of its national primary energy supply that comes from renewable<br />
energy (MED 2012) 66 .<br />
Woody biomass is used to produce heat in both homes and the forestry sector, and is also used<br />
to fire turbines to produce electricity in the forestry sector. The production of liquid biofuels—<br />
bioethanol and biodiesel—is also increasing (up 22% from 2010 to 2011) (MED 2012).<br />
In New Zealand, biodiesel is currently produced from tallow, oilseed rape and used cooking oil,<br />
and produces 40–50% less life-cycle greenhouse gas emissions than fossil diesel. Furthermore, as<br />
tallow and used cooking oil are byproducts of other industry, and oilseed rape is grown as a break<br />
crop on grain fields to increase soil quality, the production of New Zealand biodiesel does not<br />
compete with food production or compromise biodiversity or soil quality (MED 2012).<br />
Energy can also be produced at both liquid waste treatment plants and landfill sites, thanks to the<br />
action of anaerobic bacteria breaking down organic matter such as manure, sewage, municipal<br />
waste, green waste, plant material and crops. At treatment plants, anaerobic digesters are used to<br />
recover energy from wastewater biomass. Many of New Zealand’s larger urban centres<br />
(e.g. Auckland, Hamilton, Christchurch) use these anaerobic digesters to capture biogas<br />
(primarily methane and carbon dioxide) for electricity production and to heat their digesters. The<br />
National Institute of Water and Atmospheric Research (NIWA) is researching the development<br />
of a pond-based wastewater-treatment system that will recover energy from wastewater solids as<br />
biogas and use the wastewater nutrients to grow single-celled algae as a biofuel. Enhancing pond<br />
treatment for energy recovery will also reduce greenhouse gas emissions (methane and carbon<br />
dioxide) and reduce the impact of wastewater discharges on receiving environments.<br />
Landfill-generated energy is produced at a growing number of Landfill Gas to Energy Plants<br />
(LFGTE), including Rosedale, Greenmount and Redvale in Auckland, Hampton Downs near<br />
Hamilton, Tirohia near Paeroa, Awapuni Landfill in Palmerston North, Silverstream in the<br />
Hutt Valley, the Southern Landfill in Wellington, and Burwood Landfill in Christchurch 67 . In<br />
these plants, the methane gas that is produced by the action of microrganisms in the landfill is<br />
combusted in turbo-charged gas engines to produce electricity. The LFGTE plants operated by<br />
Envirowaste Services at Hampton Downs, Greenmount and Rosedale landfills produce a peak<br />
of 8 MW of electricity, enough to supply up to 6400 households 68 . Before the 2011 earthquakes<br />
in Christchurch, gas from the closed Burwood landfill was used to heat and power the QEII Park<br />
66<br />
www.med.govt.nz/sectors-industries/energy/pdf-docs-library/energy-data-and-modelling/publications/energy-data-file/<br />
energydatafile-2011.pdf<br />
67<br />
www.bioenergyprojects.org.nz/directory/; www.infonews.co.nz/news.cfm?id=17745<br />
68<br />
www.envirowaste.co.nz/index.php?page=landfill-gas-to-power<br />
52 The nature of wellbeing
swimming pool complex, replacing 1.5 million litres of liquid petroleum gas each year, thus<br />
helping to reduce Christchurch City Council’s reliance on fossil fuels. The project also reduced<br />
greenhouse gas emissions and earned the Council carbon credits, because methane gas, a<br />
greenhouse gas with 25 times the impact of carbon dioxide, is captured and converted to carbon<br />
dioxide. The Council was able to sell the carbon credits to British Gas, generating more than<br />
$3 million revenue. Post-quake, the methane is being used to power the new Christchurch City<br />
Council offices and to fire a boiler at the Christchurch Wastewater Treatment Plant Biosolids<br />
Drying Facility.<br />
3.1.7 Shelter, storage and furnishings<br />
In New Zealand, timber for housing, furniture and paper comes from exotic and native forests,<br />
which are served by and produce a suite of ecosystem services.<br />
The use of native forests for timber has been the subject of controversy for more than a century<br />
(Young 2004) due to its role in the destruction of New Zealand’s native vegetation cover, and<br />
the resulting loss of biodiversity and cultural values, and increased vulnerability to erosion and<br />
flooding. Yet it cannot be denied that the economic value of this transformation, both in terms of<br />
timber revenue and the establishment of much of the country’s pastoral industry, was a significant<br />
driver of New Zealand’s economy in both colonial and post-colonial times, and hence, historically,<br />
is part of the contribution of ecosystem services to New Zealanders. That legacy continues in the<br />
form of recycled native timber, which is vigorously promoted as ‘heritage native timber’.<br />
The logging of native forests for timber slowed significantly from the 1970s and had largely ceased<br />
on public land by the early 2000s (Swarbrick 2012). The 1993 Forests Amendment Act also slowed<br />
indiscriminate logging on private land, replacing it with a regime that aimed for sustainable<br />
management, which is now administered and monitored by the Ministry of Primary Industries.<br />
The large extent of New Zealand’s exotic forest estate (c. 1.7 million ha) and the supply of most<br />
of our timber requirements from this estate has greatly reduced the exploitation of native forests<br />
for timber. Historically, the origins of the exotic timber plantations were closely connected with a<br />
far-sighted realisation by some people of the need to reduce the clearance of indigenous forests<br />
(Young 2004). Now, exotic as well as indigenous forests provide many of the ecosystem services<br />
discussed here.<br />
In addition, farm foresters and other enthusiasts continue to obtain ‘subsistence needs’ from native<br />
tree plantations that have been established for this purpose. Much of the current work in this area is<br />
being driven by Tāne’s Tree Trust 69 , an organisation promoting the establishment of native timber<br />
plantations and multiple uses on private land (see Box 7), through the provision of technical advice<br />
(Tāne’s Tree Trust 2011), education and advocacy (Barton et al. 2010). The main species promoted<br />
for establishment and silviculture currently include kauri (Agathis australis), tōtara (Podocarpus<br />
totara) and southern beech species (Fuscospora spp. and Lophozonia menziesii).<br />
3.1.8 Clothing<br />
In New Zealand, clothing fibres are produced from non-native species and synthesised from<br />
organic molecules formed millennia ago by ancient plants (i.e. from petroleum products), and are<br />
generally imported from other countries. However, the merino sheep and possums that produce<br />
the fibre that is now being used to produce warm, elegant fabrics for ‘high-end’ clothing graze<br />
on native tussocks and native forests, respectively (though possums remain a significant pest).<br />
Traditionally, Māori used a sharp shell to scrape away the green flesh of the harakeke (New Zealand<br />
flax Phormium tenax) leaf to create a fibre that could be woven (often with feathers and dog skin)<br />
into warm clothing—vital in New Zealand’s generally cool climate. 70<br />
69<br />
www.tanestrees.org.nz<br />
70<br />
www.teara.govt.nz/en/flax-and-flax-working/page-2<br />
The nature of wellbeing<br />
53
Box 7—Weaving resilience from our working lands<br />
A controversial study by the Parliamentary Commissioner for the Environment (2001) examined<br />
the extractive use of native plants for a range of purposes, including for food, timber, clothing and<br />
pharmaceuticals. Timber from native forests 71 is the most obvious example of such use, but the<br />
report also listed a number of other products, including honey, oils, resins, biological compounds,<br />
medicinal products, flax fibres, and rongoā and genetic resources. The report also briefly mentioned<br />
the commercial uses of native animals, particularly freshwater fish. The Commissioner examined a<br />
number of barriers to the extractive use of native plants, including, crucially, the sharp separation<br />
between conservation and commercial production in New Zealand’s current land use philosophy<br />
and legislation, with little role for native plants in the ‘working lands’ production category. The<br />
Commissioner’s approach, as well as the views of many submitters on the earlier discussion paper,<br />
indicated a desire for a new approach. He recommended that a range of research, regulatory and<br />
taxation measures be carried out to increase the economic potential of native species, which, in<br />
his view, would increase rather than decrease the conservation and protection of those species.<br />
This view has been contested by many who wish to offer maximum statutory protection to all native<br />
species, wherever possible. There has been little obvious progress on many of the issues raised in<br />
this study, but the economic value of some of the extractive uses mentioned (for example, mānuka<br />
honey) has increased over the intervening decade.<br />
3.1.9 Other resources<br />
Native plants and animals also provide resources for a range of other activities. Traditional<br />
uses include pōhā (kelp bags) for storing and transporting food; shells for ornamentation, food<br />
preparation and musical instruments; flax fibre for rope, baskets, mats and fishing baskets; and<br />
bone, wood, stone and shell for fish hooks. Today, there is a resurgence of interest in using native<br />
species for a variety of boutique products. For example, the gel from the base of flax leaves is<br />
used to make face creams 72 ; and mānuka oil, kawakawa (Piper excelsum) leaves and kōwhai<br />
(Sophora spp.) bark are being used in a variety of skin creams. Harakeke is one of the most wellknown<br />
‘economic’ New Zealand plants, with a wide range of cultural and economic uses (Wehi<br />
& Clarkson 2007). In addition, dried sphagnum moss (‘peat moss’) has been found to be a very<br />
good growing medium for high-value ornamental plants such as orchids, a useful component of<br />
potting mix, and a wrapping material for transporting seeds and plants. Its harvest has become<br />
a significant economic activity in some regions (notably on the West Coast), including areas of<br />
public conservation lands, where it is harvested widely under concessions and provisions for its<br />
sustainable management (Buxton et al. 1996).<br />
3.2 Protection<br />
Nature’s regulation, protection and maintenance services are often the hidden gifts we take for<br />
granted. The bio-physico-chemical processes that sustain life-support systems fundamentally<br />
underpin all other ecosystem services. They play an important role for humans in the regulation<br />
of climate, maintenance of system integrity and mitigation of human impacts, helping to protect<br />
us from floods, droughts and disease.<br />
Native forests and other types of plant cover sequester the carbon we release, and thus play a<br />
significant role in helping to stabilise the climate. The native forest and grassland vegetation<br />
of our mountains and high country also intercept rainfall and increase its infiltration into<br />
71<br />
The Commissioner made it clear that he was referring only to sustainably harvested timber, but there are many questions about<br />
the long-term sustainability of harvest of New Zealand native forests—a matter of intense controversy for well over a century<br />
(Young 2004).<br />
72<br />
www.teara.govt.nz/en/flax-and-flax-working/page-2<br />
54 The nature of wellbeing
groundwaters, reducing the risk of landslips and reducing erosion. This moderates peak flows in<br />
rivers and reduces sediment build up in river channels, thus reducing downstream flooding risk<br />
relative to that of unforested land. Wetlands and swamps play a critical role in storing floodwaters<br />
and purifying our waters. When ecosystems are degraded, they are not as resilient in the face of<br />
natural and technological disasters, and our sense of safety and security can be affected through<br />
further degradation of ecosystems, economic loss, and increased reliance on social safety nets<br />
and recovery services.<br />
3.2.1 Flood and erosion protection, and water purification<br />
Native forests play a significant role in stabilising slopes and reducing sediment transportation<br />
in streams through their extensively developed root systems (Allen et al. 2013), with undisturbed<br />
forest being most capable of minimising soil erosion due to its developed understorey. The total<br />
volume of water flowing from areas covered in indigenous forests is also lower due to their ability<br />
to intercept water via their large canopies and varied vegetation components (Brown et al. 2005).<br />
Consequently, native forest catchments are likely to have lower peak flows and higher low flows<br />
than unforested catchments, providing more stable water quantities in rivers (Fahey et al. 2004;<br />
Blaschke et al. 2008; Allen et al. 2013). These generalisations are valid in terms of forest ecosystem<br />
services, despite very large differences in ‘natural’ rates of erosion and stream flows regionally—<br />
New Zealand’s position as a storm-battered barrier of faulted rock in the Roaring Forties means<br />
that topography, rainfall, parent rock and soil may all play a greater role than vegetation in<br />
determining runoff and sedimentation rates (Maclaren 1996a; McKelvey 1995; Blaschke et al.<br />
2008). The role that vegetated slopes play in reducing the volume of water flowing onto lower<br />
land has recently become the basis of new council rating schemes that have been tested in the<br />
New Zealand courts (Box 8).<br />
Indigenous forests also play an important role in climate regulation through the storage of<br />
carbon dioxide, particularly in the stems and woody debris; and consequently, there is the<br />
potential for increasing the capacity of the New Zealand carbon sink through the restoration and<br />
succession of native forests (Carswell et al. 2012). There are also reports that forests can play a<br />
role in regulating local air temperatures by providing shelter, shading and evapotranspiration,<br />
although the effects of this in New Zealand are uncertain (McAlpine & Wotton 2009); and that<br />
indigenous forests and scrublands can improve air quality and slow the spread of infectious<br />
insects such as exotic mosquitoes, both of which may result in health benefits, depending on<br />
their location in relation to people (McAlpine & Wotton 2009). Meurk et al. (2013) argued that<br />
urban forests (both native and introduced species) can provide a wide range of ecosystem<br />
services in New Zealand cities, not the least of which is carbon sequestration.<br />
Black Creek, Lake Poteriteri. Photo: Rod Hay.<br />
Lakes and wetlands along the riverine<br />
arteries act as natural water storages,<br />
flow regulators and peak flow buffers<br />
(Campbell & Jackson 2004; Clarkson<br />
et al. 2013). Wetlands are often<br />
referred to as ‘nature’s sponges’ due<br />
to their ability to absorb water during<br />
wet periods and augment baseflows<br />
during dry periods. For example, the<br />
linked Whangamarino Wetland /<br />
Lake Waikare system plays a vital<br />
role in peak flow reduction in the<br />
lower Waikato River flood control<br />
scheme, saving the requirement for<br />
large expenditure on capital works<br />
to create stopbanks and preventing<br />
The nature of wellbeing<br />
55
Box 8—Recognising ecosystem services in law: the Piako-Waihou<br />
rating scheme<br />
Ecologists have long recognised the interconnectedness of the different components of natural<br />
systems. Indeed, the ecologist Barry Commoner (1971) popularised this understanding in his four<br />
laws of ecology, the first two of which are:<br />
• Everything is connected to everything else. There is one ecosphere for all living organisms<br />
and what affects one, affects all.<br />
• Everything must go somewhere. There is no ‘waste’ in nature and there is no ‘away’ to which<br />
things can be thrown.<br />
However, our concepts of land ownership and how this is reflected in the law do not always<br />
recognise this interconnectedness. Even though what is done on one piece of land (e.g. chopping<br />
down or planting trees, or adding nutrients or additional water) can have significant effects on<br />
others in the same catchment, it is only recently and slowly that the law has begun to require<br />
landowners to take these effects into account.<br />
It is well established that in many areas tree cover will reduce the flow of water off sloping land,<br />
reducing erosion and the risk of floods downstream (e.g. Jackson et al. 2008; Marshall et al. 2009).<br />
For many decades, regional councils have been grappling with the management of floods in lowlying<br />
lands, and more recently they have sought ways to equitably allocate the costs of maintaining<br />
flood banks and other elements of flood protection schemes.<br />
Before human settlement, the low-lying parts of the Hauraki Plains were an estuarine swamp, very<br />
prone to both flooding and tidal incursions from the sea. The plains were gradually drained to<br />
produce farmland, but drainage and flooding problems remained 73 . A flood protection scheme was<br />
established, but maintenance costs were increasing, more land was becoming intensively farmed<br />
and the government subsidies were abolished in 1989, so another rating base was needed.<br />
After several years of study and consultation, Waikato Regional Council decided in 1999 to<br />
rate the various landowners in the catchment area differentially, with farmers on low-lying land<br />
paying the most because they benefited most, but the hill farmers whose land use decisions were<br />
affecting how much flood protection work was needed also contributing, albeit at a lower level. By<br />
contrast, landowners whose land was in an undeveloped state and/or reverted to native bush or<br />
swamp cover and/or planted in exotic forest, i.e. who, by their land use decisions, generated less<br />
requirement for flood protection work downstream, received a rebate.<br />
Some hill farmers saw this as unfair and strongly objected, seeing it as a tax to manage a scheme<br />
from which they did not benefit—and did not accept that what they did on their land was anyone<br />
else’s business. The objectors quickly dubbed the tax ‘a rainfall tax’ (MacLeod 1999) 74 and swore<br />
to fight it. The landowners took the case to the High Court in 2001, where they lost; and then to<br />
the Court of Appeal in 2002, where they lost again, with the judge concluding that their current<br />
use of the land (i.e. as pasture, rather than swamp or forest) materially contributed to the need<br />
for the downstream flood protection work. He also concluded that they did receive some benefit,<br />
as without an effective downstream flood protection scheme, landowners were likely to be legally<br />
constrained in what they could do with their land in the future. 75<br />
Following the success of this approach in achieving legal recognition of the impact of land use<br />
decisions on the level of ecosystems services received by others and a growing recognition of<br />
the need to internalise externalities, a number of other regional councils have adopted a similar<br />
approach.<br />
73<br />
Judgement of the Court of Appeal of New Zealand, delivered by J. Tipping, 10 July 2002.<br />
74<br />
www.scoop.co.nz/stories/BU0003/S00024/farmers-fighting-fund-backs-piako-farmers.htm; www.scoop.co.nz/stories/BU0207/<br />
S00077/piako-rating-dispute.htm<br />
75<br />
Judgement of the Court of Appeal of New Zealand, delivered by J. Tipping, 10 July 2002.<br />
56 The nature of wellbeing
damage during flood events (DOC 2007). A study in Illinois found that for each additional 1% of<br />
catchment area that was in wetlands, peak flows decreased on average by 3.7% and the amount<br />
of water available during low-flow periods (defined as flows that are exceeded 95% of the time)<br />
increased by 7.9% (Demissie & Khan 1993). Mitsch & Gosselink (2000) suggested that 3–7% of<br />
temperate-zone watersheds should be in wetlands to provide adequate flood control and water<br />
quality values for the landscape.<br />
Healthy wetlands, lakes and rivers also provide important services, not only through their ‘arterial’<br />
function of transporting and storing freshwaters, but also by acting as ’catchment kidneys’ that<br />
purify the water that passes through them (Davies-Colley 2013; Schallenberg et al. 2013). This ‘selfpurification’<br />
regulating service relies on a variety of physical, chemical and biological processes<br />
that operate to different extents depending on the contaminant and water body characteristics.<br />
Wetlands are important sites for water purification via the attenuation of sediment (via settling<br />
and surface attachment), pathogens (mainly by settling and UV inactivation) and nitrogen<br />
(mainly by denitrification) due to their quiescent flow conditions, large plant surface areas and<br />
aerobic-anaerobic interfaces in their carbon-rich sediments (Mitsch 1992; Tanner et al. 2005;<br />
McKergow et al. 2007). Wetlands with more oxic sediments can retain phosphorus efficiently but<br />
have a lower ability to remove nitrogen (Wilcock et al. 2012). New Zealand wetlands range in size<br />
from small fens and swamps at the head of many small streams to the 7000-ha Whangamarino<br />
swamp alongside the Waikato River (Johnson & Gerbeaux 2004). These services are most useful<br />
in lowland environments, where contaminant loads from agricultural and urban land uses are<br />
greater than in forests and uplands. Natural seepage wetlands, which occupy 1% of the catchment<br />
area from which livestock are excluded, are expected to reduce influent suspended solids by 60%,<br />
nitrogen by 50–75% and phosphorus by c. 10% (McKergow et al. 2007). Wetlands constructed<br />
in agricultural drainage systems (often replacing natural wetlands that have been drained<br />
previously) can achieve similar removals—their construction costs (c. $550/ha of catchment<br />
drained at 1% wetland area installed; McKergow et al. 2007) indicate the value of the regulating<br />
ecosystem services provided by natural systems.<br />
Lakes sequester inflows of sediment and nutrients through similar processes to wetlands, as<br />
well as via zooplankton and mussels, which filter-feed on algae and fine particles (including<br />
pathogens) in the water column, and produce relatively dense faecal pellets that tend to sink<br />
to the lake bed (Schallenberg et al. 2013). For example, oligotrophic Lake Brunner (Moana)<br />
removes 47% of the inflowing phosphorus load (by sedimentation) and 20% of the nitrogen load<br />
(by sedimentation and denitrification) (Verburg et al. 2013). However, overloading lake systems<br />
can result in release of some of the sequestered phosphorus (akin to kidney failure). This occurs<br />
when the decomposition of algae produced in the lake surface waters (the epilimnion) consumes<br />
the oxygen in the bottom waters (hypolimnion) during seasonal lake stratification, resulting<br />
in a change in sediment redox conditions and the release of phosphorus that was previously<br />
bound to cations (mainly iron and manganese) in the lake sediment. The resultant ‘internal<br />
load’ of phosphorus can greatly exceed the annual catchment inputs. A ‘vicious cycle’ can thus<br />
be triggered, whereby the increased lake phosphorus results in increased primary production<br />
(sometimes as nuisance cyanobacteria), which drives further deoxygenation in the bottom water<br />
and hence further release of phosphorus from the sediment.<br />
High sediment and/or nutrient loading (often resulting from land-use change and pastoral<br />
development) and invasive ‘oxygen weeds’ and pest fish can also cause shallow lakes to ‘flip’ from<br />
a natural clear water state with abundant rooted aquatic plants (which sequester nutrients and<br />
stabilise the sediments) to a devegetated turbid state (Schallenberg & Sorrell 2009). Schallenberg<br />
et al (2013: table 9) used a case study of lake flipping at Lake Omapere to demonstrate the<br />
associated loss or reduction of ecosystem services, including provisioning (e.g. domestic and<br />
rural water supply, and sustainable eel and shellfish harvest), supporting/regulating (e.g. water<br />
filtering, phosphorus sequestration and indigenous biodiversity) and cultural (e.g. spiritual<br />
wellbeing and ecotourism) services (Schallenberg et al. 2013). Such flipping (or regime shift) has<br />
The nature of wellbeing<br />
57
occurred in many of our lowland lakes, emphasising the need to manage freshwater ecosystems<br />
within their resilience capacity to retain their regulating services.<br />
Although rivers are often largely considered as transporters of materials through catchments,<br />
they also contribute to regulating the timing, nature and quantity of downstream materials<br />
being transported, with headwater streams being particularly important (Peterson et al. 2001;<br />
Alexander et al. 2007; Quinn et al. 2007). Organic and inorganic particles are removed from<br />
the water via sedimentation processes and particle filtration, resulting from flow exchange<br />
between the river water column and riverbed, and active uptake by filter-feeding invertebrates<br />
(such as net spinning caddisflies and mussels), all of which improve downstream water clarity<br />
(Packman & MacKay 2003). Similarly, rooted plants, algae and microbes on riverbeds filter and<br />
process particulates from the surface flow (Tank et al. 2010), assimilate dissolved nutrients into<br />
plant and microbial biomass (supporting the river food web) (Mulholland & Webster 2010), and<br />
may also remove nitrogen by denitrification (Mulholland et al. 2008). Rapid instream uptake of<br />
nitrogen and phosphorus can occur in gravel-bed rivers such as the Tukituki River, where high<br />
concentrations of nitrogen and phosphorus resulting from inputs of agriculturally enriched<br />
groundwaters and treated sewage are reduced to near zero levels 30–60 km downstream of the<br />
inputs during summer low-flow periods (John Quinn and colleagues, NIWA, unpubl. data). As<br />
with lakes, there are limits to the ability of rivers to cope with increasing sediment and nutrient<br />
loads without clogging the filtering mechanisms (Packman & MacKay 2003), overwhelming the<br />
assimilative mechanisms (Mulholland et al. 2008) or producing nuisance growths that degrade<br />
other ecosystem services (e.g. periphyton blooms that inhibit angling, reduce biodiversity values,<br />
clog water supply intakes and degrade aesthetics). The low sediment and nutrient loadings that<br />
are typical of conservation lands (Larned et al. 2004) favour the maintenance of these regulating<br />
(self-purification) services of streams, rivers and wetlands, further enhancing the quality of water<br />
delivered to the lowlands and coast.<br />
The riparian zones of streams and rivers exert a disproportionate influence on the regulating and<br />
cultural ecosystem services of rivers relative to the land they occupy within the catchment, due<br />
to their location at the land-water interface and their physical/biogeochemical characteristics<br />
(Gregory et al. 1991; Quinn et al. 1993). The types of riparian zone services that can be enhanced<br />
through management vary within and between catchments depending on the dominant hydrological<br />
flow paths; natural vegetation patterns; river and landforms; and stream size. The Riparian<br />
Management Classification (Quinn et al. 2001; Quinn 2009) was developed to match different<br />
riparian management approaches with the different potential riparian services. Land managers<br />
can then use this information to make the trade-offs between riparian regulating and cultural<br />
services that can be required in developed catchments in a way that optimises aquatic benefits.<br />
For example, in agricultural and urban catchments, riparian management may involve trade-offs<br />
between the negative effects of riparian forest on in-stream nutrient attenuation if shade exceeds<br />
c. 50% (Matheson et al. 2012) and the enhanced biodiversity benefits of riparian forest through<br />
increased in-stream food resource and habitat diversity as a result of inputs of biota, leaf litter and<br />
wood (Scarsbrook et al. 2001; Meleason et al. 2005); increased stream bank stability (Williamson<br />
et al. 1992); increased cover habitat for fish (Rowe et al. 2002; Jowett et al. 2009); and reduced<br />
temperatures (Quinn et al. 2000; Quinn 2009). Such trade-offs are uncommon in conservation<br />
lands where nutrient inputs are typically low and healthy riparian systems are the norm.<br />
Waste materials and pollutants that end up in our estuaries and along our coastlines are often<br />
transformed, detoxified, buried and sequestered by the actions of marine organisms. Bacteria<br />
in sediments are involved in the detoxification of contaminants, such as the heavy metals and<br />
hydrocarbons that run off our roads and into our harbours (Jaysankar et al. 2008) and organic<br />
wastes are broken down through a combination of plant, animal and microbial activity. However,<br />
since the breakdown of wastes is biotically mediated, the delivery of this service delivery can fail<br />
catastrophically when the assimilative capacity of the ecosystem is exceeded. As a consequence,<br />
our attention may only be drawn to these services after we lose them, with life continuing on as<br />
58 The nature of wellbeing
usual until such a time. The vegetation and organisms in these environments can also affect the<br />
physical stability of their environment. The fringing vegetation of estuaries, such as saltmarshes,<br />
mangroves and coastal scrub, can stabilise sediment, and retain water (like a sponge) and control<br />
its release. Vegetation and biota also protect the shoreline during storms, by dissipating wave<br />
and tidal energy, and reducing the impacts of tidal surges and storm events both on the shoreline<br />
and in adjacent properties.<br />
3.2.2 Gas and climate regulation<br />
Carbon storage in the oceans and forests<br />
The oceans play a large role in regulating our climate, acting as huge heat buffers, and<br />
facilitating the exchange of gases between the water, sediments and atmosphere. Blue carbon<br />
sequestration (carbon that is captured and locked away by the world’s oceans and coastal<br />
ecosystems) is an important service that is working against the elevated rate of climate change<br />
as a result of anthropogenic emissions (Nellemann et al. 2009). Approximately one-third of<br />
the carbon dioxide released into the atmosphere from human activity has been absorbed by<br />
the oceans (Sabine et al. 2004). The coasts are extremely important in processing carbon and,<br />
despite the fact that bays, estuaries, lagoons, banks and continental shelves only cover 7–8% of<br />
global ocean surface, they contribute 10–30% of the world’s marine primary production (Jahnke<br />
et al. 2003). Photosynthesis removes Carbon dioxide and converts it into organic material that<br />
can be consumed, exported or buried, producing oxygen as a byproduct. On a global scale,<br />
there is significant variation between different coastal regions, and, in general, temperate and<br />
high-latitude waters act as carbon sinks, and low-latitude waters act as carbon sources to the<br />
atmosphere (Borges et al. 2005; Cai 2011). Low-latitude coastal oceans do not play such a strong<br />
role in carbon dioxide uptake because they receive two-thirds of the terrestrial input of organic<br />
carbon. Anthropogenic increases in carbon dioxide have changed the strength of this global<br />
pattern, however, leading to more dissolved inorganic carbon being exported off the continental<br />
shelf to the open ocean (Cai 2011). These patterns are important when considering the land-toocean<br />
movement of carbon through streams to estuaries to the coastal ocean, which need to be<br />
better resolved in global carbon dioxide budgets (Regnier et al. 2013). The long-term burial of<br />
carbon can occur when plant material is stored in coastal sediments associated with saltmarsh,<br />
mangrove forests or seagrass meadows, or when plants or animals sink to the deep sea. Vegetated<br />
coastal habitats are estimated to contribute half of the total carbon sequestration in ocean<br />
sediments, despite covering less than 2% of the ocean surface (Lafoley & Grimsditch 2009), with<br />
85% of organic carbon and 45% of inorganic carbon being buried in coastal sediments (Gattuso<br />
et al. 1998; Wollast 1998; Chen et al. 2003; Mackenzie et al. 2005). The roles of species in carbon<br />
storage can be complex. For example, on the west coast of the USA, the indirect effect of sea<br />
otters reducing urchin abundance and concomitantly facilitating the expansion of kelp forests<br />
was estimated to contribute a 4.4–8.7 teragram increase in carbon storage over 5 million hectares,<br />
with a value of US$205–408 million on the European carbon exchange (Wilmers et al. 2012).<br />
On land, all vegetation (and soil) sequesters carbon, but trees generally sequester more than<br />
other plant forms. Sequestration rates of trees and other forms of vegetation vary by species,<br />
climate, soils and management method. For example, in New Zealand, it is estimated that<br />
ungrazed pasture sequesters 11 tons CO 2 /ha (Ford-Robertson et al. 1999); radiata pine (Pinus<br />
radiata) forests sequester anywhere from 411 to 918 tons CO 2 /ha (MacLaren 1996b; Ford-<br />
Robertson et al. 1999; Robertson et al. 2004); indigenous woody scrub sequesters anywhere from<br />
238 (standing biomass, not including soil carbon) to 598 tons CO 2 /ha (Scott et al. 2000; Coomes<br />
et al. 2002); and indigenous forest sequesters from 938 to 1290 tons CO 2 /ha (neither estimate<br />
includes soil carbon) (Tate et al. 1997; Coomes et al. 2002). Both indigenous and exotic vegetation<br />
play important roles in sequestering carbon (MPI 2013)—for example, exotic forests (largely Pinus<br />
radiata) sequester an estimated 18–25 million tonnes of carbon dioxide from the atmosphere<br />
each year (MfE 2012; Forest Owners Association 2013; MPI 2013). However, harvesting trees<br />
The nature of wellbeing<br />
59
eleases most of the sequestered carbon back to the atmosphere, on a time-scale that depends on<br />
the end-use of the wood—e.g. very quickly for biofuels or paper, or over tens or even hundreds of<br />
years for furniture or house framing. Therefore, the net amount of sequestration happening each<br />
year depends on the balance of afforestation, deforestation, harvesting and growth, and the mix<br />
of end-uses, which are all driven by a complex set of factors, including market conditions (Nebel<br />
& Drysdale 2010). It should also be noted that since landscape or forest maintenance activities<br />
that rely on fossil fuel use reduce the net sequestration of vegetation (Falk 1976; Hyun-Kil &<br />
McPherson 1995), indigenous vegetation that does not rely on these regimes (or that relies on<br />
less) is superior in terms of sequestration.<br />
In terms of the carbon stored above ground in vegetation in New Zealand, 80% is stored in<br />
indigenous forest and scrub which is found on less that 26% of the land area, and only about 5% is<br />
stored in planted forests (Tate et al. 1997; Ausseil et al. 2013). Native beech forests have a pivotal<br />
role as a mass biomass carbon stock, especially in the South Island (Ausseil et al. 2013), and since<br />
most of these forests are managed by the Department of Conservation, these important carbon<br />
stores are currently protected.<br />
Regulating mesoclimate and microclimate<br />
Climate is described by air temperature, wind speed, humidity, precipitation, and the amount of<br />
solar and terrestrial radiation that is experienced by people. It determines the thermal comfort<br />
of people and is therefore of vital importance to human wellbeing. Climatic variables are<br />
described and can be manipulated through design and planning at different spatial scales within<br />
the landscape, from the macro- through meso- (tens to hundreds of kilometres) to the micro-<br />
(centimetres to hundreds of centimetres) scale. The meso- and micro-climate scales tend to be<br />
the most important spatial scales for determining human health and thermal comfort. We mainly<br />
attempt to maximise our comfort at these scales via built structures, but recognising and working<br />
with the contributions made by natural elements, such as vegetation, water bodies, sun and wind,<br />
can make our task much easier.<br />
In terms of human health effects, the urban poor and the elderly are particularly vulnerable to<br />
uncomfortable microclimates. The human body needs to stay within a few degrees of an average<br />
temperature of around 37°C, or it will become uncomfortable. At a body temperature of around<br />
36–35°C, humans will get hypothermia, and at around 40°C, they will get hyperthermia—both<br />
of which can lead to death. The elderly are less able to regulate their body temperatures and<br />
detect unhealthy changes in their body temperatures than young people (Lipsky 1984; Anderson<br />
et al. 1996), and many elderly and poor live in older homes that are poorly insulated (Howden-<br />
Chapman et al. 1999) (insulation standards were first introduced nationally in 1978; McChesney<br />
et al. 2008). As a result, despite New Zealand’s moderate climate, it has a higher winter cold<br />
stress mortality rate than many countries with much colder climates (Isaacs & Donn 1993). The<br />
elderly are particularly affected by this cold stress in winter—86.6% of deaths from hypothermiarelated<br />
illnesses in New Zealand occur in those over 65 (Taylor et al. 1994)—and by heat stress<br />
in summer. Consequently, the number of New Zealand people affected by poor microclimates is<br />
expected to increase as the number of people over 60 increases from 15.4% of the New Zealand<br />
population in 1996 to a projected 25.3% in 2030 (Howden-Chapman et al. 1999).<br />
Micro- and mesoclimates also significantly affect how much people enjoy indoor and outdoor<br />
activities. People will not enjoy an activity or stay in a place if they are too cold or hot, or if their<br />
bodies are generally uncomfortable—and this may have significant financial repercussions for<br />
businesses whose services rely on a comfortable climate. For example, the incomes of some<br />
restaurants depend on how long they can keep an outdoor patio open for during a season—the<br />
more that thermal comfort can be assured, the longer the patio can remain open. Similarly,<br />
energy use and, therefore, the rate of climate change are affected by micro- and mesoclimates.<br />
For example, building designs and locations that ignore climatic variables such as orientation<br />
to solar radiation and winds (particularly when combined with poor insulation) will use more<br />
60 The nature of wellbeing
energy in heating or cooling (Akbari et al. 2001). Similarly, landscape architecture that ignores<br />
climatic variables can lead to low human thermal comfort in external environments. Under<br />
these conditions, people are more likely to enter adjacent buildings and turn on heating or air<br />
conditioning to improve their thermal comfort, which increases the cost of our heating and<br />
cooling systems, as well as greenhouse gases in the atmosphere, accelerating climate change<br />
(Brown 2010). At the micro-scale, vegetation (especially trees), water, structures, materials, and<br />
the correct siting of living areas and buildings can significantly mitigate the microclimate,<br />
ensuring maximum thermal comfort for people both outside and within buildings (Brown 2010).<br />
In summer, temperatures tend to be higher in cities (e.g. c. 2.5°C warmer in a typical US city)<br />
than in nearby rural areas due to the larger area of hard and dark surfaces absorbing more heat<br />
than vegetated areas (Akbari et al. 2001). The air temperature reduction effect of vegetation<br />
(through evapotranspiration and shading) can have both direct health effects, e.g. by reducing<br />
hyperthermia, and indirect health effects through its impact on pollution. Volatile organic<br />
compounds require temperatures of > 20°C (Akbari et al. 2001), so lower air temperatures can<br />
reduce the amount of time during which harmful ozone smog is produced. Health problems<br />
resulting from pollution are often attributable to or aggravated by the higher temperatures within<br />
cities (Escobedo & Nowak 2009), and cost New Zealand communities in terms of lost work days,<br />
reduced productivity and increased medical bills.<br />
At the meso-scale, landforms and bodies of water can either improve or reduce human thermal<br />
comfort in adjacent communities. For example, cooler and denser air drains down the slopes of<br />
the Port Hills and the Southern Alps/Kā Tiritiri o te Moana into Christchurch, which sometimes<br />
reduces the thermal comfort of those living in this city during winter. However, the Southern<br />
Alps/Kā Tiritiri o te Moana also affect air temperatures and flows, funnelling the hot, dry<br />
nor’wester winds into Christchurch. These winds can increase temperatures by 10–15°C within a<br />
few hours, increasing human thermal comfort (Watts 1947). Vegetation, particularly large patches,<br />
can also block, redirect or funnel wind, and cool down or heat up urban landscapes. For example,<br />
Slater (2010) found that vegetated parks in Ontario were up to 6°C cooler than the surrounding<br />
urban landscape and this cooling effect was felt up to 100 m from park boundaries.<br />
3.2.3 Diversity, resilience and insurance<br />
Resilience is defined as the capacity of a system—be it a forest, city or economy—to deal with<br />
change and to continue to develop, not only withstanding shocks and disturbances (such as<br />
climate change or financial crisis), but also using such events to catalyse renewal and innovation<br />
(Stockholm Resilience Centre 2011). While we are all familiar with the general concept of<br />
resilience in terms of our own health or our economy, there is less understanding of how this<br />
applies to our ecosystems; and how ecosystem resilience is then linked to our economy and wider<br />
society is even less well understood.<br />
Resilience in an ecosystem reflects its ability to withstand or recover from disturbances<br />
(Gunderson 2000; Carpenter et al. 2001; Suding et al. 2004; Cumming et al. 2005; Walker &<br />
Salt 2006), including storm events, pollution, climate change, fragmentation, invasions and<br />
extinctions. As these and other pressures increase, resilience decreases, and this can lead to<br />
negative impacts on ecosystem services, ranging from slower recovery times to more severe<br />
unwanted consequences.<br />
Human wellbeing is maintained, or less severely impacted, if ecosystems are able to absorb<br />
natural and human pressures when disturbed (dampening and preventing environmental<br />
disturbance), or recover quickly to their pre-disturbed state. The speed of recovery is important<br />
for the maintenance and delivery of all other ecosystem services; and the identity, diversity and<br />
spatial extent of species play an important role in an ecosystem’s ability to absorb and recover.<br />
For example, vegetation that fringes rivers, lakes and the coast can play an important role in<br />
dampening disturbance by retaining water (like a sponge) and controlling its release, and coastal<br />
vegetation and fauna can dissipate wave and tidal energy, reducing the impacts of tidal surges<br />
and storm events on the shoreline, thus diminishing coastal erosion and serving to protect<br />
The nature of wellbeing<br />
61
coastal housing and property. The particular species and assemblages that do this are those<br />
that form and affect surface topography, such as mangroves, seagrass communities (Fonseca &<br />
Cahallan 1992), saltmarshes (Brampton 1992; Morris et al. 2004), and mussel and oyster reefs, as<br />
well as the macrofauna and microphytobenthos that stabilise intertidal and beach sediments.<br />
Species can also help to make an ecosystem more resistant to disturbance. For example,<br />
the burrowing urchin Echinocardium cordatum is able to reduce community change and<br />
colonisation by non-indigenous species in estuarine sediments by rapidly turning the sediments<br />
over (Lohrer et al. 2008).<br />
At the more severe end of the scale, studies on lakes, coral reefs, oceans, forests and arid lands<br />
suggest that the loss of resilience that results from gradual pressures (e.g. nutrient loading,<br />
habitat fragmentation, biotic exploitation) (Scheffer et al. 2001) may eventually lead to sudden<br />
drastic and sometimes irreversible changes (Carpenter et al. 2006). If such a threshold or tipping<br />
point is crossed, then an ecosystem can shift from one state of equilibrium to another—termed a<br />
‘regime shift’ (Gunderson 2000; Scheffer et al. 2001).<br />
Regime shifts in lakes provide an example of how human actions have induced major changes to<br />
ecosystems and the services they provide (e.g. see Scheffer et al. 1993; Postel & Carpenter 1997;<br />
Rocha et al. 2013). Eutrophication is the process by which nutrient enrichment of water bodies<br />
(such as from nitrogen and phosphorus fertilisers) leads to a proliferation of aquatic plant life,<br />
which reduces dissolved oxygen content in the water, and causes the decline of other aquatic<br />
organisms and overall water quality. This shift to a depleted and turbid state translates into a<br />
loss of ecosystem services, such as recreation, drinking water and fisheries, and can take many<br />
decades to reverse (Gordon et al. 2008). In fact, experiments in the marine environment have<br />
shown that declining diversity can lead to increased rates of resource collapse, and exponential<br />
decreases in recovery potential, stability and water quality (Worm et al. 2006). Other examples<br />
of systems that have undergone hard-to-reverse regime shifts include the collapse of pelagic<br />
fisheries, and the salinisation, soil degradation and desertification of dry-land agricultural areas<br />
(Carpenter et al. 2006).<br />
It is difficult to predict where these tipping points are and when they will occur. Once an<br />
ecosystem has moved to a new state of equilibrium, it can be very hard, or even impossible,<br />
to reverse it (Scheffer & Carpenter 2003; Carpenter et al. 2006; Norton 2009). Such outcomes<br />
generally lead to low-integrity ecosystems, which may also be poor in biodiversity, vulnerable to<br />
change and generate fewer ecosystem services to human societies (Stockholm Resilience Centre<br />
2011). They represent significant losses of natural capital.<br />
Investment in resilience, through biodiversity conservation, can be considered a form of<br />
insurance against future change or shocks. Indeed, this is, the approach used by traditional<br />
farmers, who plant diverse crops to decrease the chance of crop failure rather than to maximise<br />
productivity (Chapin et al. 2000). The insurance value provided by biodiversity conservation is<br />
hard to estimate due to our limited knowledge (Pascual et al. 2010) and because it only shows<br />
its full worth when things go wrong. However, industry is becoming increasingly aware of the<br />
financial risk that environmental degradation and the loss of ecosystem services pose, as well as<br />
its impact on insurance premiums (UNEP Finance Inititative 2008). This is exemplified by the<br />
losses resulting from increasing severe weather events driven by climate change. In fact, it has<br />
been suggested that in some situations, investing in biodiversity protection can be an alternative<br />
to paying larger financial insurance premiums (Baumgartner 2007).<br />
Since we rarely know which species are critical to ecosystem functions, processes and resilience,<br />
it is essential that we take a broad approach to conservation (Chapin et al. 2000). Even seemingly<br />
unimportant (i.e. functionally redundant) and currently rare species offer insurance against<br />
environmental change (Chapin et al. 2000). In essence, biological diversity is necessary to retain<br />
a resilient and acceptable level of ecosystem services in the long term (MEA 2005a).<br />
62 The nature of wellbeing
3.2.4 Habitat structure and ecological community services<br />
The biological and physical structure of an ecosystem can have a sugnificant impact on the<br />
ecosystem services it provides. For example, organisms that live on the seafloor create habitat<br />
that is essential for the provision of many goods and services, including nursery grounds for<br />
juvenile organisms, refugia for prey to avoid predators and permanent living spaces for many<br />
species. There are many examples of organisms that are architects of their own habitat, including<br />
coral reefs, kelp forests and reefs of filter-feeding bivalves (e.g. oysters and mussels). Less well<br />
known but also important are deep-sea sponges, gorgonians and corals, all of which can be<br />
extremely old and in some cases form deep-water communities that tower more than 40 m above<br />
the seafloor; and the smaller-scale tube mats and many types of foraminifera gardens (Thrush<br />
& Dayton 2002, 2010; Levin & Dayton 2009). Species survival can be dependent on the role that<br />
other organisms play. For example, many seabirds rely on subsurface predators, such as tuna and<br />
dolphins, to drive prey fish species towards surface waters where they can be caught (Hebshi<br />
et al. 2008). Healthy ecosystems contain a ‘genetic library’ of species (de Groot et al. 2002),<br />
which maintains genetic diversity and ensures that communities contain the broadest possible<br />
functional diversity—which may prove critical in responding to environmental change. Habitatforming<br />
species can be easily and extensively damaged by human disturbances, such as trawling<br />
or dredging by fisheries.<br />
3.2.5 Medicine<br />
Plants and microorganisms are also extremely important sources of medicines. Eighty percent<br />
of the world’s population relies upon traditional medicines, 85% of which are derived from<br />
plant extracts. As a result, many indigenous and local communities are immense reservoirs of<br />
traditional knowledge that can benefit biotechnology, agriculture, pharmaceutical development<br />
and health care (Robertson 2008). Rongoā—the traditional medicinal practices of Māori, which<br />
are undergoing something of a modern resurgence—make extensive use of a range of native<br />
plants, including kūmarahou Pomaderris kumeraho , kawakawa, mānuka, kōwhai, rātā and<br />
harakeke (Jones 2012). In the commercial world, 118 of the top 150 prescription drugs used in<br />
the USA originate from natural sources: 74% from plants, 18% from fungi, 5% from bacteria and<br />
3% from a species of snake. Furthermore, nine of the top ten drugs originate from natural plant<br />
products (Ecological Society of America 1997; Robertson 2008) 76 .<br />
Many of the active ingredients in medicines come from land plants. However, chemicals extracted<br />
from estuarine-dependent species are also being used in pharmaceuticals, nutraceuticals and<br />
pest control (Sipkema et al. 2005). New Zealand bio-based compounds that are currently being<br />
tested for their pharmaceutical potential include agar, kelp powder, chitin, fish oil, calcium powder,<br />
fucoidin sulphate, green-lipped mussel (Perna canalicula) extract and collagen (Munro et al.<br />
1999; Page et al. 2005). Mānuka honey is also valued for its anti-bacterial properties and its export<br />
from New Zealand is thought to be worth $120 million annually (Bayer 2013). Some of the highest<br />
quality mānuka honey comes from the Gisborne region, where extensive mānuka scrub and<br />
shrublands also proved valuable ecosystem services in carbon sequestration and erosion control.<br />
3.2.6 Air filtration<br />
Trees and forests play an important role in cleansing the air of contaminants. This not only<br />
improves our health, but also reduces damage to structures and materials caused by primary and<br />
secondary air pollution (Gillespie & Brown 2007).<br />
Urban land uses tend to generate primary pollutants (emitted directly into the air), such as<br />
sulphur and nitrogen oxides, carbon monoxide, carbon dioxide, methane and particulates,<br />
through burning fossil fuels, burying waste in landfills and various industrial processes. Urban<br />
land uses also generate secondary pollution, such as ground-level ozone, which is produced when<br />
nitrogen oxides and hydrocarbons react together in sunlight at temperatures > 20°C (Gillespie &<br />
76<br />
www.esa.org/ecoservices/comm/body.comm.fact.ecos.html<br />
The nature of wellbeing<br />
63
Brown 2007). Pollutant concentrations within cities increase with proximity to their source (e.g. a<br />
factory or a highway); however, since the entire areas of our cities often emit pollution, they are<br />
often area rather than point sources of pollution. Secondary sources of pollution are generally<br />
found at highest concentrations downwind from cities because they take time to form and shift<br />
with the wind from their sources. Therefore, vegetation that is strategically placed downwind of<br />
cities can filter significant amounts of pollutants from the air (Gillespie & Brown 2007).<br />
Vegetation filters pollution from the air, and traps particulates on leaves and branches. Plants<br />
take up nitrogen dioxide (NO 2 , the precursor to ground-level ozone) and ground-level ozone<br />
(although some vegetation will be damaged by the ozone). The filtering capacity of vegetation<br />
increases with leaf area, so is generally higher for trees than shrubs or grasslands (Litschke &<br />
Kuttler 2008); and consequently, forests are particularly effective in filtering the air relative to<br />
other natural land cover classes because they have a large area of leaves and branches, and cause<br />
the highest air turbulence, frictional drag and therefore rate of exchange between the air and<br />
the vegetation (Litschke & Kuttler 2008). Air pollution removal by trees in 14 cities in the USA<br />
ranged from 19 to > 1500 tonnes per year (Dwyer et al. 2000).<br />
Evergreen trees (like many New Zealand natives) provide greater ecosystem services than<br />
deciduous trees (many of which are introduced) because they remove pollutants throughout the<br />
year, whereas most deciduous trees cease these functions after leaf drop, which often occurs at<br />
the time of year when most pollutants are emitted (Cavanagh 2008). Trees with complex stem<br />
structures (through which some filtration also occurs) and fine leaves (e.g. coniferous trees) are<br />
considered particularly beneficial because of the high total surface area of needles available<br />
to trap particulate matter (Gillespie & Brown 2007). However, many coniferous trees are more<br />
sensitive to pollution and have other properties (e.g. dense shading and low, dense canopies)<br />
that restrict their use in many urban settings. Furthermore, deciduous trees absorb gases more<br />
effectively than coniferous trees (Litschke & Kuttler 2008). Consequently, Bolund & Hunhammar<br />
(1999) recommended that a mixed forest would best perform this regulatory function within cities.<br />
Cavanagh & Clemons (2006) and Cavanagh (2008) estimated the benefits produced by the<br />
presence of urban trees in Auckland and Christchurch, respectively. In Auckland, it was<br />
estimated that the city’s trees annually removed 1230 tonnes of nitrogen dioxide, 1990 tonnes<br />
of ozone and 1320 tonnes of particulate matter (Cavanagh & Clemons 2006). In cities like<br />
Christchurch, the pollutant removal function of the urban forest is particularly important in<br />
winter, when a temperature inversion traps polluted air where people live 77 . Cavanagh (2008)<br />
estimated that Christchurch urban trees removed 300 tonnes of pollutants, including 150 tonnes<br />
of PM10 (see Box 4 for explanation of PM10), the latter being equivalent to 4.5% of the estimated<br />
particulate emissions in 2002. Using estimates developed by Watkiss (2002) and Booz et al.<br />
(2005) (both cited in Cavanagh 2008) for the cost of generalised air pollution, including health<br />
effects (e.g. premature deaths and hospital admissions associated with air pollution) and nonhealth<br />
effects (e.g. damage to buildings from air pollution, decreased crop yields, increased<br />
acidity and nutrients in soils, and some aesthetic impacts, such as decreased visibility), Cavanagh<br />
(2008) concluded that the value of the urban trees in Christchurch was $19.6 million, of which<br />
$19.2 million was the value of the PM10 removal, largely because of the significant health benefits<br />
of reduced exposure to particulate matter. Vesley (2009) used a similar technique to estimate the<br />
benefit value at maturity of the plantings in Project Twin Streams in Waitakere (discussed further<br />
in Section 3.5, Box 11) at $1.8–4.0 million per annum as a result of improvements in air quality.<br />
77<br />
Christchurch often suffers from temperature inversions in winter when there is little or no wind and the sky is clear. In the<br />
evening and during the night, heat from the ground radiates into the atmosphere and cools to a lower temperature than the<br />
air above, and so becomes trapped along with the pollution by the warmer air. This inversion is reinforced by the location of<br />
the city, which sits below Banks Peninsula and the Southern Alps/Kā Tiritiri o te Moana. Cold air drains off these landforms,<br />
adding to the cold air over the city. In addition, Christchurch has a low density of buildings that generate and therefore radiate<br />
heat during the night.<br />
64 The nature of wellbeing
It should be noted, however, that some vegetation can also add to or increase our exposure to<br />
air pollution. For example, some plant species increase the amount of secondary pollution if<br />
planted in cities that are characterised by primary air pollution and so should be avoided in<br />
urban areas—for example, weeping willows (Salix × blanda) are very strong emitters of reactive<br />
hydrocarbons, which participate in the production of ozone smog. Other plant species produce<br />
pollen that can aggravate health conditions such as asthma. Vegetation (and landforms) can also<br />
block the flow of air, trapping pollutants within an area and therefore increasing human exposure<br />
to pollutants—vegetation or landforms that halve the wind speed will double the concentrations<br />
of pollutants (Gillespie & Brown 2007).<br />
Vegetation also reduces air temperature in cities (through evapotranspiration and shading),<br />
which in turn reduces the amount of time during which ozone smog is produced. Volatile organic<br />
compounds require temperatures of > 20°C (Akbari et al. 2001). In summer, temperatures tend<br />
to be higher in cities (e.g. c. 2.5°C warmer in a typical US city) than in nearby rural areas due<br />
to the larger area of hard and dark surfaces absorbing more heat than vegetated areas (Akbari<br />
et al. 2001). Health problems resulting from pollution are often attributable to or aggravated<br />
by the higher temperatures within cities (Escobedo & Nowak 2009), which cost New Zealand<br />
communities in terms of lost work days, reduced productivity and increased medical bills.<br />
3.2.7 Noise reduction<br />
Unpleasant or overly loud noise can have significant health effects, such as hearing impairment,<br />
hypertension, ischemic heart disease, birth defects and sleep disturbance (Passchier-Vermeer &<br />
Passchier 2000). It can also create stress, which can lead to aggressive and anti-social behaviour<br />
(Kryter 1994). Studies within cities have demonstrated that vehicles are the most significant<br />
environmental sources of damaging noise. For example, a study in the European Union estimated<br />
that noise had a social cost of £40 billion per year, with most of it emanating from passenger cars<br />
and trucks (Den Boer & Schroten 2007). Noise can also have negative impacts on wildlife that rely<br />
on sound to attract mates and establish territories (e.g. many song birds) (Adams 1994).<br />
Vegetation and landforms reduce noise levels within cities. The capacity of vegetation to reduce<br />
noise depends on the characteristics of the vegetation (foliage area, trunk and limb density, and<br />
ground impedance), the porosity of the soil (tilled soil is less effective than undisturbed soil as it<br />
contains more air pockets), characteristics of the noise (e.g. sound pressure, frequency, source or<br />
line, height of noise off the ground relative to the receptor), and the proximity of the receptor to<br />
the source of the noise (the closer the vegetation is to the source, the more effective it is) (Fang<br />
& Ling 2003). Dense shrubs that are taller than the person receiving the sound provide greater<br />
noise attenuation than lower vegetation, and noise attenuation of vegetation patches/belts also<br />
increases with their length and width (Fang & Ling 2003). Vegetation can also be effective in<br />
preserving/protecting the aesthetic experiences of heritage parks and other important public<br />
places from adjacent sources of noise (Kozlowski & Vass-Bowen 1997).<br />
There appear to have been no studies on noise reduction services provided by urban landforms<br />
and vegetation (indigenous or exotic) in New Zealand cities, although trees are commonly<br />
used as buffers between urban roads and residential areas (Meurk et al. 2013; Fig. 7). Public<br />
plantings such as these, as well as private residential plantings, can also have significant intrinsic<br />
biodiversity values (Meurk et al. 2013).<br />
3.2.8 Liquid and solid waste treatment, processing and storage<br />
We depend on indigenous ecosystem services (e.g. microorganisms, bacteria, plants, soil, water) to<br />
process our urban wastewater so that it does not poison us, give us diseases, kill our food sources<br />
(such as fish and shellfish) and generally degrade our ecosystem health. Our liquid wastewater<br />
is made up of domestic wastewater (liquid kitchen, laundry and bathroom waste), used oil, waste<br />
from industrial processes and stormwater—although most New Zealand municipalities have<br />
The nature of wellbeing<br />
65
Figure 7. A noise and air pollution buffer separating a residential property and the Queen Elizabeth II Expressway, northwest<br />
Christchurch. Photo: Colin Meurk.<br />
This is a 3-m-high earth embankment (main noise barrier) that has been planted with native species to muffle the noise<br />
and absorb particulate pollution. The native species planted include a range of broadleaved trees, as well as flax and<br />
Anemanthele (wind grass), and bring high biodiversity values into the depauperate Canterbury lowland environment.<br />
separate systems for managing stormwater. This waste is mostly water (99.9%), but also contains<br />
organic matter, inorganic ions (e.g. sulphide and chloride), toxins (mostly from industrial sources,<br />
but also from homes) and harmful bacteria (largely from human waste).<br />
Most of the wastewater of urban regions in New Zealand is processed centrally using one<br />
of the 336 municipal wastewater treatment plants—although some areas (generally smaller<br />
communities, e.g. with less than 50 residences) use on-site or decentralised wastewater systems.<br />
Physical, chemical and biological processes are used in wastewater plants to remove any<br />
contaminants before the water and solid waste are released back into the environment.<br />
Most municipal liquid waste management systems use largely artificial components (e.g. pipes,<br />
aeration and sedimentation tanks, sludge digesters, fixed growth reactors, and oxidation ponds)<br />
to process waste. However, even these systems rely on microorganisms (largely bacteria) to break<br />
down organic matter and to assist in deodorising the waste during this process. They also rely<br />
on indigenous ecosystem services to discharge the treated wastewater (e.g. 63 use rivers, streams<br />
or drains; 4 use wetlands; 6 use estuaries, 1 uses a lake; 9 use groundwater systems; 37 use either<br />
long or short outfall pipes to put the treated waste water in the ocean), and often use soil and<br />
the vegetation it carries (native or plantation forests, agricultural pasture or cropland) to further<br />
process solid waste and/or nutrients in wastewater. For example, Christchurch uses Bottle Lake<br />
forest as an end treatment of the solid waste byproduct of liquid waste. Some natural components<br />
are also created artificially (e.g. surface or subsurface flow artificial wetlands) to perform treatment<br />
functions.<br />
The amount of waste that is processed is substantial. For example, New Zealand releases<br />
1.5 billion litres of domestic wastewater (liquid kitchen, laundry and bathroom waste) to the<br />
environment each day 78 . Processing urban sewage is expensive, and any nutrients that remain<br />
after treatment still enter and pollute some of New Zealand’s aquatic ecosystems—particularly<br />
saltwater ecosystems (Ewel 1997). Ewel (1997) estimated that up to 96% of the nitrogen and 97% of<br />
the phosphorus in sewage can be retained in wetlands.<br />
Compared with the large, centralised wastewater treatment plants, a system of artificial wetlands,<br />
natural wetlands and/or land to process liquid waste (or as components of the treatment train)<br />
tends to be cheaper to run and easier to maintain (Gren 1995). The nutrients in the waste wan<br />
can also be used as fertiliser and irrigation for pasture or forests. However, these systems do not<br />
78<br />
www.mfe.govt.nz/publications/ser/enz07-dec07/html/chapter6-waste/page1.html<br />
66 The nature of wellbeing
function alone and must include primary and secondary treatment components; and they only<br />
work on certain slopes and soils. There is also concern that they may harm indigenous species<br />
and ecosystems that are not adapted to the liquid waste (Gren 1995).<br />
Nature carries out a similar waste treatment, processing and storage operation in estuarine and<br />
coastal systems, where waste material, including organic and inorganic pollutants, is removed<br />
through a combination of recycling, burial and storage.<br />
In coastal systems, the modification and removal of waste material is an extremely complex<br />
process (Gadd et al. 2010). Organisms affect the burial, resuspension, transportation, dilution,<br />
transformation into more or less toxic states, and biomagnification of toxic substances up the<br />
food chain (e.g. Townsend et al. 2009). Organic material such as sewage may be used as an<br />
energy source in macro- and microbial processes, and this overlaps with the nutrient recycling<br />
service (Oviatt et al. 1986, 1993). Bacteria in sediments are involved in detoxifying heavy metals<br />
and some species of shellfish sequester heavy metals, lowering toxicity to other organisms, but<br />
potentially raising the risk of exposure for humans and other predators.<br />
Many indigenous species dwelling in shallow, coastal soft sediments play important roles in<br />
the bioturbation and cycling of sediments, and consequently affect the levels of organic and<br />
inorganic contaminants. The mud crab Austrohelice crassa, which is a dominant species in upper<br />
estuarine areas, can turn over between 7% and 84% of the top 4 cm of sediment each month,<br />
depending on sediment type (Needham et al. 2010); the common cockle Austrovenus stutchburyi,<br />
when at a sufficient density, will accelerate sediment deposition and contaminant accumulation<br />
in the sediment through its ability to filter material from the water column (Gadd et al. 2010); and<br />
species such as Macomona liliana can affect sediment movement by significantly decreasing the<br />
sediment stability (Lelieveld et al. 2004).<br />
3.3 Affection<br />
Image licensed by Ingram Publishing.<br />
The need to give and receive affection within high-quality social relationships is a fundamental<br />
component of wellbeing. Baumeister & Leary (1995) noted that the ‘need to belong’ is a basic<br />
human motive, and numerous studies have indicated the important role that love, friendship and<br />
social relationships in general have on subjective wellbeing (e.g. Ryff 1995; Reis & Gable 2003;<br />
Diener & Diener McGavran 2008). Diener & Diener McGavran (2008) provided a useful summary<br />
of the connections between family relationships and wellbeing—from early infant attachment<br />
to a caregiver, through sibling and romantic relationships, including marriage, to the impacts of<br />
family relationships on wellbeing in old age.<br />
We did not find any evidence that ecosystem services directly impact on how loving our<br />
relationships are, but there is some evidence for the converse—that individuals who place<br />
importance on their relationships with others also place importance on their relationship with<br />
nature. A positive impact on loving relationships<br />
would also not be surprising given the welldocumented<br />
relaxing and restorative aspects of<br />
natural environments (Kaplan & Kaplan 1989). In<br />
such relatively stress-free environments, positive<br />
emotions and feelings are more likely to emerge<br />
than are negative emotions and feelings. In<br />
turn, positive emotions are known to undo the<br />
negative psychological and physiological effects<br />
of negative emotions (Fredrickson & Levenson<br />
1998), and are associated with enhanced<br />
cognitive skills, creative problem-solving<br />
processes and social behaviour (Isen 1987). In<br />
addition, positive emotions facilitate social<br />
The nature of wellbeing<br />
67
onds and associated ‘affection’ (Fredrickson 2001, 2003). Certainly, there is abundant anecdotal<br />
evidence that youthful shared experiences in natural environments can be the foundation of<br />
enduring lifelong friendships.<br />
An innate belief in the ‘healthiness’ of nature for people is an ancient human paradigm,<br />
stemming back at least to Greek philosophers, and more recently reasserted by the naturalist<br />
Edward Wilson, who, with others, articulated the ‘biophilia’ hypothesis (Kellert & Wilson 1993).<br />
This hypothesis suggests that there is an instinctive bond between human beings and other<br />
living systems, which would suggest that living nature is linked to the satisfaction of several of<br />
the human needs identified in Max-Neef’s (1991) analysis, as shown in the typology of values<br />
reflecting human biophilia (Table 4). For adults to develop a sense of place, they require direct<br />
contact with the natural aspects of their environment, including vegetation, soils, animals and<br />
people (Orr 1992), and many adults remember with affection natural or outdoor environments as<br />
the most significant places of their childhood (Sebba 1991; Henley 2010). Affection for particular<br />
places and for the sound and sight of the native species found there has been a key driver for a<br />
project to bring tūī (Prosthemadera novaeseelandiae) and bellbirds (Anthornis melanura) back to<br />
Hamilton City (see Box 9).<br />
Table 4. Typology of biophilia values reflecting the tendency of humans to affiliate with nature<br />
(Kellert 1993*).<br />
Term Definition Function<br />
Utilitarian Practical and material exploitation of nature Physical sustenance / security<br />
Naturalistic<br />
Ecologistic-scientific<br />
Satisfaction from direct experience/contact<br />
with nature<br />
Systematic study of structure, function and<br />
relationship in nature<br />
Curiosity, outdoor skills, mental/physical<br />
development<br />
Knowledge, understanding, observational<br />
skills<br />
Aesthetic Physical appeal and beauty of nature Inspiration, harmony, peace, security<br />
Symbolic<br />
Humanistic<br />
Moralistic<br />
Dominionistic<br />
Use of nature for metaphorical expression,<br />
language and expressive thought<br />
Strong affection, emotional attachment and<br />
’love’ for nature<br />
Strong affinity, spiritual reverence and ethical<br />
concern for nature<br />
Mastery, physical control and dominance of<br />
nature<br />
Communication, mental development<br />
Group bonding, sharing, cooperation,<br />
companionship<br />
Order and meaning in life, kinship and<br />
affiliation ties<br />
Mechanical skills, physical prowess, ability<br />
to subdue<br />
Negativistic Fear, aversion and alienation from nature Security, protection, safety<br />
* (From The Biophilia Hypothesis, edited by Stephen R. Kellert and Edward O. Wilson; http://islandpress.org/ip/books/book/<br />
islandpress/B/bo3561466.html. Copyright © 1993 by Island Press. Reproduced by permission of Island Press, Washington, DC.)<br />
An international ‘Biophilic Cities’ research programme has recently been launched, which aims<br />
to improve the connections between people living in cities and their living environments by<br />
building directly on biophilic bonds (Beatley 2010). The cities affiliated with this programme are<br />
said to contain abundant nature; care about, and seek to protect, restore and grow this nature;<br />
and strive to foster deep connections and daily contact with the natural world. Wellington City<br />
has recently joined the Biophilic Cities network, through its ‘Our Living City’ programme 79 . The<br />
programme aims include growing and enjoying our natural capital (ensuring that city projects<br />
in urban design, land use, open space management, and infrastructure and water are all carried<br />
out in a way that protects and develops urban nature, biodiversity and resilience); transforming<br />
the city economy in a way that reduces environmental impacts; and city leadership in community<br />
79<br />
http://wellington.govt.nz/your-council/projects/our-living-city<br />
68 The nature of wellbeing
Box 9: Project Halo bringing the delight of the tūī back to Hamilton<br />
Being able to hear the birdsong of a tūī (Prosthemadera novaeseelandiae) or bellbirds (Anthornis<br />
melanura) is something that is unique to New Zealand and it is especially significant for city dwellers<br />
to have the chance to experience it close to their homes. Tūī are native to New Zealand but over<br />
recent decades were rarely sighted within the city of Hamilton—especially their young, as they chose<br />
to breed in more rural areas. Waikato Regional Council recognised that ecosystems and the services<br />
they provide are highly important to the regional economy (Cole & Patterson 1999), and that bird<br />
species are an important part of these ecosystems, not only as pollinators and dispersers of native<br />
plants, but also as loved city residents.<br />
Project Halo was initiated in 2007 by Waikato Regional Council in conjunction with Landcare<br />
Research with the aim of bringing tūī back into Hamilton City. Through research, it became clear<br />
that a focus needed to be placed on habitat restoration and biodiversity. The core hypothesis was<br />
that if possums and rats could be controlled in key bush areas with a 20-km ‘halo’, then birds would<br />
be able to survive and eventually disperse to Hamilton (Waikato Regional Council 2011). Therefore,<br />
for the last 5 years, rat and possum control has taken place at selected sites before the summer<br />
breeding season, providing regeneration of bush areas and safer breeding sites for native birds.<br />
Project Halo has had dramatic results, with not only hundreds of reported tūī sightings, but also<br />
vast improvements in the bush areas where control has taken place. The Hamilton City biennial bird<br />
count in 2012 confirmed that the abundance of tūī increased significantly between 2004 and 2012 in<br />
all areas and seasons (Fitzgerald & Innes 2009). Ecological sites included in the project (e.g. Hope<br />
Bush) have shown striking differences from unmanaged bush, and now contain a stunning volume of<br />
bird song and fully leafed trees that are loaded with fruit 80 .<br />
Engaging the community has been critical to the continuing success of Project Halo. Community<br />
participation and support has been achieved through the intentional and specific branding of the<br />
project, as well as the different ways in which people can be involved. Social media, information<br />
stalls, interactive children’s sessions and competitions have helped raise awareness of the value of<br />
native birds in our environment. In particular, having the chance to report a bird sighting or enter the<br />
photo competition has opened Hamilton residents’ eyes to the many types of birds that are around<br />
their area (Waikato Regional Council 2011).<br />
A similar Halo project has recently begun in suburban Wellington 81 , aiming to provide a safe haven<br />
for wildlife in private gardens, principally through predator control, to allow native birds to spread<br />
out from intensively controlled areas such as Zealandia and Otari-Wilton’s Bush across the city.<br />
participation and partnerships. The Living City project is significant in that its goals are not only<br />
concerned with environmental quality or green space management, but link these aspects with<br />
economic and social goals, and with the city’s ‘Towards 2040: Smart Capital’ strategic framework.<br />
3.4 Understanding<br />
Ecosystems provide a plethora of learning opportunities at many levels of education (Smith<br />
et al. 2013b) and there is evidence that some forms of learning are enhanced in natural<br />
settings. Research and the formal and informal transfer of knowledge and skills lead to greater<br />
understanding of how ecosystems function and how our actions affect the provisioning of these<br />
services—which are essential for our continued wellbeing. Conversely, Louv (2005) argued that if<br />
children have very little exposure to the natural world, they will not sufficiently understand and<br />
appreciate the breadth of nature to want to preserve it.<br />
80<br />
www.waikatoregion.govt.nz/Environment/Natural-resources/Biodiversity/Hamilton-Halo/Hope-Bush-pest-control-benefits/<br />
81<br />
http://halo.org.nz/enhancing-the-halo-launches<br />
The nature of wellbeing<br />
69
Botanising. Photo: Cynthia Roberts.<br />
There is a growing literature on how experience of natural environments contributes to physical,<br />
motor, cognitive and emotional development (thus assisting with both subsistence needs for<br />
physical and mental health, and the need for understanding). An empirical and experimental<br />
study by Fjørtoft (2004), for example, demonstrated the beneficial effects of natural environments<br />
on motor development through play. Kellert<br />
(2002) and Wells (2000) have explored how<br />
cognitive skill development is enhanced via<br />
interaction with nature, and Wells & Evans<br />
(2003) reported how nearby nature can act as<br />
a buffer of life stress in rural children.<br />
This research provided impetus for the<br />
formation of the US-based ‘Children and<br />
Nature Network’ 82 , whose mission is ‘to<br />
connect all children, their families and<br />
communities to nature through innovative<br />
ideas, evidence-based resources and tools,<br />
broad-based collaboration and support of<br />
grassroots leadership’. Their website brings<br />
together a range of practical and academic<br />
resources, including a 68-page annotated<br />
bibliography Children and nature worldwide: an exploration of children’s experience of the<br />
outdoors and nature with associated risks and benefits—a joint publication of the Children and<br />
Nature Network and the IUCN’s Commission on Education and Communication.<br />
As well as providing opportunities to learn about the integrated systems of which we are a part<br />
and on which we depend, natural environments also provide an opportunity to learn about<br />
ourselves. A wide range of organisations in New Zealand use our wild landscapes and ecosystems<br />
to provide experiential learning and therapeutic opportunities (see Box 10). The feelings of<br />
exhilaration, fear, excitement, exhaustion, achievement, connection, frustration, awe or wonder<br />
that we experience in a wilderness setting, along with all the other associated benefits of physical<br />
activity, can lead to a greater awareness of self, feelings of wellbeing, and a sense of connection<br />
with others and the world, providing opportunities for significant growth (Richards & Peel 2005).<br />
A number of terms are used to describe the ways in which the natural environment is used to<br />
encourage personal development, including outdoor education, challenge education, wilderness<br />
therapy, adventure therapy and outdoor experiential therapy (Ewert et al. 2001). Programmes<br />
with a ‘wilderness-therapy’ orientation utilise the concept of ‘adaptation’ or coping with change<br />
(Crisp 1998), either in the individual’s social environment or in their physical setting. Remote<br />
areas, in particular, are often more amenable to offering people a sense of change from ‘normal’<br />
living. In wilderness therapy, clients see clearly the ways in which ‘the existential givens of nature<br />
comment explicitly and unequivocally on the existential givens of life. The fact that nature can<br />
be unforgiving and punishing, as well as inspiring and rewarding, provides profound teaching—<br />
uncontaminated by interpretation or the judgement of another’ (Richards & Peel 2005).<br />
Adventure therapy employs the ‘disequilibrium’ principle, as described by Nadler & Luckner (1992),<br />
where people are faced with novel situations in which they need to develop new ways of thinking<br />
and acting (Ewert et al. 2001). In the Outward Bound programme (see Box 10), the participant is<br />
placed in novel physical and social settings and is encouraged to develop a new set of skills and<br />
behaviour in order to master the situation (Walsh & Golins 1976, cited in Ewert et al. 2001).<br />
Outdoor experiential therapy is more of an umbrella term for any therapy that utilises an outdoor<br />
setting and direct experience, which may or may not involve adventure (i.e. the deliberate<br />
inclusion of risk or danger) or require wilderness-like environments (Ewert et al. 1999, cited in<br />
Ewert et al. 2001; see also Section 3.9—‘Freedom’).<br />
82<br />
www.childrenandnature.org<br />
70 The nature of wellbeing
Box 10—Nature as teacher: learning about ourselves in a natural<br />
environment<br />
Numerous programmes use New Zealand’s wild places as a context for fostering personal<br />
development in both ‘average’ New Zealanders and particular client groups. A well-known example<br />
is the Outward Bound programme, which began in New Zealand in 1961 and has now seen more<br />
than 48 000 New Zealanders (and international participants) complete the course 83 . These courses<br />
have five main objectives 84 :<br />
• Self-development—Develop your self-awareness, confidence and motivation; recognise your<br />
potential; understand and assume personal responsibility.<br />
• Social development—Increase your social awareness and communication skills; understand how<br />
to create effective relationships and experience success as a member of a team.<br />
• Values—Consideration of your own, others’ and Outward Bound’s values, which are Compassion,<br />
Greatness, Responsibility and Integrity; develop skills to resolve conflicts of values.<br />
• Environment—Experience education in, about and for the environment; become a guardian of the<br />
environment.<br />
• Service—Experience and understand what it means to be of service.<br />
Project K is another programme where a wilderness adventure is a central component of the learning<br />
experience. Developed as a practical step to address high levels of negative youth statistics in<br />
New Zealand, Project K is a 14-month programme for selected year 10 students aimed at building<br />
their self-efficacy and maximising their potential, and a 3-week Wilderness Adventure is a key<br />
component. Reported results include improved self-confidence and focus, academic results, social<br />
skills, and motivation; and reduced negative behaviour such as smoking and truancy. 85<br />
In New Zealand, education about our biodiversity and natural ecosystems is available from early<br />
childhood through to advanced tertiary degrees:<br />
••<br />
The EnviroSchools network reaches 240 000 children and young people through 30% of<br />
New Zealand schools and kura, with a growing participation from the early childhood<br />
sector and an estimated reach of 1 million people nationwide. 86<br />
••<br />
Primary and secondary school curricula include units that examine our indigenous<br />
biodiversity, and the functioning and services of ecosystems.<br />
••<br />
The National Certificate of Educational Achievement (NCEA) includes a number of<br />
outdoor recreation standards 87 , which are taught at a wide range of New Zealand schools<br />
and tertiary institutions, including 23 schools that are part of the Outdoor Education<br />
New Zealand (ODENZ) programme.<br />
••<br />
The ODENZ schools market New Zealand’s ‘outdoor adventure-land’ to international<br />
students, offering them challenging practical programmes that ‘build self-confidence<br />
and resilience, enabling participants to develop an understanding of group dynamics,<br />
interpersonal communication, and leadership qualities’. 88<br />
Understanding more about biodiversity and the environment can lead to changes in attitudes,<br />
but gaining that understanding need not involve venturing into wild and scenic places—it can<br />
begin much closer to home. A recent study of gardens in the ecology and society of Dunedin City<br />
83<br />
www.outwardbound.co.nz/q-a/general/<br />
84<br />
www.outwardbound.co.nz/about-outward-bound-nz/course-objectives/<br />
85<br />
www.fyd.org.nz/ProjectK(Year10)/Home.aspx<br />
86<br />
www.enviroschools.org.nz/about-the-enviroschools-foundation<br />
87<br />
www.nzqa.govt.nz/qualifications-standards/standards/<br />
88<br />
www.outdoorednz.co.nz/schools/<br />
The nature of wellbeing<br />
71
examined, among other things, the relationship between householders and their gardens, and<br />
the ways in which gardeners’ knowledge of New Zealand biodiversity was enhanced through the<br />
garden study methodology (Van Heezik et al. 2012). The researchers found that communication<br />
with householders in the form of an interactive dialogue during a process of biodiversity<br />
documentation of their gardens, including feedback with both formative and normative<br />
components, resulted in an increase in knowledge and a shift in attitude in 64% of householders:<br />
40% reported a greater understanding of wildlife and 26% made changes in their gardens—13%<br />
to support native biodiversity (Van Heezik et al. 2012). Similarly, Watson (2006) surveyed 14<br />
community gardeners and found that these gardens can be an ideal setting for children’s learning<br />
in many domains of the curriculum.<br />
Being involved in biodiversity restoration projects can also bring additional understanding and<br />
skills. For example, Cowie (2010) studied Kāpiti Coast dune restoration groups and found that<br />
two-thirds of respondents had learnt at least one skill or piece of knowledge, while the majority<br />
agreed that their new-found knowledge or skills had positively impacted on their attitude towards<br />
the environment.<br />
3.5 Participation<br />
Being involved in activities and sharing particular experiences with others develops the bonds<br />
that tie people together in society, enhancing feelings of connectedness, trust, mutual obligation<br />
and belonging. These bonds have a large bearing on our personal wellbeing and the wellbeing<br />
of our community (Putnam 2000; Smith 2003). A social network propagates opportunities to<br />
enhance the quality of life to all of its members and creates a safety net for difficult times. A<br />
cohesive community allows open discussion and resolution of difficult problems, and gives its<br />
members a sense of identity (Jeannotte et al. 2002). Social participation of all concerned citizens<br />
is essential for obtaining environmental wellbeing.<br />
The natural spaces of New Zealand provide a wide range of settings for shared activities such<br />
as tramping, climbing, sailing, swimming, picnicking, walking and cycling. Green space and<br />
access to nature promote pro-social behaviour and help mitigate some of the negative antisocial<br />
behaviours associated with crowding and urbanisation (Kuo & Sullivan 2001; Kuo 2010). Natural<br />
spaces within communities afford people opportunities to interact with others beyond their own<br />
family dynamics through open areas that are reserved for recreational and cultural activities,<br />
such as festivals, picnics and community gardens. The collective action needed to protect<br />
ecosystems can itself be a bonding force and source of pride to residents who share a common<br />
goal and work together to make their community a better place to live (EPA 1997).<br />
School children planting trees at Pongaroa School, 2009. Photo: Sandra Burles.<br />
Thousands of New Zealanders volunteer<br />
each year to join with others in carrying out<br />
biodiversity restoration projects, such as Quail<br />
Island, Tiritiri Matangi Island, Cape Sanctuary,<br />
Maungatautari, Project Crimson, WekaWatch<br />
and Project Twin Stream (Box 11), as well as<br />
several hundred urban environmental and<br />
restoration programmes. More than 30 000<br />
volunteers each year participate in restoration<br />
and species recovery programmes on public<br />
conservation land (Hardie-Boys 2010). Hughey<br />
et al. (2013) reported that 13% of respondents<br />
to a national survey had been active member<br />
of a club or group that restores or replants<br />
natural environments. There is some evidence<br />
72 The nature of wellbeing
Box 11—Project Twin Streams<br />
In early 2000, Auckland Regional Council required Waitakere District Council to improve stormwater and<br />
flood management along streams within its catchment. This led in 2003 to the develop-ment of Project<br />
Twin Streams, which took a sustainable community development approach to restoring 56 km of stream<br />
bank within Waitakere City. The streams included in the catchment area are the Oratia, Waikumete,<br />
Opanuku, Pixie and Swanson, encompassing an area of 10 000 ha that has a resident population of<br />
around 100 000 people (Project Twin Streams 2010).<br />
Restoration has been enabled through access covenants and either full or part purchase of<br />
properties on the 100-year floodplain, and volunteers and contractors have been involved in<br />
removing weeds, planting and carrying out maintenance. Separately funded walk and cycleways<br />
have also been developed along the stream banks, allowing greater access opportunities for<br />
recreation and enjoyment of the stream areas (Project Twin Streams 2012). The stream restoration<br />
outcomes and the approach that has been taken to community engagement have led to<br />
improvements in a range of wellbeing areas.<br />
An evaluation prepared for Waitakere City Council by Vesley (2009) provided monetary value<br />
estimates for some aspects of the Twin Streams project. The restoration of stream habitats in<br />
Waitakere City is expected to increase the subsistence and life-supporting capacities of the<br />
waterways. The impacts on these are yet to be quantified, but include influencing the level and<br />
quality of fish and shellfish gathered for consumption; the amount of flax available to harvest<br />
for ornamental uses; and the avoidance of salty water contaminating the groundwater. Amenity<br />
values will also be improved for nearby residents and users of the parks: improved water clarity is<br />
estimated to bring $5.3–6.1 million per year, as well as other ecosystem benefits as a result of the<br />
increased streamside vegetation biodiversity; and it is expected that as amenity values improve,<br />
property prices in the surrounding areas may increase.<br />
Implementation of the stream restoration aspects of Project Twin Streams will bring improvements to<br />
the safety and protection for both local residents and those further afield. The avoidance of flooding<br />
by moving properties out of the 100-year floodplain and planting vegetation that will slow down<br />
and dissipate water levels is expected to bring around $4.6–5.1 million per year. Climate regulation<br />
through carbon dioxide sequestration by plantings will assist in protection over a longer time frame<br />
and at a global level, with estimated benefits (based on carbon trading) of $3800–21,600 per year.<br />
Project Twin Streams will also help to improve the health of communities. The new walk- and<br />
cycleways are being used more, which is likely to lead to people of all ages doing more physical<br />
exercise. The ability to view green space more easily will also improve health through stress<br />
reduction and illness recovery. Plantings will improve air quality, reducing the exposure to air<br />
pollution, with an estimated benefit of $1.8–4.0 million per year.<br />
A strong vision for community involvement in the Twin Streams project has led to high levels of<br />
community participation. There have been 34 000 volunteer engagements through community<br />
planting days and events. The partnership between councils and contracted community<br />
organisations has increased capacity and ensured strong community engagement. For example,<br />
165 groups have been involved, from churches to sports clubs and resident associations, some<br />
of which have chosen to be responsible for a specific site (Project Twin Streams 2010). Such<br />
community participation will increase awareness and ownership of the surrounding environment.<br />
Cultural identity has also been incorporated, primarily through a contract granted to Ngāti Whātua<br />
to carry out cultural alternatives of stream restoration using no chemicals, and the Pā Harakeke<br />
Garden, which includes 19 precious flax cultivars (Project Twin Streams 2012).<br />
Signage containing educational information established along the riparian pathways and<br />
environmental education sites that are used by 15 schools provide numerous opportunities to learn<br />
about ecosystems. This has also involved 42 creative projects using art and music to help people<br />
to develop a connection with the streams in their communities. A number of external university<br />
papers and research reports have focused on various aspects of this project: guidelines for riparian<br />
restoration, stream geomorphology, application of vision statements, environmental monitoring and<br />
ecological surveys 89 .<br />
89<br />
http://projecttwinstreams.com/?page_id=309<br />
The nature of wellbeing<br />
73
that environmental volunteering may confer health and wellbeing benefits for the volunteers<br />
themselves (e.g. Townsend 2006; Pillemer et al. 2010); and Blaschke (2013) suggested that the<br />
fostering of volunteering programmes on public conservation land for a wide range of groups<br />
in New Zealand society may be an important mechanism for increasing all types of health and<br />
wellbeing benefits that are potentially associated with natural areas.<br />
3.6 Leisure<br />
Participation in leisure time activities has been positively linked to both physical and mental<br />
health measures (Williams & Patterson 2008; Krueger 2009). Leisure time is defined as time that<br />
individuals are able to voluntarily engage in pleasurable activities, free from the demands of<br />
work or other responsibilities (Smith et al. 2013b). Considered in its broadest context, leisure can<br />
include play, playfulness, recreation (active leisure, including sport) 90 and tourism (leisure and<br />
recreation associated with travel and commonly overnight accommodation).<br />
Leisure in some form (i.e. not necessarily as ‘time’) is commonly considered necessary for<br />
basic survival and has increasingly been referred to as a domain of ‘the good life’ (Smale et<br />
al. 2010). Most human development theories note the pivotal role of play and playfulness in<br />
human physical, psychological and social growth. Through play, the human body develops and<br />
strengthens from birth; and from early stages of vocalisation, playfulness and imitation set the<br />
scene for socialisation to adult roles and behaviours. Leisure or idleness has also been identified<br />
by Max-Neef (1991) as one of the nine fundamental needs leading to enhanced wellbeing. This is<br />
hardly surprising given the importance of leisure throughout our lives and its links to so many<br />
of the other needs identified by Max-Neef—particularly participation, creation, identity, freedom,<br />
affection and understanding.<br />
The OECD’s Better Life Initiative includes a<br />
measure of time dedicated to leisure and personal<br />
care to describe work-life balance. Leisure time<br />
not only provides for psychological detachment<br />
from work, which, in turn, promotes wellbeing and<br />
productivity (Binnewies et al. 2010), but enjoyable<br />
activities may also act as ’re-creation’, facilitating<br />
an individual’s recovery from stress as the result<br />
of positive social interactions or relaxation, which<br />
lead to increased positive emotions (Pressman<br />
et al. 2009). While the concept of ‘work-life<br />
balance’ is widely discussed, for some the role<br />
of leisure plays out differently throughout the<br />
course of life. A child’s excursion in their buggy<br />
to the local reserve, play time at school, the ride<br />
or walk to and from school, Christmas holidays<br />
at the bach or beach, winter skiing or playing<br />
on the sports field are common reflections, as<br />
are ‘road trips’ and holidays with or without<br />
Swimming in the Waikato River, Hamilton.<br />
children in adult life. What is a relatively new<br />
Photo: John Quinn, NIWA.<br />
phenomenon, however, is the demographic trend<br />
that by 2025 one billion people will be aged 60 and over, and that in the developed world ageing is<br />
becoming less associated with dependency and more associated with activity and independence<br />
(Harahousou 2006). Such benefits are not universal, however, as many people are stressed because<br />
of financial difficulties and the dominance of work, so that leisure fills a more recuperative role<br />
(Iso-Ahola & Mannell 2004).<br />
90<br />
In the context of New Zealand conservation legislation and most DOC planning, ‘recreation’ is a broader term encompassing<br />
all types of activities, both active and passive, undertaken by visitors.<br />
74 The nature of wellbeing
Active leisure is widely considered an essential element in both health and wellbeing (Haworth<br />
2010). Participation in both physical and non-physical leisure activities has been shown to reduce<br />
depression and anxiety, produce positive moods, enhance self-esteem, facilitate social interaction<br />
and improve cognitive functioning—in short, it increases general psychological wellbeing and life<br />
satisfaction. Regular physical activity, including walking, cycling and gardening, are commonly<br />
advocated for physical fitness. Of course, leisure is not a panacea, however—it can increase stress<br />
if used as an avoidance tactic, and enforced leisure, such as through unemployment, can be<br />
unrewarding.<br />
There has been much recent attention on green settings for active recreation and their associated<br />
health and wellbeing benefits. As discussed in Section 3.1.5, it is currently not possible to<br />
generalise about which types of recreation-related health benefits are associated with which, if<br />
any, types of green space (Blaschke 2013). For example, a recent report commissioned by local<br />
government councils in Auckland, Waikato and Wellington examined the economic costs of<br />
physical inactivity in those cities—which are significant—but did not differentiate between places<br />
in which the physical activity occurred (even indoors versus outdoors) (Market Economics Ltd<br />
2013). The most recent New Zealand study examining the relationship between health outcomes,<br />
physical activity and green space confirmed that neighbourhood green space was related to some<br />
health outcomes and that physical activity was higher in greener neighbourhoods—however, it<br />
did not fully explain the relationship between green space and health (Richardson et al. 2013).<br />
Specific activities that individuals engage in can be linked to access and exposure to nature<br />
and green space. According to Korpela & Kinnunen (2010), time spent interacting with nature is<br />
significantly correlated to both life satisfaction and relaxation, both of which are contributors to<br />
our subjective wellbeing and health. Among a variety of leisure time activities evaluated, exercise,<br />
spending free time outdoors and interacting with nature were the most effective activities for<br />
recovering from work stress (Korpela & Kinnunen 2010)—and all of these activities are closely<br />
tied to recreational opportunities and aesthetics, biodiversity, usable water (swimmable, fishable),<br />
and clean air. In the USA (and presumably in many other countries as well), the downward trend<br />
in the amount of free time that is afforded to individuals is placing increased value on the amount<br />
of time that is available outside work. The potential impact of outdoor activities and interactions<br />
with nature on our wellbeing exemplifies the contribution that ecosystem goods and services<br />
make in supporting these leisure activities (Smith et al. 2013b).<br />
Leisure time activities also provide opportunities for social interactions through group<br />
participation (i.e. clubs, sports, religious organisations) and expand the size of social networks,<br />
enhancing social cohesion (Smith et al. 2013b). In Section 2.3, we discussed the importance<br />
of different types of capital (e.g. natural, social, human, financial) as inputs to the satisfiers<br />
of the various human needs. Just as a local or national park (natural capital) or a university<br />
education (cultural capital or human capital) can increase productivity and wellbeing (both<br />
individual and collective), rich networks of social contacts enhance social capital, and hence the<br />
productivity and wellbeing of individuals and groups. New research on resilient individuals and<br />
communities—for example, in the aftermath of the Christchurch earthquakes—has demonstrated<br />
that these are often built on voluntary and recreational networks and shared activities. Thus,<br />
recreation has become an important focus in ‘resilience’ models.<br />
Few of us probably consider how much access to fresh air, sunshine, visits to open spaces,<br />
and access to travel and natural places play a role in shaping who we are and what we stand<br />
for as New Zealanders. In developing a list of New Zealand cultural iconographies, Belich &<br />
Wevers (2008) reported ‘the environment’ as third out of six core elements. Elsewhere, ‘sport’ is<br />
considered a New Zealand touchstone (MSD 2010)—as might also be the ‘the active/sporting<br />
country’, the ‘shaky isles’ or Tourism New Zealand’s brand ‘100% pure’.<br />
Despite the significance of recreation in our national and daily lives, accurate measures of its<br />
extent (and impact) are particularly hard to come by—as are measures of its value to the national<br />
economy. Table 5 provides a reasonably recent view of both the range of nature-based activities<br />
The nature of wellbeing<br />
75
undertaken and immediate insight into the draw these might make on ecosystem services for<br />
tourists in New Zealand.<br />
There are two broad approaches to the economic valuation of recreation (NZIER 2013). One<br />
is to identify its contribution to the measured economy by analysing its economic impacts on<br />
output, GDP, incomes or employment. The other is to examine its effects on economic welfare<br />
or wellbeing, which includes inferring values for non-market effects. However, as NZIER (2013)<br />
discussed, both of these approaches are fraught with technical difficulties and compromised by a<br />
lack of robust data for much of New Zealand; and not surprisingly, NZIER (2013) concluded their<br />
study with a recommendation that a broader based, standardised approach needed to be used to<br />
collect new primary data.<br />
Table 5. Top 30 nature-based activities undertaken by international and domestic 91 tourists in New Zealand in<br />
2008 (source: Ministry of Tourism 2009).<br />
International tourists<br />
Domestic tourists<br />
Activity<br />
Visitors<br />
(000s)<br />
Propensity*<br />
(%)<br />
Activity<br />
Visitors<br />
(000s)<br />
Propensity*<br />
(%)<br />
Beaches 858 38.7 Beaches 3269 7.5<br />
Scenic boat cruise 554 25.0 Fishing 1533 3.5<br />
Geothermal attractions 500 22.5 Hot pools 982 2.3<br />
Lakes 461 20.8 Bush walk (half hour) 603 1.4<br />
Scenic drive 445 20.0 Scenic drive 582 1.3<br />
Hot pools 382 17.2 Snow sports 376 0.9<br />
Glacier (walk/view) 325 14.7 Surfing 367 0.8<br />
Sightseeing tour (land) 249 11.2 Hunting/shooting 358 0.8<br />
Bush walk (half hour) 248 11.2 Sightseeing tour (land) 352 0.8<br />
Glow worm caves 227 10.2 Trekking/tramping 15 0.7<br />
Bush walk (half day) 225 10.2 Bush walk (half day) 292 0.7<br />
National parks 211 9.5 Canoeing, kayaking, rafting 280 0.6<br />
Trekking/tramp 201 9.0 Lakes 276 0.6<br />
Jet boating 182 8.2 Scenic coat cruise 263 0.6<br />
Waterfalls 178 8.0 Mountain biking 238 0.5<br />
Seal colony 164 7.4 Scuba diving / snorkelling 193 0.4<br />
Canoeing, kayaking, rafting 147 6.6 National parks 144 0.3<br />
Scenic flight 129 5.8 Waterfalls 142 0.3<br />
Penguins 125 5.6 Jet boating 123 0.3<br />
Fishing 116 5.2 Horse trekking/riding 86 0.2<br />
Dolphin watching/swimming 111 5.0 Water skiing 77 0.2<br />
Snow sports 99 4.5 Scenic train trip 76 0.2<br />
Mountains 90 4.0 Sport climbing 69 0.2<br />
Whale watching 90 4.0 Geothermal attractions 69 0.2<br />
Albatross colony 79 3.6 Caving 69 0.2<br />
Scenic train trip 73 3.3 Glacier (walk/view) 66 0.2<br />
Sky diving 65 2.9 Rivers 56 0.1<br />
Rivers 61 2.7 Mountains 51 0.1<br />
Sailing 42 1.9 Mountain climbing 48 0.1<br />
4WD trips 41 1.9 Sailing 46 0.1<br />
* Propensity (or likelihood) is the proportion of all tourists that took part in the activity.<br />
91<br />
A domestic tourist is defined as a New Zealand resident who travels within New Zealand but outside their usual environment,<br />
and while travelling, they do not stay in any one place for more than 12 months (Statistics New Zealand 2012). ‘Usual<br />
environment’ generally is considered to be a 40 km radius from one’s residence, and includes domestic flights and the<br />
interisland ferry.<br />
76 The nature of wellbeing
There are two existing estimates of the total value of recreation and sport in New Zealand, and<br />
the value of outdoor recreation, both of which suggest an economic contribution of about 2.5% of<br />
GDP. However, differences in assumptions and compilation methods raise questions about the<br />
reliability of these results.<br />
In a review of non-market valuation studies, Kaval & Yao (2007) built on a Tourism New Zealand<br />
estimate from 2006 (which appears not to have been updated) reporting over 4 million<br />
international and domestic outdoor recreation participants, and 72.5 million recreation days in<br />
the year (18 days per participant on average), to provide an estimate of $3.8 billion attributable<br />
to outdoor recreation. That, however, is not the total economic value of outdoor recreation, as it<br />
excludes non-market values—an omission that they rectified by undertaking a meta-analysis of<br />
19 non-market valuation studies of recreation activity, to derive an average value per recreation<br />
day. From this, they found that the average value per person day was $71.27, which, spread across<br />
72.5 million outdoor recreation days, implied a total value of $5.17 billion per year—equivalent to<br />
about 3% of GDP in 2007. However, there was great variability in the data, as highlighted by the<br />
fact that the more broadly studied South Island values were on average $1,313 per visitor day,<br />
which was considerably higher than the North Island values ($28 per visitor day), despite these<br />
appearing to include more sites of local significance. They distinguished tramping (on Great<br />
Walks) and climbing as high-value activities that were worth more than $100 per visitor day,<br />
fishing as a moderate-value activity, and camping and picnicking as low-value activities worth<br />
less than $35 per visitor day. The authors noted that such a variation in values, with specialised<br />
activities having higher value than more casual activities, is consistent with results of similar<br />
studies in other countries.<br />
In a wider survey of non-market valuation, Yao & Kaval (2007) updated and revised their analysis<br />
for recreation with additional studies. This resulted in a lower estimated value per person day of<br />
$56.63 and aggregate consumer surplus of $4.1 billion per year (equivalent to 2.5% of GDP). They<br />
also reported a very wide variation in value of a recreation person day, from $0.38 to $622.41,<br />
reflecting the averaging of results from diverse non-market valuation studies undertaken with<br />
different techniques and in different contexts.<br />
Kaval & Yao’s (2007) estimate of $3.8 billion economic contribution of outdoor recreation in<br />
2006 is coincidentally the same as Dalziel’s (2011) estimate for sport and recreation in 2008.<br />
However, when converted to 2008 dollar terms, the 2006 estimate is 6% larger than the 2008<br />
estimate, which was taken across an ostensibly broader sector. This is due to differences in<br />
the assumptions and methods to overcome data limitations. The economic contribution of<br />
ecosystem-dependent recreation is probably within the bounds of these estimates, but neither<br />
estimate is sufficiently reliable to determine what that proportion might be.<br />
In previous attempts to place a ‘value’ on leisure and recreation, multiple sources of value have<br />
been recognised, the most important of these being:<br />
••<br />
Direct current use values. These fall into two categories: commercial commodities or<br />
services (e.g. ski field pass); and unpriced recreation opportunities, including non-‘priced’<br />
considerations of how much people pay for their recreation (travel expenses including not<br />
only direct (fuel) costs, but also longer term vehicle maintenance and replacement costs).<br />
••<br />
Indirect current use (functional) values, reflecting such outcomes as health and<br />
productivity gains for participants supporting other economic activities.<br />
••<br />
Future use values, i.e. the benefit gained from retaining resources for future consumption,<br />
particularly where there is a possibility that future technology will increase the usefulness<br />
of the resource, including both:<br />
—Option value: the value of retaining a resource for own use in the future (e.g. some day I<br />
would like to visit that lake/beach/bush, but it adds to my wellbeing just knowing that I<br />
have that option).<br />
—Bequest value: the value of retaining a resource to bequest to future users.<br />
••<br />
Non-use values (sometimes called passive-use values, but not to be confused with passive<br />
activities like picnicking), reflecting current preferences to preserve the existence of the<br />
The nature of wellbeing<br />
77
esource into the future, without the prospect of any direct use benefit for the current<br />
holders of this preference. Under this framework, a contribution to wellbeing would be<br />
derived by simply knowing, for example, that New Zealand is a good global citizen and<br />
retains a range of environments in protected areas.<br />
Sharp & Kerr (2005) argued that all these sources of value, which are components of the ‘Total<br />
Economic Value’ (TEV) (see further discussion in Section 4.3.3), should be taken into account in<br />
decision making.<br />
3.6.1 Leisure and environmental quality<br />
Water-based leisure activities are central to New Zealand culture, and we have a great affinity for<br />
life around the coast, at the beach, lake or river, or on and under the water (Table 5). Many pursuits<br />
are undertaken at a variety of different paces and in different locations, but typically the quality<br />
of the experience is influenced by the quality of the environment. A recent study on Australian<br />
ecosystem services reported a clear preference for recreation and tourism sites where stream<br />
health, water quality, biodiversity, nutrient management and aesthetics were well managed (CSIRO<br />
2013). Similarly, in New Zealand, choice modelling has shown that Auckland residents place the<br />
greatest importance on water clarity, the quality of underfoot conditions and ecological health<br />
when it comes to coastal experiences (Batstone & Sinner 2010). Data from a 7-yearly national angler<br />
survey also showed that there has been a recent reduction in angling effort in lowland rivers and<br />
streams generally, although overall angling effort has remained steady. This is particularly apparent<br />
in Canterbury, where there has been a loss of angling effort in lowland streams that amounts to<br />
c. 50 000 angler days between the 1994/95 fishing season and the 2007/08 season (Neil Deans,<br />
Fish and Game NZ, pers. comm.). This evidence of anglers ‘voting with their feet’ and going<br />
farther afield to fish suggests that lakes and rivers closer to public conservation land have become<br />
increasingly important to anglers as angling in lowland streams has declined.<br />
Fisheries vary in their reliance on indigenous vegetation/ecosystems. The relatively low<br />
sediment yield of indigenous ecosystems generally increases populations of indigenous<br />
fish and salmonids. Riparian vegetation preferences vary between species (Leathwick et al.<br />
2009), but riparian vegetation has a strong influence on many species by providing spawning<br />
sites (several whitebait species), cover habitat and terrestrial food input. The naturalness of<br />
indigenous ecosystems also enhances the recreational fishing experience and associated tourism.<br />
Some rivers, such as the Mataura River (for brown trout Salmo trutta) and the Tongariro River<br />
(rainbow trout Oncorhynchus mykiss), are world-famous in angling circles, and trout fishing is<br />
used in imagery for New Zealand tourism promotion. International anglers accounted for 7.6%<br />
of the 54 416 season licences and 25.8% of the 24-h licences in the 2009/10 season (DOC & Fish<br />
and Game New Zealand 2010), and these anglers showed a marked preference for backcountry<br />
and headwater river fisheries, which accounted for 41.0% of international anglers’ total effort<br />
(compared with 9.4% for their New Zealand counterparts). This demonstrates the importance of<br />
rivers located in unmodified landscapes in attracting international anglers.<br />
Elsewhere, significant recreational trout (and to a lesser extent salmon) fisheries that are regulated<br />
by Fish and Game Councils and DOC (Lake Taupo Fishery) are used by many New Zealanders<br />
and international visitors. These contribute both cultural services and economic activity—a 1991<br />
study estimated the value of freshwater sports fishing at $145–231 million per year (Walrond 2012).<br />
For the 2007/08 year, it was estimated that 19.5% (17.7–21.2 CI) of the population—some 633 768<br />
people—participated in recreational fishing activity at least once over the previous 12 months<br />
(SPARC 2009a). The Ministry for Primary Industries estimated an annual take by recreational<br />
fisheries of 25 000 tonnes 92 . In a similar vein, the recent discussions over eastern North Island<br />
recreational bag limits has seen close to 50 000 submissions on this one issue, a clear indication of<br />
a wide set of ‘values’ associated with access to, and harvest from, this fishery 93 .<br />
92<br />
www.fish.govt.nz/en-nz/Fisheries+at+a+glance/default.htm<br />
93<br />
www.stuff.co.nz/national/politics/9053785/Fishermen-bite-in-snapper-bag-limit-fight<br />
78 The nature of wellbeing
In Section 3.7 we write about creativity and poetry, part of the ‘spiritual dimensions’ of wellbeing.<br />
What better way to summarise this section than with the words from the recent song ‘Family at<br />
the beach’ (see Box 12).<br />
3.6.2 Tourism<br />
A section on leisure and recreation in New Zealand would be incomplete without some comment<br />
on the considerable direct benefit that the tourism industry derives from our ecosystem services.<br />
Tourism is regarded as a key component of the New Zealand economy and culture. For the year<br />
ended March 2012, international tourist arrivals (2.6 million) were slightly higher (4.1%) than<br />
previous years (in spite of the reported demand-dampening effects of the Global Financial Crisis<br />
and the high New Zealand dollar). Overall, the tourism sector contributed $6.2 billion, or 3.3%, to<br />
GDP (Statistics New Zealand 2012). Interestingly, international tourism expenditure increased<br />
1.6% from the previous year to $9.6 billion and contributed 15.4% to New Zealand’s total exports of<br />
goods and services. In terms of its contribution to the New Zealand economy, a commonly stated<br />
comparison is that tourism generates a very similar contribution to the dairy sector, vying with it<br />
for first place in foreign exchange earnings (Simmons & Wilson 2014).<br />
An equally important but often overlooked measure of tourism activity is domestic tourism,<br />
which contributes $13.8 billion (up 3.0% in 2012) internal expenditure (Simmons & Wilson 2014).<br />
Thus, the major activity base of the tourism sector is New Zealanders travelling within their<br />
own country—and is often reported as 60–65% of total activity (person days) measures (ibid).<br />
Furthermore, for the last 7 years, domestic tourism expenditure has grown at a faster rate than<br />
international tourism expenditure (ibid).<br />
New Zealand’s tourism industry draws on direct (productive), indirect (amenity) and intangible<br />
(cultural and spiritual) aspects of ecosystems. In terms of visitor activities that draw ‘directly’<br />
on identifiable natural resources (and their embedded ecosystem services), some 70% of all<br />
international and 22% of domestic trips are reported as involving ‘nature-based’ activities (MED<br />
2009). In 2008, 2 million tourists took part in nature-based activities, representing 11.1 million<br />
nature-based trips (as one tourist can take multiple trips during a year) (Table 5). Walking and<br />
trekking, land-based sightseeing, and visiting scenic natural attractions were the most popular<br />
activities for international visitors during their stay. The Ministry of Economic Development<br />
(2009) further reported that the overall trend was one of steadily increasing participation from<br />
2004 to 2007, but with a drop in 2008 mainly by international tourists (Simmons 2013). For many,<br />
the concept of ‘naturalness’ and the presence of native species is important, particularly for<br />
creating the wilderness experience that many ‘eco-tourists’ seek. For example, viewing native<br />
wildlife was named as the most popular activity in a study of ecotourism in New Zealand. This<br />
underlines the importance of some native species for tourism, but also brings into question<br />
visitors’ (and locals’) knowledge or perceptions of ‘naturalness’.<br />
Following the 2007 State of the Environment Report (MfE 2007) and given the long-standing<br />
focus on nature-based activities in New Zealand, the Ministry for the Environment attempted<br />
to measure the value of the ‘clean green image’ to the New Zealand economy as early as 2001<br />
(MfE 2001). For the tourism sector, the Ministry reported that tourist purchasing behaviour<br />
(as measured by change in length of stay) varied by country of visitor origin, with Japanese<br />
andKorean visitors most impacted of the five markets studied. It was estimated that the loss of<br />
New Zealand’s ‘clean green image’ would result in an annual loss of between $530 million and<br />
$938 million (depending on whether lost wages and GST effects are taken into account) from<br />
the five tourist markets covered in the survey.<br />
The nature of wellbeing<br />
79
Box 12—Family at the beach<br />
Family at the beach<br />
There was Uncle Stan and Auntie Betty<br />
Colin Barry Auntie May and Uncle Roy<br />
At the beach<br />
And Auntie Birdie Uncle Bob and Valerie<br />
and Tony<br />
Heather too<br />
and Auntie Dorrie Uncle Ken and Pamela,<br />
Bay and Claire were there<br />
At the beach<br />
And naturally there was Mum and Dad and<br />
Bruce and me and Beverley<br />
At the beach by the sea<br />
In our tents en famille<br />
With a stretcher for you and a lilo for me<br />
And a primus to cook with<br />
And fresh fish for tea<br />
Ooh … what a lovely time we had<br />
Oh the sparkling of the water<br />
And the burning of the sand<br />
And the glistening of the sea-shells<br />
As I held them in my hand<br />
And the tall pohutukawas<br />
Were full of crimson flowers<br />
And happiness was easy to reach<br />
With the family at the beach<br />
(spoken)<br />
Now what did we use to do there? …<br />
I remember …<br />
Now Uncle Stan would often go out fishing<br />
Sometimes one or two of us went with him<br />
At the beach<br />
On rainy days we stayed inside<br />
And had a game of cards or played the ukulele<br />
Or some of us would go exploring<br />
Clambering and climbing round the rocks<br />
To the next beach<br />
Examining the little pools for sea anemones<br />
And other tiny sea life<br />
At the beach<br />
On the sand<br />
Arm in arm, hand in hand<br />
And the red-heads got burnt<br />
And the others go tanned<br />
And the pleasure was endless<br />
And nothing was planned<br />
Ooh … what a lovely time we had<br />
(spoken)<br />
And one particular Xmas holiday<br />
We went camping on the East Coast<br />
At a place called Te Kaha………<br />
And no-one else at all was camping there that<br />
year<br />
And so we had it to ourselves<br />
Just like a private beach<br />
Though sometimes Māori locals<br />
Came a-galloping their horses down the<br />
beach<br />
And stopped to say hello<br />
And once a week we went to see a movie<br />
In the local hall which had an old projector<br />
At the beach<br />
And laughed because the sound was so<br />
distorted<br />
But it didn’t really seem to matter<br />
And my sister and me sang in close harmony<br />
And were judged second best at the local<br />
Talent quest<br />
And we all had a ball in the Te Kaha hall<br />
Oooh … what a lovely time we had<br />
Lyrics by Linn Lorkin. Reproduced with permission of Linn Lorkin.<br />
Voted Best Kiwi Summer Song in a 2007 National Radio listeners’ poll<br />
Recorded in 1986 by Radio New Zealand with Members of the NZ Symphony Orchestra / guitar-Martin Winch / bass-<br />
Billy Kristian / drums-Frank Gibson / piano-Carl Doy / BVs-Denise Harris. Wanda van der Hoofd, Linn Lorkin.<br />
80 The nature of wellbeing Photo: Herb Christophers
3.7 Creation<br />
In many respects, creativity is based on the observational world around us. For hundreds<br />
of thousands of years and untold generations, that would inevitably have been the natural<br />
environment of flower, leaf, insect, animal, and indeed human … An important part of creativity<br />
is connectedness, even inter-connectedness, and for much of our history as a species that<br />
immediate connectedness has been with the natural world. A connectivity with the natural world<br />
is undoubtedly the broadest and most satisfying connection that we have ever had as a species.<br />
(John Hopper, 7 October 2013 94 )<br />
Being able to express ourselves creatively and experience the creativity of others contributes<br />
significantly to our wellbeing. Engaging in creative behavior or experiencing creativity affects<br />
our positive psychological wellbeing (or hedonic wellbeing) in terms of feeling more happy,<br />
enthusiastic, and optimistic (Amabile 1996, Csikszentmihalyi, 1999). It is also likely to enhance<br />
feelings of fulfillment and functioning well (eudaimonic wellbeing) (Bujacz et al. 2014), perhaps<br />
as a result of the personal growth arising from meeting the challenges that creative projects<br />
frequently present (Amabile 1996), or the feeling of flow we experienced when deeply immersed<br />
in a creative task (Csikszentmihalyi 1997). We often use acts of creation to express our need for<br />
identity (see Section 3.8) and when creative activities are undertaken in the company of others,<br />
they help satisfy our need for participation (Section 3.5). The valuable contribution of creative<br />
activities to enhancing mental and physical health has been long understood in the health sector<br />
(Leckey 2011). While creativity<br />
enhances our wellbeing, the<br />
converse is also true—being happy<br />
enhances our creativity (Baas et al<br />
2008; Davis 2009).<br />
An abundance of artists,<br />
including Māori carvers and<br />
weavers, painters, photographers,<br />
poets, fiction and non-fiction<br />
writers, cinematographers and<br />
musicians, have drawn inspiration<br />
from New Zealand landscapes<br />
and wildlife. For painters such as<br />
Charles Heaphy, Walter Buller,<br />
Rita Angus, William Sutton,<br />
Colin McCahon, Don Binney,<br />
Nigel Brown, Raymond Ching,<br />
Grahame Sydney and Brent<br />
Wong; photographers such as<br />
Craig Potten and Andris Apse;<br />
cinematographers such as Jane<br />
Campion and Peter Jackson;<br />
poets such as Hone Tuwhare, James K. Baxter, Brian Turner and David Eggleton; writers such<br />
as Janet Frame, Keri Hulme, Owen Marshall and Patricia Grace; as well as for everyday New<br />
Zealanders, our natural landscapes and ecosystems provide both opportunity and inspiration<br />
to explore and develop our creative talents. Conversely, it has been argued that when children<br />
lack exposure to nature and opportunities for free unstructured play, their creativity is<br />
impacted (Louv 2005).<br />
Don Binney 1966<br />
Sun shall not burn thee by day nor moon by night<br />
Oil and acrylic on canvas<br />
Auckland Art Gallery Toi o Tāmaki, purchased 1966<br />
The earliest European painters in New Zealand were largely amateurs who composed their<br />
landscape views with certain ideas in mind—images derived from the traditional ways in<br />
which landscapes had been painted in England and Europe (Dunn 2003). Some of the work of<br />
94<br />
http://thetextileblog.blogspot.com/2013/10/the-link-between-nature-and-creativity.html<br />
The nature of wellbeing<br />
81
this period aimed to capture the scenic wilderness landscapes of exceptional beauty, but the<br />
themes of early landscape artists were mainly concerned with the deeds of the settlers and the<br />
progress they had made in bringing civilisation to a new land (Dunn 2003). Later, in the 1870s<br />
and 1880s, grand, large-scale mountain and lake landscape painting flourished (Dunn 2003),<br />
as more artists attempted to capture the majestic beauty of the new country and incorporated<br />
more of the local flora (e.g. cabbage trees Cordyline australis) and fauna—though still with a<br />
slightly European overlay. The creation of truly New Zealand art came later. In his book The<br />
invention of New Zealand: art and national identity 1930–1970, Frances Pound (2009) argued that<br />
New Zealand art did not establish a national identity that was separate from that of England<br />
and Europe until the 1930s. It is significant that during this period, in the work of artists such<br />
as Rita Angus, Rata Lovell Smith and Bill Sutton, depictions of landscapes that could not have<br />
been painted anywhere else appeared for the first time (Pound 2009). New Zealand art only truly<br />
achieved independence when it began to capture the real biodiversity and landscapes of this<br />
country—the tussock grasslands, the mountains, the vegetation and the birds that are only found<br />
in New Zealand.<br />
Of course the European immigrants were not the first artists in New Zealand. The earliest<br />
depictions of New Zealand nature are found in Māori cave drawings, which, alongside geometric<br />
and other patterns, include depictions of extinct moa (Dinornithidae) and the New Zealand eagle<br />
(Harpagornis moorei), as well as fantastic hybrids based on marine creatures such as whales<br />
(Dunn 2003). The kōwhaiwhai patterns painted on the rafters of Māori meeting houses tell the<br />
story of lineage and ancestry through the subtle permutations of line and curve, often based on<br />
the koru, the young curled leaf of a fern plant (Hopper 2010). Various pigments derived from<br />
organic materials provided a palette of black, red ochre and white (Dunn 2003).<br />
The shape of the koru clearly has wide appeal to both designers and consumers—it not only<br />
appears on the tail of our national airline, but it graces everything from jewellery, pottery,<br />
glassware, table mats, clothing and cellphone covers, to sculptures, screen doors and a proposed<br />
flag for the country (in October 2013, Google had over 1000 images depicting different uses of<br />
the koru). Our indigenous biodiversity also inspires other creative expressions—for example,<br />
images of the kiwi and the shell of the paua are fashioned into numerous craftworks that can be<br />
found in every tourist gift store.<br />
Many New Zealand writers have also used landscape and wilderness to give setting and<br />
atmosphere to their novels and short stories, beginning as early as Erewhon by Samuel Butler<br />
(1872). Natural landscapes and wilderness are important in much of Janet Frame’s writing,<br />
especially in her novel Living in the Maniototo, and in Keri Hulme’s The bone people (1983).<br />
Short story writer and novelist Owen Marshall is another who constantly vignettes landscapes<br />
and small details of nature to create an image of the New Zealand environment in which his<br />
protagonists live (S.J. Payne, Christchurch, pers. comm.); and the New Zealand classic Man<br />
alone by John Mulgan (1939) deals with a rugged individual in a hostile landscape. Indigenous<br />
biodiversity also features strongly in the writing of short story writer and novelist Patricia<br />
Grace, who ‘explores the strength of family connections with place through generations, and the<br />
community’s responsibilities to protect and respect the land’ (Cooper 1998).<br />
New Zealand also has an extensive non-fiction literature describing our unique biodiversity<br />
and wild landscapes. The non-fiction work Nga uruora: the groves of life by Geoff Park (1995),<br />
subtitled Ecology & history in a New Zealand landscape, is also a first class work of literature.<br />
On a more domestic scale, one of the most popular hobbies and the commonest creative outlet<br />
(and source of leisure and exercise) for New Zealanders is gardening 95 . Some gardening is for<br />
food production, meeting subsistence needs, but much is also simply for creative pleasure. Until<br />
95<br />
In the 2007/08 Active New Zealand Survey, gardening was the second most popular activity behind walking. The survey found<br />
that 43% of New Zealanders had gardened in the last 12 months, and during any one week, 28.3% of all New Zealand adults<br />
(929 743 people) participated in gardening at least once (SPARC 2009b). Stress reduction, enhancement of social connections<br />
and capital, and a sense of environmental stewardship among gardeners were documented amongst gardeners in the recent<br />
Dunedin Garden Study (Freeman et al. 2012).<br />
82 The nature of wellbeing
ecently, the selection and use of imported plant species in gardens predominated, but the use<br />
of native plants is becoming increasingly popular, both in domestic gardens and city plantings,<br />
where they are often favoured for their low-maintenance properties. Garden stores and nurseries<br />
are responding by stocking an increasing proportion of native plants and there are growing<br />
numbers of native plant specialists.<br />
The creativity inspired by nature is not limited to arts and crafts, but extends into science,<br />
technology, engineering and business. In his column Made of New Zealand: public conservation<br />
lands can be unique incubators for innovation, Abbott (2013) argued that ‘there is something<br />
about this country that lets us act and think a little differently’. The unique challenges of the<br />
braided rivers of Canterbury, with their unpredictable shallows and ever-changing courses, led Bill<br />
Hamilton, farmer turned engineer living on a high-country station in the Tekapo region, to invent<br />
the jet boat engine, transforming boating around the world. Nearly 60 years on, Hamilton Jet<br />
remains an industry leader, exporting engines around the world from its Christchurch facility with<br />
a team of 300 people (Abbott 2013). It has also been argued that New Zealand has produced some<br />
of the best outdoor gear in the world, because of the ready availability of a multitude of prototype<br />
testing experiences (Abbott 2013). Icebreaker and Snowy Peak are two companies that have taken<br />
the fine fibres grown by tussock-fed merinos and the story of the beautiful, fragile ecosystems of<br />
New Zealand’s high country to create global brands in fashion and outdoor clothing.<br />
The specific characteristics and challenges of our ecosystems and indigenous biodiversity have<br />
provided inspiration for world-leading innovations in science and technology. For example,<br />
because the impacts of humans and the pest species that arrived with them are so recent in<br />
New Zealand, the pre-human state of biodiversity can still be seen in some places in the<br />
landscape, providing a stimulus for developing innovative pest control techniques that are now<br />
in use around the world.<br />
3.8 Identity<br />
The first and most important aspect of New Zealandness … [is] our relationship with the land.<br />
New Zealanders’ sense of self-definition is heavily bound up with love of the natural world. We<br />
share this with Australia, but there’s a twist. Australia has a strongly physical relationship with<br />
the land, needing to have a sense of conquest or control—because their environment can be<br />
hostile and can kill them. With New Zealand’s climate and landscape being rather benign, our<br />
view is apparently more spiritual, even soulful. 96 (Clifton 2010)<br />
Having a strong sense of identity—of ourselves as individuals and in the sense of belonging to a<br />
particular culture, society or place—is a key contributor to wellbeing. It makes us feel distinctive<br />
and special, efficacious and successful, and enhances our self-esteem and sense of worth.<br />
Belonging to groups that provide us with a sense of place, purpose and belonging tends to be<br />
good for us psychologically and can buffer wellbeing when it is threatened (Haslam et al. 2009).<br />
As New Zealanders, our sense of self-definition, and the way<br />
in which we portray ourselves to customers (Adams 2013),<br />
tourists 97 , immigrants (Kalinowski 2013) and the rest of the<br />
world is heavily bound up with our natural world. Though<br />
most of us may live in cities, we call ourselves and our top<br />
horticultural export (kiwifruit) after a native bird, our top sports<br />
teams wear the silver fern, the fern’s koru adorns our national<br />
96<br />
This may be a common sentiment but is debatable – the climate and land may appear benign to those who do not venture<br />
far beyond the cities and towns, but rapid severe weather changes and turbulent rivers and seas regularly endanger and take<br />
the lives of those who are ill-prepared, and ‘breaking in the land’ has been a common phrase in the history of New Zealand’s<br />
agriculture development.<br />
97<br />
www.newzealand.com/int/<br />
The nature of wellbeing<br />
83
airline and hangs around our neck in greenstone, and the heroes we identify with, such as Sir<br />
Edmund Hillary and Sir Peter Blake, were shaped by our rugged mountains or our coastal waters.<br />
For Māori, whakapapa links to particular mountains, waters and resources are fundamental<br />
markers of identity, which remain regardless of where individuals or whānau are domiciled. Many<br />
kiwi parents name their children after native birds, plants and landforms—Dame Ngaio Marsh is<br />
joined by thousands of Tuis, Tussocks and Tarns.<br />
New Zealanders and visitors to New Zealand often remark that one of the main attributes of<br />
the country is its clean green image. Coyle & Fairweather (2005) traced the complex genealogy<br />
of this image. The ‘clean green’ label first emerged in the mid-1980s, around the time that the<br />
Greenpeace vessel, the Rainbow Warrior, was sunk in Auckland Harbour (Sanderson et al. 2003);<br />
however, it probably links back to the major environmental campaigns around Lake Manapouri<br />
and West Coast native forests in the 1970s and 1980s, which instilled a sense of attachment<br />
to New Zealand’s natural heritage and nature in many New Zealanders. Its emergence also<br />
coincided with the passing of a government act that designated New Zealand as a nuclearfree<br />
zone (Sanderson et al. 2003). Coined in the milieu of this nuclear-free status, the image<br />
was quickly utilised as a marketing tool that extended to broader environmental issues.<br />
However, according to Bell (1996), its roots lie earlier, in the complex history of New Zealanders’<br />
relationship with nature and the environment. For early settlers, New Zealand was constructed as<br />
an Arcadia, with artists recreating the romantic, sublime landscape of Europe in this Antipodean<br />
paradise (see Section 3.7). More recently, Cloke & Perkins (1998: 191) noted that ‘newness,<br />
freshness and natural nature’ are crucial aspects of the ‘mental geography’ of New Zealand.<br />
Despite the evident challenges to the veracity of the clean green image, Coyle & Fairweather<br />
(2005) argued that the image of clean green New Zealand is strongly embedded in the cultural<br />
imagination. While it is generally perceived as a temporally distant Utopia, which may be<br />
in a state of becoming or frozen in the safe space of history, it appears that when this Utopia<br />
is threatened (e.g. by particular biotechnologies such as genetic engineering, or by rapid<br />
expansion of dairy farming using irrigation on former dryland regions, leading to concerns about<br />
groundwater pollution and the effects of stock effluent on stream quality and fishing (Prestwood<br />
2001; Morgan 2002)), New Zealanders’ sensitivity to clean and green is heightened in such a way<br />
that New Zealand literally ‘becomes’ just that—and protests against such developments would<br />
seem to be motivated by a desire to retain or improve this image.<br />
In interviews with New Zealanders, Coyle & Fairweather (2005) found that the terms ‘New Zealand’<br />
and ‘clean/green’ were to some extent considered synonymous with one another, suggesting that<br />
this concept is embedded in national consciousness. The clean green idea is associated with an<br />
abundance of accessible natural environment—a cultural imaginary that is pure and unspoilt.<br />
Moreover, this image has a materiality to it, for New Zealand was perceived by participants as a<br />
‘healthy’ place to live and a ‘good place to bring up kids’ (Coyle & Fairweather 2005).<br />
Traditional Māori beliefs, like the beliefs of many indigenous cultures, are centred on the view<br />
that Māori are an intrinsic part of the natural world (Andersen et al. 2012; Box 13); and acceptance<br />
of the role of kaitiakitanga, or guardianship of the land, is also increasingly becoming part of a<br />
Pākehā world view. In a survey of University of Waikato students, Andersen et al. (2012) found no<br />
significant difference between Māori and non-Māori in their responses to various choices about<br />
water quality and management, suggesting that in modern society, the gap between Māori and<br />
non-Māori values may be becoming increasingly blurred.<br />
3.9 Freedom<br />
Max-Neef (1991) defined this need in terms of autonomy, open-mindedness, equal rights, and the<br />
right to dissent, run risks, develop awareness, be different from and experience different settings.<br />
In the literature on subjective wellbeing, autonomy is a central characteristic of the motivational<br />
84 The nature of wellbeing
Box 13—Māori wellbeing and ecosystem services<br />
Ecological systems have played an important role in the survival and development of Māori as a<br />
people, as they have for all societies. However, Māori identity also has more subtle connections with<br />
the land and water, such that ‘Māori aspirations and well-being are interdependent on ecosystems<br />
and ecosystem services’ (Harmsworth & Awatere 2013: 274). The relationships continue to be recited<br />
through ancient waiata/songs and whakataukī/proverbs, which rekindle the breadth and depth of their<br />
engagement with the enveloping ecosphere (Kawharu 2002; Selby 2010).<br />
Māori terms continue to diffuse through the Kiwi lexicon and we increasingly hear kaitiakitanga used<br />
as a default term for environmental guardianship. Māori place names are also being reinstated in some<br />
areas following Treaty settlements. As Ngāti Moki south of Christchurch rename their lake Waihora 98 ,<br />
also known as Te Kete Ika o Rakaihautu or the food basket of Rakaihautu, a founding ancestor,<br />
they evoke the wellbeing that was inherent in what was once—and may be again—a truly bountiful<br />
waterscape. Through this language and its use of whakapapa, we see an encircling genealogical<br />
framework for Māori identity that is linked to their ancestors, particular mountains, rivers and lakes,<br />
and still occupied marae, and which ultimately entwines the surrounding plants and animals—indeed<br />
all environmental features—into an extended whānau. It is this cultural filter for ecosystem services<br />
in Aotearoa/New Zealand that not only offers unique challenges, but also possible pathways to the<br />
resolution of ownership, use, water quality and other issues.<br />
One of the most significant Waitangi Tribunal Reports of the past few years, WAI 262 (also known<br />
as the ‘Flora and Fauna’ claim) described the extent to which mātauranga Māori (knowledge) is<br />
vested in the environment (Waitangi Tribunal 2011). The report laid out, among other things, the<br />
philosophical foundations that inform Māori environmental praxis, including the cultural institutions<br />
that interpret and seek to manage ecosystems through the roles of mana whenua (fundamental and<br />
localised Māori authority), with cultural wellbeing elevated alongside economic, environmental and<br />
broader social wellbeings. The example of rongoā (the traditional medical practices) serve as an<br />
intensely Māori mode of health that encompasses medicinal plants and their preparation, but also<br />
karakia/prayers and the spiritual reflection that seeks to address the cause as well as the symptoms<br />
of illness (Mark 2012). As research continues to identify bioactive compounds that confirm<br />
indigenous ethnobotanical insights (Schauss 2010), a suite of ecological services will be identified,<br />
providing a broader contribution to wellbeing for all New Zealanders.<br />
Despite the growing literature on collaborative environmental management, cross-cultural<br />
communication remains fraught. A Māori participant at a recent hui on sustainable development<br />
argued ‘ecosystem services, it’s separating us from the environment, ‘Come on ecosystems, service<br />
our needs!’ (Challenger 2013: 43). Attempts to describe and quantify iwi-delimited ecosystem<br />
services are expanding through work such as the Ngā Māramatanga-a-Papa/Iwi Ecosystem Services<br />
project between Massey University and Landcare Research (Chrystall et al. 2012; Golubiewski 2012),<br />
which measured the ecosystem services derived from Ngāti Raukawa ki te Tonga territory using a<br />
spatially explicit method enabled by GIS. The preliminary dollar value placed on these ecosystem<br />
services was $967.6 million, with agriculture the most valuable ecosystem type ($432m), and erosion<br />
control and food production the most valuable ecosystem services. However, Māori (and others)<br />
regularly problematise ‘money’; as Sunde (2012) noted, ‘[c]ross-cultural dialogue involves real<br />
people, complex ecosystems, and often competing values’.<br />
Unfortunately, Māori wellbeing and its relationship with ecological systems, however framed, is too<br />
often marginalised and even openly dismissed in the political hurly-burly of modern-day Aotearoa.<br />
However, despite the challenges, Māori continue to recite their belonging, walk their lands, hunt their<br />
forests and fish their waters. There is also mountain biking, hiking, digital photography, parachuting,<br />
bungy jumping—indeed any of the activities that other New Zealanders and visitors seek. Young<br />
urban Māori (who comprise a significant demographic for Māori society) seek greater connections<br />
with their iwi (tribes), hapū (sub-tribes), marae and tūrangawaewae (their places to stand). With the<br />
return of admittedly much-reduced tribal territories, the histories and cultural practices are becoming<br />
reinvigorated, with greater wellbeing enabled through the tangible and intangible components<br />
located within Māori communities (Durie 1998; 2001).<br />
Continued on next page<br />
98<br />
Lake Ellesmere (Te Waihora).<br />
The nature of wellbeing<br />
85
Box 13 continued<br />
Much hope for Māori development is now vested in the rapid growth of a hypothesised Māori<br />
economy (Nana et al. 2011). This economy is particularly notable for its reliance on the primary<br />
sector, with fishing ventures now well established and the current expansion of dairying particularly<br />
important, as might be expected from its dominant role in the wider economy. Of an estimated<br />
Māori asset base of $36.9 billion in 2010, $10.6 billion was vested in Māori Trusts, Incorporations,<br />
Boards, and Iwi or Rūnanga holding companies, some with extensive agri-forestry schemes<br />
beginning with (but not limited to) those pockets of traditional tribal land available to Treaty<br />
settlements (Lambert 2011).<br />
However, although the largest incorporations have book values of hundreds of millions of dollars,<br />
the majority of Māori-owned lands are small, even landlocked, parcels of difficult country. While<br />
this does not diminish their value for identity and enabling cultural wellbeing, the stubbornly<br />
persistent disparities in income, health, education and employment show that better returns from<br />
these resources are needed to close the gaps in a post-settlement context 99 . Innovation is sought<br />
in bioactives, niche foods and flavourings, and modern wines and beers, with indigenous branding<br />
that includes traditional legends and modern designs (Lambert 2004; Chapman-Smith 2012).<br />
All Māori ventures face similar constraints to non-Māori businesses: how to sustainably develop<br />
resources in an environment (ecological as well as political-economic and socio-cultural) that is<br />
non-linear, dynamic and complex, and irredeemably interconnected. Māori-owned cows defecate<br />
as much as Pākehā cows! As some iwi gear up for significant investment in the dairy sector (Ngāi<br />
Tahu may convert up to 16 000 ha of their land into dairy farming), many of their own hapū and<br />
marae are beginning to oppose such expansion due to concerns over the negative impacts on<br />
water quality, mahinga kai (food gathering), biodiversity and recreational use, all of which can<br />
detract from Māori wellbeing.<br />
Modern kaitiakitanga must be cognisant of culturally appropriate mechanisms for responding<br />
to any ecological issues, be they natural hazards, climate change, sea-level rise, etc. If Māori<br />
wellbeing is a long-term strategic goal for this country, and Māori culture is to be retained, then<br />
national and regional ecologies must be conceptualised through an ecosystem services lens that<br />
includes Māori values and valuations.<br />
theory known as ‘Self Determination Theory’ (SDT) (Deci & Ryan 1985, 2000; Ryan & Deci 2000)<br />
(also, see Appendix 1), which posits three basic psychological needs: autonomy, competence and<br />
connectedness. Research has shown that environments, including natural environments, that<br />
provide for and support fulfilment of these needs result in greater wellbeing (Ryan & Deci 2000).<br />
The high proportion of New Zealand that is retained as freely accessible natural ecosystems<br />
provides New Zealanders with more freedom than most nationalities to both explore and test<br />
themselves in the natural environment. Access to the coastline is a free right of citizens (and<br />
visitors) 100 , and access to parks and reserves is a ‘free’ public good. This means that there<br />
are equal rights to use and benefit from these spaces, creating greater equality than if areas<br />
of foreshore could be privately owned or if people had to pay for access to parks. However,<br />
inequality of income limits some New Zealanders’ access to the natural estate, particularly those<br />
parts that require extended travel or costly equipment to explore safely.<br />
Feeling free to ‘head to the hills’ or to the beach is an established part of the New Zealand psyche,<br />
and in the designated wilderness areas, there is also freedom from intrusion of the sounds and<br />
trappings of our industrialised society. Most true wilderness experiences are essentially nonutilitarian<br />
and provide intense, positive, intrinsically enjoyable experiences to participants<br />
(Arnould & Price 1993). Concepts that characterise the nature of such experiences include<br />
extraordinary experience (Abrahams 1986; Arnould & Price 1993), flow (Csikszentmihalyi 1975,<br />
1990) and the Adventure Model (Ewert & Hollenhorst 1989, 1994). Embodied in these concepts<br />
99<br />
P. Sharples, Speech to Maori Economic Workshop, 2009.<br />
100<br />
An exception is where there are restrictions for health, safety or security/defence reasons, e.g. limited areas of most ports.<br />
86 The nature of wellbeing
Kelly Range. Photo: Rod Hay.<br />
are the experiential qualities of clear<br />
focus and extreme concentration;<br />
merging of action and awareness;<br />
spontaneity of action; personal<br />
control and awareness of power;<br />
intense enjoyment; and perhaps<br />
transcendence of self as congruency<br />
is found between the challenges<br />
inherent in the activity and one’s<br />
abilities to respond competently<br />
to those challenges (Ewert &<br />
Hollenhorst 1997). Going beyond the<br />
traditional set of benefits ascribed<br />
to leisure experiences (e.g. physical<br />
exercise), adventure and wilderness<br />
experiences have both been<br />
described as a means of crystallising<br />
selfhood through personal testing, providing life meaning and perspective, conferring awareness<br />
of one’s own mortality, reducing anxiety, and improving fear-coping mechanisms (Abrahams<br />
1986; Ewert 1988; Ewert & Hollenhorst 1989; Arnould & Price 1993). Many recreational activities in<br />
the natural environment involve a deliberate seeking of risk and adventure, as a means of testing<br />
and challenging oneself—although a study on the motivations for high-altitude mountaineering<br />
at Mt McKinley National Park, Alaska, found that exhilaration, excitement and accomplishment<br />
were much stronger motivators than risk (Ewert 1994).<br />
A critical element in both adventure and wilderness experiences is interaction with the<br />
natural environment. Remote and natural settings imply less availability of outside aid and<br />
corresponding increases in the need for self-sufficiency, leading to a heightened sense of<br />
consequence and awareness (Ewert & Hollenhorst 1997). An important difference between the<br />
two concepts is that while interaction with pristine natural environments is generally considered<br />
a prerequisite to satisfying wilderness experiences, such interactions are only accessory to<br />
many adventure recreation experiences. In fact, adventure experiences are commonly pursued<br />
in relatively developed or urban settings. Examples include whitewater boating through urban<br />
areas, rock climbing on crags located adjacent to roadways and parking lots, or ice climbing in<br />
quarry sites (Ewert & Hollenhorst 1997).<br />
Our indigenous ecosystem services also provide us with another sort of freedom—the income we<br />
earn from our natural capital contributes to the freedom to explore our own country and the rest<br />
of the world.<br />
3.10 Material wealth<br />
This section examines the contribution of nature’s services to the income and material wealth<br />
of New Zealand and New Zealanders. Max-Neef (1991) did not consider material wealth as one<br />
of our fundamental needs, but for most of us wealth is an important means to meeting at least<br />
some of those needs (e.g. food, shelter, clothing). Material wealth is also encompassed within the<br />
MEA’s wellbeing element ‘Basic material for good life, such as secure and adequate livelihoods,<br />
enough food at all times, shelter, clothing, and access to goods’ (MEA 2005b). Income beyond<br />
that required to meet our basic needs allows us to purchase a range of consumer goods, comforts<br />
and experiences.<br />
In our modern society, we produce very few of these material goods for ourselves. Therefore,<br />
for most New Zealanders, income-generating employment not only helps us to satisfy our need<br />
for participation and identity, and (hopefully) gives us work of meaning (see Section 2.2), but<br />
The nature of wellbeing<br />
87
also generates income to satisfy our need for food, clothing, shelter, etc. However, some of our<br />
needs, including non-material needs, such as health, understanding and protection, are mainly<br />
met through satisfiers we fund collectively, such as healthcare, education and the police force.<br />
Earning income (by our labour or investments) allows us to contribute our share (e.g. via taxes) to<br />
the cost of these. It is also clear that a level of security of income reduces our stress and enhances<br />
our sense of wellbeing (Defra & National Statistics 2007; De Witte 2009; Miron-Shatz 2009).<br />
Happiness research suggests, however, that beyond a certain income, the happiness returns on<br />
more income steadily taper off—and furthermore, that a focus on material goods is actually linked<br />
with decreased wellbeing (see Section 2.2). Having said this, many, if not most, New Zealanders<br />
equate higher levels of consumption of goods and services, and growth in measures such as<br />
income and GDP, with success and increased happiness. The reality is that, as a society, we are<br />
using goods and services provided by nature to gain material wealth beyond the level needed<br />
to satisfy Max-Neef’s nine fundamental needs, and continue to do so even when we move into<br />
very low or negative happiness returns. However, unbundling ‘necessary’ consumption from<br />
‘excessive’ consumption is a task that as a society we do not have the experience, tools or even<br />
language yet to do. It is not within the scope of this work to identify which nature-dependent<br />
income-generating activities on balance contribute to wellbeing and which may impose<br />
ecosystem costs that exceed their wellbeing benefits. We simply note that it cannot be assumed<br />
that all income-generating activities add to wellbeing and that this is a subject for debate—a<br />
debate we believe it is important for our society to have.<br />
Given the global concern that our planet cannot support everyone living at the current per capita<br />
consumption levels of western nations, and that the pressures on ecosystem services are going<br />
to increase with increasing population and climate change, it is important that we consider the<br />
extent to which different aspects of our consumption contribute to our wellbeing.<br />
Throughout this chaper, there have been examples of the various ways (including economic) that<br />
ecosystem services, particularly those delivered by indigenous biodiversity, contribute to our<br />
wellbeing. The remainder of this section will focus on the economic contributions.<br />
3.10.1 Employment opportunities and ecosystem services<br />
Employment contributes to our wellbeing in several ways (Box 14). New Zealand’s natural<br />
ecosystems, indigenous biodiversity and/or protected areas directly provide many employment<br />
opportunities in fields such as outdoor education, science and research, fisheries, conservation<br />
operations, sport and recreation, eco- and adventure tourism, and other commercial uses of<br />
public conservation areas such as sphagnum moss collection (West Coast) and mining (e.g. see<br />
Butcher Partners Ltd 2004, 2005, 2006a, b; DOC 2006a, b, 2007; Wouters 2011; and earlier sections<br />
of this section). There are also flow-on effects, such as to other tourism-related industries<br />
(e.g. accommodation, and food and beverages; see Statistics New Zealand 2013: appendix 4).<br />
In the year ended March 2013, the tourism industry directly provided 5.7% of total employment<br />
(110 800 FTEs) in New Zealand (MBIE 2013b; Statistics New Zealand 2013). The contribution of<br />
public conservation land to tourism employment opportunities has been estimated for several<br />
areas in New Zealand, including Tongariro National Park, where tourism concessions were<br />
estimated to have generated about 14% of the Ruapehu-Taupo region’s tourism employment<br />
in 2004/05, and Fiordland National Park, where they represented nearly 10% of Southland’s<br />
tourism employment (Wouters 2011). Similarly, economic activities that were related to public<br />
conservation land made a significant contribution to both employment (15%) and household<br />
income (13%) within the West Coast Region in 2003 (DOC 2006a).<br />
Other industries that provide a significant number of employment opportunities in New Zealand<br />
are also supported by ecosystem services. For example, the agriculture, forestry and fishing<br />
industry accounted for 5.6% of total employment in New Zealand at February 2013 (Statistics<br />
New Zealand Business Demography Statistics 101 ). Tourism and the agriculture, forestry and<br />
fishing industries are discussed in greater detail in Section 3.10.2.<br />
101<br />
Business demography statistics were extracted on 15 April 2014 from http://nzdotstat.stats.govt.nz/wbos/<br />
88 The nature of wellbeing
Box 14—Employment and Wellbeing<br />
Employment contributes to our wellbeing in several ways. Firstly, it is one of the most common<br />
means of generating income (New Zealand Treasury 2011), and this income in turn provides a<br />
means to personally satisfy many of our needs for food, clothing, shelter and other material goods.<br />
For example, Brown et al. (2010) showed that not owning a home had a negative impact on the life<br />
satisfaction of New Zealanders. However, some of our needs (including non-material needs), such as<br />
health, understanding and protection, are mainly met through satisfiers we fund collectively, such as<br />
healthcare, education and the police force. Earning an income (by our labour or investments) allows<br />
us to contribute our share (e.g. via taxes) to the cost of these.<br />
Employment brings other benefits besides the living standard benefits associated with income (New<br />
Zealand Treasury 2011). It affects our wellbeing by contributing to our sense of identity, promoting<br />
self confidence, giving us the ability to participate in voluntary economic exchanges and providing<br />
opportunities for social engagement (New Zealand Treasury 2011). Secure employment also gives us<br />
a feeling of financial security, which enhances our wellbeing (Defra & National Statistics 2007), while<br />
job insecurity reduces psychological wellbeing and job satisfaction, and increases psychosomatic<br />
complaints and physical strains (De Witte 1999). For example, Miron-Shatz (2009) showed that, for<br />
American women, financial security is of similar importance to life satisfaction as monetary assets,<br />
but that having financial concerns lowers life satisfaction. Also important for life satisfaction and a<br />
key contributor to wellbeing is having a job that is satisfying or provides ‘work of meaning’ (Brown<br />
et al. 2010; Steger et al. 2012). If we are lucky, our employment allows us to feel that we are doing<br />
meaningful work. However, not all paid work feels meaningful and not all meaningful work is paid—<br />
many people gain great satisfaction and a feeling that they are making a worthwhile contribution<br />
by engaging in voluntary work; and many studies suggest that people who volunteer more are<br />
psychologically happier and healthier, are physically healthier, and may even live longer (Borgonovi,<br />
2009; Grimm, Spring, & Dietz, 2007; Post, 2007). Brown et al. (2010) found the converse was also<br />
true—that not doing volunteer work has a negative impact on life satisfaction.<br />
Unsurprisingly, Brown et al. (2010) also found that unemployment has a strong negative effect on<br />
life satisfaction, which is consistent with international research that shows that unemployment has a<br />
large negative impact on subjective wellbeing (Deiner 2008; Winkelmann 2009). This is not only due<br />
to a loss of income, but also because it leads to a reduced locus of control, feelings of helplessness<br />
(Winkelmann 2009), a loss of the social relationships associated with work (Brown et al. 2010), and<br />
lower psychological and physical health (McKee-Ryan et al. 2005). Paul & Moser (2009) also found<br />
that unemployment was associated with depression, anxiety, symptoms of distress, low self-esteem<br />
and lower subjective wellbeing. However, the strength of the effect of unemployment on subjective<br />
wellbeing can also be influenced by other factors—for example, if others in your reference group<br />
are unemployed, unemployment does not reduce wellbeing as much, whereas if everyone in your<br />
peer group has a job but you do not then unemployment reduces subjective wellbeing much more<br />
(Winkelmann 2009). Men and people with blue-collar-jobs may also find unemployment more<br />
distressing than women and people with white-collar jobs (Paul & Moser 2009).<br />
3.10.2 New Zealand’s economy and ecosystem services<br />
New Zealand’s economic wealth is heavily dependent on our natural environment and<br />
indigenous biodiversity. This is particularly true because the primary sector (including<br />
agriculture, mining, forestry and fisheries) and tourism make significant contributions to the<br />
country’s economic activity (New Zealand Treasury 2011). In addition, most electricity, which is a<br />
critical input to most industries, is generated from natural resources. There are also opportunities<br />
to make commercially-and scientifically important discoveries (e.g. see Section 3.2.5).<br />
Energy production, commodity exports and tourism are discussed below as examples of how<br />
ecosystem services contribute to New Zealand’s economy.<br />
The nature of wellbeing<br />
89
Energy<br />
In 2011, the majority (77%) of New Zealand’s electricity generation came from renewable sources<br />
such as hydro, geothermal, wood and wind (MED 2012). Renewable energy also made a large<br />
contribution (39%) to New Zealand’s Total Primary Energy Supply, which is the total amount of<br />
energy supplied for all uses in New Zealand—i.e. domestic production plus imports, less exports<br />
and energy used for international transport (MED 2012). In some places, energy generation is<br />
dependent on indigenous biodiversity. For example, one of the uses of water from Te Papanui<br />
Conservation Park, which protects large tracts of indigenous grasslands, is hydro-electricity<br />
generation, worth $31 million (net present value of water in 2005) (Butcher Partners Limited<br />
2006a; DOC 2006b). Healthy stands of indigenous upland snow tussock grasslands, such as<br />
those found in this park, have been shown to yield more freshwater than any alternative land use<br />
assessed to date (Mark et al. 2013). This is at least partly due to their particular leaf anatomy and<br />
physiology, which minimises water loss via transpiration (Mark et al. 2013).<br />
Commodity exports<br />
In the year ended 30 June 2013, 13 of our top 20 commodity exports, accounting for 78.7% of<br />
the income generated from these top 20 commodity exports 102 , originated at least in part from<br />
biologically based sectors such as agriculture, horticulture, viticulture, forestry and fisheries 103 .<br />
These industries depend heavily on functioning, intact ecosystems, both for the production of<br />
goods (e.g. water supply, soil formation, nursery grounds provided by marine reserves and estuaries<br />
for fisheries, climate regulation) and for reducing their impacts (e.g. water purification services<br />
provided by riparian vegetation). The mānuka honey industry is a good example of an industry<br />
that is directly reliant on an indigenous species. Mānuka honey is the product of an interaction<br />
between an exotic insect (honey bee) and an indigenous shrub (mānuka). Because of its proven<br />
health benefits, it is sold at a significant premium to other honeys (MBIE 2012), with the medicinal<br />
mānuka honey industry being worth around $75 million and acting as a driver for the growth of<br />
the total New Zealand honey industry (MBIE 2012). Another example is the water provided by<br />
natural ecosystems (e.g. indigenous tussock grasslands) to support agricultural production. For<br />
example, water used to irrigate Taieri farms from Te Papanui Conservation Park has been valued at<br />
$12 million (net present value in 2005) (Butcher Partners Limited 2006a; DOC 2006b).<br />
New Zealand’s ‘clean green’ image, which depends upon our natural landscapes and unique<br />
indigenous biodiversity, is also likely to contribute to the success of many of our export<br />
industries. For example, the Ministry for the Environment (MfE 2001) found that under worsened<br />
environmental perceptions, the average consumer would purchase 54% less New Zealand dairy<br />
products, amounting to an annual loss of $241–569 million. Ultimately, the scale of lost income<br />
will depend on how much of the lost revenue can be redirected towards the purchase of products<br />
where a clean environment plays a less critical role in achieving price premiums and consumer<br />
purchasing choice.<br />
Tourism<br />
The tourism industry generates similar export earnings to dairy (see Section 3.6). In the year<br />
ended March 2013, its export earnings were worth $9.8 billion (MBIE 2013b; Statistics New Zealand<br />
2013). The value of tourism associated with New Zealand’s ‘clean green’ image, natural landscapes<br />
and natural settings, unique indigenous flora and fauna, and the conservation management of its<br />
natural heritage contributes to the success of its tourism ‘product’ and the 100% Pure New Zealand<br />
brand under which it is promoted (see Simmons 2013). Research has shown that:<br />
1. The natural environment is important to international visitors 104 ;<br />
102<br />
www.nzte.govt.nz/en/invest/statistics/#toc-exports-top-20-commodities<br />
103<br />
Out of the top 20 export commodities, the following were classed as originating at least in part from biologically based sectors:<br />
milk powder, butter and cheese; meat and edible offal; logs, wood and wood articles; fruit; fish, crustaceans and molluscs; wine;<br />
preparations of cereals, flour and starch; casein and caseinates; miscellaneous edible preparations; wool; wood pulp and waste<br />
paper; raw hides, skins and leather; textiles and textile articles.<br />
104<br />
www.tourismnewzealand.com/markets-and-stats/research/visitor-experience-monitor-201112/<br />
90 The nature of wellbeing
2. The majority (70%) of all international trips to New Zealand contain nature-based activities<br />
(Simmons 2013; Ministry of Tourism 2009b); and<br />
3. Some visitors would not visit certain areas (e.g. West Coast) if they were unable to view and<br />
use Public Conservation Land (e.g. Butcher Partners Ltd 2004).<br />
In addition, the Ministry for the Environment (MfE 2001) found that under worsened<br />
environmental perceptions, the annual loss to the New Zealand economy from the top five<br />
inbound international tourism markets would be $530–938 million (depending on whether lost<br />
wages and GST effects were taken into account) due to a reduction in the length of visitors’ stay.<br />
3.10.3 Avoided costs and ecosystem services<br />
Many ecosystem services do not provide material goods or services that we can sell or trade, but<br />
they do result in financial savings, and thereby contribute to New Zealand’s material wealth. This<br />
includes the avoidance and replacement costs associated with many regulating services, such<br />
as erosion control provided by indigenous woody vegetation (e.g. Dymond et al. 2010), water<br />
filtration services provided by indigenous riparian vegetation (e.g. Winkworth et al. 2010), and<br />
the flood control and water regulation services provided by wetlands. An example of the latter<br />
is Whangamarino Wetland, which is known to promote a reliable supply of water for farmland<br />
irrigation during dryer periods, but reduces flooding during peak flows (DOC 2007). Consequently,<br />
its water storage function has led to avoided costs in public works and reduced damage to<br />
surrounding farmland during large floods (DOC 2007). In addition, its ability to provide water<br />
Table 6. Selected social indicators relating to material wealth. (Data sourced from OECD 2014.)<br />
New Zealand OECD average Difference (%)<br />
Annual disposable household income (US$) 26,600 23,100 15.2<br />
Unemployment rate (%) 6.4 9.1 –29.7<br />
Relative poverty (%) 10.3 11.3 –8.8<br />
Share of people reporting not enough money to<br />
buy food (%)<br />
17.2 13.2 30.3<br />
Public social spending 22.2 21.9 1.4<br />
to surrounding farmland during dry periods has led to avoided costs associated with decreased<br />
production and/or other means of accessing water. For additional examples, see Section 3.2.<br />
3.10.4 Risks to economic wealth in New Zealand<br />
In general, New Zealand is doing fairly well compared to other OECD countries in terms of<br />
material wealth (see Table 6). New Zealand is the only OECD country that enjoys a first world<br />
standard of living based on working directly with natural systems that are based on sunshine,<br />
water, plants, animals, microorganisms and wonderful landscapes. Our skill at producing<br />
high-class products and experiences based on our natural endowment of a benign climate and<br />
stunning scenery has been our competitive advantage (see MfE 2001).<br />
However, it is important to remember that our economic wealth is underpinned by ecosystem<br />
services, and that these services, and consequently our access to material goods, can be impacted<br />
when ecosystems are subject to change (MEA 2005b). Given that New Zealand’s indigenous<br />
biodiversity is in decline and that natural ecosystems continue to degrade (see Chapter 1), we<br />
cannot be complacent and assume that these services will indefinitely continue contributing to<br />
our wealth at current levels. Some of these changes have already had negative economic impacts.<br />
For example, the deliberate and accidental introduction of many exotic species, which have<br />
now become pests, is very costly to the New Zealand economy. In 2008, the estimated annual<br />
The nature of wellbeing<br />
91
expenditure (including GST) on pest management was about $41 million by regional councils and<br />
$337 million by central government (Giera & Bell 2009), while on-farm weed and pest control for<br />
the private sector (including households) was estimated to be $458 million (Giera & Bell 2009).<br />
Our awareness of these risks can be hampered if our current wealth insulates us, at least<br />
temporarily, from the effects of declining ecosystems—i.e. local changes in ecosystems may not<br />
significantly inhibit access to material goods for those who can afford to purchase these goods<br />
from other locations, particularly if their cost is subsidised by governments (MEA 2005b). There<br />
is a risk, therefore, that New Zealanders may not come to realise the full consequences to their<br />
wellbeing of environmental degradation and biodiversity decline until the situation has become<br />
irreversible, or at the least very costly and difficult to overturn (see Section 3.2.3).<br />
The continuation of our country’s material wealth and economic prosperity should not be<br />
taken for granted and it is essential for our continued economic welfare that we, as a nation,<br />
fully recognise our dependence on nature. If we fail to recognise this, and continue to tolerate<br />
environmental degradation and biodiversity declines, our reputation for a clean and healthy<br />
environment is likely to become damaged. This is likely to have unwanted consequences to our<br />
economic prosperity and personal wellbeing.<br />
92 The nature of wellbeing
4. How do we measure the contribution of<br />
ecosystem services?<br />
Thus far, this report has focussed on the interface between ecosystem services and wellbeing—<br />
we have discussed (i) what constitutes wellbeing, and (ii) how ecosystem services contribute to<br />
the satisfaction of Max-Neef’s nine fundamental needs. However, the question remains as to how<br />
all contributors to human wellbeing, including ecosystem services, can be effectively and fairly<br />
incorporated into decision-making. This is particularly important given that making decisions<br />
about the use, protection and changes in the management of resources requires society to<br />
make some difficult trade-offs, as enhancement of some types of ecosystem services can harm<br />
others. One way to inform ecosystem management decisions is to assess the relative value of the<br />
different ecosystem services that are provided under alternative scenarios, either qualitatively or<br />
quantitatively.<br />
4.1 Valuation—monetary and non-monetary<br />
By definition, ecosystem services are the benefits humans receive from ecosystems, but the<br />
people living within a given area are likely to differ in how they value different ecosystem<br />
services or aspects of those services and will use different scales and conceptual models to<br />
express those values. To understand the overall value of services in an ecosystem therefore<br />
requires some way of eliciting from all stakeholders (present and future) how and how much they<br />
value the services. Investigating the social values of ecosystem services is a relatively recent<br />
phenomenon, and typically includes involving different stakeholder groups for different ends, by<br />
different means and in different project phases (Spangenberg 2014 105 ). One method for assessing<br />
the different values is Multi Criteria Analysis (MCA) which includes a variety of nonmonetary<br />
valuation techniques (including software) and allows for consideration of different criteria. These<br />
can then be ranked using a weighting system (‘vertical’ MCA, where the individual or agency<br />
deciding the weighting effectively usurps the role of decision-maker) or left unweighted and<br />
unranked (horizontal MCA), which offers a more levelled playing field as the basis of ongoing<br />
dialogues and debates (Spangenberg 2014).<br />
More established are a range of monetary valuation methods, particularly using non-market<br />
valuation, though these remain contentious due to differing categorisations and interpretations<br />
of sources of value (Fish et al. 2011; Sagoff 2011), or rejections of the moral implications of<br />
valuation or the underlying theory of valuation (Parks & Gowdy 2013).<br />
A recent paper by Kallis et al. (2013) ‘To value or not to value? That is not the question’<br />
concluded that there are biophysical, political, and ethical limitations to monetisation, and that<br />
monetary valuations are not isolated phenomena of methodological interest, but part of broader<br />
commodification processes, which involve symbolic, institutional, intellectual, discursive, and<br />
technological changes that reshape the ways humans conceive and relate to nature. Rather than<br />
asking ‘to value or not to value’, they propose a reformulation of the question into ‘when and how<br />
to value with money?’ and ‘under what conditions?’ They recommend four criteria for a sound<br />
choice: environmental improvement, distributive justice and equality, maintenance of plural<br />
value-articulating institutions and confronting commodification of nature.<br />
In the remainder of this chapter, we discuss the range of economic valuation techniques<br />
(monetary and non-monetary, market and non-market) which can be used to allow ecosystem<br />
services to be considered in decision-making, management and policy-making alongside other<br />
contributors to wellbeing.<br />
105<br />
www.biomotivation.eu/conference2014/presentations/Joachim%20Spangenberg%20-%20Expressing%20the%20nonmonetary%20values%20of%20ecosystem%20services.pdf<br />
The nature of wellbeing<br />
93
4.2 The role of monetary valuation<br />
The debate over the appropriateness of monetary valuation has not prevented the widespread<br />
application of valuation techniques. For example, the UK NEA study (Bateman et al. 2011a:<br />
1068) stated that ‘It is clear that a body of theoretically sound methodologies now exists for the<br />
valuation of most (if not all) ecosystem service flows … This methodology is consistent with the<br />
Conceptual Framework of the UK National Ecosystem Assessment.’<br />
Many ecosystem services are measured in monetary terms by way of transactions occurring<br />
in markets. However, not all ecosystem services are traded in markets. For example, scenic<br />
amenities, recreation and the existence of endangered species typically are not associated with<br />
markets, and do not have prices or values associated with them in the marketplace. It is these<br />
types of services that non-market valuation attempts to measure, to allow them to be assessed<br />
from an economic perspective when making decisions about things such as resource use policies<br />
and environmental management rules.<br />
TEEB (2011: section 4.2.3) identified that non-market valuation is already being used to:<br />
••<br />
Help determine where ecosystem services can be provided at lower cost than man-made<br />
technological alternatives<br />
••<br />
Communicate the need for and influence the size of payments for ecosystem services (PES)<br />
••<br />
Evaluate damage to natural resources to determine appropriate compensation<br />
••<br />
Create political support for designing new fiscal instruments<br />
••<br />
Set entry fees<br />
••<br />
Inform impact assessments of proposed legislation and policies<br />
••<br />
Reveal the relative importance of different ecosystem products<br />
Laurans et al. (2013) reviewed the uses of ecosystem service values under three broad<br />
categories: Decisive—use for a specific decision; Technical—use for design of an instrument; and<br />
Informative—use for decision-making in general. Specific uses under these categories are broadly<br />
similar to those outlined in TEEB (2011).<br />
A pragmatic perspective on the role of valuation is provided in the preface to TEEB (2010b: 3):<br />
Valuation is seen not as a panacea, but rather as a tool to help recalibrate the faulty economic<br />
compass that has led us to decisions that are prejudicial to both current well-being and<br />
well-being of future generations. The invisibility of biodiversity values has often encouraged<br />
inefficient use or even destruction of the natural capital that is the foundation of our economies.<br />
The TEEB report also commends a tiered approach to managing ecosystem services, first<br />
requiring the recognition of value 106 , followed by the demonstration of value and finally the<br />
capturing of value. Economic valuation contributes to the demonstration of value, providing<br />
support for policies and actions that promote value capture.<br />
A cautionary tone is adopted in TEEB (2011: section 4.2.4):<br />
Overall, there are clearly reasons for optimism about using non-market valuation techniques for<br />
the valuation of ecosystem services. The thousands of studies already undertaken have led to<br />
considerable practical progress. However, valuation needs to be used judiciously. It is only one<br />
of many inputs into decision-making, given the complexity of the underlying ecosystem services<br />
that are being valued. In view of current constraints on quantification and valuation, we need<br />
to see economic assessment as a tool to guide biodiversity protection, not as a precondition for<br />
taking action.<br />
Monetary valuation can be both expensive and time-consuming, so may not be appropriate<br />
for decisions that must be made in a short timeframe or where the magnitude of changes in<br />
ecosystem service values is likely to be small in relation to the costs of undertaking a valuation<br />
study and is not incremental.<br />
106<br />
Also referred to as ‘Identifying issues and assessing services’.<br />
94 The nature of wellbeing
4.3 Defining and categorising ecosystem services<br />
Before we can begin to estimate the value of different ecosystem services, we need clarity about<br />
what exactly it is that we are valuing. Over the last 17 years, numerous definitions of ecosystem<br />
services have been provided, and numerous frameworks for categorising and valuing the<br />
different types of services have been developed. This lack of consistency in terms, definitions and<br />
classifications has hindered the study and application of ecosystem services (Nahlik et al. 2012),<br />
and so there is a growing literature assessing these definitions of ecosystem services, comparing<br />
and developing ecosystem service frameworks, and evaluating ecosystem service valuation<br />
methods (Wallace 2007, 2008; Costanza 2008; Fisher et al. 2009; TEEB 2010b; Turner et al. 2010;<br />
Bateman et al. 2011a, b; Braat & de Groot 2012; Farley 2012; Nahlik et al. 2012; Ojea et al. 2012;<br />
Laurans et al. 2013). Nahlik et al. (2012) arrived at six characteristics that are necessary for an<br />
operational framework, including the need for it to be transdiscplinary and policy-relevant.<br />
However, their analysis of 11 prominent frameworks showed that all had issues associated with<br />
them—with the most favourable under their assessment criteria being that of Maynard et al. (2010).<br />
Alternative definitions of ecosystem services and classifications of the value of ecosystem<br />
services, as adopted by a variety of authors, have been compiled by Ojea et al. (2012) and are<br />
summarised in Table 7. All of the definitions are consistently anthropogenic, focusing on benefits<br />
to people. Daily’s (1997) definition differs from the others by defining ecosystem services as<br />
‘conditions and processes’, whereas three of the definitions (MEA 2005a; Wallace 2007; UK NEA<br />
2011) identify ecosystem services as ‘benefits’ and two (Boyd & Banzhaf 2007; Fisher et al. 2009)<br />
identify them as ‘aspects or components’ of the environment that lead to human wellbeing. Such<br />
conflicting definitions are not helpful when attempting a synthesis of all existing analyses, as<br />
researchers addressing the same issue may have had quite different concepts in mind, and these<br />
differences are also reflected in what each analyst has valued—for example, the valuation of goods<br />
by the UK NEA compared with the valuation of inputs by Daily (1997).<br />
The concept of ecosystem services has raised awareness of the connectedness of nature with<br />
humanity, and the complexity of the system, and thus serves an extremely important purpose.<br />
However, the concept has not yet been developed to a point of universal acceptance or consistent<br />
use of terms, and continues to provide challenges for the analysis of environmental policies.<br />
That does not prevent it from being used to frame analyses, but does indicate the importance of<br />
reporting results in a manner that clarifies the process and the relevance of outcomes.<br />
Table 7. Different classifications of ecosystem services (modified from Ojea et al. 2012: table 1).<br />
Note: The category in which economic valuation is performed under each classification is highlighted in bold.<br />
Source Daily (1997) MEA (2005a) Boyd & Banzhaf<br />
(2007)<br />
Wallace<br />
(2007)<br />
Fisher et al.<br />
(2009)<br />
UK NEA (2011)<br />
Definition of<br />
ecosystem<br />
services<br />
The conditions<br />
and processes<br />
through<br />
which natural<br />
ecosystems, and<br />
the species that<br />
make them up,<br />
sustain and fulfil<br />
human life<br />
Benefits people<br />
obtain from<br />
ecosystems<br />
Components of<br />
nature that are<br />
directly enjoyed,<br />
consumed or used<br />
to yield human<br />
wellbeing<br />
Benefits people<br />
obtain from<br />
ecosystems<br />
Aspects of<br />
ecosystems<br />
that are utilised<br />
(actively or<br />
passively) to<br />
produce human<br />
wellbeing<br />
Benefits people<br />
obtain from<br />
ecosystems<br />
Classifications<br />
and value of<br />
ecosystem<br />
services<br />
Production<br />
inputs<br />
Sustenance of<br />
plant and animal<br />
life<br />
Provision of<br />
existence and<br />
option values<br />
Cultural<br />
Provisioning<br />
Regulating<br />
Supporting<br />
Intermediate<br />
components<br />
Services<br />
Benefits<br />
Processes<br />
Ecosystem<br />
services<br />
Benefits<br />
Abiotic inputs<br />
Intermediate<br />
services<br />
Final services<br />
Benefits<br />
Ecosystem<br />
process /<br />
intermediate<br />
services<br />
Final ecosystem<br />
services<br />
Goods<br />
Wellbeing value<br />
The nature of wellbeing<br />
95
4.4 Conceptual principles and frameworks for valuation<br />
It is also important to clearly define the principles guiding any valuation. Pearce et al. (2006: 175)<br />
identified the following requirements for successful ecosystem valuation:<br />
••<br />
Identifying ecosystem services and products in a context where we are usually uncertain<br />
about how ecosystems behave and what they ‘do’.<br />
••<br />
Focusing on marginal or discrete changes, rather than the value of the ‘total ecosystem’<br />
(see Section 4.3.1 below).<br />
••<br />
Determining the degree of irreversibility in ecosystem change.<br />
••<br />
Establishing the geographical scope of the benefits generated, from local to global.<br />
••<br />
Establishing the property rights regime for the resource in question.<br />
••<br />
Valuing the products and services as if they are independent of each other.<br />
••<br />
Analysing, in simplified form, the interactions between services to see, as far as possible,<br />
how this might modify the ‘sum of independent values’ approach.<br />
Turner et al. (2010: 96) argued for a ‘sequential analytical process which encompasses’:<br />
1. The spatial context of ecosystem service provision and beneficiaries<br />
2. Appropriate application of the concept of marginal analysis<br />
3. Avoidance of the double-counting trap (see Section 4.3.2 below)<br />
4. As far as is feasible, a comprehensive understanding of the underlying biophysical<br />
relationships so that non-linearities may be identified<br />
5. Full consideration of possible threshold effects<br />
Bateman et al. (2011a: section 22.2.2) echoed many of the themes raised by both Pearce et al.<br />
(2006) and Turner et al. (2010), reinforcing that ‘one of the most serious problems facing effective<br />
and robust valuation of ecosystem services is that there are gaps in our understanding of the<br />
underpinning science relating those services to the production of goods’.<br />
4.4.1 Total and marginal ecosystem service values<br />
Attempts to estimate the value of global ecosystem services (e.g. Costanza et al. 1997; de Groot<br />
et al. 2012) 107 have met with many criticisms relating to two different aspects—the validity of the<br />
estimated value magnitudes 108 and the relevance of the estimates to policy. However, estimates of<br />
the value of total ecosystem services—usually a very large number—underscore the importance of<br />
nature, and can be helpful in communicating to lay audiences why we should respect nature and<br />
make more effort to protect the ecosystem services it provides.<br />
Policy makers are not usually facing decisions that will result in the loss of all ecosystem<br />
services, however, and so for them the total value is not helpful either for evaluating specific<br />
projects or for carrying out strategic environmental assessments to guide the development of<br />
policies and plans. Bateman et al. (2011a: 1076) concluded that:<br />
The focus upon changes in value between feasible, policy-relevant scenarios is much more useful<br />
for decision purposes … [F]or the valuation of any good we require:<br />
i) understanding of the change in provision of the good under consideration given changes in<br />
the environment, policies and societal trends;<br />
ii) a robust and reliable estimate of the marginal (i.e. per unit) value; and<br />
iii) knowledge of how ii) might alter as i) changes.<br />
107<br />
Similar studies have been undertaken in New Zealand (Cole & Patterson 1997; Patterson & Cole 1999), which applied values<br />
from Costanza et al. (1997) to areas of New Zealand.<br />
108<br />
This debate questioned the process of scaling up marginal values to estimate total value (Bateman et al. 2011). Resulting total<br />
value estimates have been claimed to be too high because they exceeded global product, but also too low, because without<br />
ecosystem services, life on Earth would cease, implying that ecosystem services in toto have infinite value.<br />
96 The nature of wellbeing
Braat & de Groot (2012: 11) painted a more complex picture. They supported the use of marginal<br />
changes in most scenario analyses, but noted that not all decisions are marginal: ‘When, however,<br />
the proposed land use change involves nearly complete loss of ecosystems, biodiversity features,<br />
and disappearance of ecosystem services, marginal value changes are in fact irrelevant’. Issues<br />
of scale are clearly important here and have an impact on values. A marginal change can create a<br />
non-marginal effect—for instance, a small change in water chemistry could destroy the function<br />
of a wetland. However, what should be valued is the loss of services from the wetland. If there are<br />
many wetlands, the total loss of one may have very limited welfare implications. Such arguments<br />
would obviously not apply to larger scale events, such as global climate change, for which a<br />
tipping point may create calamitous consequences. As Farley (2012: 40) noted, ‘If ecosystem<br />
services are essential, then marginal analysis and monetary valuation are inappropriate tools<br />
in the vicinity of thresholds’. This matter can be resolved by considering the three-step process<br />
outlined by Bateman et al. (2011a) and the points raised by Pearce et al. (2006)—however, the<br />
main difficulty is in modelling a system’s response to policy and other changes, a task which<br />
requires input from a range of disciplines, and then valuing that response, recognising that<br />
marginal values do not apply to non-marginal changes.When valuation is performed in the<br />
context of decision making about specific ecosystems, it is usually the last step in a chain of<br />
events emanating from policy change (TEEB 2011: 4:5). This chain is as follows:<br />
1. Policy changes result in impacts on ecosystems<br />
2. These impacts change ecosystem services<br />
3. These changes impact on human welfare<br />
4. These impacts ultimately drive the economic value of changes in ecosystem services<br />
This relationship is characterised in Fig. 8.<br />
Valuation can also be used strategically before policy decisions are made to allow the<br />
implications of different options to be assessed, e.g. see Box 13.<br />
Figure 8. The pathway from ecosystem structure and processes to human wellbeing (TEEB 2010a: 17).<br />
The nature of wellbeing<br />
97
4.4.2 Direct and indirect services<br />
Ecosystem processes and functions underpin the delivery of ecosystem services; and a resilient,<br />
functioning ecosystem is necessary to maintain a sustained flow of benefits. Although outputs<br />
are valued directly, processes and functions also have value due to their roles in supporting the<br />
delivery of outputs. For example, the value of orchard pollination services from a specific insect<br />
(a supporting service) results from the increased value of fruit produced as a result of insect<br />
pollination services.<br />
Figure 9 depicts the value generation chain for eosystem services, and suggests that the<br />
economic value of an ecosystem is composed of the insurance value of ecosystem support<br />
systems and functions, plus the output value of direct services. However, this characterisation<br />
has drawn some criticism on the grounds that it leads to double counting (Johnston & Russell<br />
2011; Ojea et al. 2012), which underpins Wallace’s call for researchers to ‘clearly separate means<br />
(processes) and ends (services) when classifying ecosystem services’ (Wallace 2007: 242).<br />
Howarth & Farber (2002: 424) made the distinction between direct and indirect environmental<br />
services, claiming that ‘Since consumption itself reflects the contribution that ecosystems<br />
provide to the production of market goods, only the value of direct environmental services<br />
should be added to consumption in evaluating welfare change’.<br />
Functioning<br />
Resilience<br />
Structure<br />
Core ecosystem processes<br />
e.g. Water cycling<br />
Ecosystem functions<br />
e.g. Water provisioning, purification and regulation<br />
Insurance value<br />
Ecosystem’s<br />
capacity to maintain<br />
a sustained flow of<br />
benefits<br />
Economic<br />
value of the<br />
ecosystem<br />
Ecosystem service benefits<br />
Water for households, industry and irrigation<br />
Output value<br />
Value attached to<br />
direct ecosystem’s<br />
services and benefits<br />
Figure 9. The relationship between ecosystem processes, functions and benefits (TEEB 2010a: 193).<br />
An important advantage of valuing only final ecosystem services is that the valuation does<br />
not rely on the public’s understanding of biological production functions or the complex<br />
relationships supporting ecosystem functions (Boyd & Krupnick 2009). Johnston & Russell<br />
(2011) provided a set of rules for distinguishing between intermediate and final services, noting<br />
that the distinction is context dependent and so the same ecosystem services may be classed<br />
as intermediate or final by different individuals 109 . The UK National Ecosystem Assessment<br />
agreed with this, and distinguished between intermediate and final ecosystem services. Similarly,<br />
WBCSD (2011: 23) excluded supporting services because ‘they are already captured within<br />
provisioning, regulating and cultural services’.<br />
Mace & Bateman (2011: 16) took the position that ‘provisioning and cultural services are<br />
always classed as final ecosystem services; regulating services may be either final services or<br />
intermediate services/processes; and supporting services are always intermediate services/<br />
109<br />
Johnston & Russell (2011: 2244) noted that the ‘[P]rovision of unpolluted surface water (e.g. in a lake) may represent a final<br />
ecosystem service for those who drink the water or engage in contact recreation such as swimming. The same service, however,<br />
may represent an intermediate ecosystem service for those who fish in the lake, to the extent that catchable fish abundance<br />
depends on water quality.’<br />
98 The nature of wellbeing
processes’. However, Costanza (2008) strongly rejected this position, claiming that the ‘end’ is<br />
sustainable human wellbeing, with ecosystem services being a means to that end. Wallace (2007),<br />
Costanza (2008) and subsequent responses to them (Wallace 2008; Fisher et al. 2009) highlight<br />
the ongoing differences in objectives, definitions and methods in the ecosystem services<br />
valuation arena, as noted by Fisher & Turner (2008: 1167) who claimed that ‘the differences that<br />
exist stem from the fact that ecosystem services classification schemes are founded upon the<br />
specific context in which they are being used as well as the definition used’.<br />
4.4.3 Economic valuation frameworks<br />
There are two main frameworks for defining the spectrum of economic values: the ecosystem<br />
services framework, adopted by the MEA (2003), and the Total Economic Value (TEV) framework<br />
(see Sharp & Kerr (2005) for a New Zealand application of the TEV framework). These two<br />
frameworks are largely complementary, mainly differing in the way they group sub-components<br />
of economic value.<br />
The ecosystem services framework provides an important reminder of the complexity of natural/<br />
human systems and the reliance of some parts of the system on good functioning of other parts<br />
of the system. This framework adds richness by breaking use and non-use values into significant<br />
numbers of value sub-classes, and recognising the system whereby resources generate values<br />
of importance to people. However, because it identifies values at several steps along the chain<br />
leading to end-use values (intermediate services/products), the ecosystems services framework<br />
can be prone to double counting.<br />
The TEV framework focuses on anthropocentric end-values (Table 8) and uses very broad<br />
categories, which are essentially the wider set of use-related values (use value per se, option value<br />
and quasi-option value) and non-use values (existence value, sometimes broken into a small set<br />
of sub-categories, including bequest value). Unlike the ecosystem services framework, the TEV<br />
framework incorporates uncertainty about the future through the two option value categories.<br />
Figure 10 outlines the nature of the relationship between the TEV and ecosystem services<br />
frameworks, showing how some exemplar ecosystem service values can be mapped to TEV values.<br />
There is a growing literature questioning the merits of the ecosystem services framework for<br />
framing the valuation of environmental changes. For example, Boyd & Banzhaf (2007) suggested<br />
that ecosystem services were too ad hoc to be of use in welfare accounting. By contrast, Farley<br />
(2012) and Hauck et al. (2013) supported use of the ecosystem services framework, albeit with<br />
some warnings around its use by the latter. A special issue of Environmental and Resource<br />
Economics (2011: Volume 48, Issue 2) canvassed many of the points of contention around<br />
Table 8.<br />
Total Economic Value components.<br />
Value type Definition Examples<br />
Use value<br />
Option value<br />
Quasi-option value<br />
Existence value<br />
The values obtained by using, visiting or<br />
viewing something.<br />
The value of having the opportunity to use, visit<br />
or view something in the future (over and above<br />
expected use value). This is a type of insurance<br />
premium against changes in taste, income,<br />
capabilities, supply of substitute sites, etc.<br />
The value of unknown future uses of an<br />
irreplaceable resource.<br />
The value people obtain from a resource being<br />
in some preferred state (usually more pristine).<br />
Scenic amenity, timber harvest, recreational<br />
use.<br />
The value of retaining a recreational resource<br />
that is not currently used by the individual<br />
in case of a possible future change in the<br />
individual’s recreation preferences.<br />
Loss of genetic material that future knowledge<br />
developments could reveal to be a valuable<br />
medicine.<br />
The value of preserving an endangered<br />
species.<br />
The nature of wellbeing<br />
99
Total Economic Value (TEV)<br />
Use Value<br />
Non‐Use Value<br />
Direct use Option Indirect Use Bequest<br />
Existence<br />
Direct benefits<br />
from use of<br />
primary goods<br />
Option for future<br />
use (direct or<br />
indirect) of<br />
goods & services<br />
Benefits from<br />
secondary goods<br />
& services<br />
(including nonconsumptive<br />
use)<br />
Bequest value<br />
(value for future<br />
generations)<br />
Value of existence<br />
without use /<br />
consumption of goods<br />
or services<br />
Provisioning services:<br />
Timber & Fuel wood<br />
Food/fodder & other<br />
forest products (latex)<br />
Bioprospecting: biochemicals,<br />
medicines<br />
Fresh Water<br />
Cultural services:<br />
Recreation<br />
Tourism<br />
Education/science<br />
Provisioning services:<br />
Fresh Water<br />
Bioprospecting<br />
Regulating services:<br />
Carbon storage<br />
Air quality & water purification<br />
Erosion control<br />
Natural hazards management<br />
Cultural services:<br />
Scenery, recreation<br />
Supporting services:<br />
Soil quality<br />
Provision services:<br />
Fresh Water<br />
Regulating services:<br />
Carbon storage<br />
Air quality<br />
Cultural services:<br />
Scenery/landscape<br />
Recreation<br />
Education/science<br />
Supporting Services:<br />
Soil quality<br />
Cultural services:<br />
Scenery/landscape<br />
Community identity/<br />
integrity<br />
Spiritual value<br />
Wildlife/biodiversity<br />
Figure 10. Application of a Total Economic Value framework to ecosystem services (TEEB 2011).<br />
ecosystem services valuation and their implications for policy analysis. In this issue, Bateman<br />
et al. (2011b) provided a comprehensive overview and Balmford et al. (2011) used an ecosystem<br />
services viewpoint to analyse the consequences of losing wild nature.<br />
The ecosystem services framework continues to develop. In 2012, the first issue of the academic<br />
journal Ecosystem Services was published, which covers the science, policy and practice of<br />
ecosystem services across a wide range of disciplines 110 . The history of ecosystem services, their<br />
interactions with policy and the role of the Ecosystem Services journal are outlined by Braat & de<br />
Groot (2012). The journal Ecological Economics 111 also regularly publishes articles on ecosystem<br />
services, including a special issue in 2002 (Volume 41, Issue 3) on ‘The dynamics and value of<br />
ecosystem services: integrating economic and ecological perspectives’.<br />
To date, ecosystem services analysis has not, however, progressed to a stage where there is<br />
acceptance of a single framework that is universally applied by analysts (Fisher et al. 2009; Layke<br />
2009; Sagoff 2011; Dempsey & Robertson 2012). Nahlik et al. (2012: 29) were of the opinion that:<br />
Development of a single definition of ‘ecosystem service’ and a classification system that<br />
facilitates the identification of ecosystem services and a strategy to help guide research<br />
development in a way that is meaningful to natural and social scientists, and the public is<br />
imperative to moving ecosystem services from a concept to a practice. Currently there is no such<br />
system and no consensus.<br />
110<br />
www.journals.elsevier.com/ecosystem-services/ Disciplines covered include ‘ecology, and economics, institutions, planning and<br />
decision making, economic sectors such as agriculture, forestry and outdoor recreation, and all types of ecosystems’<br />
111<br />
www.journals.elsevier.com/ecological-economics/<br />
100 The nature of wellbeing
Figure 11. Approaches for the estimation of nature’s values (reproduced from TEEB (2010: 191), adapted from Gómez-<br />
Baggethun & de Groot 2010) (http://pubs.rsc.org/en/content/ebook/978-1-84973-018-1#!divbookcontent).<br />
4.5 Non-market valuation methods<br />
There is a suite of non-market valuation methods, both monetary and non-monetary, commonly<br />
adopted for this task, all of which have been comprehensively reviewed in recent omnibus studies<br />
by the UK NEA (2011) and TEEB (2011). Consequently, a review of non-market valuation methods<br />
will not be undertaken here. However, relevant methods are shown in Fig. 11.<br />
The mainstream valuation approaches (hedonics, travel costs, contingent valuation, choice<br />
experiments, etc.) measure either Willingness to Pay (WTP) or Willingness to Accept<br />
compensation (WTA), depending on context. All these methods involve significant expenses<br />
in terms of both time and money for data collection and analysis. By contrast, benefit transfer 112<br />
utilises information from existing studies to circumvent the need to undertake data collection<br />
and to minimise data analysis. Although benefit transfer has a number of issues associated with<br />
it, which are discussed below, it offers a quick and inexpensive way to understand the likely<br />
significance of ecosystem services in a particular policy context (Rolfe et al. 2011). However, it<br />
has a poor ability to predict the values that were measured in original studies, so must be used<br />
with caution (Rolfe & Bennett 2006; Rosenberger & Johnston 2010). See Rolfe et al. (2011) for a<br />
commentary on benefit transfer in the Australasian context.<br />
There are two notable examples of recent ecosystem services valuation applications that used<br />
benefit transfer:<br />
1. The United Kingdom National Ecosystem Assessment 113 , which is a comprehensive<br />
evaluation of ecosystem services in Britain.<br />
2. The Economics of Ecosystems and Biodiversity (TEEB) programme 114 , which is an<br />
international collaborative project hosted by the United Nations Environment Programme.<br />
112<br />
Also known as value transfer.<br />
113<br />
http://uknea.unep-wcmc.org/<br />
114<br />
http://www.teebweb.org/; TEEB is hosted by the United Nations Environment Programme and supported by the European<br />
Commission, the German Federal Ministry for the Environment, Nature Conservation and Nuclear Safety, the UK<br />
Government’s Department for the Environment, Food and Rural Affairs, and Department for International Development,<br />
Norway’s Ministry for Foreign Affairs, Sweden’s Ministry for the Environment, the Netherlands’ Ministry of Housing, Spatial<br />
Planning and the Environment, and Japan’s Ministry of the Environment.<br />
The nature of wellbeing<br />
101
The websites of both these projects provide links to extensive documentation addressing the<br />
need for valuation, valuation methods, valuation results and opportunities for applying valuation<br />
in specific contexts. The source studies may provide useful information for applying the benefit<br />
transfer method in a New Zealand context, following appropriate modification for context (Fisher<br />
et al. 2009).<br />
4.6 New Zealand applications<br />
New Zealand has a long history of non-market valuation. The first New Zealand studies in this field<br />
were undertaken by Russell Gluck (1974), who measured the values associated with recreational<br />
angling, and by Woodfield & Cowie (1977), who measured the value of a backcountry tramping<br />
experience in Fiordland National Park. Since then, over 130 non-market valuation studies have<br />
been recorded on the New Zealand Non-Market Valuation Database, which is maintained by<br />
Lincoln University 115 ; and reasonably detailed summaries of many New Zealand non-market<br />
valuation studies are now available on the extremely comprehensive, international EVRI<br />
database 116 . VALUEbase 117 , which is funded by the Swedish Environmental Protection Agency, and<br />
the New South Wales government database ENValue 118 have also been useful sources of values;<br />
however, neither of these have been maintained, with VALUEbase last updated in December 2004<br />
and ENValue in April 2004. Despite TEEB (2011: chapter 4) noting them as popular databases for<br />
ecosystem valuation, the ARIES database 119 does not contain any New Zealand studies and the RED<br />
database is no longer available. The following analysis of New Zealand applications of non-market<br />
valuation is based on studies contained in the New Zealand Non-Market Valuation Database.<br />
In keeping with studies in other countries, New Zealand non-market valuation studies have<br />
primarily focussed on four of Max-Neef’s (1991) fundamental needs: subsistence, protection,<br />
affection and leisure values. To our knowledge, no studies have attempted to place a monetary<br />
value on understanding, participation, creation, identity or freedom. Therefore, in the rest of this<br />
section, we use examples of New Zealand studies to illustrate the importance that the community<br />
places on only those ecosystem services that have been valued.<br />
Subsistence<br />
Subsistence service values, such as the value of food, are frequently measured in markets. For<br />
example, the annual value of groundwater sourced from the Waimea Plains was estimated to be<br />
about $250 million—approximately $40 million to irrigators (essentially the value of increased<br />
food production), $173 million to industrial users and $33 million to the bulk water supplier<br />
(White et al. 2001).<br />
In addition to marketed services, ecosystem services also include non-marketed subsistence<br />
services, which arise from the use of resources such as water, which has both quantity and<br />
quality attributes. For example, Welsh (1991) estimated the mean annual household benefits of<br />
the Christchurch domestic water supply at $2500. Similarly, Creagh (2010) measured the value of<br />
maintaining the cleanliness of domestic water supplies in Auckland and Christchurch, finding<br />
that Auckland households were willing to pay about $180 extra each year in addition to the<br />
average water charge of $267 (total = $447) for the maintenance of clean water and Christchurch<br />
households were willing to pay in the order of $400 extra each year in addition to the average<br />
water charge of $85 (total = $485). Furthermore, Kerr et al. (2003) showed that Christchurch<br />
115<br />
www2.lincoln.ac.nz/nonmarketvaluation/<br />
116<br />
Environmental Valuation Reference Inventory: www.evri.ca<br />
117<br />
www.beijer.kva.se/valuebase.htm<br />
118<br />
www.environment.nsw.gov.au/envalueapp/<br />
119<br />
Artificial Intelligence for Ecosystem Services: www.ariesonline.org<br />
102 The nature of wellbeing
households were willing to pay over $500 per year to augment the domestic water supply from<br />
new sources in order to avoid a diverse range of impacts on ecosystem services as a result of<br />
extra demand on the existing source, including changes in provisioning services.<br />
Protection<br />
Several studies have investigated the importance of flood protection to New Zealanders.<br />
Samarasinghe & Sharp (2008) carried out a hedonic valuation study, which estimated that people<br />
were willing to pay a $22,000 premium on houses outside a floodplain. In a study of Waimakariri<br />
River floodplain residents, Kerr (1989) found that the average household was willing to pay $320<br />
per annum to reduce the 30-year risk of flooding from 30% to 10%. Welsh (2001) assessed the<br />
value of reduced flooding to Waitakere City residents and found that there were aggregate annual<br />
benefits to the city of $35 million from the avoidance of flooding to 420 houses in a typical year.<br />
Investigations into other forms of protection include Tait et al. (2011), who estimated that<br />
Canterbury households were willing to pay $27 per year to reduce the risk of sickness from<br />
recreational water contact from 6% to 1%; Takatsuka et al. (2009), who determined that a 50%<br />
reduction in arable farming greenhouse gas emissions would lead to annual benefits of about<br />
$100 to Canterbury households; and Kerr & Cullen (1995), who valued the improvement of<br />
Paparoa National Park native forest conditions through the control of introduced possums at<br />
$300–400 per person per year.<br />
Affection<br />
Affection includes both affection for other people and affection for nature, with the latter being<br />
expressed in the concept of existence value. An early study that investigated this need was that<br />
of Kerr (1985), who estimated the value of avoiding hydroelectric development of the Kawarau<br />
River in Central Otago. The benefits came largely from protection of the natural landscape<br />
and amounted to $68 per household per year—a substantial amount when aggregated over all<br />
New Zealand households. Similarly, Mortimer et al. (1996) estimated that conservation benefits<br />
on Te Hauturu-o-Toi/Little Barrier Island had a total value of $9 million per year to Auckland<br />
households; and Yao & Kaval (2008), in their investigation into support for council biodiversityenhancing<br />
tree planting programmes on public land, found that the programmes had mean<br />
benefits of $256 per person per year. Kerr & Sharp (2007) investigated the value to South Island<br />
residents of protecting endangered species in the Mackenzie Basin, and found that the protection<br />
of Hebe cupressoides from local extinction was valued at $41 million, assuming a 10% discount<br />
rate; and protection of the robust grasshopper (Brachaspis robustus) and the bignose galaxias<br />
(Galaxias macronasus), both of which are only found in the Mackenzie Basin, were valued at<br />
about $70 million each.<br />
Leisure<br />
The New Zealand Non-market Valuation Database contains 48 studies of recreation values,<br />
which are considered leisure services in Max Neef’s (1991) categorisation. Two of these studies<br />
summarise values obtained from New Zealand outdoor recreation studies: Kaval & Yao (2007)<br />
analysed 58 estimates from 19 studies to derive an overall mean 120 of $71 per recreation day;<br />
and Kerr (2009) found that there were higher values for freshwater fishing, with a mean of $39<br />
per angler-day 121 compared with a mean of $25 per recreation day for other outdoor recreation<br />
activities. Beville & Kerr (2012) estimated that the invasion of Canterbury rivers by didymo<br />
(Didymosphenia geminata) would reduce leisure services from angling by $9.5 million 122 per year.<br />
120<br />
Year 2007 dollars.<br />
121<br />
Quarter 1, year 2009 dollars.<br />
122<br />
Year 2008 dollars.<br />
The nature of wellbeing<br />
103
Services meeting multiple needs<br />
Some studies do not fit neatly within Max-Neef’s needs typology, but underscore the role of<br />
ecosystem services. For example, a large number of studies have assessed the implications<br />
of water pollution on recreation and existence values. Water pollution can affect a range of<br />
ecosystem services, including provisioning services (both directly by making the water unsuitable<br />
for human consumption and indirectly by making it unsuitable for agricultural irrigation), leisure<br />
services (through impacts on recreational use), protection services (because of health risks)<br />
and affection services (because of implications for the functioning of the ecosystem that affect<br />
existence values). Combined, these effects can be extremely significant. For example, Sheppard<br />
et al. (1993) valued improvement in water quality from D to C standard in the lower Waimakariri<br />
River at $96 million. Similarly, Harris (1984: 205) estimated that Waikato residents would have<br />
benefitted by $3.7 million per annum from improvements in the water quality of the Waikato River<br />
as a result of ‘health, recreation, aesthetics and conservation values’ (Harris 1984: 205).<br />
Increasingly, choice experiments are being carried out to identify the relative magnitude of<br />
values arising from different environmental attributes. In some cases, these can be separated<br />
into different ecosystem service categories, but not always. Examples of such studies include,<br />
inter alia, Baskaran et al. (2013), Kerr & Sharp (2008), Kerr & Sharp (2010), Kerr & Swaffield (2012),<br />
Marsh (2012), Marsh et al. (2011), Tait et al. (2011) and Takatsuka et al. (2009). For example, Kerr<br />
& Swaffield (2012) were able to demonstrate the relative importance of high-quality stream<br />
water, the avoidance of gorse (Ulex europaeus) on riverbanks, increased water clarity and<br />
increased local employment. This type of integrated study can provide guidance on the merits of<br />
alternative policies for the management of resources.<br />
When making management decisions, trade-offs between ecosystem services often need to be<br />
made. One area that exemplifies such trade-offs is agricultural irrigation. For example, Harris<br />
(2012) estimated that the present value of increased agricultural production from the proposed<br />
Waitohi irrigation scheme in North Canterbury is in the order of $910 million, with a net present<br />
value estimated at $200 million, once the $710 million of costs are accounted for. However,<br />
reductions in several other services are offset against those gains, including changes in cultural<br />
services, such as the loss of recreational opportunities; loss of regulating services because of the<br />
risk of dam burst; and impacts on supporting services because of elevated nutrient discharges<br />
into the environment. Some of the trade-offs that have been assessed for this proposal are<br />
described in Box 15.<br />
104 The nature of wellbeing
Box 15—Modelling land use impacts on ecosystem services<br />
By Suzie Greenhalgh, Adam Daigneault and Oshadhi Samarasinghe (Landcare Research)<br />
Many policies in New Zealand are directly aimed at protecting, enhancing or maintaining the flow of<br />
benefits humans derive from our ecosystems, which, in turn, directly or indirectly impact on human<br />
wellbeing. Therefore, it is useful to look at how policies will affect the suite of ecosystem services<br />
to ensure that the various impacts on wellbeing are considered when selecting policies and making<br />
decisions around their design and implementation.<br />
A number of analytical tools are available to evaluate the impacts of policies on ecosystem<br />
services, including comparative-static partial equilibrium models 123 , simulation models (Doole 2010)<br />
and Multi-Agent Simulation models 124 . One example is the New Zealand Forest and Agriculture<br />
Regional Model (NZ-FARM), which has been used to demonstrate the broader impacts of policies.<br />
This model allows decision-makers, such as central government agencies, regional councils and<br />
industry, to systematically assess the economic and ecosystem service impacts of environmental<br />
and agricultural policies (e.g. limits, allocation options, taxes) and resource constraints (e.g. water<br />
availability). Farmers can respond to policy signals in a number of ways, including by changing land<br />
use (e.g. planting trees or moving to a less intensive or more intensive use), changing stocking or<br />
fertiliser rates, and adding feedpads (dairy). Therefore, this tool optimises potential farm income<br />
across a catchment against the impacts on a set of ecosystem services related to land use (pastoral,<br />
arable, horticultural, forestry, scrub or conservation), and land use and management change,<br />
accounting for both soil and weather variability.<br />
The following example demonstrates why it is important to consider the broader impacts of policy<br />
decisions to better understand the estimated positive and negative impacts of different policy<br />
options. It is important to note that this example is purely being used to illustrate the dilemma often<br />
faced by decision-makers and does not represent actual policy options that are currently under<br />
consideration.<br />
The Waitohi Irrigation and Hydro Scheme (‘the Scheme’) is expected to provide irrigation for<br />
just under 60 000 ha in the Hurunui, Waipara and Kowai catchments of North Canterbury 125 .<br />
The increased irrigation area allows an increase in food and water provisioning services, which,<br />
via increased supply of food and income, will directly contribute to improvement in some of the<br />
subsistence and living standards needs that contribute to wellbeing (locally, nationally and globally).<br />
However, this will likely come at a cost to fibre production (timber and wool), as well as a number of<br />
regulating services, which are also important contributors to subsistence and protection needs, such<br />
as clean water and air (via local water purification services), flood protection (local erosion control<br />
services) and climate stabilisation (a global service), all of which decline under more intensive<br />
agricultural uses. These declines can be moderated through water and climate policies that influence<br />
the decisions made by the farming community.<br />
A policy that places a price of $20/tonne of carbon on all greenhouse gas emissions (including<br />
agricultural emissions) will moderate the increase in greenhouse gas emissions and the increases<br />
in levels of nitrogen and phosphorus that result from intensification of land use, whilst having little<br />
effect on erosion regulation or water yield. Under this policy, the increase in milk, lamb and beef<br />
production, and catchment farm income will be moderated, as will the reduction in fibre production.<br />
A policy that sets water quality limits to achieve a 20% reduction in pre-scheme nitrogen losses will<br />
lessen the impact of the increase in irrigation area on the regulating services. Farmers will respond<br />
to such a policy by changing their land use and management practices to meet that limit. Such<br />
nutrient limits are expected to enhance water purification and erosion regulation services, moderate<br />
the loss of phosphorus and greenhouse gases, and reduce water yield. The reduction in water<br />
yields, in turn, will affect water regulation services, which could have positive or negative impacts—<br />
Continued on next page<br />
123<br />
http://tools.envirolink.govt.nz/dsss/the-new-zealand-forest-and-agriculture-regional-model/<br />
124<br />
www.agresearch.co.nz/our-science/agricultural-systems/rural-futures/Pages/default.aspx<br />
125<br />
www.hurunuiwater.co.nz<br />
The nature of wellbeing<br />
105
Box 15 continued<br />
the reduction in water coming off the land could mitigate potential flood impacts but will also<br />
reduce river flows, which may have an effect on the amount of water available for irrigation. Food<br />
provisioning will also be affected, with a decrease in milk production and a moderation in the growth<br />
in lamb and beef production (relative to a situation with added irrigation but no nitrogen controls).<br />
Fibre production, however, will likely increase. Overall, the increase in catchment farm income under<br />
this policy will be lower than a single policy to increase the irrigation area.<br />
A policy that includes both nutrient reduction and carbon prices will likely reduce nutrient losses,<br />
greenhouse gas emissions, erosion and water yield, indicating an overall beneficial impact on all of<br />
these services. However, milk and beef production, as well as farm catchment income are expected<br />
to decrease, and the increase in lamb production will be moderated, although fibre production will<br />
increase.<br />
Those making decisions about the appropriate policy or policies to implement are frequently faced<br />
with these conflicting messages about the benefits of any given policy. Rather than being able<br />
to select a policy that results in benefits accruing to all ecosystem services and the associated<br />
components of wellbeing, they are faced with making trade-offs between different ecosystem<br />
services under the various policy options. In New Zealand, the debate is ongoing about how to make<br />
these choices and what the ‘right’ choice is. Through the proposed water reforms, communities are<br />
being asked to participate and inform these choices, as they relate to policies that will impact on the<br />
health of the nation’s freshwater resources. In other spheres, governments (regional or national) are<br />
making those decisions.<br />
Regardless of who is making these decisions, the decisions will be more transparent and better<br />
informed if there is a better understanding of the likely impacts of different policy options on<br />
ecosystem services and the components of wellbeing—and where negative impacts are identified,<br />
additional policies or steps can be considered to reduce or negate the effects.<br />
106 The nature of wellbeing
5. Conclusions<br />
The evidence assembled in this report demonstrates that the ecosystem services that are<br />
delivered by our indigenous biodiversity and natural landscapes contribute in a very wide variety<br />
of ways to the wellbeing of New Zealand and New Zealanders. These are summarised in Table 9.<br />
These services not only provide our basic needs and enhance our safety, but also represent the<br />
fundamental essence of what it means to be a New Zealander. The concept of ecosystem services<br />
has allowed various individuals and agencies around the country to communicate the importance<br />
Table 9. How services delivered by New Zealand’s indigenous biodiversity and natural<br />
landscapes contribute to satisfying Max-Neef’s (1991) nine fundamental needs.<br />
Need<br />
Subsistence<br />
Protection<br />
Affection<br />
Understanding<br />
Participation<br />
Idleness/leisure<br />
Creation<br />
Identity<br />
Freedom<br />
Services<br />
• Clean fresh water to grow our food and provide electricity<br />
• Clean air to breathe<br />
• Food from land, rivers, wetlands, lakes, canals and the seas supported by nutrient cycling,<br />
pollination and biological control of pests and diseases<br />
• Mental and physical health—opportunities for leisure and recreation in green spaces<br />
• Energy—current and ancient (fossil) biofuels, sun, hydro, wind, geothermal<br />
• Timber for housing and furniture<br />
• Clothing and other resources<br />
• Income derived from meeting the subsistence needs of others<br />
• Flood and erosion protection<br />
• Water purification<br />
• Gas and climate regulation<br />
—Carbon storage in forests and oceans<br />
—Regulating mesoclimate and microclimate<br />
• Diversity, resilience and insurance<br />
• Plants and microorganisms as a basis for many medicines<br />
• Air filtration<br />
• Noise reduction<br />
• Liquid and solid waste treatment, processing and storage<br />
• Opportunities to experience strong affection and respect for nature (biophilia), and particular<br />
landscapes, building a sense of place, and to share positive experiences with friends and loved<br />
ones in a natural setting<br />
• Enhanced learning and development in natural settings<br />
• Nature as teacher—wild places as settings for personal development experiences (e.g.<br />
Outward Bound)<br />
• Indigenous knowledge<br />
• Research and education from preschool to tertiary levels leading to greater understanding of<br />
how ecosystems function and how our actions affect the provision of these services<br />
• Settings for a range of shared activities—walking, climbing, sailing, swimming, picnicking<br />
• Volunteers participating in biodiversity restoration projects<br />
• Settings for passive and active leisure and recreation—relaxing at the beach or climbing a<br />
mountain<br />
• Tourists attracted by such settings for their holidays<br />
• Inspiration for artists—carvers, weavers, painters, photographers, fiction and non-fiction<br />
writers, poets, cinematographers, and musicians—and for the artist in us all<br />
• Inspiration for innovation in science, technology, engineering and business<br />
• Our sense of self-definition, our heroes, and how we portray ourselves to customers, tourists,<br />
immigrants and the rest of the world<br />
• Whakapapa linkages as fundamental markers of identity<br />
• Free access to the coast and natural spaces<br />
• Opportunities to test oneself and take risks in a range of environments<br />
• Wilderness as freedom from sounds and signs of industrialised society, and opportunity for<br />
extraordinary experience, flow and adventure<br />
The nature of wellbeing<br />
107
of nature to a wide variety of different audiences in a language that they can relate to, because it<br />
links directly to their wellbeing. There are some excellent examples of how the contributions of<br />
ecosystem services to different aspects of our wellbeing have been assessed and measured and,<br />
in some cases, that knowledge has fed into elegant and effective changes in policy and practice.<br />
It is tempting to think that the bulk of these ecosystem services and their wellbeing benefits<br />
originate within the boundaries of public conservation land, rather than from urban, industrial<br />
or agricultural landscapes. However, the Prologue and much of Section 3 suggest that ecosystem<br />
service benefits flow from private as well as public land, agricultural as well as conservation<br />
land, and urban as well as rural land—just as indigenous biodiversity is not limited to public<br />
conservation land but is found across the landscape. We also receive benefits from exotic species<br />
and highly managed ecosystems—usually supported by a range of services flowing from largely<br />
indigenous ecosystems. This omnipresence shows the importance of continued protection of, and<br />
advocacy for, ecosystem services from private lands, as well as public conservation land.<br />
Some New Zealanders appear to be highly aware (either consciously or intuitively) that their own<br />
wellbeing is linked to the health of the indigenous biodiversity that delivers so many of these<br />
services, and are actively participating in restoration projects around the country. However, many<br />
others appear to be unaware of these connections. As noted in the Introduction, it seems unlikely<br />
that the time, energy, commitment, funding and attitude changes that are needed to reverse the<br />
decline in our biodiversity and in the services provided by our indigenous ecosystems will be<br />
found without greater public awareness, both of how our biodiversity and ecosystem services are<br />
declining, and of the significance of this decline to human wellbeing. DOC has a new focus on<br />
helping all New Zealanders to recognise the relevance of functioning natural systems to them<br />
personally and to increase awareness that they also have a role to play in conserving them. This<br />
is an important contribution to addressing this awareness gap.<br />
Globally, the ecosystem services concept has proven invaluable as a communication tool to<br />
increase awareness of our dependence on nature, and as a decision-making tool to enhance<br />
recognition of the importance of ecosystem services and to increase the weight given to their<br />
protection when making decisions. We look forward to its increased use in New Zealand, greatly<br />
increased research to support its use, its incorporation into education at all levels from preschool<br />
to university, and inclusion of it as a key component in DOC’s engagement with its many<br />
partners across the community.<br />
However, we believe that gaining a clearer understanding of the main contributors to wellbeing,<br />
and the ways in which our choices can affect both the level of wellbeing and the level of<br />
environmental impact, is equally important.<br />
There is increasing interest both in New Zealand (led by the New Zealand Treasury and others)<br />
and internationally in determining better methods for measuring wellbeing and for public<br />
decision-making to more effectively take account of the impacts on wellbeing. This report shows<br />
that any account of how wellbeing in New Zealand is produced and sustained must include as a<br />
major element a comprehensive and robust accounting of the contribution of ecosystem services.<br />
It also suggests that consideration of impacts on different ecosystem services, and hence on<br />
different aspects of wellbeing, should be a more prominent part of public decision-making, for<br />
instance in resource use applications.<br />
We also believe that fostering discussion, research and education on the different components of<br />
wellbeing (e.g. what really does make us happy?) will broaden New Zealanders’ understanding of<br />
the many factors that contribute to personal and national wellbeing, including a greater awareness<br />
of the irreplaceable contribution of ecosystem services. Further exploration of the impact of our<br />
individual and collective choices of satisfiers on both our own wellbeing and on the wellbeing of<br />
ecosystems (and hence the wellbeing of our descendants)—and recognition that we have many<br />
more choices than we currently exercise—will equip us to make more thoughtful decisions about<br />
how we use, manage and protect our ecosystems and indigenous biodiversity. If we can become<br />
108 The nature of wellbeing
etter at identifying and choosing high-happiness-return/low-impact consumption over highimpact/low-happiness-return<br />
consumption, we will not only improve our own wellbeing and that<br />
of our supporting ecosystems, but will also enhance the opportunity for our grandchildren and<br />
others on the planet to meet their fundamental needs and enjoy the good life.<br />
Between stimulus and response there is a space. In that space is our power to choose our<br />
response. In our response lies our growth and our freedom.<br />
(Man’s search for meaning—Viktor Frankl 1946)<br />
The nature of wellbeing<br />
109
6. Acknowledgements<br />
Such a wide ranging interdisciplinary study could not have been completed without the helpful<br />
assistance and collaboration of a large number of people. I am very grateful for the valued input<br />
of my co-authors and many interesting discussions with them.<br />
To tap into the wealth of knowledge around the country, I held interviews with a large number of<br />
scientists, council staff and councillors and other experts and interested lay people in Auckland,<br />
Hamilton, Palmerston North, Whanganui, Wellington, Christchurch and Dunedin. I cannot<br />
name them all, but everyone generously gave their time to meet with me and discuss aspects of<br />
ecosystem services and/or wellbeing and to direct me to relevant studies and publications.<br />
Lynn Lorkin kindly gave permission to reprint the lyric of her song ‘At the beach’ which sums up<br />
so well how time in nature can feed our wellbeing and our store of happy memories, and<br />
Don Binney’s widow Philippa very promptly and graciously gave permission to use an image<br />
of one of his paintings to illustrate how nature can prompt our creativity, saying ‘I think he<br />
[Don] would have been pleased to know it was being used in this context!’ Auckland and<br />
Christchurch Art Gallery staff were very helpful in making the connections for me. Ali Chick,<br />
DOC Christchurch, kindly obtained copyright permission for most of the tables and figures<br />
reproduced from other reports.<br />
My sincere thanks to three anonymous referees, and Rod Hay and Nicola Scott at DOC, who<br />
provided constructive suggestions on structure and content and some very useful additional<br />
references. The pre-publication version of the document (December 2013) had live-linked<br />
references via Endnote and Helen Lawrence did sterling work in entering many of these<br />
references into Endnote, and Sarah Tritt and Hadrian Taylor, Lincoln University library, were<br />
exceedingly helpful with adapting the standard templates to suit the DOC style. Amanda Todd,<br />
DOC contract editor, did an extraordinarily thorough edit, and Lynette Clelland, DOC Science<br />
Editor, oversaw the final layout and publication.<br />
I would like to particularly thank Ross Laurence for having the vision to commission this<br />
study in 2012 and for many interesting discussions. Ross’s role at the time was Manager of<br />
DOC’s Conservation and Prosperity Programme, which was established for the purpose of<br />
improving our understanding of society’s dependence on biodiversity and its fundamental role<br />
in New Zealand’s social and economic well-being—our prosperity. Ross recognised the value of<br />
taking an inter-disciplinary approach to gathering existing information and using it to present a<br />
coherent story as a way to enhance public understanding of why healthy functioning ecosystems<br />
are important for individual and national wellbeing. Hopefully this enhanced understanding<br />
in turn will influence decision-making regarding how we manage ecosystem services and the<br />
demands we place on them.<br />
Lin Roberts<br />
January 2015<br />
110 The nature of wellbeing
7. References<br />
Aaker, J.; Rudd, M.; Mogilner, C. 2010: If money doesn’t make you happy, consider time. Stanford Graduate School of<br />
Business Research Paper No. 2067, November 10, 2010. 19 p.<br />
Abbott, M. 2013: Made of New Zealand: public conservation lands can be unique incubators for innovation. ‘Out there’<br />
column. Wilderness, January 2013: 78.<br />
Abdallah, S. 2011: Pursuing rising national well-being: a Sisyphean challenge? New Economics Foundation, London. 14 p.<br />
Abrahams, R.D. 1986: Ordinary and extraordinary experience. Pp. 45–72 in Turner, V.W.; Bruner, E.M. (Eds): The<br />
anthropology of experience. University of Illinois Press, Urbana, IL.<br />
Akroyd Walshe Ltd; National Research Bureau Ltd; Eclectic Energy 2002: Subsistence fishers in New Zealand. Project<br />
SEC 2000/02. Prepared for Ministry of Fisheries, April 2002. 84 p plus appendices.<br />
Adams, C. 2013: 100% Pure ‘festering sore’—China news sites. New Zealand Herald, 6 August 2013.<br />
Adams, L.W. 1994: Urban wildlife habitats: a landscape perspective. University of Minnesota Press, Minneapolis.<br />
Adler, M. 2011: Economics for the rest of us—debunking the science that makes life dismal. The New Press, New York. 240 p.<br />
Aislabie, J.; Deslippe, J.R. 2013: Soil microbes and their contribution to soil sciences. Pp. 143–161 in Dymond, J. (Ed.):<br />
Ecosystem services in New Zealand: conditions and trends. Manaaki Whenua Press, Lincoln.<br />
Akbari, H.; Pomerantz, M.; Taha, H. 2001: Cool surfaces and shade trees to reduce energy use and improve air quality in<br />
urban areas. Solar Energy 70(3): 295–310.<br />
Aknin, L.B.; Dunn, E.W.; Whillans, A.V.; Grant, A.M.; Norton, M.I. 2013: Making a difference matters: impact unlocks the<br />
emotional benefits of prosocial spending. Journal of Economic Behavior & Organization 88: 90–95.<br />
Aldred, J. 2009: The skeptical economist: revealing the ethics inside economics. Earthscan, London. 281 p.<br />
Alexander, R.B.; Boyer, E.W.; Smith, R.A.; Schwarz, G.E.; Moore, R.B. 2007: The role of headwater streams in downstream<br />
water quality. Journal of the American Water Resources Association 43(1): 41–59.<br />
Alexander, S. 2012: The optimal material threshold: toward an economics of sufficiency. Real-World Economics Review 61:<br />
2–21.<br />
Alkire, S. 2002: Dimensions of human development. World Development 30(2): 181–205.<br />
Allen, R.B.; Bellingham, P.J.; Holdaway, R.J.; Wiser, S.K. 2013: New Zealand’s indigenous forests and shrublands. Pp. 34–48<br />
in Dymond, J.R. (Ed.): Ecosystem services in New Zealand—condition and trends. Manaaki Whenua Press, Lincoln.<br />
Allen, W.; Elmetri, I.; Clarke, S.; Gibbons, J.; Clark, K.; Sinner, J.; Jiang, W.; Taylor, M. 2010: Mapping the values of New<br />
Zealand’s coastal waters. 3. Social values. Biosecurity New Zealand Technical Paper No. 2010/05. Ministry of<br />
Agriculture and Forestry, Wellington, New Zealand. 39 p. www.biosecurity.govt.nz/files/pests/salt-freshwater/<br />
social-value-mapping.pdf (accessed 28 July 2014)<br />
Altieri, M.A.; Nicholls, C.I. 2004: Biodiversity and pest management in agroecosystems. CRC Press. 185 p.<br />
Amabile, T. M. 1996. Creativity in context. Westview, Boulder, CO. 366 p.<br />
Andersen, M.D.; Kerr, G.N.; Lambert, S. 2012: Cultural differences in environmental valuation. Paper presented to the NZ<br />
Agricultural and Resource Economists Conference: Green growth—logical possibility or oxymoron, August 30–31<br />
2012, Tahuna Conference Centre, Nelson. http://hdl.handle.net/10182/5123.<br />
Anderson, G.; Meneilly, G.; Mekjavic, I. 1996: Passive temperature lability in the elderly. European Journal of Applied<br />
Physiology and Occupational Physiology 73(3–4): 278–286.<br />
Andersson, D.; Nässén, J.; Larsson, J.; Holmberg, J. 2014 Greenhouse gas emissions and subjective well-being: An<br />
analysis of Swedish households. Ecological Economics 102: 75–82.<br />
Anew 2006: Measuring real wealth in New Zealand. A paper by the Anew NZ Progress Indicator Action Group, prepared<br />
for the Parliamentary Commissioner for the Environment. 33 p. www.pce.parliament.nz/assets/Uploads/Reports/<br />
pdf/wealth.pdf<br />
Arnould, E.J.; Price, L.L. 1993: River magic: extraordinary experience and the extended service encounter. Journal of<br />
Consumer Research 20: 24–45.<br />
Arrow, K.; Bolin, B.; Costanza, R.; Dasgupta, P.; Folke, C.; Holling, C.; Jansson, B.-O.; Levin, S.; Maler, K.-G.; Perrings, C.;<br />
Pimental, D. 1995: Economic growth, carrying capacity, and the environment. Science 268: 520–521.<br />
The nature of wellbeing<br />
111
AtKisson, K.; AtKisson, A. 2013: Green economy 2013: a strategic briefing on the state of play in the global transition.<br />
AtKisson Group. 39 p. http://atkisson.com/greeneconomy.php<br />
Auckland Council 2012: The Auckland Plan. 16 pp. Auckland Council. http://www.aucklandcouncil.govt.nz/EN/<br />
newseventsculture/OurAuckland/Documents/Auckland%20Plan_OurAuckland.pdf<br />
Ausseil, A.-G.; Kirschbaum, M.U.F.; Andrew, R.; McNeill, S. Dymond, J.R.; Carswell, F.; Mason, N.W.H. 2013: Climate<br />
regulation in New Zealand: contribution of natural and managed ecosystems. Pp. 386–399 in Dymond, J.R. (Ed.):<br />
Ecosystem services in New Zealand—conditions and trends. Manaaki Whenua Press, Lincoln.<br />
Baas, M.; De Dreu, C.K.W.; Nijstad, B.A. 2008: A meta-analysis of 25 years of mood-creativity research: Hedonic tone,<br />
activation, or regulatory focus? Psychological Bulletin 134(6): 779–806.<br />
Balmford, A.; Fisher, B.; Green, R.E.; Naidoo, R.; Strassburg, B.; Turner, R.K.; Rodrigues, A.S.L. 2011: Bringing ecosystem<br />
services into the real world: an operational framework for assessing the economic consequences of losing wild<br />
nature. Environmental & Resource Economics 48(2): 161–175.<br />
Barnes, A.M.; Wratten, S.D.; Sandhu, H.S. 2009: Harnessing biodiversity to improve vineyard sustainability. Outlooks on<br />
Pest Management 20(6): 250–255.<br />
Barnes, A.M.; Wratten, S.D.; Sandhu, H.S. 2010: Harnessing biodiversity to improve vineyard sustainability. Pp. 67–74 in<br />
Prange, R.K.; Bishop, S.D. (Eds): Proceedings of the Organic Fruit Conference, Vignola, Italy, September 2008. Acta<br />
Horticulturae (ISHS) 873.<br />
Barton, I.; Gadgil, R.; Bergin, D. (Eds) 2010: Managing native trees. Towards a national strategy. Proceedings of the Tāne’s<br />
Tree Trust 10th anniversary conference and workshops, The University of Waikato, 18–20 November 2009. Tāne’s<br />
Tree Trust.<br />
Baskaran, R.; Colombo, S.; Cullen, R. 2013: Public preferences in irrigation and conservation development projects: does<br />
simultaneous consideration of substitutes in choice sets matter? Land Use Policy 33: 214–226.<br />
Bateman, I.; Abson, D.; Beaumont, N.; Darnell, A.; Fezzi, C.; Hanley, N.; Kontoleon, A.; Maddison, D.; Morling, P.; Morris,<br />
J.; Mourato, S.; Pascual, U.; Perino, G.; Sen, A.; Tinch, D.; Turner, K.; Valatin, G. 2011a: Chapter 22: Economic values<br />
from ecosystems. Pp. 1068–1151 in: The UK National Ecosystem Assessment: technical report. UNEP-WCMC,<br />
Cambridge.<br />
Bateman, I.; Mace, G.; Fezzi, C.; Atkinson, G.; Turner, K. 2011b: Economic analysis for ecosystem service assessments.<br />
Environmental and Resource Economics 48(2): 177–218.<br />
Batstone, C.; Elmetri, I.; Taylor, M.; Sinner, J. 2009: Mapping the values of New Zealand’s coastal waters. 2. Economic<br />
values. MAF Biosecurity Technical Paper No: 2009/05. Ministry of Agriculture and Forestry, Wellington,<br />
New Zealand. 74 p. www.biosecurity.govt.nz/files/pests/salt-freshwater/economic-value-mapping.pdf<br />
(accessed 28 July 2014)<br />
Batstone, C.; Sinner, J. 2010: Techniques for evaluating community preferences for managing coastal ecosystems.<br />
Auckland region stormwater case study, discrete choice model estimation (2010/012). Prepared by Cawthron<br />
Instititue for Auckland Regional Council.<br />
Baumeister, R.; Leary, M.R. 1995: The need to belong: desire for interpersonal attachments as a fundamental human<br />
motivation. Psychological Bulletin 117: 497–529.<br />
Baumgartner, S. 2007: The insurance value of biodiversity in the provision of ecosystem services. Natural Resource<br />
Modelling 20(1): 87–127.<br />
Bayer, K. 2013: NZ’s manuka honey exports under threat. New Zealand Herald, 3 October 2013. www.nzherald.co.nz/nz/<br />
news/article.cfm?c_id=1&objectid=11134305<br />
Beatley, T. 2010: Biophilic cities: integrating nature into urban design and planning. Island Press. 208 p.<br />
Beaumont, J.; Oliver, M.; MacDiarmid, A. 2008: Mapping the values of New Zealand’s coastal waters. 1. Environmental<br />
Values. Biosecurity New Zealand Technical Paper No: 2008/16. Ministry of Agriculture and Forestry, Wellington,<br />
New Zealand. 73 p. www.biosecurity.govt.nz/files/pests/salt-freshwater/mapping-coastal-waters.pdf (accessed on<br />
28 July 2014)<br />
Beaumont, J.; D’Archino, R.D.; MacDiarmid, A. 2009 : Mapping the values of New Zealand’s coastal waters. 4. A metaanalysis<br />
of environmental values. Biosecurity New Zealand Technical Paper No: 2010/08. Ministry of Agriculture<br />
and Forestry, Wellington, New Zealand. 70 p. www.biosecurity.govt.nz/files/pests/salt-freshwater/environmentalvalues-mapping.pdf<br />
(accessed on 28 July 2014)<br />
Belich, J.; Wevers, L. 2008: Understanding New Zealand cultural identities. Victoria University of Wellington, Wellington.<br />
Bell, C. 1996: Inventing New Zealand: everyday myths of Pakeha identity. Penguin Books, Auckland.<br />
112 The nature of wellbeing
Bergheim, S. 2006: Measures of well-being: there is more to it than GDP. Deutsche Bank Research, Frankfurt.<br />
www.dbresearch.ru/PROD/DBR_INTERNET_EN-PROD/PROD0000000000202587.pdf<br />
Beville, S.; Kerr, G. 2012: Valuing impacts of the invasive alga Didymosphenia geminata on recreational angling.<br />
Ecological Economics 82: 1–10.<br />
Binnewies, C.; Sonnentag, S.; Mojza, E.J. 2010: Recovery during the weekend and fluctuations in weekly job performance:<br />
a week-level study examining intra-individual relationships. Journal of Occupational and Organizational<br />
Psychology 83(2): 419–441.<br />
Blackburn, T.H.; Sørensen, J. 1988: Nitrogen cycling in coastal marine environments. John Wiley & Sons, Chichester,<br />
New York, Brisbane, Toronto, Singapore.<br />
Blaschke P, Hicks D, Meister A. 2008. Quantification of the flood and erosion reduction benefits, and costs, of climate<br />
change mitigation measures in New Zealand. Report prepared by Blaschke and Rutherford Environmental<br />
Consultants for MfE. Wellington: Ministry for the Environment. iv + 76 p.<br />
Blaschke, P. 2013: Health and wellbeing benefits of conservation in New Zealand. Science for Conservation 321.<br />
Department of Conservation, Wellington. 37 p.<br />
Bogdanov S.; Jurendic, T.; Sieber, R.; Gallmann, P. 2008: Honey for nutrition and health: a review. Journal of the American<br />
College of Nutrition 27: 677–689.<br />
Böhnke, P. 2005: First European Quality of Life Survey: life satisfaction, happiness and sense of belonging. European<br />
Foundation for the Improvement of Living and Working Conditions, Dublin. 100 p. www.eurofound.europa.eu/<br />
pubdocs/2005/91/en/1/ef0591en.pdf<br />
Bolund, P.; Hunhammar, S. 1999: Ecosystem services in urban areas. Ecological Economics 29(2): 293–301.<br />
Borges, A.V.; Delille, B.; Frankignoulle, M. 2005: Budgeting sinks and sources of CO 2<br />
in the coastal ocean: diversity of<br />
ecosystems counts. Geophysical Research Letters 32(14).<br />
Borgonovi, F. 2009: Doing well by doing good: The relationship between formal volunteering and self-reported<br />
happiness. Social Science and Medicine 66: 2312–2334.<br />
Boyd, J.; Banzhaf, S. 2007: What are ecosystem services? The need for standardized environmental accounting units.<br />
Ecological Economics 63(2): 616–626.<br />
Boyd, J.; Krupnick, A. 2009: The definition and choice of environmental commodities for nonmarket valuation. Resources<br />
for the Future, Washington, DC.<br />
Braat, L.C.; de Groot, R. 2012: The ecosystem services agenda: bridging the worlds of natural science and economics,<br />
conservation and development, and public and private policy. Ecosystem Services 1(1): 4–15.<br />
Bradburn, N.M. 1969: The structure of psychological well-being. Aldine, Chicago.<br />
Brampton, A.H. 1992: Engineering significance of British saltmarshes. Pp. 115–122 in Allen, J.R.L.; Pye, K. (Eds): Salt<br />
marshes: morphodynamics, conservation and engineering significance. Cambridge University Press, Cambridge.<br />
Brickman, P.; Campbell, D. 1971: Hedonic relativism and planning the good society. Pp. 287–302 in Appley, M.H. (Ed.):<br />
Adaptation-level theory. Academic Press, New York.<br />
Brower, A.; Page, J. 2011: Property rights across sustainable landscapes: competing claims, collapsing dichotomies,<br />
and the future of property. Pp. 305–321 in Grinlinton, D.; Taylor, P. (Eds): Property rights and sustainability: the<br />
evolution of property rights to meet ecological challenges. Martinus Nijhoff Publishers.<br />
Brown, A.E.; Zhang, L.; McMahon, T.A.; Western, A.W.; Vertessy, R.A. 2005: A review of paired catchment studies for<br />
determining changes in water yield resulting from alterations in vegetation. Journal of Hydrology 310(1): 28–61.<br />
Brown, D.; Woolf, J.; Smith, C. 2012: An empirical investigation into the determinants of life satisfaction in New Zealand.<br />
New Zealand Economic Papers 46(3): 239–251.<br />
Brown, K.; Kasser, T. 2005: Are psychological and ecological well-being compatible? The role of values, mindfulness, and<br />
lifestyle. Social Indicators Research 74(2): 349–368.<br />
Brown, R.D. 2010: Design with microclimate: the secret to comfortable outdoor space. Island Press, Washington.<br />
Buchan, G. 2010: Ode to soil. Journal of Soil and Water Conservation 65(2): 48A–54A.<br />
Bujacz, A., Dunne, S., Fink, D., Gatej, A.R., Karlsson, E., Ruberti, V., & Wronska, M.K. 2014: Does creativity make you happy?<br />
The influence of creative activity on hedonic and eudaimonic well-being. Journal of European Psychology Students<br />
5(2): 19–23.<br />
The nature of wellbeing<br />
113
Bugg, R.L.; Waddington, C. 1994: Using cover crops to manage arthropod pests of orchards: a review. Agriculture,<br />
Ecosystems & Environment 50(1): 11–28.<br />
Butcher Partners Limited 2004: Regional economic impacts of West Coast Conservation Land: final report. Butcher<br />
Partners Limited report prepared for the Department of Conservation. 28 p. www.doc.govt.nz/Documents/<br />
conservation/threats-and-impacts/benefits-of-conservation/regional-economic-impacts-of-west-coastconservation-land.pdf<br />
Butcher Partners Limited 2005: Regional economic impacts of Abel Tasman National Park and Queen Charlotte Track.<br />
Butcher Partners Limited report prepared for the Department of Conservation. 25 p. www.doc.govt.nz/Documents/<br />
conservation/threats-and-impacts/benefits-of-conservation/abel-tasman-and-queen-charlotte-report.pdf<br />
Butcher Partners Limited 2006a: Economic benefits of water in Te Papanui Conservation Park. Inception report. Butcher<br />
Partners Ltd report prepared for the Department of Conservation. 13 p.<br />
Butcher Partners Limited 2006b: Regional economic impacts of Fiordland national park. Butcher Partners Limited<br />
report prepared for the Department of Conservation. 25 p. www.doc.govt.nz/documents/conservation/threats-andimpacts/benefits-of-conservation/economic-impacts-fiordland.pdf<br />
Butler, S. (published anonymously) 1872: Erewhon, or over the range. Trubner and Co.<br />
Buxton, R.; Johnson, P.; Espie, P. 1996: Sphagnum research programme: the ecological effects of commercial harvesting.<br />
Science for Conservation 25. Department of Conservation, Wellington. 34 p.<br />
Cai, W.-J. 2011: Estuarine and coastal ocean carbon paradox: CO 2 sinks or sites of terrestrial carbon incineration? Annual<br />
Review of Marine Science 3: 123–145.<br />
Cai, W.J.; Dai, M.H.; Wang, Y.C. 2006: Air-sea exchange of carbon dioxide in ocean margins: a province-based synthesis.<br />
Geophysical Research Letters 33(12).<br />
Cameron, P.J.; Hill, R.; Bain, J.; Thomas, W. 1989: A review of biological control of invertebrate pests and weeds in<br />
New Zealand 1874 to 1987. CAB International.<br />
Campbell, D.; Jackson, R. 2004: Hydrology of wetlands. Pp. 20.21–20.14 in Harding, J.S.; Mosley, M.P.; Pearson, C.P.; Sorrell,<br />
B.K. (Eds): Freshwaters of New Zealand. New Zealand Hydrological Society and New Zealand Limnological<br />
Society, Christchurch.<br />
Carlisle, S.; Henderson, G.; Hanlon, P.W. 2009: ‘Wellbeing’: a collateral casualty of modernity? Social Science & Medicine<br />
69(10): 1556–1560.<br />
Carpenter, S.; Walker, B.; Anderies, J.M.; Abel, N. 2001: From metaphor to measurement: resilience of what to what?<br />
Ecosystems 4: 765–781.<br />
Carpenter, S.R.; Bennett, E.M.; Peterson, G.D. 2006: Scenarios for ecosystem services: an overview. Ecology and Society<br />
11(1): 29.<br />
Carswell, F.E.; Burrows, L.E.; Hall, G.M.; Mason, N.W.; Allen, R.B. 2012: Carbon and plant diversity gain during 200 years of<br />
woody succession in lowland New Zealand. New Zealand Journal of Ecology 36(2): 191–202.<br />
Cavanagh, J.; Clemons, J. 2006: Do urban forests enhance air quality? Australasian Journal of Environmental<br />
Management 13: 120–130.<br />
Cavanagh, J.E. 2008: Influence of urban trees on air quality in Christchurch: preliminary estimates. Landcare Research<br />
Contract Report LC0708/097 prepared for Christchurch City Council (unpublished). 36 p.<br />
Challenger, I. 2013: He Poutama Maori: transferring indigenous philosophy to a sustainable programme. Unpublished<br />
Master of Professional Studies thesis, Lincoln University, Lincoln.<br />
Chang, H.-J. 2010: 23 things they don’t tell you about capitalism. Penguin, London. 286 p.<br />
Chapin, F.S.; Zavaleta, E.S.; Eviner, V.T.; Naylor, R.L.; Vitousek, P.M.; Reynolds, H.L.; Hooper, D.U.; Lavorel, S.; Sala, O.E.;<br />
Hobbie, S.E. 2000: Consequences of changing biodiversity. Nature 405(6783): 234–242.<br />
Chapman-Smith, B. 2012: Maori cuisine cluster eyes offshore markets. The New Zealand Herald, 16 August 2012.<br />
Chen, C.T.A.; Liu, K.K.; Macdonald, R. 2003: Continental margin exchanges. Pp. 53–97 in Fasham, M.J.R. (Ed.): Ocean<br />
biogeochemistry: the role of the ocean carbon cycle in global change. Springer, Berlin.<br />
Christopher, J. 1999: Situating psychological well-being: exploring the cultural roots of its theory and research. Journal of<br />
Counseling and Development 77(2): 141–152.<br />
Chrystall, C.; Patterson, M.G.; Cole, A.; Golubiewski, N. 2012: Economic value of ecosystem services in Ngati Raukawa ki<br />
te Tonga. Massey University/Landcare Research Ltd, Palmerston North.<br />
114 The nature of wellbeing
Clark, B.S. 1998: Political economy: a comparative approach. ABC-CLIO, Santa Barbara. 376 p.<br />
Clarkson, B.R.; Aussuel, A.E.; Gerbeaux, P. 2013: Wetland ecosystem services. Pp. 192–202 in Dymond, J.R. (Ed.):<br />
Ecosystem services in New Zealand: conditions and trends. Manaaki Whenua Press, Lincoln.<br />
Clifton, J. 2010: Choice, bro. The Listener, 3 July 2010.<br />
Cloke, P.; Perkins, H.C. 1998: “Cracking the canyon with the awesome foursome”: representations of adventure tourism in<br />
New Zealand. Environment and Planning D 16: 185–218.<br />
Cobb, C.; Halstead, T.; Rowe, J. 1995: The genuine progress indicator. Redefining Progress, San Francisco, CA.<br />
Cole, A.; Patterson, M. 1997: The economic value of New Zealand’s biodiversity. Unpublished report prepared for the<br />
Ministry for the Environment and Department of Conservation.<br />
Cole, A.; Patterson, M. 1999: The economic value of ecosystem services in the Waikato Region. Environment Waikato<br />
Internal Series 2. Waikato Regional Council, Hamilton.<br />
Common, M.; Perrings, C. 1992: Towards an ecological economics of sustainability. Ecological Economics 6(1): 7–34.<br />
Commoner, B. 1971: The closing circle: nature, man, and technology. New York 141: 265–268.<br />
Coomes, D.A.; Allen, R.B.; Scott, N.A.; Goulding, C.; Beets, P. 2002: Designing systems to monitor carbon stocks in forests<br />
and shrublands. Forest Ecology and Management 164: 89–108.<br />
Cooper, R. 1998: Landscape. Pp. 296–298 in Robinson, R.; Wattie, N. (Eds): The Oxford companion to New Zealand<br />
literature. Oxford University Press, Auckland.<br />
Costanza, R. 2008: Ecosystem services: multiple classification systems are needed. Biological Conservation 141(2): 350–352.<br />
Costanza, R.; Daly, H.E. 1992: Natural capital and sustainable development. Conservation Biology 6(1): 37–46.<br />
Costanza, R.; d’Arge, R.; de Groot, R.; Farber, S.; Grasso, M.; Hannon, B.; Limburg, K.; Naeem, S.; O’Neill, R.V.; Paruelo, J.;<br />
Raskin, R.G.; Sutton, P.; van den Belt, M. 1997: The value of the world’s ecosystem services and natural capital.<br />
Nature 387(6630): 253–260.<br />
Costanza, R.; Fisher, B.; Ali, S.; Beer, C.; Bond, L.; Boumans, R.; Danigelis, N.L.; Dickinson, J.; Elliott, C.; Farley, J. 2007:<br />
Quality of life: an approach integrating opportunities, human needs, and subjective well-being. Ecological<br />
Economics 61(2): 267–276.<br />
Cotterell, G.; Crothers, C. 2011: Social indicators and social reporting in New Zealand, and the potential contribution of<br />
the Family Whānau and Wellbeing Project. New Zealand Journal of Social Policy 37: 1–19.<br />
Cowart, R.H.; Fairfax, S.K. 1988: Public lands federalism: judicial theory and administrative reality. Ecology Law Quarterly<br />
15(3): 375–476.<br />
Cowie, C. 2010: Volunteers matter: the geographies of community-based ecological restoration groups in the Wellington<br />
Region. Unpublished MSc thesis, Victoria University of Wellington, Wellington.<br />
Coyle, F.; Fairweather, J. 2005: Challenging a place myth: New Zealand’s clean green image meets the biotechnology<br />
revolution. Area 37(2): 148–158.<br />
Creagh, K. 2010: Value and price: a transdisciplinary approach to ecologically sustainable urban water management.<br />
Unpublished PhD thesis, University of Auckland, Auckland. 241 p.<br />
Crisp, S. 1998: International models of best practice in wilderness and adventure therapy. Pp. 56–74 in Itin, C.M. (Ed.):<br />
Exploring the boundaries of adventure therapy: international perspectives. Association of Experiential Education,<br />
Boulder, CO.<br />
Cruz, I. 2012: Human needs and frameworks and their contributions as analytical instruments in sustainable<br />
development policymaking. In Rauschmayer, F.; Omann, I.; Frühmann, J. (Eds): Sustainable development:<br />
capabilities, needs, and well-Being. Routledge.<br />
Csikszentmihalyi, M. 1975: Beyond boredom and anxiety. Jossey-Bass, San Francisco.<br />
Csikszentmihalyi, M. 1990: Flow: the psychology of optimal experience. HarperCollins, New York.<br />
Csikszentmihalyi , M. 1997: Happiness and creativity. Futurist 31(5): S8 – S12.<br />
Csikszentmihalyi , M. 1999. Implications of a systems perspective for the study of creativity. Pp. 313–328 in Sternberg, R.<br />
(Ed.): Handbook of creativity. Cambridge University Press, Cambridge.<br />
CSIRO 2013: Recreation and tourism. Commonwealth Scientific and Industrial Research Organisation. www.<br />
ecosystemservicesproject.org/html/publications/docs/facts/rec_tour.pdf<br />
The nature of wellbeing<br />
115
Cumming, G.S.; Barnes, G.; Perz, S.; Schmink, M.; Sieving, K.E.; Southworth, J.; Binford, M.; Holt, R.D.; Stickler, C.; Van Hol,<br />
T. 2005: An exploratory framework for the empirical measurement of resilience. Ecosystems 8: 975–987.<br />
Cummins, R. 2012: The determinants of happiness. International Journal of Happiness and Development 1(1): 86–101.<br />
Daily, G.C. 1997: Nature’s services: societal dependence on natural ecosystems. Island Press, Washington, DC.<br />
Daly, H.E. 1997: Beyond growth: the economics of sustainable development. Beacon Press, Boston. 253 p.<br />
Daly, H.E.; Cobb, J.B. 1989: For the common good: redirecting the economy toward the community, the environment, and<br />
a sustainable future. Beacon Press, Boston.<br />
Dalziel, P. 2011: The economic value of sport and recreation In New Zealand. AERU Report 322. Lincoln University,<br />
Canterbury.<br />
Dasgupta, P.; Levin, S.; Lubchenco, J. 2000: Economic pathways to ecological sustainability. BioScience 50(4): 339–345.<br />
Davies, G. 2004: Economia—new economic systems to empower people and support the living world. ABC Books.<br />
Davies-Colley, J.R. 2013: River water quality in New Zealand: an introduction and overview. Pp. 432–447 in Dymond, J.R.<br />
(Ed.): Ecosystem services in New Zealand: conditions and trends. Manaaki Whenua Press, Lincoln.<br />
Davis, M. 2009. Understanding the relationship between mood and creativity: A meta-analysis. Organizational Behavior<br />
and Human Decision Processes 108(1): 25–38.<br />
de Groot, R.; Brander, L.; van der Ploeg, S.; Costanza, R.; Bernard, F.; Braat, L.; Christie, M.; Crossman, N.; Ghermandi, A.;<br />
Hein, L.; Hussain, S.; Kumar, P.; McVittie, A.; Portela, R.; Rodriguez, L.C.; ten Brink, P.; van Beukering, P. 2012: Global<br />
estimates of the value of ecosystems and their services in monetary units. Ecosystem Services 1(1): 50–61.<br />
de Groot, R.S.; Wilson, M.A.; Boumans, R.M.J. 2002: A typology for the classification, description and valuation of<br />
ecosystem functions, goods and services. Ecological Economics 41(3): 393–408.<br />
Deci, E.L.; Ryan, R.M. 1985: Intrinsic motivation and self-determination in human behavior. Plenum Publishing Co.,<br />
New York.<br />
Deci, E.L.; Ryan, R.M. 2000: The ‘what’ and ‘why’ of goal pursuits: human needs and the self-determination of<br />
behavior. Psychological Inquiry 11: 227–268.<br />
Deci, E.; Ryan, R. 2008: Hedonia, eudaimonia, and well-being: an introduction. Journal of Happiness Studies 9(1): 1–11.<br />
Defra (UK Department for Environment, Food & Rural Affairs); National Statistics 2007: Sustainable development<br />
indicators in your pocket. Defra Publications, London. 163 p. http://collections.europarchive.org/<br />
tna/20080530153425/http://www.sustainable-development.gov.uk/progress/data-resources/documents/<br />
sdiyp2007_a6.pdf (accessed 11 August 2014)<br />
De Lange, P.J.; Rolfe, J.R.; Champion, P.D.; Courtney, S.P.; Heenan, P.B.; Barkla, J.W.; Cameron, E.K.; Norton, D.A.;<br />
Hitchmough, R.A. 2013: Conservation status of New Zealand indigenous vascular plants, 2012. New Zealand<br />
Threat Classification Series 3. Department of Conservation, Wellington, New Zealand. 70 p.<br />
Demissie, M.; Khan, A. 1993: Influence of wetlands on streamflow in Illinois. Illinois State Water Survey, Champaign, IL.<br />
Dempsey, J.; Robertson, M. 2012: Ecosystem services: tensions, impurities, and points of engagement within<br />
neoliberalism. Progress in Human Geography 36(6): 758–779.<br />
Den Boer, L.; Schroten, A. 2007: Traffic noise reduction in Europe. CE Delft 14: 2057–2068.<br />
Department for Business Innovation and Skills 2008: Foresight Mental Capital and Wellbeing Project: final Project<br />
report. The Government Office for Science, London. www.bis.gov.uk/foresight/our-work/projects/publishedprojects/mental-capital-and-wellbeing/reports-and-publications<br />
De Witte, H. 1999: Job insecurity and psychological well-being: Review of the literature and exploration of some<br />
unresolved issues. European Journal of Work and Organisational Psychology 8(2): 155–177.<br />
DGINS; ESSC 2010: Sofia Memorandum. Measuring progress, well-being and sustainable development. Directors<br />
General of the National Statistical Institutes and European Statistical System Committee. 2 p. http://epp.eurostat.<br />
ec.europa.eu/portal/page/portal/gdp_and_beyond/documents/Sofia_memorandum_Final.pdf<br />
Diener, E. 1984: Subjective well-being. Psychological Bulletin 95(3): 542–575.<br />
Diener, E. 2008: Myths in the science of happiness, and directions for future research. Pp. 493–514 in Eid, M.; Larsen, R.<br />
(Eds): The science of subjective well-being. Guilford Press, New York.<br />
Diener, E.; Biswas-Diener, R. 2002: Will money increase subjective well-being? A literature review and guide to needed<br />
research. Social Indicators Research 57(2): 119–169.<br />
116 The nature of wellbeing
Diener, E.; Ng, W.; Harter, J.; Arora, R. 2010: Wealth and happiness across the world: material prosperity predicts life<br />
evaluation, whereas psychosocial prosperity predicts positive feeling. Journal of Personality and Social Psychology<br />
99(1): 52–61.<br />
Diener, E.; Oishi, S. 2000: Money and happiness: income and subjective well-being across nations. Pp. 185–218 in Diener,<br />
E.; Suh, E. (Eds): Culture and subjective well-being. MIT Press, Cambridge, MA.<br />
Diener, M.L.; Diener McGavran, M.B. 2008: What makes people happy? A developmental approach to the literature on<br />
family relationships and well-being. Pp. 347–375 in Eid, M.; Larsen, R. (Eds): The science of subjective well-being.<br />
Guilford Press, New York.<br />
Doak, M. 2004: The economic value of irrigation in New Zealand. MAF Policy Technical Paper 04/01. Ministry of<br />
Agriculture and Forestry, Wellington. 61 p. http://ecan.govt.nz/publications/Reports/cwms-tech-rpt-3b-Economicvalue-of-Irrigation-Apr-04-final.pdf<br />
Doak, M. 2005: Value of irrigation in New Zealand. Paper presented at the meeting of the OECD workshop on agriculture<br />
and water: sustainability, markets and policies, Adelaide, Australia, 14–18 November 2005.<br />
DOC (Department of Conservation) 2006a: The value of conservation—what does conservation contribute to the<br />
economy? Department of Conservation. 20 p. www.doc.govt.nz/Documents/conservation/value-of-conservation.<br />
pdf (accessed 25 February 2014).<br />
DOC (Department of Conservation) 2006b: The value of water in the Te Papanui catchment. P. 13 in: The value of<br />
conservation: what does conservation contribute to the economy? Department of Conservation, Wellington. www.<br />
doc.govt.nz/publications/conservation/benefits-of-conservation/the-value-of-conservation/the-value-of-water-inthe-te-papanui-catchment/<br />
DOC (Department of Conservation) 2007: The economic values of Whangamarino wetland. Department of<br />
Conservation. 8 p. www.doc.govt.nz/Documents/conservation/threats-and-impacts/benefits-of-conservation/<br />
economic-values-whangamarino-wetland.pdf<br />
DOC (Department of Conservation); Fish and Game New Zealand 2010: Proposed non-resident angling licence:<br />
discussion document. August 2010. Department of Conservation and Fish and Game New Zealand. 12 p. http://<br />
tianz.org.nz/content/library/DOCDM784787_Nonresident_fishing_licences_discussion_document_4_.pdf<br />
DOC (Department of Conservation); MfE (Ministry for the Environment) 2000: The New Zealand Biodiversity Strategy.<br />
Department of Conservation and Ministry for the Environment, Wellington. 144 p. www.biodiversity.govt.nz/pdfs/<br />
picture/nzbs-whole.pdf<br />
Dodds, S. 1997: Towards a ‘science of sustainability’: improving the way ecological economics understands human wellbeing.<br />
Ecological Economics 23(2): 95–111.<br />
Dolan, P.; Peasgood, T.; White, M. 2006: Review of research on the influences on personal well-being and application to<br />
policy making. London. www.defra.gov.uk/science/project_data/DocumentLibrary/SD12005/SD12005_4017_FRP.<br />
pdf<br />
Dominati, E.; Patterson, M.; Mackay, A. 2010: A framework for classifying and quantifying the natural capital and<br />
ecosystem services of soils. Ecological Economics 69(9): 1858–1868.<br />
Doole, G.J. 2010: Indirect instruments for nonpoint pollution control with multiple, dissimilar agents. Journal of<br />
Agricultural Economics 61: 680–696.<br />
Doyal, L.; Gough, I. 1991: A theory of human need. Palgrave Macmillan. 381 p.<br />
Duncan, M.; Woods, R. 2004: Flow regimes. Pp. 7.1–7.14 in Harding, J.S.; Mosley, M.P.; Pearson, C.P.; Sorrell, B.K. (Eds):<br />
Freshwaters of New Zealand. New Zealand Hydrological Society and New Zealand Limnological Society,<br />
Christchurch.<br />
Dunn, E.; Gilbert, D.; Wilson, T. 2011: If money doesn’t make you happy, then you probably aren’t spending it right.<br />
Journal of Consumer Psychology 21(2): 115–125.<br />
Dunn, E.W.; Aknin, L.B.; Norton, M.I. 2008: Spending money on others promotes happiness. Science 319(5870): 1687–1688.<br />
Dunn, M. 2003: New Zealand painting: a concise history. Auckland University Press, Auckland.<br />
Dupuy, L. 2012: International trade and sustainability: a survey. LAREFI Working Paper N2012-01 April 2012. 30 p.<br />
Durie, M. 1998: Whaiora: Maori health development. Oxford University Press, Auckland. 238 p.<br />
Durie, M. 1999: Te pae mahutonga: a model for Maori health promotion. www.healthychristchurch.org.nz/media/9291/<br />
tepaemahutongatxtvers.pdf (accessed 23 July 2014).<br />
The nature of wellbeing<br />
117
Durie, M. 2001: Mauri ora: the dynamics of Maori health. Oxford University Press, Melbourne.<br />
Dwyer, J.F.; Nowak, D.J.; Noble, M.H.; Sisinni, S.M. 2000: Connecting people with ecosystems in the 21st century: an<br />
assessment of our nation’s urban forests. General Technical Report PNW-GTR-490. U.S. Department of Agriculture,<br />
Forest Service, Pacific Northwest Research Station. 483 p.<br />
Dymond, J.; Ausseil, A.; Ekanayake, J.; Kirschbaum, M. 2012: Tradeoffs between soil, water, and carbon—a national scale<br />
analysis from New Zealand. Journal of Environmental Management 95(1): 124–131.<br />
Dymond, J.R. (Ed.). 2013: Ecosystems services in New Zealand: conditions and trends. Manaaki Whenua Press, Lincoln.<br />
539 p.<br />
Dymond, J.R.; Betts, H.D.; Schierlitz, C.S. 2010: An erosion model for evaluating regional land-use scenarios.<br />
Environmental Modelling and Software 25: 289–298.<br />
Easterlin, R. 1974: Does economic growth improve the human lot? Some empirical evidence. Pp. 89–125 in David P.A.;<br />
Reder, M.W. (Eds): Nations and households in economic growth: essays in honor of Moses Abramovitz. Academic<br />
Press, New York.<br />
Easterlin, R. 2002: The income-happiness relationship. Pp. 157–175 in Glatzer, W. (Ed.): Rich and poor: disparities,<br />
perceptions, concomitants. Kluwer Academic, Boston.<br />
Easterlin, R.A.; McVey, L.A.; Switek, M.; Sawangfa, O.; Zweig, J.S. 2010: The happiness-income paradox revisited.<br />
Proceedings of the National Academy of Sciences of the United States of America 107(52): 22463–22468.<br />
Eckersley, R. 2005: Well & good: morality, meaning and happiness. Text Publishing, Melbourne.<br />
Ecological Society of America 1997: Ecosystem services: benefits supplied to human societies by natural ecosystems.<br />
Issues in Ecology 2. Ecological Society of America, Washington, DC.<br />
Ehrlich, P.R.; Ehrlich, A.H. 1981: Extinction: the causes and consequences of the disappearance of species. Random<br />
House, New York.<br />
EPA (US Environmental Protection Agency) 1997: Community-based environmental protection: a resource book for<br />
protecting ecosystems and communities. USEPA, Washington, DC. 144 p.<br />
Escobedo, F.J.; Nowak, D.J. 2009: Spatial heterogeneity and air pollution removal by an urban forest. Landscape and<br />
Urban Planning 90(3): 102–110.<br />
European Commission; FAO; IMF; OECD; UN; World Bank 2012: The system of environmental-economic accounting:<br />
central framework. European Commission, Food and Agriculture Organization, International Monetary Fund,<br />
Organisation for Economic Co-operation and Development, United Nations, and World Bank. http://unstats.<br />
un.org/unsd/envaccounting/White_cover.pdf<br />
Ewel, K.C. 1997: Water quality improvement by wetlands. Pp. 329–344 in Daily, G.C. (Ed.): Nature’s services. Societal<br />
dependence on natural ecosystems. Island Press, Washington, DC.<br />
Ewert, A. 1988: Reduction of trait anxiety through participation in Outward Bound. Leisure Sciences 10: 107–117.<br />
Ewert, A.; Hollenhorst, S. 1989: Testing the adventure model: empirical support for a model of risk recreation<br />
participation. Journal of Leisure Research 20(3): 124–139.<br />
Ewert, A.; Hollenhorst, S. 1994: Individual and setting attributes of the adventure recreation experience. Leisure Sciences<br />
16(4): 177–191.<br />
Ewert, A.W. 1994: Playing the edge: motivation and risk taking in a high-altitude wilderness like environment.<br />
Environment and Behavior 26(1): 3–24.<br />
Ewert, A.W.; Hollenhorst, S.J. 1997: Adventure recreation and its implications for wilderness. International Journal of<br />
Wilderness 3(2): 21–26.<br />
Ewert, A.W.; McCormick, B.P.; Voight, A.E. 2001: Outdoor experiential therapies: implications for TR practice. Therapeutic<br />
Recreation Journal 35(2): 107–122.<br />
Fahey, B.D.; Duncan, M.; Quinn, J. 2004: Impacts of forestry. Pp. 33.1–33.16 in Harding, J.S.; Mosley, M.P.; Pearson, C.P.;<br />
Sorrell, B.K. (Eds): Freshwaters of New Zealand. New Zealand Hydrological Society and New Zealand Limnological<br />
Society, Christchurch.<br />
Falk, J.H. 1976: Energetics of a suburban lawn ecosystem. Ecology 57: 141–150.<br />
Fang, C.-F.; Ling, D.-L. 2003: Investigation of the noise reduction provided by tree belts. Landscape and Urban Planning<br />
63(4): 187–195.<br />
Farley, J. 2012: Ecosystem services: the economics debate. Ecosystem Services 1(1): 40–49.<br />
118 The nature of wellbeing
Ferreira, S.; Hamilton, K.: Vincent, J.R. 2008: Comprehensive wealth and future consumption: accounting for population<br />
growth. The World Bank Economic Review 22(2): 233–248.<br />
Ferrer-i-Carbonell, A.; Gowdy, J.M. 2007: Environmental degradation and happiness. Ecological Economics 60: 509–516.<br />
Field, C.B.; Behrenfeld, M.J.; Randerson, J.T.; Falkowski, P. 1998: Primary production of the biosphere: integrating<br />
terrestrial and oceanic components. Science 281: 237–240.<br />
Fierer, N.; Leff, J.W.; Adams, B.J.; Nielsen, U.N.; Bates, S.T.; Lauber, C.L.; Owens, S.; Gilbert, J.A.; Wall, D.H.; Caporaso,<br />
J.G. 2012: Cross-biome metagenomic analyses of soil microbial communities and their functional attributes.<br />
Proceedings of the National Academy of Sciences 109(52): 21390–21395.<br />
Fioramonti, L. 2013: Gross Domestic Problem: the politics behind the world’s most powerful number. Zed Books.<br />
Fish, R.; Burgess, J.; Church, A.; Turner, R. 2011: Chapter 24: Shared values for the contributions ecosystem services make<br />
to human well-being. In: The UK National Ecosystem Assessment: technical report. UNEP-WCMC, Cambridge.<br />
Fisher, B.; Turner, R. 2008: Ecosystem services: classification for valuation. Biological Conservation 141(5): 1167–1169.<br />
Fisher, B.; Turner, R.; Morling, P. 2009: Defining and classifying ecosystem services for decision making. Ecological<br />
Economics 68(3): 643–653.<br />
Fitzgerald, N.; Innes, J. 2009: Hamilton City biennial bird counts: 2004–2008. Landcare Research Contract Report<br />
LC0910/099. Landcare Research, Hamilton.<br />
Fjørtoft, I. 2004: Landscape as playscape: the effects of natural environments on children’s play and motor development.<br />
Children, Youth and Environments 14(2): 21–44.<br />
Fonseca, M.S.; Cahallan, J.A. 1992: A preliminary evaluation of wave attenuation by four species of seagrass. Estuarine,<br />
Coastal and Shelf Science 35: 565–576.<br />
Ford-Robertson, J.; Robertson, K.; Maclaren, P. 1999: Modelling the effect of land-use practices on greenhouse gas<br />
emissions and sinks in New Zealand. Environmental Science & Policy 2: 135–144.<br />
Fordyce, M.W. 1977: Development of a program to increase personal happiness. Journal of Counseling Psychology 24:<br />
511–520.<br />
Forest Owners Association 2013: Carbon sequestration and emissions trading. www.nzfoa.org.nz/plantation-forestry/<br />
carbon-sequestration (accessed 26 May 2014).<br />
Frank, R. 2004: How not to buy happiness. Daedalus 133(2): 69–79.<br />
Frankl, V.E. 1946: Man’s search for meaning. Beacon Press. 184 p.<br />
Fredrickson, B.L. 2001: The role of positive emotions in positive psychology: the broaden-and-build theory of positive<br />
emotions. American Psychologist 56: 218–226.<br />
Fredrickson, B.L. 2003: The value of positive emotions. American Scientist 91 (July–August): 330–335.<br />
Fredrickson, B.L.; Losada, M.F. 2005: Positive affect and the complex dynamics of human flourishing. American<br />
Psychologist 60(7): 678–686.<br />
Fredrickson, B.L.; Levenson, R.W. 1998: Positive emotions speed recovery from the cardiovascular sequelae of negative<br />
emotions. Cognition and Emotion 12: 191–220.<br />
Freeman, C.; Dickinson, K.J.M.; Porter, S.; van Heezik, Y.M. 2012: “My garden is an expression of me”: exploring<br />
householders’ relationships with their gardens. Journal of Environmental Psychology 32: 135–143.<br />
Frey, B.; Stutzer, A. 2002: What can economists learn from happiness research? Journal of Economic Literature 40(2):<br />
402–435.<br />
Fujiwara, D.; Campbell, R. 2011: Valuation techniques for social cost-benefit analysis: stated preference, revealed<br />
preference and subjective well-being approaches: a discussion of the current issues. HM Treasury.<br />
Gadd, J.; Coco, G.; Hewitt, J. 2010: Interactions between heavy metals, sedimentation and cockle feeding and movement.<br />
Part 3. Unpublished report prepared for Auckland Regional Council by the National Institute of Water and<br />
Atmospheric Research.<br />
Gasper, D. 2007: Conceptualising human needs and wellbeing. Pp. 47–70 in Gough, I.; McGregor, J.A. (Eds): Wellbeing in<br />
developing countries: from theory to research. Cambridge University Press, Cambridge.<br />
Gattuso, J.P.; Frankignoulle, M.; Wollast, R. 1998: Carbon and carbonate metabolism in coastal aquatic ecosystems.<br />
Annual Review of Ecology and Systematics 29: 405–434.<br />
The nature of wellbeing<br />
119
Gertner, J. 2010: The rise and fall of the G.D.P. The New York Times, May 13, 2010. www.nytimes.com/2010/05/16/<br />
magazine/16GDP-t.html<br />
Giera, N.; Bell, B. 2009: Economic costs of pests to New Zealand. Prepared by Nimmo-Bell for MAF Biosecurity<br />
New Zealand (now MPI). MAF Biosecurity New Zealand Technical Paper No. 2009/31. 80 p. www.biosecurity.govt.<br />
nz/files/pests/surv-mgmt/economic-costs-of-pests-to-new-zealand.pdf<br />
Gilbert, D. 2006: Stumbling on happiness. A.A. Knopf, New York.<br />
Gillespie, M. 2010: Enhancing native butterfly populations in the Waipara Valley. Bio-Protection Research Centre, Lincoln<br />
University, Lincoln. 12 p.<br />
Gillespie, T.J.; Brown, R.D. 2007: Modifying air quality, pp52-53, in Chapter: Environmental factors, in Landscape<br />
Architectural Graphic Standards (Editor Leonard J. Hopper), John Wiley & Sons, New York.<br />
Gleisner, B.; Llewellyn-Fowler, M.; McAlister, F. 2011: Working towards higher living standards for New Zealanders.<br />
New Zealand Treasury Paper 11/02, May 2011. 55 p. www.treasury.govt.nz/publications/research-policy/tp/<br />
higherlivingstandards/tp-hls-may11.pdf<br />
Gleisner, B.; McAlister, F.; Galt, M.; Beaglehole, J. 2012: A living standards approach to public policy making.<br />
New Zealand Economic Papers 46(3): 211–238.<br />
Gluck, R.J. 1974: An economic evaluation of the Rakaia fishery as a recreation resource. Unpublished Master of<br />
Agricultural Science thesis, University of Canterbury [Lincoln College], Christchurch.<br />
Goldson, S.; Proffitt, J.; Muscroft-Taylor, K.; Suckling, D.; Popay, A. 1993: The economic value of achieving biological<br />
control of Sitona discoideus. Pp. 45–60 in Suckling, D.M.; Popay, A.J. (Eds): Plant protection: costs, benefits and<br />
trade implications. New Zealand Plant Protection Society Inc.<br />
Golubiewski, N. 2012: Defining a functional landscape for the geospatial identification of ecosystem services. Massey<br />
University and Landcare Research/Manaaki Whenua, Palmerston North.<br />
Gómez-Baggethun, E; de Groot, R. 2010: Natural capital and ecosystem services. The ecological foundation of human<br />
society. Chapter 5. Pp. 105–121 in Hester, R.E.; Harrison, R.M. (Eds): Ecosystem services. Issues in Environmental<br />
Science and Technology 30. Royal Society of Chemistry, Cambridge. http://pubs.rsc.org/en/content/ebook/978-1-<br />
84973-018-1#!divbookcontent<br />
Gordon, L.J.; Peterson, G.D.; Bennett, E.M. 2008: Agricultural modifications of hydrological flows create ecological<br />
surprises. Trends in Ecology & Evolution 23: 211–219.<br />
Gorman, P. 2012: Southern skies get starlight reserve status. The Press, 10 June 2012.<br />
Gough, I.; McGregor, I.A.; Camfield, L. 2007: Theorizing wellbeing in international development. Pp. 3–43 in Gough, I.;<br />
McGregor, J. (Eds): Wellbeing in developing countries. Cambridge University Press, Cambridge.<br />
Gowdy, J. 2005: Toward a new welfare economics for sustainability. Ecological Economics 53(2): 211–222.<br />
Greasley, D.; Hanley, N.; Kunnas, J.; McLaughlin, E.; Oxley, L.; Warde, P. 2014: Testing genuine savings as a forwardlooking<br />
indicator of future well-being in the (very) long-run. Journal of Environmental Economics and<br />
Management 61: 171–188.<br />
Green, T.L. 2013: Teaching (un)sustainability? University sustainability commitments and student experiences of<br />
introductory economics. Ecological Economics 94: 135–142.<br />
Green, W.; Clarkson, B.D. 2005: Turning the tide? A review of the first five years of the New Zealand biodiversity strategy:<br />
the synthesis report. Department of Conservation, Wellington. 50 p.<br />
Green Growth Knowledge Platform 2013: Moving towards a common approach on green growth indicators. Global<br />
Green Growth Institute, Organisation for Economic Co-operation and Development, United Nations Environment<br />
Programme, World Bank. 46 p. www.unep.org/greeneconomy/Portals/88/documents/partnerships/GGKP%20<br />
Moving%20towards%20a%20Common%20Approach%20on%20Green%20Growth%20Indicators.pdf<br />
Greenleaf, S.S.; Kremen, C. 2006: Wild bees enhance honey bees’ pollination of hybrid sunflower. Proceedings of the<br />
National Academy of Sciences of the United States of America 103(37): 13890–13895.<br />
Gregory, S.V.; Swanson, F.J.; McKee, W.A.; Cummins, K.W. 1991: An ecosystem perspective of riparian zones. BioScience<br />
41(8): 540–551.<br />
Gren, I.-M. 1995: Costs and benefits of restoring wetlands: two Swedish case studies. Ecological Engineering 4(2): 153–162.<br />
Griffiths, G.; McSaveney, M. 1983: Distribution of mean annual precipitation across some steepland regions of New<br />
Zealand. New Zealand Journal of Science 26(2): 197–209.<br />
120 The nature of wellbeing
Grimm, R.; Spring, K.; Dietz, N. 2007: The health benefits of volunteering: a review of recent research. Washington, DC:<br />
Corporation for National and Community Service.<br />
Grundy, T.P. 1989: An economic evaluation of biological control of rose-grain aphid in New Zealand. Research Report<br />
No. 200. Agribusiness and Economics Research Unit, Lincoln College, Canterbury.<br />
Gunderson, L. 2000: Ecological resilience—in theory and application. Annual Review of Ecology, Evolution and<br />
Systematics 31: 425–439.<br />
Gurr, G.M.; Wratten, S.D.; Altieri, M.A. 2004: Ecological engineering for pest management: advances in habitat<br />
manipulation for arthropods. CSIRO Publishing.<br />
Gurr, G.M.; Wratten, S.D.; Snyder, W.E. 2012: Biodiversity and insect pests: key issues for sustainable management. Wiley.<br />
Haines-Young, R.; Potschin, M. 2010: The links between biodiversity, ecosystem services and human well-being.<br />
In Raffaelli, D.; Frid, C. (Eds): Ecosystem ecology: a new synthesis. BES Ecological Reviews Series. Cambridge<br />
University Press, Cambridge.<br />
Hall, C.; Klitgaard, K. 2006: The need for a new, biophysical-based paradigm in economics for the second half of the age<br />
of oil. International Journal of Transdisciplinary Research 1(1): 4–22.<br />
Hallin, S.; Welsh, A.; Stenström, J.; Hallet, S.; Enwall, K.; Bru, D.; Philippot, L. 2012: Soil functional operating range linked to<br />
microbial biodiversity and community composition using denitrifiers as model guild. PloS one 7(12): e51962.<br />
Hamilton, K.; Clemens, M. 1999: Genuine savings rates in developing countries. World Bank Economic Review 13(2):<br />
33–56.<br />
Harahousou, Y. 2006: Leisure and aging. In Rojek, C.; Shaw, S.M.; Veal, A.J. (Eds): A handbook of leisure studies. Palgrave,<br />
Basingstoke and New York.<br />
Hardie-Boys, N. 2010: Valuing community group contributions to conservation. Science for Conservation 299.<br />
Department of Conservation, Wellington. 68 p.<br />
Harmsworth, G.R.; Awatere, S. 2013: Indigenous Maori knowledge and perspectives of ecosystems. Pp. 274–286 in<br />
Dymond, J.R. (Ed.): Ecosystem services in New Zealand—conditions and trends. Manaaki Whenua Press, Lincoln.<br />
Harmsworth, G.R.; Young, R.G.; Walker, D.; Clapcott, J.E.; James, T. 2011: Linkages between cultural and scientific<br />
indicators of river and stream health. New Zealand Journal of Marine and Freshwater Research 45(3): 423–436.<br />
Harris, B. 1984: Contingent valuation of water pollution control. Journal of Environmental Management 19: 199–208.<br />
Harris, S. 2012: Economic impacts of HWP Waitohi Irrigation and Hydro Scheme. Updated August 2012. Harris<br />
Consulting, Christchurch.<br />
Hart, D.; Marsden, I.; Francis, M. 2008: Coastal systems. In Winterbourn, M.J.; Knox, G.; Burrows, C.; Marsden, I. (Eds):<br />
The natural history of Canterbury. Canterbury University Press, Christchurch.<br />
Haslam, S.A.; Jetten, J.; Postmes, T.; Haslam, C. 2009: Social identity, health and well-being: an emerging agenda for<br />
applied psychology. Applied Psychology: An International Review 58 (1): 1–23.<br />
Hauck, J.; Gorg, C.; Varjopuro, R.; Ratamaki, O.; Jax, K. 2013: Benefits and limitations of the ecosystem services concept in<br />
environmental policy and decision making: some stakeholder perspectives. Environmental Science and Policy 25:<br />
13–21.<br />
Haworth, J.T. 2010: Life, work, leisure, and enjoyment: the role of social institutions. 28 p. www.wellbeing-esrc.com/<br />
developments.html<br />
Haybron, D.M. 2008: Philosophy and the science of subjective well-being. Pp. 17–43 in Eid, M.; Larsen, R.J. (Eds): The<br />
science of subjective well-being. Guilford Press, New York.<br />
Hebshi, A.J.; Duffy, D.C.; Hyrenbach, K.D. 2008: Associations between seabirds and subsurface predators around Oahu,<br />
Hawaii. Aquatic Biology 4(1): 89–98.<br />
Helliwell, J.; Layard, F.; Sachs, J. (Eds) 2012: World happiness report. The Earth Institute, Columbia University, CIFAR and<br />
Centre for Economic Performance. 167 p.<br />
Helliwell, J.F. 2003: How’s life? Combining individual and national variables to explain subjective well-being. Economic<br />
Modelling 20(2): 331–360.<br />
Henley, J. 2010: Richard Louv: let them climb trees. The Guardian, 5 June 2010.<br />
Hess, P. 2010: Determinants of the adjusted net saving rate in developing economies. International Review of Applied<br />
Economics 24(5): 591–608.<br />
The nature of wellbeing<br />
121
Hewitt, A. 2012: Soils—the land’s thin skin. In: Te Ara—the Encyclopedia of New Zealand. www.TeAra.govt.nz/en/soils/<br />
page-1 (updated 13 July 2012).<br />
Hewitt, A.; Hedley, C.; Rosser, B. 2010: Evaluation of soil natural capital in two soilscapes. Pp. 17–20 in: Soil solutions for a<br />
changing world: Proceedings of the 19th World Congress of Soil Science, 1–6 August 2010, Brisbane, Australia.<br />
Hickford, M.J.; Schiel, D.R. 2011: Synergistic interactions within disturbed habitats between temperature, relative<br />
humidity and UVB radiation on egg survival in a diadromous fish. PloS one 6(9): e24318.<br />
Hill, R.; Myatt, A. 2010: The economics anti-textbook: a critical thinker’s guide to microeconomics. Fernwood Publishing,<br />
Black Point, Nova Scotia.<br />
Hitchmough, R. 2002: New Zealand Threat Classification System Lists – 2002. Threatened Species Occasional<br />
Publication 23. Department of Conservation, Wellington, New Zealand. 16 p.<br />
Hitchmough, R.A.; Hoare, J.M.; Jamieson, H.; Newman, D.; Tocher, M.D.; Anderson, P.J.; Lettink, M.; Whitaker, A.H. 2010:<br />
Conservation status of New Zealand reptiles, 2009. New Zealand Journal of Zoology 37: 203–224.<br />
Hogg, B.N; Daane, K.M. 2010: The role of dispersal from natural habitat in determining spider abundance and diversity in<br />
California vineyards. Agriculture, Ecosystems and Evironment 135: 260–267.<br />
Holmes, B. 1996: Life unlimited. New Scientist, 10 February 1996.<br />
Hopper, J. 2010: Kowhaiwhai—Maori rafter patterns. The Textile Blog, 3 May 2010. http://thetextileblog.blogspot.<br />
com/2010/05/kowhaiwhai-maori-rafter-patterns.html<br />
Howarth, R.; Farber, S. 2002: Accounting for the value of ecosystem services. Ecological Economics 41(3): 421–429.<br />
Howden-Chapman, P.; Signal, L.; Crane, J. 1999: Housing and health in older people: ageing in place. Social Policy<br />
Journal of New Zealand 13: 14–30.<br />
Howell, R.T.; Pchelin, P.; Iyer, R. 2012: The preference for experiences over possessions: measurement and construct<br />
validation of the Experiential Buying Tendency Scale. The Journal of Positive Psychology 7(1): 57–71. www.<br />
psychologytoday.com/files/attachments/2557/howellpcheliniyer2012the-preference-experiences-over-possessions.<br />
pdf<br />
Hughey, K.F.D.; Kerr, G.N.; Cullen, R. 2010: Public perceptions of New Zealand’s environment: 2010. EOS Ecology,<br />
Christchurch. vi + 115 p.<br />
Hughey, K.F.D.; Kerr, G.N.; Cullen, R. 2013: Public perceptions of New Zealand’s environment: 2013. EOS Ecology,<br />
Christchurch.<br />
Hulme, K. 1983: The bone people. The Spiral Collective, Wellington. 450 p.<br />
Human Potential Centre 2013: Sovereign Wellbeing Index: New Zealand’s first measure of wellbeing. Human Potential<br />
Centre, Auckland University of Technology, Auckland. 83 p. www.mywellbeing.co.nz/mw/report/sovereignwellbeing-index-2013-report.pdf<br />
Huppert, F.; Baylis, N.; Keverne, B. 2004: Introduction: why do we need a science of well-being? Philosophical<br />
Transactions: Biological Sciences 359(1449): 1331–1332.<br />
Huryn, V.B. 1995: Use of native flora by honey bees (Apis mellifera L.) in New Zealand. New Zealand Journal of Botany<br />
33: 497–512.<br />
Hyun-Kil, J.; McPherson, E.G. 1995: Carbon storage and flux in urban residential greenspace. Journal of Environmental<br />
Management 45: 109–133.<br />
Inglehart, R.; Klingemann, H.-D. 2000: Genes, culture, democracy and happiness. In Diener, E.; Suh, M. (Eds): Culture and<br />
subjective well-being. MIT Press, Cambridge, MA.<br />
Isaacs, N.; Donn, M. 1993: Health and housing—seasonality in New Zealand mortality. Australian Journal of Public Health<br />
17(1): 68–70.<br />
Isen, A.M. 1987: Positive affect, cognitive processes and social behavior. Advances in Experimental and Social Psychology<br />
20: 203–253.<br />
Iso-Ahola, S.E.; Mannell, R.C. 2004: Leisure and health. In Haworth, J.T.; Veal, A.J. (Eds): Work and leisure. Routledge,<br />
London.<br />
IUCN 2013 (see 2.1) Jackson, B.M.; Wheater, H.S.; McIntyre, N.R.; Chell, J.; Francis, O.J.; Frogbrook, Z.; Marshall, M.;<br />
Reynolds, B.; Solloway, I. 2008: The impact of upland land management on flooding: insights from a multiscale<br />
experimental and modelling programme. Journal of Flood Risk Management 1(2): 71–80.<br />
122 The nature of wellbeing
Jackson, T. 2005: Live better by consuming less? Is there a “double dividend” in sustainable consumption? Journal of<br />
Industrial Ecology 9(1–2): 19–36.<br />
Jackson, T. 2011: Prosperity without growth: economics for a finite planet. Routledge.<br />
Jackson, T.; Jager, W.; Stagl, S. 2004: Beyond insatiability: needs theory, consumption and sustainability. ESRC<br />
Sustainable Technologies Programme Working Paper Series(2004/2).<br />
Jackson, T.; Marks, N. 1999: Consumption, sustainable welfare and human needs—with reference to UK expenditure<br />
patterns between 1954 and 1994. Ecological Economics 28(3): 421–441.<br />
Jahnke, R.A.; Alexander, C.R.; Kostka, J.E. 2003: Advective pore water input of nutrients to the Satilla River Estuary,<br />
Georgia, USA. Estuarine Coastal and Shelf Science 56(3–4): 641–653.<br />
Jamison, J.C. 2008: Well-being and neuroeconomics. Economics and Philosophy 24(3): 407.<br />
Jansson, A.; Hammer, M.; Folke, C.; Costanza, R. (Eds): 1994: Investing in natural capital: the ecological economics<br />
approach to sustainability. Island Press, Washington, DC.<br />
Jarvis, P.; Fowler, S.; Paynter, Q.; Syrett, P. 2006: Predicting the economic benefits and costs of introducing new biological<br />
control agents for Scotch broom Cytisus scoparius into New Zealand. Biological Control 39(2): 135–146.<br />
Jaysankar, D.; Ramaiah, N.; Vardanyan, L. 2008: Detoxification of toxic heavy metals by marine bacteria highly resistant<br />
to mercury. Marine Biotechnology 10(4): 471–477.<br />
Jeannotte, M.S.; Stanley, D.; Pendakur, R.; Jamieson, B.; Williams, M.; Aizlewood, A. 2002: Buying in or dropping out: the<br />
public policy implication of social cohesion research. Strategic Research and Analysis (SRA), Strategic Planning<br />
and Policy Coordination. Department of Canadian Heritage, Ottawa, Canada.<br />
Jellyman, D. 2012: The status of longfin eels in New Zealand—an overview of stocks and harvest. National Institute of<br />
Water and Atmospheric Research, Christchurch. 78 p. www.pce.parliament.nz/assets/Uploads/Jellyman-reportfinal2.pdf<br />
Johnson, P.; Gerbeaux, P. 2004: Wetland types in New Zealand. Department of Conservation, Wellington. 185 p.<br />
Johnston, R.; Russell, M. 2011: An operational structure for clarity in ecosystem service values. Ecological Economics<br />
70(12): 2243–2249.<br />
Jones, R. 2012: Rongoā—medicinal use of plants. In: Te Ara—the Encyclopedia of New Zealand. www.TeAra.govt.nz/en/<br />
rongoa-medicinal-use-of-plants (updated 4 December 2012).<br />
Jonsson, M.; Wratten, S.D.; Robinson, K.; Sam, S. 2009: The impact of floral resources and omnivory on a four trophic level<br />
food web. Bulletin of Entomological Research 99(3): 275–285.<br />
Jowett, I.G.; Richardson, J.; Boubee, J.A.T. 2009: Effects of riparian manipulation on stream communities in small streams:<br />
two case studies. New Zealand Journal of Marine and Freshwater Research 43(3): 763–774.<br />
Kahneman, D.; Deaton, A. 2010: High income improves evaluation of life but not emotional well-being. Proceedings of the<br />
National Academy of Sciences of the United States of America 107(38): 16489–16493.<br />
Kahneman, D.; Krueger, A.B.; Schkade, D.A.; Schwarz, N.; Stone, A.A. 2004: A survey method for characterizing daily life<br />
experience: the day reconstruction method. Science 306(5702): 1776–1780.<br />
Kalinowski, A.F. 2013: Come live the good life: a rhetorical examination of the persuasive techniques on the New Zealand<br />
Immigration Service website. Unpublished Masters thesis, School of Communication Studies, Auckland University<br />
of Technology, Auckland.<br />
Kallis, G.; Gómez-Baggethun, E.; Zografos, C. 2013. To value or not to value? That is not the question. Ecological<br />
Economics 94: 97–105.<br />
Kaplan, R.; Kaplan, S. 1989: The experience of nature: a psychological perspective. Cambridge University Press,<br />
Cambridge.<br />
Kasser, T. 2002: The high price of materialism. The MIT Press.<br />
Kasser, T. 2009: Psychological need satisfaction, personal well-being, and ecological sustainability. Ecopsychology 1(4):<br />
175–180.<br />
Kasser, T.; Ryan, R. 1993: A dark side of the American dream: correlates of financial success as a central life aspiration.<br />
Journal of Personality and Social Psychology 65(2): 410–422.<br />
Kasser, T.; Ryan, R. 1996: Further examining the American dream: differential correlates of intrinsic and extrinsic goals.<br />
Personality and Social Psychology Bulletin 22(3): 280–287.<br />
The nature of wellbeing<br />
123
Kasser, T.; Ryan, R. 2001: Be careful what you wish for: optimal functioning and the relative attainment of intrinsic and<br />
extrinsic goals. In Schmuck, P.; Sheldon, K. (Eds): Life goals and well-being. Hogrefe, Gottingen.<br />
Kasser, T.; Ryan, R.; Couchman, C.; Sheldon, K. 2004: Materialistic values: their causes and consequences. Pp. 11–28 in<br />
Kasser, T.; Kanner, A. (Eds): Psychology and consumer culture: the struggle for a good life in a materialistic world.<br />
American Psychological Association, Washington, DC.<br />
Kaval, P.; Yao, R. 2007: New Zealand outdoor recreation benefits. Working Paper in Economics 07/14. Department of<br />
Economics, University of Waikato, Hamilton.<br />
Kawharu, M. (Ed.) 2002: Whenua: managing our resources. Reed, Auckland.<br />
Keen, S. 2001: Debunking economics: the naked emperor of the social sciences. Zed Books.<br />
Kellert, S. 1993: The biological basis for human values of nature. Pp. 42–69 in Wilson, E.O.; Kellert, S.R. (Eds): The<br />
biophilia hypothesis. Island Press.<br />
Kellert, S.R. 2002: Experiencing nature: affective, cognitive, and evaluative development in children. Pp. 117–151 in Khan,<br />
P.H.; Kellert, S.R. (Eds): Children and nature. MIT Press, Cambridge.<br />
Kellert, S.R.; Wilson, E.O. 1993: The biophilia hypothesis. Island Press, Washington, DC.<br />
Kerr, G. 1985: Aesthetic and use values associated with proposed Kawarau Gorge hydro-electric developments. In<br />
Sheppard, D.; Rout, J. (Eds): Kawarau hydro investigations: river recreation economic study. Ministry of Works and<br />
Development, Wellington.<br />
Kerr, G. 1989: Willingness to pay for flood protection. In Blackford, C. (Ed.): Public perceptions of risk from the<br />
Waimakariri River. Report to the North Canterbury Catchment Board and Regional Water Board, Christchurch.<br />
Kerr, G. 2009: Statement of Evidence in Chief of Dr Geoffrey Neville Kerr. [In the Environment Court at Christchurch<br />
under the Resource Management Act 1991 in the matter of Appeals to the Environment Court under section 120<br />
of the Act between Garth William Dovey, Lower Waitaki River Management Society Incorporated, Te Runanga O<br />
Ngai Tahu, Ngai Tahu-Mamoe Fisher People Incorporated, Waitaki Protection Trust, Appellants and Canterbury<br />
Regional Council, Respondent and Meridian Energy Limited, Applicant].<br />
Kerr, G.; Cullen, R. 1995: Public preferences and efficient allocation of a possum-control budget. Journal of Environmental<br />
Management 43(1): 1–15.<br />
Kerr, G.; Sharp, B. 2007: The impact of wilding trees on indigenous biodiversity: a choice modelling study. Research<br />
Report No. 303. Agribusiness & Economics Research Unit, Lincoln University, Lincoln.<br />
Kerr, G.; Sharp, B.; White, P. 2003: The economics of augmenting Christchurch’s water supply. Journal of Hydrology<br />
(New Zealand) 42(2): 113–124.<br />
Kerr, G.; Swaffield, S. 2012: Identifying amenity values in a stream in the intensive agricultural landscape of Canterbury,<br />
New Zealand. Society and Natural Resources, 25(12): 1330–1339.<br />
Kerr, G.N.; Sharp, B.M.H. 2008: Evaluating off-site environmental mitigation using choice modelling. The Australian<br />
Journal of Agricultural and Resource Economics 52(4): 381–399.<br />
Kerr, G.N.; Sharp, B.M.H. 2010: Choice experiment adaptive design benefits: a case study. The Australian Journal of<br />
Agricultural and Resource Economics 54(4): 407–420.<br />
Keynes, J.M. 1963: Economic possibilities for our grandchildren. Pp. 358–373 in: Essays in persuasion. W.W. Norton & Co.,<br />
New York.<br />
King, N.J.; Lake, R.J.; Kerr, G.N. 2013: Wild foods. Pp. 287–299 in Dymond, J.R. (Ed.): Ecosystem services in New Zealand:<br />
conditions and trends. Manaaki Whenua Press, Lincoln.<br />
Kitson, J.C. 2004: Harvest rate of sooty shearwaters (Puffinus griseus) by Rakiura Māori: a potential tool to monitor<br />
population trends? Wildlife Research 31(3): 319–325.<br />
Kjell, O.N.E. 2011: Sustainable well-being: a potential synergy between sustainability and well-being research. Review of<br />
General Psychology 15(3): 255–266.<br />
Korpela, K.; Kinnunen, U. 2010: How is leisure time interacting with nature related to the need for recovery from work<br />
demands? Testing multiple mediators. Leisure Sciences 33(1): 1–14.<br />
Korten, D.C. 2010: Agenda for a new economy: from phantom wealth to real wealth. Berrett-Koehler Publishers.<br />
Kozlowski, J.; Vass-Bowen, N. 1997: Buffering external threats to heritage conservation areas: a planner’s perspective.<br />
Landscape and Urban Planning 37(3): 245–267.<br />
124 The nature of wellbeing
Kremen, C.; Williams, N.M.; Aizen, M.A.; Gemmill-Herren, B.; LeBuhn, G.; Minckley, R.; Packer, L.; Potts, S.G.; Steffan-<br />
Dewenter, I.; Vazquez, D.P. 2007: Pollination and other ecosystem services produced by mobile organisms: a<br />
conceptual framework for the effects of land-use change. Ecology Letters 10(4): 299–314.<br />
Kroll, C. 2011: Measuring progress and well-being: achievements and challenges of a new global movement. Friedrich-<br />
Ebert-Stiftung, International Policy Analysis.<br />
Krueger, A.B. 2009: Measuring the subjective well-being of nations: national accounts of time use and well-being.<br />
University of Chicago Press, Chicago.<br />
Kryter, K.D. 1994: The handbook of hearing and the effects of noise: physiology, psychology, and public health. Academic<br />
Press.<br />
Kubiszewski, I.; Costanza, R.; Franco, C.; Lawn, P.; Talberth, J.; Jackson, T.; Aylmer, C. 2013: Beyond GDP: measuring and<br />
achieving global genuine progress. Ecological Economics 93: 57–68.<br />
Kumar, P. (Ed.) 2010: The economics of ecosystems and biodiversity: ecological and economic foundations. Earthscan.<br />
Kuo, F.E. 2010: Parks and other green environments: essential components of a healthy human habitat. National<br />
Recreation and Park Association, Ashburn, VA. 45 p.<br />
Kuo, F.E.; Sullivan, W.C. 2001: Aggression and violence in the inner city: effects of environment via mental fatigue.<br />
Environment and Behaviour 34(4): 543–571.<br />
Kuznets, S. 1934: National income, 1929–1932. 73rd US Congress, 2d session. Senate Document No. 124: 7. http://fraser.<br />
stlouisfed.org/13BD805A-E27B-45C7-87E9-AAA8A1332BD2/FinalDownload/DownloadId-C1876D44FCB20F<br />
D4990BD2D4C54DD8BC/13BD805A-E27B-45C7-87E9-AAA8A1332BD2/docs/publications/nipab/19340104_<br />
nationalinc.pdf<br />
Kuznets, S. 1962: How to judge quality. The New Republic, October 20, 1962, pp. 29–32.<br />
Lafoley, D.; Grimsditch, G. (Eds) 2009: The management of natural coastal carbon sinks. IUCN, Gland, Switzerland.<br />
Lambert, S. 2004: The place of place: geographical indicators and contemporary maori development. In Hurley, E. (Ed.):<br />
Maori Succeeding in Agribusiness Conference Vol. 1. Massey Agricultural Centre for Professional Development,<br />
Palmerston North.<br />
Lambert, S. 2011: Te Ahuwhenua and the ‘Sons of the soil’: a history of the Māori-Farmer-of-the-Year award. MAI Review<br />
6(1).<br />
Landis, D.A.; Wratten, S.D.; Gurr, G.M. 2000: Habitat management to conserve natural enemies of arthropod pests in<br />
agriculture. Annual Review of Entomology 45(1): 175–201.<br />
Larned, S.T.; Scarsbrook, M.R.; Snelder, T.H.; Norton, N.J.; Biggs, B.J.F. 2004: Water quality in low-elevation streams and<br />
rivers of New Zealand: recent state and trends in contrasting land-cover classes. New Zealand Journal of Marine<br />
and Freshwater Research 38(2): 347–366.<br />
Laurans, Y.; Rankovic, A.; Billé, R.; Pirard, R.; Mermet, L. 2013: Use of ecosystem services economic valuation for decision<br />
making: questioning a literature blindspot. Journal of Environmental Management 119: 208–219.<br />
Lavelle, P.; Dugdale, R.; Scholes, R.; Berhe, A.A.; Carpenter, E.; Codispoti, L.; Izac, A-M.; Lemoalle, J.; Luizao, F.; Scholes,<br />
M.; Tréguer, P.; Ward, B. 2005: Chapter 12. Nutrient cycling. Pp. 331–353 in Hassan, R.; Scholes, R.; Ash, N. (Eds):<br />
Ecosystems and human well-being: current state and trends. Island Press, Washington, DC. www.unep.org/maweb/<br />
documents/document.281.aspx.pdf<br />
Layke, C. 2009: Measuring nature’s benefits: a preliminary roadmap for improving ecosystem service indicators. World<br />
Resources Institute Working Paper. World Resources Institute.<br />
Leathwick, J.; West, D.; Gerbeaux, P.; Kelly, D.; Robertson, H.; Brown, D.; Chadderton, W.; Ausseil, A. 2010: Freshwater<br />
Ecosystems of New Zealand (FENZ) Geodatabase Version One—August 2010 user guide. Department of<br />
Conservation, Wellington. 51 p.<br />
Leathwick, J.R.; Elith, J.; Rowe, D.; Julian, K. 2009: Robust planning for restoring diadromous fish species in New<br />
Zealand’s lowland rivers and streams. New Zealand Journal of Marine and Freshwater Research 43(3): 659–671.<br />
Leckey, J. 2011: The therapeutic effectiveness of creative activities on mental well-being: a systematic review of the<br />
literature. Journal of Psychiatric and Mental Health Nursing 18(6): 501–509.<br />
Leed, N. 2013: Great historical overview, but..., Review of ‘Gross Domestic Problem: the politics behind the world’s most<br />
powerful number’ by Lorenzo Fioramonti. www.amazon.com/gp/cdp/member-reviews/A3TVC0U6YUXKHA/<br />
ref=cm_pdp_rev_all?ie=UTF8&sort_by=MostRecentReview<br />
The nature of wellbeing<br />
125
Lelieveld, S.; Pilditch, C.A.; Green, M.O. 2004: Effects of deposit-feeding bivalve (Macomona liliana) density on intertidal<br />
sediment stability. New Zealand Journal of Marine and Freshwater Research 38(1): 115–128.<br />
Lenzen, M.; Cummins, R.A. 2011: Lifestyles and well-being versus the environment. Journal of Industrial Ecology 15:<br />
650–652.<br />
Lenzen, M.; Cummins, R.A. 2013: Happiness versus the environment—a case study of Australian lifestyles. Challenges 4:<br />
56–74.<br />
Levin, L.A.; Dayton, P.K. 2009: Integration and application of ecological theory on continental margins. Trends in Ecology<br />
& Evolution 24: 606–617.<br />
Line, M.A.; Loutit, M.W. 1973: Studies on non-symbiotic nitrogen fixation in New Zealand tussock-grassland soils.<br />
New Zealand Journal of Agricultural Research 16(1): 86–94.<br />
Lipsky, J.G. 1984: Saving the elderly from the killing cold. Nursing2012 14(2): 42–43.<br />
Litschke, T.; Kuttler, W. 2008: On the reduction of urban particulate concentration by vegetation—a review.<br />
Meteorologische Zeitschriff 17(3): 229–240.<br />
Liu, W.; Aaker, J. 2008: The happiness of giving: the time-ask effect. The Journal of Consumer Research 35(3): 543–557.<br />
Lohrer, A.M.; Chiaroni, L.D.; Hewitt, J.E.; Thrush, S.F. 2008: Biogenic disturbance determines invasion success in a<br />
subtidal soft-sediment system. Ecology 89(5): 1299–1307.<br />
Louv, R. 2005: Last child in the woods: saving our children from nature-deficit disorder. Algonquin Books, Chapel Hill,<br />
N.C. 323 p.<br />
Louv, R. 2011: The nature principle: human restoration and the end of nature-deficit disorder. Algonquin Books, Chapel<br />
Hill, NC.<br />
Louv, R. 2012: The nature principle: reconnecting with life in a virtual age. Algonquin Books, Chapel Hill, NC.<br />
Lyubomirsky, S.; Sheldon, K.M.; Schkade, D. 2005: Pursuing happiness: the architecture of sustainable change. Review of<br />
General Psychology 9(2): 111–131.<br />
MacDiarmid, A.; Oliver, M.; Beaumont, J. 2008: Environmental value mapping. Supplementary information to MAF<br />
Biosecurity New Zealand Technical Paper 2008/16. Ministry of Agriculture and Forestry, Wellington, New Zealand.<br />
26 p. www.biosecurity.govt.nz/files/pests/salt-freshwater/environmental-value-mapping.pdf (accessed 28 July<br />
2014).<br />
Mace, G.; Bateman, I. 2011: Chapter 2: Conceptual framework and methodology. In: The UK National Ecosystem<br />
Assessment: technical report. UNEP-WCMC, Cambridge.<br />
Mackenzie, F.T.; Andersson, A.; Lerman, A.; Ver, L.M. 2005: Boundary exchanges in the global coastal margin:<br />
implications for the organic and inorganic carbon cycles. Pp. 193–225 in Robinson, A.R.; Brink, K.H. (Eds): The sea,<br />
Vol. 13. Harvard University Press, Cambridge.<br />
MacKerron, G. 2012: Happiness economics from 35 000 feet. Journal of Economic Surveys 26(4): 705–735.<br />
MacKerron, G.; Mourato, S. 2013: Happiness is greater in natural environments. Global Environmental Change. 24 p. LSE<br />
Research Online http://eprints.lse.ac.uk/49376/<br />
Maclaren, J.P. 1996a: Environmental effects of planted forests in New Zealand. Bulletin 198. Forest Research Institute,<br />
Rotorua.<br />
Maclaren J.P. 1996b: Plantation forestry: its role as a carbon sink. Pp. 417–436 in Bouma, W.J.; Pearman, G.I.; Manning,<br />
M.R. (Eds): Greenhouse: coping with climate change. CSIRO Publishing, Collingwood.<br />
MacLeod, S. 1999: Farmers angry at new ‘rainfall tax’. The New Zealand Herald, 27 August 1999. www.nzherald.co.nz/nz/<br />
news/article.cfm?c_id=1&objectid=12642<br />
Mark, G. 2012: Rongoā Māori (traditional Māori healing) through the eyes of Māori healers : sharing the healing while<br />
keeping the tapu. Unpublished PhD thesis, Massey University, Albany, Palmerston North. Retrieved from http://<br />
hdl.handle.net/10179/4064<br />
Mark, A.F.; Barratt, B.I.P.; Weeks, E. 2013: Ecosystem services in New Zealand’s indigenous tussock grasslands: conditions<br />
and trends. Pp. 1–33 in Dymond, J.R. (Ed.): Ecosystem services in New Zealand—conditions and trends. Manaaki<br />
Whenua Press, Lincoln.<br />
Market Economics Ltd 2013: The costs of physical inactivity: towards a regional full-cost accounting perspective.<br />
Auckland Council, Waikato Regional Council and Wellington Regional Strategy Committee. 105 p. www.<br />
waikatoregion.govt.nz/Costs-of-Physical-Inactivity<br />
126 The nature of wellbeing
Marks, N.; Thompson, S.; Eckersley, R.; Jackson, T.; Kassar, T. 2006: DEFRA Project 3b: Sustainable development and wellbeing:<br />
relationships, challenges and policy implications.<br />
Marsh, D. 2012: Water resource management in New Zealand: jobs or algal blooms? Journal of Environmental<br />
Management 109: 33–42.<br />
Marsh, D.; Mkwara, L.; Scarpa, R. 2011: Do respondents’ perceptions of the status quo matter in non-market valuation with<br />
choice experiments? An application to New Zealand freshwater streams. Sustainability 3(9): 1593–1615.<br />
Marshall, M.R.; Francis, O.J.; Frogbrook, Z.L.; Jackson, B.M.; McIntyre, N.; Reynolds, B.; Solloway, I.; Wheater, H.S.;<br />
Chell, J. 2009: The impact of upland land management on flooding: results from an improved pasture hillslope.<br />
Hydrological Processes 23(3): 464–475.<br />
Maslow, A. 1954: Motivation and personality. Harper and Row, New York.<br />
Matheson, F.E.; Quinn, J.M.; Martin, M.L. 2012: Effects of irradiance on diel and seasonal patterns of nutrient uptake by<br />
stream periphyton. Freshwater Biology 57(8): 1617–1630.<br />
Max-Neef, M. 1986: Human scale economics: the challenges ahead. Pp. 43–54 in Ekins, P. (Ed.): The living economy: a new<br />
economics in the making. Routledge and Kegan Paul.<br />
Max-Neef, M. 1991: Human scale development: conception, application and further reflections. With contributions from<br />
A. Elzalde & M. Hopenhayn. The Apex Press, New York. 114 p.<br />
Max-Neef, M. 1992: Development and human needs. Pp. 197–214 in Ekins, P.; Max-Neef, M. (Eds): Real-life economics:<br />
understanding wealth creation. Routledge, London. 460 p.<br />
Max-Neef, M.; Elizalde, A.; Hopenhayn, M. 1986: Desarollo a escala humana: una opcion para el futuro. Development<br />
Dialogue special issue. Dag Hammarskjold Foundation, Uppsala, Sweden.<br />
Max-Neef, M.; Elizalde, A.; Hopenhayn, M., with the cooperation of Herrera, F.; Zemelman, H.; Jatobá, J.; Weinstein, L.<br />
1989: Human-scale development: an option for the future. Development Dialogue 1989: 1:5–81. Dag Hammarskjold<br />
Foundation, Uppsala, Sweden. (English translation of Max-Neef et al. 1986)<br />
May, R. 1953: Man’s search for himself. W.W. Norton and Company, New York.<br />
Maynard, S.; James, D.; Davidson, A. 2010: The development of an ecosystem services framework for South East<br />
Queensland. Journal of Environmental Management 45(5): 881–895.<br />
MBIE (Ministry of Business Innovation and Employment) 2012: Investment opportunities in the New Zealand honey<br />
industry. Part of the food and beverage information project. Prepared by Coriolis. 68 p. www.med.govt.nz/sectorsindustries/food-beverage/pdf-docs-library/information-project/coriolis-report-investment-opportunities-honeyindustry.pdf<br />
MBIE (Ministry of Business Innovation and Employment) 2013a: International Visitor Survey—key data tables. Ministry<br />
of Business Innovation and Employment, Wellington. www.med.govt.nz/sectors-industries/tourism/tourismresearch-data/international-visitor-survey/ivs-key-data<br />
MBIE (Ministry of Business, Innovation & Employment) 2013b: Tourism. The New Zealand Sectors Report 2013. Ministry<br />
of Business, Innovation & Employment. 149 p. http://www.mbie.govt.nz/pdf-library/what-we-do/business-growthagenda/sectors-reports-series/tourism-report.pdf<br />
McAlpine, K.; Wotton, D. 2009: Conservation and the delivery of ecosystem services: a literature review. Science for<br />
Conservation 295. Department of Conservation, Wellington. 82 p.<br />
McChesney, I.; Cox-Smith, I.; Amitrano, L. 2008: Thermal insulation in New Zealand homes: a status report for Beacon<br />
Pathway Limited. 57 p.<br />
McDowall, R.M. 2011: Ikawai: freshwater fishes in Māori culture and economy. Canterbury University Press, Christchurch.<br />
McDowall, R.M.; Eldon, G.A. 1980: The ecology of whitebait migrations (Galaxiidae: Galaxias spp.) fisheries. Fisheries<br />
Research Bulletin No. 20. New Zealand Ministry of Agriculture and Fisheries, Wellington. 172 p.<br />
McKee-Ryan, F.; Song, Z.; Wanberg, C.R.; Kinicki, A.J. 2005: Psychological and physical well-being during unemployment:<br />
A meta-analytic study. Journal of Applied Psychology 90(1):53–76<br />
McKelvey, P. 1995: Steepland forest: a historical perspective of protection forestry in New Zealand. Canterbury University<br />
Press, Christchurch.<br />
McKergow, L.; Tanner, C.; Monaghan, R.; Anderson, G. 2007: Stocktake of diffuse pollution attenuation tools for<br />
New Zealand pastoral farming systems. Prepared for Pastoral 21 Research Consortium. National Institute of Water<br />
and Atmospheric Research, Hamilton. 102 p.<br />
The nature of wellbeing<br />
127
McMichael, A.; Scholes, R.; Hefny, M.; Pereira, E.; Palm, C.; Foale, S. 2005: Chapter 3: Linking ecosystem services<br />
and human well-being. Pp. 43–60 in: Ecosystems and human well-being: multi-scale assessments, Volume 4.<br />
Millennium Ecosystem Assessment. Island Press, Washington, DC.<br />
MEA (Millennium Ecosystem Assessment) 2003: Ecosystems and human well-being: a framework for assessment. Island<br />
Press, Washington, DC. 245 p.<br />
MEA (Millennium Ecosystem Assessment) 2005a: Ecosystems and human well-being: current state and trends,<br />
Volume 1. Island Press, Washington, DC. 917 p.<br />
MEA (Millennium Ecosystem Assessment) 2005b: Ecosystems and human well-being: synthesis. Island Press,<br />
Washington, DC. www.millenniumassessment.org/documents/document.356.aspx.pdf<br />
MED (Ministry of Economic Development) 2009: Tourism sector profile—tourist activity: nature-based tourism.<br />
Ministry of Economic Development, Wellington. 4 p. www.med.govt.nz/sectors-industries/tourism/pdf-docslibrary/tourism-research-and-data/other-research-and-reports/tourism-sector-profiles/tourist-activity-profile/<br />
naturebasedtourism2009.pdf<br />
MED (Ministry of Economic Development) 2012: New Zealand energy data file 2012. Ministry of Economic<br />
Development, Wellington. 168 p. www.med.govt.nz/sectors-industries/energy/pdf-docs-library/energy-data-andmodelling/publications/energy-data-file/energydatafile-2011.pdf<br />
Meleason, M.A.; Davies-Colley, R.; Wright-Stow, A.; Horrox, J.; Costley, K. 2005: Characteristics and geomorphic effect of<br />
wood in New Zealand’s native forest streams. International Review of Hydrobiology 90(5–6): 466–485.<br />
Meurk, C.D.; Blaschke, P.M.; Simcock, R. 2013: Ecosystem services in New Zealand cities. Pp. 254–273 in Dymond, J. (Ed.):<br />
Ecosystem services in New Zealand: conditions and trends. Manaaki Whenua Press, Lincoln.<br />
Meurk, C.D.; Swaffield, S.R. 2000: A landscape ecological framework for indigenous regeneration in rural New Zealand-<br />
Aotearoa. Landscape and Urban Planning 50(1): 129–144.<br />
MfE (Ministry for the Environment) 2001: Our clean green environment—what’s it worth? Ministry for the Environment,<br />
Wellington. 6 p. www.mfe.govt.nz/publications/sus-dev/clean-green-image-value-aug01/summary-leaflet-aug01.<br />
pdf (accessed 26 February 2014).<br />
MfE (Ministry for the Environment) 2007: Environment New Zealand 2007. Ministry for the Environment, Wellington.<br />
456 p. www.mfe.govt.nz/publications/ser/enz07-dec07/index.html<br />
MfE (Ministry for the Environment) 2012: New Zealand’s greenhouse gas inventory 1990–2010. Report number ME1095.<br />
www.mfe.govt.nz/publications/climate/greenhouse-gas-inventory-2012/<br />
MfE (Ministry for the Environment) 2013: New Zealand’s greenhouse gas inventory 1990–2011. Report number ME1113.<br />
www.mfe.govt.nz/publications/climate/greenhouse-gas-inventory-2013/<br />
Michaelson, J.; Abdallah, S.; Steuer, N.; Thompson, S.; Marks, N. 2009: National accounts of well-being: bringing real<br />
wealth onto the balance sheet. New Economics Foundation, London.<br />
Middelburg, J.J.; Soetaert, K.; Herman, P.M.J.; Heip, C.H.R. 1996: Denitrification in marine sediments: a model study.<br />
Global Biogeochemical Cycles 10(4): 661–673.<br />
Mighty River Power n.d.: Bioenergy Reference Project 2: Mighty River landfill electricity generation. Mighty River Power,<br />
Hamilton. 3 p. www.bioenergy.org.nz/documents/publications/articles/RefProjects/BioenergyRef2.pdf<br />
Ministry of Tourism 2009a: Tourist sector profile—international visitors. Ministry of Tourism, Wellington. 4 p.<br />
www.tourismresearch.govt.nz/Documents/International%20Market%20Profiles/Total%20Profile.pdf<br />
Ministry of Tourism 2009b: Tourist activity: nature-based tourism. Tourism sector profile (August 2009).<br />
Ministry of Economic Development, Wellington. 4 p. www.med.govt.nz/sectors-industries/tourism/pdf-docs-library/<br />
tourism-research-and-data/other-research-and-reports/tourism-sector-profiles/tourist-activity-profile/<br />
naturebasedtourism2009.pdf (accessed 11 August 2014).<br />
Miron-Shatz, T. 2009: ‘Am I going to be happy and financially stable?’: How American women feel when they think about<br />
financial security. Judgment and Decision Making 4(1): 102–112. http://journal.sjdm.org/9118/jdm9118.pdf<br />
Mitsch, W.J. 1992: Landscape design and the role of created, restored, and natural riparian wetlands in controlling<br />
nonpoint source pollution. Ecological Engineering 1(1): 27–47.<br />
Mitsch, W.J.; Gosselink, J.G. 2000: The value of wetlands: importance of scale and landscape setting. Ecological<br />
Economics 35: 25–33.<br />
Mogilner, C. 2010: The pursuit of happiness: time, money, and social connection. Psychological Science 21(9): 1348–1354.<br />
128 The nature of wellbeing
Morgan, J. 2002: A snapshot of how it should be. The Dominion, 25 May 2002.<br />
Morgan, T. 2013: Perfect storm: energy, finance and the end of growth. Tullet Prebon, London. 82 p.<br />
Morris, R.K.A.; Reach, I.S.; Duffy, M.J.; Collins, T.S.; Leafe, R.N. 2004: On the loss of saltmarshes in south-east England and<br />
the relationship with Nereis diversicolor. Journal of Applied Ecology 41(4): 787–791.<br />
Mortimer, R.; Sharp, B.; Craig, J. 1996: Assessing the conservation value of New Zealand’s offshore islands. Conservation<br />
Biology 10(1): 25–29.<br />
Mortimer, R.J.G.; Davey, J.T.; Krom, M.D.; Watson, P.G.; Frickers, P.E.; Clifton, R.J. 1999: The effect of macrofauna on<br />
porewater profiles and nutrient fluxes in the intertidal zone of the Humber Estuary. Estuarine Coastal and Shelf<br />
Science 48: 683–699.<br />
MPI (Ministry for Primary Industries) 2013: PFSI—Carbon sequestration rates. www.mpi.govt.nz/environment-naturalresources/funding-programmes/permanent-forest-sink-initiative/pfsi-carbon-sequestration-rates<br />
(accessed<br />
26 May 2014).<br />
MSD (Ministry of Social Development) 2001. The Social Report 2001. www.socialreport.msd.govt.nz/2001/index.shtml<br />
MSD (Ministry of Social Development) 2002. Improving wellbeing for all New Zealanders. Briefing to the incoming<br />
Minister of Social Development. www.msd.govt.nz/documents/about-msd-and-our-work/publications-resources/<br />
corporate/briefing-to-the-incoming-minister-improving-wellbeing-for-all-new-zealanders-2002.pdf<br />
MSD (Ministry of Social Development) 2010: The social report. Ministry of Social Development, Wellington. www.<br />
socialreport.msd.govt.nz/documents/the-social-report-2010.pdf<br />
Mulgan, J. 1939: Man alone. Selwyn and Blunt.<br />
Mulholland, P.; Helton, A.; Poole, G.; Hall, R.; Hamilton, S.; Peterson, B.; Tank, J.; Ashkenas, L.; Cooper, L.; Dahm, C.;<br />
Dodds, W.; Findlay, S.; Gregory, S.; Grimm, N.; Johnson, S.; McDowell, W.; Meyer, J.; Valett, H.; Webster, J.; Arango,<br />
C.; Beaulieu, J.; Bernot, M.; Burgin, A.; Crenshaw, C.; Johnson, L.; Niederlehner, B.; O’Brien, J.; Potter, J.; Sheibley,<br />
R.; Sobota, D.; Thomas, S. 2008: Stream denitrification across biomes and its response to anthropogenic nitrate<br />
loading. Nature 452(7184): 202–205.<br />
Mulholland, P.J.; Webster, J.R. 2010: Nutrient dynamics in streams and the role of J-NABS. Journal of the North<br />
American Benthological Society 29: 100–117.<br />
Munro, M.H.G.; Blunt, J.W.; Dumdei, E.J.; Hickford, S.J.H.; Lill, R.E.; Li, S.; Battershill, C.N.; Duckworth, A.R. 1999: The<br />
discovery and development of marine compounds with pharmaceutical potential. Journal of Biotechnology 70(1–3):<br />
15–25.<br />
Nabhan, G.P.; Buchmann, S.L. 1997: Services provided by pollinators. Pp. 133–150 in Daily, G. (Ed.): Nature’s services:<br />
societal dependence on natural ecosystems. Island Press.<br />
Nadler, R.S.; Luckner, J.L. 1992: Processing the adventure experience: theory and practice. Kendall Hunt Publishing<br />
Company, Dubuque, IA.<br />
Nahlik, A.; Kentula, M.; Fennessy, M.; Landers, D. 2012: Where is the consensus?: a proposed foundation for moving<br />
ecosystem service concepts into practice. Ecological Economics 77: 27–35.<br />
Nana, G.; Stokes, F.; Molano, W. 2011: The asset base, income, expenditure and GDP of the 2010 Maori economy. BERL,<br />
Wellington.<br />
Nebel, B.; Drysdale, D. 2010: Methodologies for carbon footprinting for the forestry sector. Scion contract report<br />
for Ministry of Agriculture and Fisheries. Downloadable at www.mpi.govt.nz/news-resources/publications.<br />
aspx?title=Methodologies for Carbon Footprinting for the Forestry Sector.<br />
Needham, H.; Pilditch, C.; Lohrer, A.; Thrush, S. 2010: Habitat dependence in the functional traits of Austrohelice crassa, a<br />
key bioturbating species. Marine Ecology Progress Series 414: 179–193.<br />
Nellemann, C.; Corcoran, E.; Duarte, C.M.; Valdés, L.; DeYoung, C.; Fonseca, L.; Grimsditch, G. (Eds) 2009: Blue carbon.<br />
A rapid response assessment. United Nations Environment Programme, GRID-Arendal. www.grida.no; ISBN: 978-<br />
82-7701-060-1<br />
New Economics Foundation 2004a: Chasing progress: beyond measuring economic growth. New Economics Foundation,<br />
London. 6 p.<br />
New Economics Foundation 2004b: The power and potential of well-being indicators: measuring young people’s wellbeing<br />
in Nottingham: the power of well-being 2. New Economics Foundation, London. 56 p.<br />
New Economics Foundation 2004c: A well-being manifesto for a flourishing society: the power of well-being 3.<br />
New Economics Foundation, London. 24 p.<br />
The nature of wellbeing<br />
129
New Economics Foundation 2008: Measuring well-being in policy: issues and applications. New Economics Foundation.<br />
35 p.<br />
New Economics Foundation 2009: National accounts of well-being: bringing real wealth onto the balance sheet.<br />
New Economics Foundation, London. 72 p.<br />
New Economics Foundation 2011a: Measuring our progress: the power of well-being. New Economics Foundation,<br />
London. 44 p.<br />
New Economics Foundation 2011b: The practical politics of well-being. New Economics Foundation, London 44 p..<br />
New Economics Foundation 2012a: The Happy Planet Index: 2012 report. A global index of sustainable wellbeing.<br />
New Economics Foundation, London. 28 p.<br />
New Economics Foundation 2012b: Measuring well-being: a guide for practitioners. New Economics Foundation, London.<br />
33 p.<br />
New Economics Foundation 2012c: Natural solutions: nature’s role in delivering well-being and key policy goals—<br />
opportunities for the third sector. New Economics Foundation, London. 44 p.<br />
New Economics Foundation 2012d: Well-being and the role of Government. New Economics Foundation, London. 8 p.<br />
New Economics Foundation 2012e: Well-being evidence for policy: a review. New Economics Foundation, London. 88 p.<br />
Newman, J.; Scott, D.; Bragg, C.; McKechnie, S.; Moller, H.; Fletcher, D. 2009: Estimating regional population size and<br />
annual harvest intensity of the sooty shearwater in New Zealand. New Zealand Journal of Zoology 36(3): 307–323.<br />
Nickerson, C.; Schwarz, N.; Diener, E.; Kahneman, D. 2003: Zeroing in on the dark side of the American dream: a closer<br />
look at the negative consequences of the goal for financial success. Psychological Science 14(6): 531–536.<br />
Nicholls, C.I.; Altieri, M.A.; Ponti, L. 2008: Enhancing plant diversity for improved insect pest management in northern<br />
California organic vineyards. Acta horticulturae 785: 263–278.<br />
NIWA 2010: Waikato River independent scoping study. National Institute of Water and Atmospheric Research,<br />
Hamilton. 265 p. www.mfe.govt.nz/publications/treaty/waikato-river-scoping-study/index.html<br />
Norton, D.A. 2009: Species invasions and limits to restoration: learning from the New Zealand experience. Science 325:<br />
569–571.<br />
Nussbaum, M.C. 2001: Women and human development: the capabilities approach. Cambridge University Press,<br />
Cambridge.<br />
NZ Treasury 2011: Working towards higher living standards for New Zealanders. New Zealand Treasury Paper 11/02. 55p.<br />
www.treasury.govt.nz/publications/research-policy/tp/higherlivingstandards/tp-hls-may11.pdf<br />
NZCA (New Zealand Conservation Authority) 1997: Maori customary use of native birds, plants and other traditional<br />
materials—interim report and discussion paper. New Zealand Conservation Authority, Wellington. 178 p.<br />
NZIER 2013: Recreation and tourism benefits of conservation investment—a way ahead for estimating and<br />
demonstrating value. NZIER, Wellington.<br />
O’Connor, S.-J. 2013: Smart planting gets buzz back. The Press, 29 August 2013.<br />
Odum, E.C. 2004: A prosperous way down. Pp. 1–10 in Ortega, E.; Ulgiati, S. (Eds): Proceedings of IV Biennial<br />
International Workshop ‘Advances in Energy Studies’. Unicamp, Campinas, SP, Brazil. June 16–19, 2004.<br />
Odum, E.P. 1969: The strategy of ecosystem development. Science 164 (3877): 262–270.<br />
OECD 2011a: Towards green growth. OECD. www.oecd.org/greengrowth/48224539.pdf<br />
OECD 2011b: Towards green growth: monitoring progress. OECD indicators. OECD. www.oecd.org/<br />
greengrowth/48224574.pdf<br />
OECD 2014: Society at a glance 2014 highlights: New Zealand OECD social indicators. www.oecd.org/newzealand/<br />
OECD-SocietyAtaGlance2014-Highlights-NewZealand.pdf<br />
Ojea, E.; Martin-Ortega, J.; Chiabai, A. 2012: Defining and classifying ecosystem services for economic valuation: the case<br />
of forest water services. Environemental Science and Policy 19–20: 1–15.<br />
Orr, D. 1992: Ecological literacy: education and the transition to a post-modern world. State University of New York Press,<br />
New York. 210 p.<br />
Oviatt, C.A.; Keller, A.A.; Sampou, P.A.; Beatty, L.L. 1986: Patterns of productivity during eutrophication: a mesocosm<br />
experiment. Marine Ecology Progress Series 28(1–2): 69–80.<br />
130 The nature of wellbeing
Oviatt, C.A.; Lane, P.; French, F.III; Donagha, P. 1993: Phytoplankton species and abundance in response to eutrophication<br />
in coastal marine mesocosms. Journal of Plankton Research 11(6): 1223–1244.<br />
Owens, I.; Fitzharris, B. 2004: Seasonal snow and water. Pp. 5.1–5.12 in Harding, J.S.; Mosley, M.P.; Pearson, C.P.; Sorrell, B.K.<br />
(Eds): Freshwaters of New Zealand. New Zealand Hydrological Society and New Zealand Limnological Society,<br />
Christchurch.<br />
Packman, A.; MacKay, J. 2003: Interplay of stream-subsurface exchange, clay particle deposition, and streambed<br />
evolution. Water Resources Research 39(4): 1097.<br />
Page, A.R.; Lacy, K.L. 2006: Economic impact assessment of Australian weed biological control. Technical Series No. 10.<br />
CRC for Australian Weed Management, Adelaide.<br />
Page, M.J.; Northcote, P.T.; Webb, V.L.; Mackey, S.; Handley, S.J. 2005: Aquaculture trials for the production of biologically<br />
active metabolites in the New Zealand sponge Mycale hentscheli (Demospongiae: Poecilosclerida). Aquaculture<br />
250(1–2): 256–269.<br />
Park, G. 1995: Nga uruora: the groves of life: ecology and history in a New Zealand landscape. Victoria University Press,<br />
Wellington. 376 p.<br />
Parks, S.; Gowdy, J. 2013: What have economists learned about valuing nature? A review essay. Ecosystem Services 3:<br />
e1–e10.<br />
Parliamentary Commissioner for the Environment 2001: Weaving resilience into our working lands: future roles for<br />
native plants on private land. Parliamentary Commissioner for the Environment, Wellington.<br />
Pascual, U.; Muradian, R.; Brander, L.; Gómez-Baggethun, E.; Martín-López, B.; Verma, M.; Armsworth, P.; Christie, M.;<br />
Cornelissen, H.; Eppink, F.; Farley, J.; Loomis, J.; Pearson, L.; Perrings, C.; Polasky, S. 2010: The economics of<br />
valuing ecosystem services and biodiversity. In Kumar, P. (Ed.): The economics of ecosystems and biodiversity:<br />
ecological and economic foundations. Earthscan, London and Washington, DC. www.teebweb.org/wp-content/<br />
uploads/2013/04/D0-Chapter-5-The-economics-of-valuing-ecosystem-services-and-biodiversity.pdf<br />
Passchier-Vermeer, W.; Passchier, W.F. 2000: Noise exposure and public health. Environmental Health Perspectives<br />
108(Suppl 1): 123.<br />
Patterson, M.; Cole, A. 1999: Estimation of the value of ecosystem services in the Waikato Region. Environment Waikato<br />
Internal Series 1999/02. Environment Waikato, Hamilton. 32 p.<br />
Paul, K.I.; Moser, K. 2009: Unemployment impairs mental health: meta-analysis. Journal of vocational behavior 74(3):<br />
264–282<br />
Pchelin, P.; Howell, R.T. 2014: The hidden cost of value-seeking: people do not accurately forecast the economic benefits<br />
of experiential purchases. The Journal of Positive Psychology 9: 332–334. DOI: 10.1080/17439760.2014.898316<br />
Pearce, D.; Atkinson, G.; Mourato, S. 2006: Cost-benefit analysis and the environment: recent developments. OECD.<br />
Peterson, B.J.; Hershey, A.E.; McDowell, W.H.; Dodds, W.K.; Hamilton, S.K.; Gregory, S.; Morrall, D.D.; Wollheim, W.M.;<br />
Mulholland, P.J.; Webster, J.R.; Meyer, J.L.; Tank, J.L.; Marti, E.; Bowden, W.B.; Valett, H.M. 2001: Control of nitrogen<br />
export from watersheds by headwater streams. Science 292(5514): 86–90.<br />
Philippot, L.; Spor, A.; Hénault, C.; Bru, D.; Bizouard, F.; Jones, C.M.; Sarr, A.; Maron, P.-A. 2013: Loss in microbial diversity<br />
affects nitrogen cycling in soil. The ISME Journal 7: 1609–1619.<br />
Pillarisetti, J.R.; van den Bergh, J.C.J.M. 2007: Sustainable nations: what do aggregate indicators tell us? Tinbergen<br />
Institute, Amsterdam.<br />
Pillemer, K.; Fuller-Rowell, T.E.; Reid, M.C.; Wells, N.M. 2010: Environmental volunteering and health outcomes over a 20-<br />
year period. The Gerontologist 50(5): 594–602.<br />
Post, S.G. 2007: Altruism & health: perspectives from empirical research. Oxford University Press, New York. doi:10.1093/<br />
acprof:oso/9780195182910.001.0001<br />
Postel, S.L.; Carpenter, S.R. 1997: Freshwater ecosystem services. Pp. 195–214 in Daily, G.C. (Ed.): Nature’s services. Island<br />
Press, Washington, DC.<br />
Pound, F. 2009: The invention of New Zealand: art & national identity, 1930–1970. Auckland University Press, Auckland.<br />
Pressman, S.D.; Matthews, K.A.; Cohen, S.; Martire, L.M.; Scheier, M.; Baum, A.; Schulz, R. 2009: Association of enjoyable<br />
leisure activities with psychological and physical well-being. Psychosomatic Medicine 71(7): 725–732.<br />
Prestwood, S. 2001: Downstream from the dairy boom. The Dominion, 18 August.<br />
Princen, T. 2005: The logic of sufficiency. MIT Press, Cambridge, MA.<br />
The nature of wellbeing<br />
131
Project Twin Streams 2010: Project Twin Streams—a snapshot: May 2010. Project Twin Streams, Waitakere. 30 p. www.<br />
waitakere.govt.nz/abtcit/ne/pdf/2010/PTSMayoralPresBookLres.pdf<br />
Project Twin Streams 2012: Project Twin Streams: restoring the streambanks. http://projecttwinstreams.com/wp-content/<br />
uploads/2012/10/Planting-SinglePage-AW-LoRes4.pdf<br />
Purdey, S.J. 2010: Economic growth, the environment and international relations: the growth paradigm. Routledge<br />
Advances in International Political Economy Vol. 17. Routledge, New York. 192 p.<br />
Putnam, R.D. 2000: Bowling alone: the collapse and revival of American community. Simon & Schuster, New York, NY,<br />
USA.<br />
Quinn, J. 2009: Riparian management classification reference manual. NIWA Client Report: HAM2009-072 (unpublished).<br />
Quinn, J.; Cooper, A.; Williamson, R. 1993: Riparian zones as buffer strips: a New Zealand perspective. Pp. 53–88 in:<br />
Ecology and management of riparian zones in Australia. Proceedings of a National Workshop on Research and<br />
Management Needs for Riparian Zones in Australia, held in association with the 32nd annual congress of the<br />
Australian Society for Limnology, Marcoola.<br />
Quinn, J.M.; Brown, P.M.; Boyce, W.; Mackay, S.; Taylor, A.; Fenton, T. 2001: Riparian zone classification for management of<br />
stream water quality and ecosystem health. Journal of the American Water Resources Association 37(6): 1509–1515.<br />
Quinn, J.M.; Phillips, N.R.; Parkyn, S.M. 2007: Factors influencing retention of coarse particulate organic matter in<br />
streams. Earth Surface Processes and Landforms 32(8): 1186–1203.<br />
Quinn, J.M.; Smith, B.J.; Burrell, G.P.; Parkyn, S.M. 2000: Leaf litter characteristics affect colonisation by stream<br />
invertebrates and growth of Olinga feredayi (Trichoptera: Conoesucidae). New Zealand Journal of Marine and<br />
Freshwater Research 34(2): 273–287.<br />
Quoidbach, J.; Dunn, E.W.; Petrides, K.; Mikolajczak, M. 2010: Money giveth, money taketh away: the dual effect of wealth<br />
on happiness. Psychological Science 21(6): 759–763.<br />
Rader, R.; Edwards, W.; Westcott, D.A.; Cunningham, S.A.; Howlett, B.G. 2011: Pollen transport differs among bees and flies<br />
in a human-modified landscape. Diversity and Distributions 17: 519–529.<br />
Rader, R.; Edwards, W.; Westcott, D.A.; Cunningham, S.A.; Howlett, B.G. 2013: Diurnal effectiveness of pollination by bees<br />
and flies in agricultural Brassica rapa: implications for ecosystem resilience. Basic and Applied Ecology 14: 20–27.<br />
Rader, R.; Howlett, B.G.; Cunningham, S.A.; Westcott, D.A.; Edwards, W. 2012: Spatial and temporal variation in pollinator<br />
effectiveness: do unmanaged insects provide consistent pollination services to mass flowering crops? Journal of<br />
Applied Ecology 49: 126–134.<br />
Rader, R.; Howlett, B.G.; Cunningham, S.A.; Westcott, D.A.; Newstrom-Lloyd, L.E.; Walker, M.K.; Teulon, D.A.J.; Edwards, W.<br />
2009: Alternative pollinator taxa are equally efficient but not as effective as the honeybee in a mass flowering crop.<br />
Journal of Applied Ecology 46: 1080–1087.<br />
Rajanayaka, C.; Donaggio, J.; McEwan, H. 2010: Update of water allocation data and estimate of actual water use of<br />
consented takes—2009–10. Aqualinc Report No. H10002/3. Prepared for Ministry for the Environment. 124 p. www.<br />
mfe.govt.nz/publications/water/water-allocation-2009-10/update-of-water-allocation-data-and-estimate-of-actualwater-use-of-consented-takes.pdf<br />
Rauschmayer, F.; Omann, I.; Frühmann, J. (Eds) 2011: Sustainable development: capabilities, needs, and well-being.<br />
Routledge (Routledge Studies in Ecological Economics), London. 192 p.<br />
Regnier, P.; Friedlingstein, P.; Ciais, P.; Mackenzie, F.T.; Gruber, N.; Janssens, I.A.; Laruelle, G.G.; Lauerwald, R.; Luyssaert,<br />
S.; Andersson, A.J.; Arndt, S.; Arnosti, C.; Borges, A.V.; Dale, A.W.; Gallego-Sala, A.; Godderis, Y.; Goossens, N.;<br />
Hartmann, J.; Heinze, C.; Ilyina, T.; Joos, F.; LaRowe, D.E.; Leifeld, J.; Meysman, F.J.R.; Munhoven, G.; Raymond, P.A.;<br />
Spahni, R.; Suntharalingam, P.; Thullner, M. 2013: Anthropogenic perturbation of the carbon fluxes from land to<br />
ocean [Review]. Nature Geoscience 6: 597–607.<br />
Reid, L.A.; Hunter, C.J. 2013: Exploring the potential for a ‘double dividend’: living well and living greener. Chapter 1. Pp.<br />
7–19 in Coles, R.; Millman, Z. (Eds): Landscape, well-being and environment. Routledge, Abingdon, Oxon.<br />
Reis, H.T.; Gable, S.L. 2003: Toward a positive psychology of relationships. Pp. 129–159 in Keyes, C.L.; Haidt, J. (Eds):<br />
Flourishing: positive psychology and the life well-lived. American Psychological Association, Washington, DC.<br />
Richards, K.; Peel. J. 2005: Outdoor cure. Therapy Today 16(10). www.therapytoday.net/article/show/1833/<br />
Richardson, E.A.; Pearce, J.; Mitchell, R.; Kingham, S. 2013: Role of physical activity in the relationship between urban<br />
green space and health. Public Health 127(4): 318–324.<br />
Rist, G. 2011: The delusions of economics: the misguided certainties of a hazardous science. Zed Books.<br />
132 The nature of wellbeing
Robb, C.; Bright, J. 2004: Values and uses of water. Pp. 42.1–42.14 in Harding, J.; Mosley, M.; Pearson, C.; Sorrell, B.<br />
(Eds): Freshwaters of New Zealand. New Zealand Hydrological Society and New Zealand Limnological Society,<br />
Christchurch.<br />
Roberts, C.M. (Ed.) 2013: New Zealand’s indigenous biodiversity: agents of decline: status of native landcover and<br />
ecosystems and current threat assessments of taxa: a compilation of current literature to advise policy.<br />
Department of Conservation.<br />
Robertson, E. 2008: Medicinal plants at risk. Nature’s pharmacy, our treasure chest: why we must conserve our natural<br />
heritage. Center for Biological Diversity, Tucson, AZ. 16 p. www.biologicaldiversity.org/publications/papers/<br />
Medicinal_Plants_042008_lores.pdf<br />
Robertson, K.; Loza-Balbuena, I.; Ford Robertson, J. 2004: Monitoring and economic factors affecting the economic<br />
viability of afforestation for carbon sequestration projects, Environmental Science & Policy 7: 465–475.<br />
Rocha, J.; Biggs, R.; Peterson, G.; Carpenter, S. 2013: Freshwater eutrophication. In: Regime Shifts Database. www.<br />
regimeshifts.org<br />
Rogers, C. 1961: On becoming a person: a therapist’s view of psychotherapy. Houghton Mifflin, Boston.<br />
Rolfe, J.; Bennett, J. 2006: Choice modelling and the transfer of environmental values. Edward Elgar, Northampton, MA.<br />
Rolfe, J.; Bennett, J.; Johnston, R.; Kerr, G. 2011: ‘Yes we can…’: using benefit transfer to inform environmental policy<br />
making. EERH Policy Brief. Environmental Economics Research Hub. 4 p.<br />
Rosenberger, R.; Johnston, R. 2010: Methods, trends and controversies in contemporary benefit transfer. Journal of<br />
Economic Surveys 24(3): 479–510.<br />
Rowe, D.; Saxton, B.; Stancliff, A. 1992: Species composition of whitebait (Galaxiidae) fisheries in 12 Bay of Plenty rivers,<br />
New Zealand: evidence for river mouth selection by juvenile Galaxias brevipinnis (Günther). New Zealand<br />
Journal of Marine and Freshwater Research 26(2): 219–228.<br />
Rowe, D.K.; Smith, J.; Quinn, J.; Boothroyd, I. 2002: Effects of logging with and without riparian strips on fish species<br />
abundance, mean size, and the structure of native fish assemblages in Coromandel, New Zealand, streams. New<br />
Zealand Journal of Marine and Freshwater Research 36(1): 67–79.<br />
Rowe, G.; Clifford, C.H.; Smith, K.L.Jr; Hamilton, P.L. 1975: Benthic nutrient regeneration and its coupling to primary<br />
productivity in coastal waters. Nature 255: 215–217.<br />
Ryan, R.; Chirkov, V.; Little, T.; Sheldon, K.; Timoshina, E.; Deci, E. 1999: The American dream in Russia: extrinsic<br />
aspirations and well-being in two cultures. Personality and Social Psychology Bulletin 25(10): 1509–1524.<br />
Ryan, R.; Deci, E. 2000: Self-determination theory and the facilitation of intrinsic motivation, social development, and<br />
well-being. American Psychologist 55(1): 68–78.<br />
Ryff, C.D. 1989: Happiness is everything, or is it—explorations on the meaning of psychological well-being. Journal of<br />
Personality and Social Psychology 57(6): 1069–1081.<br />
Ryff, C.D. 1995: Psychological well-being in adult life. Current Directions in Psychological Science 32: 119–128.<br />
Sabine, C.L.; Feely, R.A.; Gruber, N.; Key, R.M.; Lee, K.; Bullister, J.L.; Wanninkhof, R.; Wong, C.S.; Wallace, D.W.R.; Tilbrook,<br />
B.; Millero, F.J.; Peng, T.H.; Kozyr, A.; Ono, T.; Rios, A.F. 2004: The oceanic sink for anthropogenic CO2. Science<br />
305(5682): 367–371.<br />
Sagoff, M. 2011: The quantification and valuation of ecosystem services. Ecological Economics 70(3): 497–502.<br />
Samarasinghe, O.; Greenhalgh, S. 2013: Valuing the soil natural capital: a New Zealand case study. Soil Research 51(4):<br />
278–287.<br />
Samarasinghe, O.; Sharp, B. 2008: Flood prone risk and amenity values: a spatial hedonic analysis. Symposium conducted<br />
at the meeting of the 52nd annual conference of the Australian Agricultural and Resource Economics Society,<br />
Perth, Australia.<br />
Samarasinghe, O.; Briggs, C.; Greenhalgh, S. 2009: Mapping the values of New Zealand’s coastal waters. 5. A metaanalysis<br />
of economic values. MAF Biosecurity New Zealand Technical Paper No: 2010/09. Ministry of Agriculture<br />
and Forestry, Wellington, New Zealand. 76 p. www.biosecurity.govt.nz/files/pests/salt-freshwater/economic-valuesmapping-analysis.pdf<br />
(accessed 28 July 2014).<br />
Sanderson, K.; Saunders, C.; Nana, G.; Stroombergen, A.; Campbell, H.; Fairweather, J.; Heinemann, A. 2003: Economic<br />
risks and opportunities from the release of genetically modified organisms in New Zealand. Ministry for the<br />
Environment, Wellington.<br />
The nature of wellbeing<br />
133
Sandhu, H.S.; Wratten, S.; Cullen, R.; Hale, R. 2005: Evaluating nature’s services on Canterbury arable farmland: a<br />
summary of results for farmers particpating in this research project. Lincoln University. www.lincoln.ac.nz/<br />
documents/1542_FarmReport_s4627.pdf<br />
Scarsbrook, M.R.; Quinn, J.M.; Halliday, J.; Morse, R. 2001: Factors controlling litter input dynamics in streams draining<br />
pasture, pine, and native forest catchments. New Zealand Journal of Marine and Freshwater Research 35(4):<br />
751–762.<br />
Schallenberg, M.; de Winton, M.; Verburg , P.; Kelly, D.; Hamill, K.; Hamilton, D. 2013: Ecosystem services of lakes.<br />
Pp. 203–225 in Dymond, J.R. (Ed.): Ecosystem services in New Zealand: conditions and trends. Manaaki Whenua<br />
Press, Lincoln.<br />
Schallenberg, M.; Sorrell, B. 2009: Regime shifts between clear and turbid water in New Zealand lakes: environmental<br />
correlates and implications for management and restoration. New Zealand Journal of Marine and Freshwater<br />
Research 43(3): 701–712.<br />
Schauss, A.G. 2010: Emerging knowledge of the bioactivity of foods in the diets of indigenous North Americans. Pp. 71–<br />
84 in Watson, R.R.; Preedy, V.R. (Eds): Bioactive foods in promoting health: fruits and vegetables. Elsevier, London.<br />
Scheffer, M.; Carpenter, S.; Foley, J.A.; Folke, C.; Walker, B. 2001: Catastrophic shifts in ecosystems. Nature 413(6856):<br />
591–596.<br />
Scheffer, M.; Carpenter, S.R. 2003: Catastrophic regime shifts in ecosystems: linking theory to observation. Trends in<br />
Ecology & Evolution 18(12): 648–656.<br />
Scheffer, M.; Hosper, S.H.; Meijer, M.L.; Moss, B.; Jeppesen, E. 1993: Alternative equilibria in shallow lakes. Trends in<br />
Ecology & Evolution 8(8): 275–279.<br />
Schwartz, B.; Ward, A.; Monterosso, J.; Lyubomirsky, S.; White, K.; Lehman, D.R. 2002: Maximizing versus satisficing:<br />
happiness is a matter of choice. Journal of Personality and Social Psychology 83(5): 1178–1197.<br />
Scott, N.A.; White, J.D.; Townsend, J.A.; Whitehead, D.; Leathwick, J.R.; Hall, G.M.J.; Marden, M.; Rogers, G.N.D.; Watson,<br />
A.J.; Whaley, P.T. 2000: Carbon and nitrogen distribution and accumulation in a New Zealand Scrubland<br />
Ecosystem. Canadian Journal of Forest Research 30: 1246–1522.<br />
Seafood New Zealand 2013: New Zealand seafood exports. Report 7: Seafood exports by product type. Calendar year<br />
to June 2013 (provisional). Seafood New Zealand. 110 p. www.seafoodnewzealand.org.nz/fileadmin/documents/<br />
Export_data/2013.06.7.pdf<br />
Sebba, R. 1991: The landscapes of childhood: the reflection of childhood’s environment in adult memories and in<br />
children’s attitudes. Environment and Behaviour 23(4): 395–422.<br />
Seitzinger, S.; Harrison, J.A.; Böhlke, J.K.; Bouwman, A.F.; Lowrance, R.; Peterson, B.; Tobias, C.; Van Drecht, G. 2006:<br />
Denitrification across landscapes and waterscapes: a synthesis. Ecological Applications 16: 2064–2090.<br />
Selby, R. (Ed.) 2010: Maori and the environment: kaitiaki. Huia, Wellington.<br />
Seligman, M.E.P. 2002: Authentic happiness: using the new positive psychology to realise your potential for lasting<br />
fulfilment. Free Press, New York. 320 p.<br />
Seligman, M. 2011: Flourish: a visionary new understanding of happiness and well-being. Free Press, New York. 349 p.<br />
Sen, A. 1985: Well-being, agency and freedom: the Dewey lectures 1984. The Journal of Philosophy 82(4): 169–221.<br />
Sen, A. 1999: Development as freedom. Oxford University Press, Oxford.<br />
Sen, A. 2005: Human rights and capabilities. Journal of Human Development 6(2): 151–166.<br />
Sengupta, N.K.; Osborne, D.; Houkamau, C.A.; Hoverd, W.J.; Wilson, M.S.; Halliday, L.; West-Newman, T.; Barlow, F.K.;<br />
Armstrong, G.; Robertson, A. 2012: How much happiness does money buy? Income and subjective well-being in<br />
New Zealand. New Zealand Journal of Psychology 41(2): 21–34.<br />
Sharp, B.; Kerr, G. 2005: Option and existence values for the Waitaki catchment. Ministry for the Environment,<br />
Wellington. 19 p. www.mfe.govt.nz/publications/water/waitaki-option-existence-values-jan05/waitaki-optionexistence-values-jan05.pdf<br />
Sheppard, R.; Kerr, G.; Cullen, R.; Ferguson, T. 1993: Contingent valuation of improved water quality in the lower<br />
Waimakariri River. Agribusiness and Economics Research Unit, Lincoln University, Lincoln.<br />
Simmons, D.G. 2013: Tourism and ecosystem services in New Zealand. Pp. 343–348 in Dymond, J. (Ed.): Ecosystem<br />
services in New Zealand: conditions and trends. Manaaki Whenua Press, Lincoln.<br />
134 The nature of wellbeing
Simmons, D.G.; Wilson, J. 2014: State of the tourism industry in New Zealand 2013. Lincoln University, with assistance<br />
from Statistics New Zealand, the Ministry of Business, Innovation & Employment and the Tourism Industry<br />
Association New Zealand. http://tourism2025.org.nz/making-it-happen/state-of-the-tourism-industry-2013/<br />
Sipkema, D.; Osinga, R.; Schatton, W.; Mendola, D.; Tramper, J.; Wijffels, R.H. 2005: Large-scale production of<br />
pharmaceuticals by marine sponges: sea, cell, or synthesis? Biotechnology and Bioengineering 90(2): 201–222.<br />
Slater, G. 2010: The ability of urban parks to reduce air temperatures of surrounding neighbourhoods: a study of 4<br />
Toronto parks. University of Guelph, Ontario.<br />
Smale, B.; Donohoe, H.; Pelot, C.; Croxford, A.; Auger, D. 2010: Leisure and culture: a report of the Canadian Index of<br />
Wellbeing (CIW). University of Waterloo, Ontario. 134 p. https://uwaterloo.ca/canadian-index-wellbeing/sites/<br />
ca.canadian-index-wellbeing/files/uploads/files/Leisure_and_Culture-Full_Report.sflb_.pdf<br />
Smith, A. 1776: An inquiry into the nature and causes of the wealth of nations. George Routledge and Sons, London.<br />
Smith, C. 2010: The next oil shock? Parliamentary Research Paper, Parliamentary Services, New Zealand. 12 p.<br />
Smith, L.M.; Case, J.L.; Harwell, L.C.; Smith, H.M.; Summers, J.K. 2013a: Development of relative importance values as<br />
contribution weights for evaluating human wellbeing: an ecosystem services example. Human Ecology 41: 631–641.<br />
Smith, L.M.; Case, J.L.; Smith, H.M.; Harwell, L.C.; Summers, J.K. 2013b: Relating ecosystem services to domains of human<br />
well-being: foundation for a U.S. index. Ecological Indicators 28: 79–90.<br />
Smith, P.B.; Max-Neef, M. 2010: Economics unmasked: from power and greed to compassion and the common good.<br />
Green Books, Devon. 200 p.<br />
Smith, T.W. 2003: Altruism in contemporary America: a report from the National Altruism Study. National Opinion<br />
Research Center, University of Chicago, Chicago, IL, USA.<br />
Sointu, E. 2005: The rise of an ideal: tracing changing discourses of wellbeing. The Sociological Review 53(2): 255–274.<br />
Solow, R. 2010: Building a science of economics for the real world. Hearing in the U.S. Congress, July 20, 2010. http://<br />
www.gpo.gov/fdsys/pkg/CHRG-111hhrg57604/pdf/CHRG-111hhrg57604.pdf<br />
Soros, G. 2011: My philanthropy. The New York Review of Books, June 2011.<br />
SPARC (Sport and Recreation New Zealand) 2009a: Sport and recreation profile: Fishing—findings from the 2007/08<br />
Active New Zealand Survey. SPARC, Wellington. www.activenzsurvey.org.nz/Documents/sport-profiles/Fishing.<br />
pdf<br />
SPARC (Sport and Recreation New Zealand) 2009b: Sport and recreation profile: Gardening—findings from the<br />
2007/08 Active New Zealand Survey. SPARC, Wellington. www.activenzsurvey.org.nz/Documents/sport-profiles/<br />
Gardening.pdf<br />
Statistics New Zealand 2012: Tourism satellite Account 2012—the contribution made by tourism to the New Zealand<br />
Economy. Statistics New Zealand, Wellington.<br />
Statistics New Zealand 2013: Tourism satellite account 2013. Statistics New Zealand, Wellington. 73 p.<br />
Steger, M.F.; Dik, B.J.; Duffy, R.D. 2012: Measuring meaningful work: the work and meaning inventory (WAMI). Journal of<br />
Career Assessment 20: 322–337.<br />
Stephens, J.M.C.; Molan, P.C.; Clarkson, B.D. 2005: A review of Leptospermum scoparium (Myrtaceae) in New Zealand,<br />
New Zealand Journal of Botany 43(2): 431–449. DOI: 10.1080/0028825X.2005.9512966<br />
Stiglitz, J.E.; Sen, A.; Fitoussi, J.-P. 2009: Report by the Commission on the Measurement of Economic Performance and<br />
Social Progress. 291 p. www.stiglitz-sen-fitoussi.fr/documents/rapport_anglais.pdf<br />
Stiglitz, J.E.; Sen, A.K.; Fitoussi, J.-P. 2010: Mismeasuring our lives. The New Press.<br />
Stockholm Resilience Centre 2011: What is resilience? An introduction to social-ecological research. Stockholm<br />
Resilience Centre & Stockholm University. 20 p. www.stockholmresilience.org/download/18.2f48c3c31429b6ad0a61<br />
cde/1388130768344/SRC_whatisresilience_sida.pdf<br />
Sturrock, J.W. 1969: Aerodynamic studies of shelterbelts in New Zealand 1: low to medium height shelterbelts in mid-<br />
Canterbury. New Zealand Journal of Science 12: 754–756.<br />
Sturrock, J.W. 1981: Shelter boosts crop yield by 35 per cent: also prevents lodging. New Zealand Journal of Agriculture<br />
143: 18–19.<br />
Suding, K.N.; Gross, K.L.; Houseman, G.R. 2004: Alternative states and positive feedbacks in restoration ecology. Trends<br />
in Ecology & Evolution 19(1): 46–53.<br />
The nature of wellbeing<br />
135
Sundback, K.; Miles, A.; Hulth, S.; Pihl, L.; Engstrom, P.; Selander, E.; Svenson, A. 2003: Importance of benthic nutrient<br />
regeneration during initiation of macroalgal blooms in shallow bays. Marine Ecology Progress Series 246: 115–126.<br />
Sunde, C. 2012: Cultural knowledge systems and the ecosystem approach: a holistic interpretation for the Iwi Ecosystem<br />
Services Approach. Ngā Māramatanga-ā-Papa (Iwi Ecosystem Services) Research Monograph Series No. 10.<br />
Massey University and Landcare Research/Manaaki Whenua, Palmerston North. 27 p.<br />
Swarbrick, N. 2012: Logging native forests—sustainable forest management. In: Te Ara—the Encyclopedia of New Zealand.<br />
www.TeAra.govt.nz/en/logging-native-forests/page-7 (updated 13 July 2012).<br />
Tait, P.; Baskaran, R.; Cullen, R.; Bicknell, K. 2011: Valuation of agricultural impacts on rivers and streams using choice<br />
modelling: a New Zealand case study. New Zealand Journal of Agricultural Reserach 54(3): 143–154.<br />
Takatsuka, Y.; Cullen, R.; Wilson, M.; Wratten, S. 2009: Using stated preference techniques to value four key ecosystem<br />
services on New Zealand arable land. International Journal of Agricultural Sustainability 7(4): 279–291.<br />
Tāne’s Tree Trust 2011: Planting and managing native trees. Tāne’s Tree Trust.<br />
Tank, J.L.; Rosi-Marshall, E.J.; Griffiths, N.A.; Entrekin, S.A.; Stephen, M.L. 2010: A review of allochthonous organic matter<br />
dynamics and metabolism in streams. Journal of the North American Benthological Society 29(1): 118–146.<br />
Tanner, C.C.; Nguyen, M.L.; Sukias, J.P.S. 2005: Nutrient removal by a constructed wetland treating subsurface drainage<br />
from grazed dairy pasture. Agriculture, Ecosystems and Environment 105(1): 145–162.<br />
Tate, K.R.; Giltrap, D.J.; Claydon, J.J.; Newsome, P.F.; Atkinson, I.A.E.; Taylor, M.D.; Lee, R. 1997: Organic carbon stocks in<br />
New Zealand’s terrestrial ecosystems. Journal of the Royal Society of New Zealand 27(3): 315–335.<br />
Tay, L.; Diener, E. 2011: Needs and subjective well-being around the world. Journal of Personality and Social Psychology<br />
101(2): 354–365.<br />
Taylor, M. 2011: Soil quality and trace element monitoring in the Waikato region 2009. Waikato Regional<br />
Council Technical Report 2011/13. Waikato Regional Council, Hamilton. 39 p. www.waikatoregion.govt.nz/<br />
PageFiles/19960/TR201113.pdf<br />
Taylor, N.; Griffiths, R.; Cotter, J. 1994: Epidemiology of hypothermia: fatalities and hospitalisations in New Zealand.<br />
Australian and New Zealand Journal of Medicine 24(6): 705–710.<br />
TEEB 2010a: The economics of ecosystems and biodiversity: ecological and economic foundations. Earthscan, London<br />
and Washington, DC.<br />
TEEB 2010b: The economics of ecosystems and biodiversity: mainstreaming the economics of nature: a synthesis of the<br />
approach, conclusions and recommendations of TEEB. TEEB.<br />
TEEB 2011: The economics of ecosystems and biodiversity in national and international policy making. Earthscan,<br />
London and Washington, DC.<br />
Thompson, W. 2013: Water, water everywhere: how it nourishes Auckland. The New Zealand Herald, 14 May 2013. www.<br />
nzherald.co.nz/nz/news/article.cfm?c_id=1&objectid=10883408<br />
Thrush, S.F.; Dayton, P.K. 2002: Disturbance to marine benthic habitats by trawling and dredging—implications for<br />
marine biodiversity. Annual Review of Ecology and Systematics 33: 449–473.<br />
Thrush, S.F.; Dayton, P.K. 2010: What can ecology contribute to ecosystem-based management? Annual Review of Marine<br />
Science 2: 419–441.<br />
Tipa, G.; Teirney, L.D. 2006: A cultural health index for streams and waterways: a tool for nationwide use. Ministry for the<br />
Environment, Wellington.<br />
Tompkins, J.-M. 2010: Ecosystem services provided by native New Zealand plants in vineyards. Unpublished PhD thesis,<br />
Lincoln University, Lincoln. 282 p.<br />
Townsend, M. 2006: Feel blue? Touch green! Participation in forest/woodland management as a treatment for<br />
depression. Urban Forestry & Urban Greening 5(3): 111–120.<br />
Townsend, M.; Hewitt, J.; Philips, N.; Coco, G. 2009: Interactions between heavy metals, sediment and cockle feeding and<br />
movement. Auckland Regional Council Technical Report TR 2010/023. Prepared by NIWA for Auckland Regional<br />
Council.<br />
Townsend, M.; Thrush, S. 2010: Ecosystem functioning, goods and services in the coastal environment. Prepared by<br />
NIWA. Auckland Regional Council Technical Report 2010/033. Auckland Regional Council, Auckland, New<br />
Zealand. 53 p. www.aucklandcouncil.govt.nz/SiteCollectionDocuments/aboutcouncil/planspoliciespublications/<br />
technicalpublications/tr2010033ecosystemfunctioninggoodsandservicesinthecoastalenvironment.pdf (accessed<br />
31 July 2014).<br />
136 The nature of wellbeing
Townsend, M.; Thrush, S.F.; Lohrer, A.M.; Hewitt, J.E.; Lundquist, C.J.; Carbines, M.; Felsing, M. 2014: Overcoming the<br />
challenges of data scarcity in mapping marine ecosystem service potential. Ecosystem Services 8: 44–55.<br />
Turner, R.K.; Morse-Jones, S.; Fisher, B. 2010: Ecosystem valuation: a sequential decision support system and quality<br />
assessment issues. Annals of the New York Academy of Sciences 1185(1): 79–101.<br />
UK NEA (National Ecosystem Assessment) 2011: The UK National Ecosystem Assessment: synthesis of the key findings.<br />
UNEP-WCMC, Cambridge.<br />
UNEP Finance Inititative 2008: Biodiversity and ecosystem services: bloom or bust?<br />
Van den Belt, M.; Cole, A. 2014: Ecosystem goods and services in marine protected areas (MPAs). Science for<br />
Conservation 326. Department of Conservation, Wellington, New Zealand. 96 p.<br />
Van Heezik, Y.M.; Dickinson, K.J.M.; Freeman, C. 2012: Closing the gap: communicating to change gardening practices<br />
in support of native biodiversity in urban private gardens. Ecology and Society 17(1): article 34. 9 p. http://dx.doi.<br />
org/10.5751/ES-04712-170134<br />
Veenhoven, R. 1995: World database of happiness. Social Indicators Research 34(3): 299–313.<br />
Veenhoven, R. 2010: Life is getting better: societal evolution and fit with human nature. Social Indicators Research 97(1):<br />
105–122.<br />
Verburg, P.; Horrox, J.; Chaney, E.; Rutherford, J.C.; Quinn, J.M.; Wilcock, R.J.; Howard-Williams, C.W. 2013: Nutrient<br />
ratios, differential retention, and the effect on nutrient limitation in a deep oligotrophic lake. Hydrobiologia 718:<br />
119–130.<br />
Vesley, E.T. 2009: Framework for Project Twin Stream’s value case and its application for environmental outcomes.<br />
Landcare Research Contract Report: 0910/097. Prepared for Waitakere City Council by Landcare Research Ltd.<br />
Victor, P.A. 2008: Managing without growth: slower by design, not disaster. Edward Elgar Publishing.<br />
Vohs, K.D.; Mead, N.L.; Goode, M.R. 2006: The psychological consequences of money. Science 314(5802): 1154–1156.<br />
Wackernagel, M.; Rees, W. 1996: Our ecological footprint: reducing human impact on the Earth (Vol. 9). New Society<br />
Publishers, Gabriola Island, BC.<br />
Waikato Regional Council 2011: Hamilton Halo Project post operation report 2011. Waikato Regional Council, Hamilton.<br />
10 p. www.waikatoregion.govt.nz/PageFiles/233/Reports/S3220%20Hamilton%20Halo%20Post%20Operation%20<br />
Report%202011_WEB.pdf<br />
Waitangi Tribunal 2011: Ko Aotearoa tenei: Tuatahi. Waitangi Tribunal, Wellington.<br />
Walker, B.; Salt, D. 2006: Resilience thinking: sustaining ecosystems and people in a changing world. Island Press,<br />
Washington, DC.<br />
Wallace, K. 2007: Classification of ecosystem services: problems and solutions. Biological Conservation 139(3): 235–246.<br />
Wallace, K. 2008: Ecosystem services: multiple classifications or confusion? Biological Conservation 141(2): 353–354.<br />
Walrond, C. 2012: Freshwater fishing—management and culture. In: Te Ara—the Encyclopedia of New Zealand. www.<br />
TeAra.govt.nz/en/freshwater-fishing/page-4 (updated 13 July 2012).<br />
Waring, M. 1999: Counting for nothing: what men value and what women are worth. University of Toronto Press, Toronto.<br />
Waterman, A.S. 1993: Two conceptions of happiness: contrasts of personal expressiveness (eudaimonia) and hedonic<br />
enjoyment. Journal of Personality and Social Psychology 64: 678–691.<br />
Watson, C.A. 2006: Are community gardens a good use of land in New Zealand? Unpublished B.Surveying Hons thesis,<br />
University of Otago, Dunedin.<br />
Watts, I.E.M. 1947: The relations of New Zealand weather and climate: an analysis of the westerlies. New Zealand<br />
Geographer 3(2): 115–129.<br />
WBCSD 2011: Guide to corporate ecosystem valuation: a framework for improving corporate decision-making. World<br />
Business Council for Sustainable Development, Geneva.<br />
WCED (World Commission on Environment and Development) 1987: Our common future. Report of the World<br />
Commission on Environment and Development. Oxford University Press, Oxford. 400 p.<br />
Wehi, P.M.; Clarkson, B.D. 2007: Biological flora of New Zealand 10. Phormium tenax, harakeke, New Zealand flax.<br />
New Zealand Journal of Botany 45(4): 521–544.<br />
Weiner, E. 2008: The geography of bliss: one grump’s search for the happiest places in the world. Hachette Digital, Inc.<br />
The nature of wellbeing<br />
137
Weintraub, E.R. 2007: Neoclassical economics. The concise encyclopedia of economics. www.econlib.org/library/Enc1/<br />
NeoclassicalEconomics.html<br />
Wells, N.M. 2000: At home with nature: the effects of nearby nature on children’s cognitive functioning. Environment &<br />
Behavior 32: 775–795.<br />
Wells, N.M.; Evans, G.W. 2003: Nearby nature: a buffer of life stress in rural children. Environment & Behavior 35(3):<br />
311–330.<br />
Welsch, H. 2009: Implications of happiness research for environmental economics. Ecological Economics 68(11):<br />
2735–2742.<br />
Welsh, C. 1991: A contingent valuation study of consumers’ willingness to pay for water: an approach to conserving<br />
Christchurch’s groundwater resource. Unpublished MSc thesis, Lincoln University, Lincoln. 72 p.<br />
Welsh, C. 2001: Community benefits survey: stormwater and wastewater improvements. Report prepared for Ecowater:<br />
Resource and Environmental Management, Auckland.<br />
Westerkamp, C.; Gottsberger, G. 2000: Diversity pays in crop pollination. Crop Science 40(5): 1209–1222.<br />
White, P.A.; Sharp, B.M.; Kerr, G.N. 2001: Economic valuation of the Waimea Plains groundwater system. Journal of<br />
Hydrology (New Zealand) 40(1): 59–76.<br />
Wilcock, R.J.; Müller, K.; van Assema, G.B.; Bellingham, M.A.; Ovenden, R. 2012: Attenuation of nitrogen, phosphorus<br />
and E. coli inputs from pasture runoff to surface waters by a farm wetland: the importance of wetland shape and<br />
residence time. Water, Air, & Soil Pollution 223(2): 499–509.<br />
Williams, D.R.; Patterson, M.E. 2008: Place, leisure and well-being. Pp. 105–120 in Eyles, J.; Williams, A. (Eds): Sense of<br />
place, health and quality of life. Ashgate Publishing, Farnham.<br />
Williamson, R.B.; Smith, R.K.; Quinn, J. 1992: Effects of riparian grazing and channelisation on streams in Southland,<br />
New Zealand. 1. Channel form and stability. New Zealand Journal of Marine and Freshwater Research 26(2): 241–258.<br />
Wilmers, C.C.; Estes, J.A.; Edwards, M.; Laidre, K.L.; Konar, B. 2012: Do trophic cascades affect the storage and flux of<br />
atmospheric carbon? An analysis of sea otters and kelp forests. Frontiers in Ecology and the Environment 10(8):<br />
409–415.<br />
Wilson, J.; Tyedmers, P.; Spinney, J.E.L. 2013: An exploration of the relationship between socieconomic and well-being<br />
variables and household greenhouse gas emissions. Journal of Industrial Ecology 17(6): 880–891.<br />
Winkelmann, R. 2009: Unemployment, social capital, and subjective well-being. Journal of Happiness Studies 10: 421–430.<br />
Winkworth, C.L.; Mattaei, C.D.; Townsend, C. 2010: Using native riparian barriers to reduce Giardia in agricultural runoff<br />
to freshwater ecosystems. Journal of Water and Health 8(4): 631–645.<br />
Witten, K.; Kearns, R.; Carroll, P.; Asiasiga, L.; Tava’e, N. 2013: New Zealand parents’ understandings of the<br />
intergenerational decline in children’s independent outdoor play and active travel. Children’s Geographies 11(2):<br />
215–229.<br />
Wollast, R. 1998: Evaluation and comparison of the global carbon cycle in the coastal zone and in the open ocean.<br />
Pp. 213–252 in Brink, K.H.; Robinson, A.R. (Eds): Global coastal ocean Vol. 10. John Wiley & Sons Inc., New York.<br />
Wood, A. 2012: Starry skies boost for SI tourism. The Press, 11 June 2012.<br />
Woodfield, A.; Cowie, D. 1977: The Milford Track: valuation estimates of a recreation good. Australian Journal of<br />
Agricultural and Resource Economics 21(2): 97–110.<br />
World Bank 1997: Expanding the measure of wealth: indicators of environmentally sustainable development.<br />
Environmentally Sustainable Development Studies and Monographs Series No. 17. The World Bank, Washington,<br />
DC.<br />
World Bank 2006: Where is the wealth of nations?: measuring capital for the 21st century (0821363549, 9780821363546).<br />
The World Bank, Washington, DC. 188 p. http://siteresources.worldbank.org/<br />
INTEEI/214578-1110886258964/20748034/All.pdf<br />
World Bank 2011: The changing wealth of nations: measuring sustainable development in the new millennium. The<br />
World Bank, Washington, DC. doi:10.1596/978-0-8213-8488-6<br />
Worm, B.; Barbier, E.B.; Beaumont, N.; Duffy, J.E.; Folke, C.; Halpern, B.S.; Jackson, J.B.; Lotze, H.K.; Micheli, F.; Palumbi,<br />
S.R. 2006: Impacts of biodiversity loss on ocean ecosystem services. Science 314(5800): 787–790.<br />
Wouters, M. 2011: Socio-economic effects of concession-based tourism in New Zealand’s national parks. Science for<br />
Conservation 309. Department of Conservation, Wellington. 90 p.<br />
138 The nature of wellbeing
Wratten, S.D.; Gillespie, M.; Decourtye, A.; Mader, E.; Desneux, N. 2012: Pollinator habitat enhancement: benefits to other<br />
ecosystem services. Agriculture, Ecosystems & Environment 159: 112–122.<br />
Yamaguchi, M.; Halberstadt, J. 2012: Goals and well being in New Zealand. New Zealand Journal of Psychology 41(2):<br />
5–10.<br />
Yao, R.; Kaval, P. 2007: Non market valuation in New Zealand: 1974 through 2005. Working Paper in Economics 07/17.<br />
Department of Economics, University of Waikato, Hamilton.<br />
Yao, R.; Kaval, P. 2008: Valuing biodiversity enhancement in New Zealand. Working Paper in Economics 08/07.<br />
Department of Economics, University of Waikato, Hamilton.<br />
Yeates, G. 2012: Earthworms. In: Te Ara—the Encyclopedia of New Zealand. www.TeAra.govt.nz/en/earthworms (updated<br />
9 November 2012).<br />
Young, D. 2013: Rivers: New Zealand’s shared legacy. Random House.<br />
Young, D.C. 2004: Our islands, our selves: a history of conservation in New Zealand. Otago University Press, Dunedin.<br />
Zehnder, G.; Gurr, G.M.; Kühne, S.; Wade, M.R.; Wratten, S.D.; Wyss, E. 2007: Arthropod pest management in organic<br />
crops. Annual Review of Entomology 52: 57–80<br />
Zhang, J.W.; Howell, R.T.; Caprariello, P.A. 2013: Buying life experiences for the “right” reasons: a validation of the<br />
motivations for Experiential Buying Scale. Journal of Happiness Studies 14(3): 817–842.<br />
The nature of wellbeing<br />
139
Appendix 1<br />
Glossary of wellbeing terms<br />
Authentic happiness<br />
Happiness that is the result of informed and free choices as part of an autonomous life; ‘a<br />
response of one’s own, to a life that is one’s own’ (Haybron 2008: 24). Authentic happiness was<br />
developed in detail by Seligman (2002) in his book Authentic Happiness: using the new positive<br />
psychology to realize your potential for lasting fulfillment. He argued that there are three ‘routes’<br />
to happiness: The Pleasant Life (optimally filled with pleasure or positive affect—see Glossary<br />
entry); the Good Life (filled with engagement through use of one’s strengths and allied to the<br />
notion of Eudaimonia—see later in Glossary); the Meaningful Life (filled with purpose and<br />
awareness of being part of something greater than oneself).<br />
Biophilia<br />
The innate tendency of human beings to seek connections with nature and other forms of life.<br />
Edward O. Wilson introduced and popularised the biophilia hypothesis in his book Biophilia<br />
(1984). Biophilic design promotes the integration of natural shapes, forms and processes in<br />
building and landscape design, with the assumption that bringing nature into our daily lives is<br />
restorative because it emulates our species’ long history living in natural surroundings.<br />
easterlin Paradox<br />
The finding that as a person’s income increases over time, their level of subjective wellbeing<br />
(SWB) measured as life satisfaction (see later in Glossary) does not, as first reported by Richard<br />
Easterlin. This contrasts with the consistent finding in the literature that those with more income<br />
within a society have slightly higher SWB than those with less, and that those countries with<br />
higher GDP also have higher SWB than countries with lower GDP. Easterlin explained the<br />
paradox in terms of relative levels of income rather than absolute levels of income driving the<br />
effect on SWB. There has been debate over the paradox but it remains widely accepted.<br />
eudaimonic approaches<br />
Eudaimonia emphasises wellbeing as the result of ‘nature fulfillment’—becoming who one is.<br />
Literally, it is Greek for ‘good spirit’ or ‘true nature’ and was first presented systematically by<br />
Aristotle. While, in psychology, subjective wellbeing (see later in Glossary) is often considered<br />
to be synonymous with ‘happiness’ and to be primarily a hedonistic theory of wellbeing, there<br />
has been a long-standing acknowledgment of a more eudaimonic account of wellbeing. The<br />
work of Ryff (1989), Waterman (1993) and Deci & Ryan (2008) has helped to develop this view of<br />
wellbeing.<br />
Flourishing<br />
‘To flourish means to live within an optimal range of human functioning, one that connotes<br />
goodness, generativity, growth, and resilience’ (Fredrickson & Losada 2005: 678). The notion of<br />
flourishing considers an optimal, whole-person, pervasive orientation that produces positive<br />
consequences in life. It is usually contrasted with the term ‘languishing’, which represents a life<br />
that is characterised by a sense of emptiness and hollowness, which is intermediate between<br />
flourishing, on the one hand, and mental ill-health, on the other. Seligman’s (2011) Flourish: a<br />
visionary new understanding of happiness and well-being argued that wellbeing, rather than<br />
happiness, should be considered at the centre of positive psychology (the study of the positive<br />
potential of human psychology). He contrasted his earlier theory of authentic happiness (see<br />
Glossary entry) to a new theory that goes by the acronym ‘PERMA’ (see later in Glossary).<br />
140 The nature of wellbeing
Happiness<br />
A general term that is used, often inconsistently, to denote various aspects of wellbeing. It has,<br />
however, tended to be used to describe the positive affective states associated with wellbeing.<br />
Interestingly, historically (e.g. at the time of the writing of the American Declaration of<br />
Independence) it had a more social meaning that was consistent with ‘the common good’, but for<br />
most of the 20th Century it came to mean a significant positive emotional state.<br />
Hedonistic approaches<br />
Approaches that emphasise the attainment of pleasure and the avoidance of pain as the central<br />
characteristics of wellbeing. This is based on the assumption that welfare is dependent upon<br />
the ‘pleasantness of our experience of life’ (Haybron 2008: 22). Hedonistic approaches tend to<br />
theorise wellbeing as a state to be attained rather than as a process of living (cf. eudaimonic<br />
approaches). Subjective wellbeing, as usually defined, is generally said to be a hedonistic theory<br />
of wellbeing.<br />
Hedonic treadmill<br />
Based on the theory that people have a hedonic ‘set point’—a level of happiness that is<br />
homeostatically maintained—so that positive or negative events only temporarily move feelings<br />
up or down before they return to the set level. This is also known as hedonic adaptation, which<br />
is the tendency to adapt to positive or negative events (such as winning the lottery or failing in<br />
a competitive sport). The hedonic treadmill follows from possession of a hedonic set point, since<br />
people will need to repeatedly seek out experiences that provide positive hedonic value without<br />
experiencing any long-term improvement in their overall hedonic state—i.e. they are continually<br />
pursuing hedonic improvement but ultimately they get nowhere.<br />
Life satisfaction<br />
A ‘global’ measure of a person’s satisfaction with how their life is currently going. It is usually<br />
measured as a self-report on a simple scale of perceived satisfaction. Common scales include<br />
the Satisfaction With Life Scale (SWLS) (developed by Ed Diener 125 ) and Cantril’s (1965)<br />
‘ladder’ (developed as part of his public opinion research and now used by the Gallup polling<br />
company 126 ). Life satisfaction is often used in studies of ‘happiness’ and, famously, is the<br />
dependent variable in many economic studies of the effect of income on wellbeing and the<br />
Easterlin Paradox (see earlier Glossary entry).<br />
negative affect<br />
Emotions, moods and feelings that are generally considered unpleasant and disturbing. These<br />
include high arousal emotions such as fear and hostility (anger), and low arousal feelings such as<br />
guilt and sadness. Negative affect is one of the three components that is commonly understood<br />
to comprise subjective wellbeing (SWB) and is often measured by asking people to self-report on<br />
the extent to which they have experienced them over a certain time period (e.g. the last week). A<br />
major scale used to assess its presence is the ‘Positive Affect/ Negative Affect Scale (sometimes<br />
‘schedule’)’ (PANAS), which was first developed by Watson et al. (1988). An international short<br />
(I-PANAS-SF) and expanded (PANAS-X) version of the schedule have also been developed.<br />
objective wellbeing<br />
While not as widely used or recognised as subjective wellbeing (SWB), it is sometimes used<br />
to indicate aspects of wellbeing that do not rely on self-reports and which represent specific,<br />
measurable features of the environment or of someone’s experience that are considered to be<br />
part of wellbeing. These include political attributes such as freedom and the rule of law, social<br />
factors such as educational attainment and access to public health provision, and biological<br />
125<br />
http://internal.psychology.illinois.edu/~ediener/SWLS.html<br />
126<br />
www.gallup.com/poll/122453/understanding-gallup-uses-cantril-scale.aspx<br />
The nature of wellbeing<br />
141
factors concerning physical wellness. At the population level, objective wellbeing is often tracked<br />
using a range of ‘social indicators’, such as infant mortality, life expectancy, literacy rates and<br />
the presence of non-communicable diseases such as obesity. When compared with SWB, it is<br />
sometimes criticised as being ‘paternalistic’; for example, when considering how best to measure<br />
wellbeing, the Office of National Statistics in the UK had this to say 127 :<br />
The objective well-being approach assumes that people have basic needs and rights, ranging<br />
from adequate food and water to physical health and education. Using this approach well-being<br />
can be assessed through analysis of objective (observable) indicators of the extent to which these<br />
needs/rights are satisfied.<br />
• Examples of such indicators include:<br />
• GDP, household income and wealth<br />
• the proportion of children in education, educational attainment, life expectancy and crime<br />
rates<br />
• air pollution, water quality and fish stocks<br />
Objective well-being measures are well established in the literature, however, this approach is<br />
paternalistic: it assumes that certain things are good or bad for well-being.<br />
PERMA<br />
PERMA is the acronym used by Seligman (2011) to summarise his theory of flourishing. It<br />
expands upon his earlier work (Seligman 2002) on authentic happiness to include elements of<br />
success and mastery. The acronym comprises the following five elements:<br />
P = Positive emotion<br />
E = Engagement<br />
R = Relationships<br />
M = Meaning and purpose<br />
A = Accomplishment<br />
Each of these elements has three properties: it must contribute to wellbeing; it is often pursued<br />
for its own sake; and it can be defined and measured without reference to any other element.<br />
Positive affect<br />
Emotions, moods and feelings that are generally experienced as enjoyable, pleasant or valuable.<br />
These include high arousal positive emotions such as joy and excitement, and low arousal<br />
feelings like serenity, self-assurance and attentiveness. It is often commonly called ‘happiness’.<br />
Positive affect is one of the three components that are commonly understood to comprise<br />
subjective wellbeing (SWB) and is often measured by asking people to self-report on the extent to<br />
which they have experienced them over a certain time period. A major scale that is used to assess<br />
its presence is the ‘Positive Affect / Negative Affect Scale (sometimes ‘schedule’)’ (PANAS),<br />
which was first developed by Watson et al. (1988). An international short (I-PANAS-SF) and<br />
expanded (PANAS-X) version of the schedule have also been developed.<br />
Quality of life<br />
A term that is sometimes used interchangeably with ‘wellbeing’ but applies to the general<br />
wellbeing of both individuals and societies. It is usually used in the area of international<br />
development and is measured in terms of a range of social (and ecological) indicators. The most<br />
well-known measure of quality of life is the United Nations’ Human Development Index. It is also<br />
associated with notions of ‘liveability’, especially in the field of urban studies.<br />
127<br />
http://webarchive.nationalarchives.gov.uk/20110422103457/well-being.dxwconsult.com/2011/02/24/objective-vs-subjective-wellbeing/<br />
142 The nature of wellbeing
Self-determination theory<br />
A theory that was developed by Ryan & Deci (2000), which postulates that the fundamental<br />
human needs associated with human wellbeing are competence, autonomy and relatedness. The<br />
theory represents a eudaimonic approach (see Glossary entry) to wellbeing and suggests that,<br />
when enhanced, the needs result in improved mental health and self-motivation.<br />
Social indicators<br />
These are a range of measures of objective wellbeing (see Glossary entry) that represent,<br />
usually at the population level, the dimensions of positive functioning at the social level that<br />
are assumed to contribute to national and individual wellbeing. Indices of social indicators of<br />
wellbeing include the Human Development Index (and associated reports) produced by the<br />
United Nations Human Development Programme.<br />
Subjective wellbeing (SWB)<br />
This has been described as ‘experiencing a high level of positive affect, a low level of negative<br />
affect, and a high degree of satisfaction with one’s life’ (Deci & Ryan 2008: 1). It is now understood<br />
as a compound measurement involving measures of positive affect (see Glossary entry), negative<br />
affect (see Glossary entry) and life satisfaction (see Glossary entry). There are scales that<br />
measure each component (e.g. Positive Affect / Negative Affect Scale (or schedule) (PANAS);<br />
Satisfaction With Life Scale (SWLS)); and scales that provide a global measure all components<br />
(e.g. The Oxford Happiness Inventory (OHI) (the work of Michael Argyle and colleagues) and the<br />
Fordyce Happiness Measures (FHM) (Fordyce 1977)).<br />
Wellbeing<br />
Wellbeing concerns all objective and subjective components and factors that are inherent in a<br />
positively flourishing life. In psychology it is understood subjectively, but in other disciplines<br />
it is concerned with a range of social indicators (see Glossary entry) that bear on social and<br />
individual functioning.<br />
References<br />
Deci, E.; Ryan, R. 2008: Hedonia, eudaimonia, and well-being: an introduction. Journal of Happiness Studies 9(1): 1–11.<br />
Fordyce, M.W. 1977: Development of a program to increase personal happiness. Journal of Counseling Psychology 24:<br />
511–520.<br />
Fredrickson, B.L.; Losada, M.F. 2005: Positive affect and the complex dynamics of human flourishing. American<br />
Psychologist 60(7): 678–686.<br />
Haybron, D.M. 2008: Philosophy and the science of subjective well-being. Pp. 17–43 in Eid, M.; Larsen, R.J. (Eds): The<br />
science of subjective well-being. Guilford Press, New York.<br />
Ryan, R.; Deci, E. 2000: Self-determination theory and the facilitation of intrinsic motivation, social development, and<br />
well-being. American Psychologist 55(1): 68–78.<br />
Ryff, C.D. 1989: Happiness is everything, or is it—explorations on the meaning of psychological well-being. Journal of<br />
Personality and Social Psychology 57(6): 1069–1081.<br />
Seligman, M.E.P. 2002: Authentic happiness: using the new positive psychology to realise your potential for lasting<br />
fulfilment. Free Press, New York. 320 p.<br />
Seligman, M. 2011: Flourish: a visionary new understanding of happiness and well-being. Free Press, New York. 349 p.<br />
Waterman, A.S. 1993: Two conceptions of happiness: contrasts of personal expressiveness (eudaimonia) and hedonic<br />
enjoyment. Journal of Personality and Social Psychology 64: 678–691.<br />
Watson, D.; Clark, L.A.; Tellegen, A. 1988: Development and validation of brief measures of positive and negative affect:<br />
the PANAS scales. Journal of Personality and Social Psychology 54(6): 1063–1070.<br />
Wilson, E.O. 1984: Biophilia. Harvard University Press, Cambridge.<br />
The nature of wellbeing<br />
143
Appendix 2<br />
Summary of major approaches to wellbeing and human needs<br />
Different theories of human needs relate most directly to more eudaimonistically oriented<br />
approaches to human wellbeing. For example, Maslow’s needs hierarchy and Max-Neef’s nine<br />
human needs are consistent with a humanistic approach to psychology, which assumes that a<br />
distinctive set of needs make up human nature and fulfillment of these needs creates wellbeing.<br />
These are summarised in table A2.1.<br />
References<br />
Deci, E.L.; Ryan, R.M. 2000: The ‘what’ and ‘why’ of goal pursuits: human needs and the self-determination of<br />
behavior. Psychological Inquiry 11: 227–268.<br />
Diener, E. 1984: Subjective well-being. Psychological Bulletin 95(3): 542–575.<br />
Fredrickson, B.L.; Losada, M.F. 2005: Positive affect and the complex dynamics of human flourishing. American<br />
Psychologist 60(7): 678–686.<br />
Putnam, R.D. 1993: Making democracy work: civic traditions in modern Italy. Princeton University Press, Princeton,<br />
New Jersey. 258 p.<br />
Putnam, R.D. 2000: Bowling alone: the collapse and revival of American community. Simon & Schuster, New York, NY,<br />
USA.<br />
Ryff, C.D. 1989: Happiness is everything, or is it—explorations on the meaning of psychological well-being. Journal of<br />
Personality and Social Psychology 57(6): 1069–1081.<br />
Seligman, M.E.P. 2002: Authentic happiness: using the new positive psychology to realise your potential for lasting<br />
fulfilment. Free Press, New York. 320 p.<br />
Seligman, M. 2011: Flourish: a visionary new understanding of happiness and well-being. Free Press, New York. 349 p.<br />
144 The nature of wellbeing
Table A2.1: Summary table of Maslow’s needs hierarchy and Max-Neef’s nine human needs.<br />
Science of wellbeing Research<br />
emphases<br />
Components Theories and<br />
Maslow’s needs Max-Neef’s needs<br />
theorists<br />
Objective/social wellbeing<br />
(OWB)<br />
Physical health Rates of disease (including NCDs), fitness/<br />
activity, life expectancy, child mortality, etc.<br />
Various Physiological Subsistence<br />
Social indicators Education levels, literacy, political freedoms,<br />
levels of trust, etc.<br />
Putnam (1993, 2000) —<br />
Social Capital; HDI<br />
Safety and security Protection; participation;<br />
freedom; understanding<br />
Subjective/psychological<br />
wellbeing (SWB)<br />
Hedonic<br />
approaches<br />
(‘state’)<br />
Eudaimonic<br />
approaches<br />
(‘process’)<br />
Presence of ‘positive affect’—‘happiness’ Seligman (2002)—‘Authentic<br />
happiness’<br />
Diener (1984)—‘Subjective<br />
wellbeing’ (SWB)<br />
Fredrickson & Losada<br />
Life satisfaction—cognitive evaluation (belief) (2005)—‘Broaden and build’<br />
about how one’s life is going<br />
theory of positive affect<br />
Love and belongingness Affection#<br />
Absence of ‘negative affect’—‘unhappiness’ N/A N/A<br />
Seligman (2002)—‘Authentic<br />
happiness’<br />
Seligman (2011)—‘Flourish’<br />
and ‘PERMA’<br />
Ryff (1989)—‘Psychological<br />
wellbeing’<br />
Deci & Ryan (2000)—‘Selfdetermination<br />
theory’<br />
Love and belongingness;<br />
esteem<br />
Love and belongingness;<br />
esteem*<br />
Participation; freedom<br />
Participation; freedom<br />
Engagement/relatedness Love and belongingness Identity; participation<br />
Wellbeing / quality of life<br />
Meaning/purpose in life Self-actualisation Leisure/idleness; identity<br />
Autonomy/personal growth Esteem; self-actualisation Leisure/idleness; freedom;<br />
creation<br />
Accomplishment/competence/environmental<br />
mastery<br />
Safety and security; esteem Understanding; creation<br />
Self-acceptance (Self)Esteem* Identity; understanding<br />
Relationships Love and belongingness Affection/participation; identity<br />
* Maslow’s ‘esteem’ need was sub-divided into ‘self-esteem’ and ‘other-esteem’ (esteem from others).<br />
The nature of wellbeing<br />
145