Dodge & Cox International Stock Fund Fact Sheet as of June 30, 2013
Dodge & Cox International Stock Fund Fact Sheet as of June 30, 2013
Dodge & Cox International Stock Fund Fact Sheet as of June 30, 2013

You also want an ePaper? Increase the reach of your titles
YUMPU automatically turns print PDFs into web optimized ePapers that Google loves.
<strong>International</strong><br />
<strong>Stock</strong> <strong>Fund</strong><br />
December 31, 2014<br />
Ticker Symbol<br />
DODFX<br />
Objectives<br />
Strategy<br />
Risks<br />
• The <strong>Fund</strong> seeks long-term growth <strong>of</strong> principal and income.<br />
• The <strong>Fund</strong> invests primarily in a diversified portfolio <strong>of</strong> equity securities issued by non-U.S. companies from at le<strong>as</strong>t three different<br />
countries, including emerging market countries. The <strong>Fund</strong> focuses on countries whose economic and political systems appear<br />
more stable and are believed to provide some protection to foreign shareholders. The <strong>Fund</strong> invests primarily in medium-to-large<br />
well established companies b<strong>as</strong>ed on standards <strong>of</strong> the applicable market.<br />
• The <strong>Fund</strong> is subject to stock market risk, meaning stocks in the <strong>Fund</strong> may decline in value for extended periods due to the financial<br />
prospects <strong>of</strong> individual companies or due to general market and economic conditions. Investing in non-U.S. securities may entail<br />
risk due to foreign economic and political developments; this risk may be higher when investing in emerging markets. Ple<strong>as</strong>e read<br />
the prospectus for specific details regarding the <strong>Fund</strong>’s risk pr<strong>of</strong>ile.<br />
GENERAL INFORMATION<br />
Net Asset Value Per Share $42.11<br />
Total Net Assets (billions) $64.0<br />
Expense Ratio 0.64%<br />
Portfolio Turnover Rate 12%<br />
<strong>30</strong>-Day SEC Yield (a) 1.59%<br />
<strong>Fund</strong> Inception 2001<br />
No sales charges or distribution fees<br />
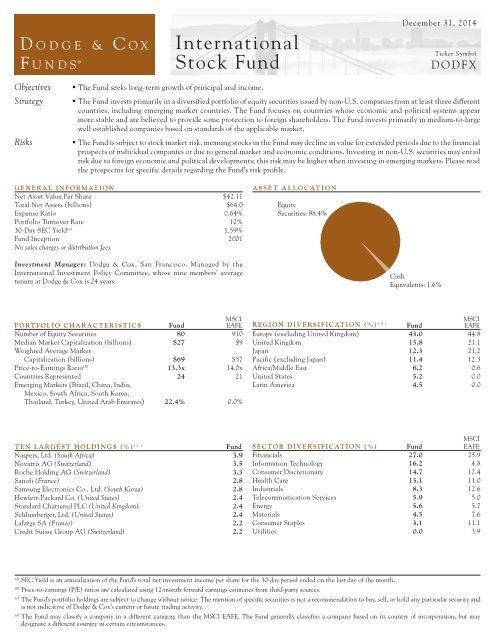
ASSET ALLOCATION<br />
Equity<br />
Securities: 98.4%<br />
Investment Manager: <strong>Dodge</strong> & <strong>Cox</strong>, San Francisco. Managed by the<br />
<strong>International</strong> Investment Policy Committee, whose nine members’ average<br />
tenure at <strong>Dodge</strong> & <strong>Cox</strong> is 24 years.<br />
C<strong>as</strong>h<br />
Equivalents: 1.6%<br />
MSCI<br />
PORTFOLIO CHARACTERISTICS <strong>Fund</strong> EAFE<br />
Number <strong>of</strong> Equity Securities 80 910<br />
Median Market Capitalization (billions) $27 $9<br />
Weighted Average Market<br />
Capitalization (billions) $69 $57<br />
Price-to-Earnings Ratio (b) 13.3x 14.0x<br />
Countries Represented 24 21<br />
Emerging Markets (Brazil, China, India,<br />
Mexico, South Africa, South Korea,<br />
Thailand, Turkey, United Arab Emirates) 22.4% 0.0%<br />
MSCI<br />
REGION DIVERSIFICATION (%) ( d ) <strong>Fund</strong> EAFE<br />
Europe (excluding United Kingdom) 43.0 44.8<br />
United Kingdom 15.8 21.1<br />
Japan 12.3 21.2<br />
Pacific (excluding Japan) 11.4 12.3<br />
Africa/Middle E<strong>as</strong>t 6.2 0.6<br />
United States 5.2 0.0<br />
Latin America 4.5 0.0<br />
TEN LARGEST HOLDINGS (%) ( c )<br />
<strong>Fund</strong><br />
N<strong>as</strong>pers, Ltd. (South Africa) 3.9<br />
Novartis AG (Switzerland) 3.5<br />
Roche Holding AG (Switzerland) 3.3<br />
San<strong>of</strong>i (France) 2.8<br />
Samsung Electronics Co., Ltd. (South Korea) 2.8<br />
Hewlett-Packard Co. (United States) 2.4<br />
Standard Chartered PLC (United Kingdom) 2.4<br />
Schlumberger, Ltd. (United States) 2.4<br />
Lafarge SA (France) 2.2<br />
Credit Suisse Group AG (Switzerland) 2.2<br />
MSCI<br />
SECTOR DIVERSIFICATION (%) <strong>Fund</strong> EAFE<br />
Financials 27.0 25.9<br />
Information Technology 16.2 4.8<br />
Consumer Discretionary 14.7 12.4<br />
Health Care 13.1 11.0<br />
Industrials 8.3 12.6<br />
Telecommunication Services 5.9 5.0<br />
Energy 5.6 5.7<br />
Materials 4.5 7.6<br />
Consumer Staples 3.1 11.1<br />
Utilities 0.0 3.9<br />
(a)<br />
SEC Yield is an annualization <strong>of</strong> the <strong>Fund</strong>’s total net investment income per share for the <strong>30</strong>-day period ended on the l<strong>as</strong>t day <strong>of</strong> the month.<br />
(b)<br />
Price-to-earnings (P/E) ratios are calculated using 12-month forward earnings estimates from third-party sources.<br />
(c)<br />
The <strong>Fund</strong>’s portfolio holdings are subject to change without notice. The mention <strong>of</strong> specific securities is not a recommendation to buy, sell, or hold any particular security and<br />
is not indicative <strong>of</strong> <strong>Dodge</strong> & <strong>Cox</strong>’s current or future trading activity.<br />
(d)<br />
The <strong>Fund</strong> may cl<strong>as</strong>sify a company in a different category than the MSCI EAFE. The <strong>Fund</strong> generally cl<strong>as</strong>sifies a company b<strong>as</strong>ed on its country <strong>of</strong> incorporation, but may<br />
designate a different country in certain circumstances.
Average Annual Total Return 1<br />
For periods ended<br />
December 31, 2014 1 Year 3 Years 5 Years 10 Years<br />
<strong>Dodge</strong> & <strong>Cox</strong> <strong>International</strong> <strong>Stock</strong> <strong>Fund</strong> 0.07% 15.23% 7.89% 6.73%<br />
MSCI EAFE Index –4.90 11.06 5.34 4.43<br />
www.dodgeandcox.com<br />
Returns represent p<strong>as</strong>t performance and do not guarantee future results. Investment return and share price will fluctuate with market conditions, and investors<br />
may have a gain or loss when shares are sold. <strong>Fund</strong> performance changes over time and currently may be significantly lower than stated above. Performance is<br />
updated and published monthly. Visit the <strong>Fund</strong>’s website at www.dodgeandcox.com or call 800-621-3979 for current month-end performance figures.<br />
The <strong>Dodge</strong> & <strong>Cox</strong> <strong>International</strong> <strong>Stock</strong> <strong>Fund</strong> had a total return <strong>of</strong> –4.7% for<br />
the fourth quarter <strong>of</strong> 2014, compared to –3.6% for the MSCI EAFE (Europe,<br />
Austral<strong>as</strong>ia, Far E<strong>as</strong>t) Index. For 2014, the <strong>Fund</strong> had a total return <strong>of</strong> 0.1%,<br />
compared to –4.9% for the MSCI EAFE. At year end, the <strong>Fund</strong> had net <strong>as</strong>sets<br />
<strong>of</strong> $64.0 billion with a c<strong>as</strong>h position <strong>of</strong> 1.6%.<br />
MARKET COMMENTARY<br />
During the fourth quarter, international equity markets incre<strong>as</strong>ed slightly in<br />
local currency. However, the U.S. dollar’s significant appreciation against both<br />
developed and emerging market currencies w<strong>as</strong> a headwind to returns. The MSCI<br />
EAFE w<strong>as</strong> up 2% in local currency and down 4% in U.S. dollars; Japan (up 7% in<br />
local currency) w<strong>as</strong> a particularly strong area <strong>of</strong> the market. The MSCI Emerging<br />
Markets Index w<strong>as</strong> flat in local currency and down 5% in U.S. dollars.<br />
Global oil prices collapsed approximately 40% during the quarter amid<br />
lower-than-expected demand growth and modestly higher-than-expected supply<br />
growth. While consumers and oil importers benefited from lower oil prices, many<br />
oil-exporting countries were negatively impacted. For example, the MSCI Russia<br />
Index w<strong>as</strong> down 33% and MSCI Norway Index w<strong>as</strong> down 25% in U.S. dollars.<br />
There are persistent concerns about global economic growth due to weak<br />
manufacturing data in the Eurozone, slowing growth in China, and turmoil in<br />
the Middle E<strong>as</strong>t and E<strong>as</strong>tern Europe, among other issues. Despite this backdrop,<br />
we continue to see long-term opportunity for international equities <strong>as</strong> we look<br />
for attractively valued investments in both developed and emerging markets.<br />
<strong>International</strong> equity valuations remain re<strong>as</strong>onable: the MSCI EAFE traded at<br />
14.0 times forward estimated earnings with a 3.1% dividend yield at quarter<br />
end. Corporate balance sheets and c<strong>as</strong>h flows continue to be strong. The <strong>Fund</strong><br />
is invested in companies that we believe have favorable long-term prospects over<br />
our three- to five-year investment horizon. Acknowledging that both share prices<br />
and currencies can be volatile in the short term, we encourage shareholders to<br />
remain focused on the long term.<br />
FOURTH QUARTER PERFORMANCE REVIEW<br />
The <strong>Fund</strong> underperformed the MSCI EAFE by 1.1 percentage points during<br />
the quarter.<br />
KEY DETRACTORS FROM RELATIVE RESULTS<br />
Weak returns from the <strong>Fund</strong>’s holdings in the Energy sector (down 29%<br />
compared to down 19% for the MSCI EAFE sector), especially in the Energy<br />
Equipment & Services (oil services) industry, hindered performance. Saipem<br />
(down 50%), Petrobr<strong>as</strong> (down 49%), and Weatherford <strong>International</strong> (down<br />
45%) performed poorly.<br />
The <strong>Fund</strong>’s overweight position (14% versus 11%) and holdings in the Health<br />
Care sector (down 8% compared to down 5% for the MSCI EAFE sector) hurt<br />
results. San<strong>of</strong>i (down 19%) w<strong>as</strong> a notable detractor.<br />
The <strong>Fund</strong>’s holdings in the Telecommunication Services sector (down 8%<br />
compared to flat for the MSCI EAFE sector) detracted from results. America<br />
Movil (down 11%) and MTN Group (down 9%) especially lagged.<br />
Additional detractors included Standard Chartered (down 19%) and<br />
UniCredit (down 18%).<br />
KEY CONTRIBUTORS TO RELATIVE RESULTS<br />
Strong returns from the <strong>Fund</strong>’s holdings in the Media industry (up 14%<br />
compared to up 5% for the MSCI EAFE industry) helped results, especially<br />
N<strong>as</strong>pers (up 19%) and Liberty Global (up 18%).<br />
The <strong>Fund</strong>’s overweight position (16% versus 5%) and holdings in the<br />
Information Technology sector (up 3% compared to down 1% for the MSCI<br />
EAFE sector) aided performance. TE Connectivity (up 15%), Hewlett-Packard<br />
(up 14%), Samsung Electronics (up 8%), and Baidu (up 4%) performed well.<br />
Additional contributors included ICICI Bank (up 20%), Yamaha Motor (up<br />
5%), and Barclays (up 3%).<br />
2014 PERFORMANCE REVIEW<br />
The <strong>Fund</strong> outperformed the MSCI EAFE by 5.0 percentage points in 2014.<br />
KEY CONTRIBUTORS TO RELATIVE RESULTS<br />
The <strong>Fund</strong>’s holdings in emerging markets (up 14%), particularly in the<br />
Financials sector (up 26%), significantly contributed to results. ICICI Bank<br />
(up 60%), K<strong>as</strong>ikornbank (up 47%), and China Mobile (up 24% since date <strong>of</strong><br />
purch<strong>as</strong>e) were notable performers.<br />
Strong returns from the <strong>Fund</strong>’s holdings in the Media industry (up 21%<br />
compared to up 1% for the MSCI EAFE industry) helped performance,<br />
especially N<strong>as</strong>pers (up 26%).<br />
The <strong>Fund</strong>’s average overweight position (16% versus 5%) and holdings in the<br />
Information Technology sector (up 10% compared to down 1% for the MSCI<br />
EAFE sector) aided results. Hewlett-Packard (up 46%) and Baidu (up 28%)<br />
were strong performers.<br />
Additional contributors included Yamaha Motor (up 38%), Nidec (up 35%),<br />
NGK Spark Plug (up 31%), and Novartis (up 19%).<br />
KEY DETRACTORS FROM RELATIVE RESULTS<br />
The <strong>Fund</strong>’s average overweight position (15% versus 11%) and selection <strong>of</strong><br />
holdings in the Health Care sector (down 3% compared to up 6% for the MSCI<br />
EAFE sector) hindered performance. GlaxoSmithKline (down 16%) and<br />
San<strong>of</strong>i (down 12%) performed poorly.<br />
The <strong>Fund</strong>’s underweight position in the Utilities sector (no holdings versus<br />
4% for the MSCI EAFE sector), the second-strongest sector <strong>of</strong> the market (up<br />
4%), hurt results.<br />
Additional detractors included Saipem (down 51%), Petrobr<strong>as</strong> (down 46%),<br />
Standard Chartered (down <strong>30</strong>%), and Millicom <strong>International</strong> Cellular (down<br />
24%).<br />
1<br />
The <strong>Fund</strong>’s total returns include the reinvestment <strong>of</strong> dividend and capital gain<br />
distributions, but have not been adjusted for any income taxes payable by shareholders<br />
on these distributions or on <strong>Fund</strong> share redemptions. Index returns include dividends<br />
but, unlike <strong>Fund</strong> returns, do not reflect fees or expenses. The MSCI EAFE (Europe,<br />
Austral<strong>as</strong>ia, Far E<strong>as</strong>t) Index is a broad-b<strong>as</strong>ed, unmanaged equity market index<br />
aggregated from 21 developed market country indices, excluding the United States<br />
and Canada. MSCI makes no express or implied warranties or representations and<br />
shall have no liability whatsoever with respect to any MSCI data contained herein.<br />
The MSCI data may not be further redistributed or used <strong>as</strong> a b<strong>as</strong>is for other indices<br />
or any securities or financial products. This report is not approved, reviewed, or<br />
produced by MSCI. All returns are stated in U.S. dollars, unless otherwise noted.<br />
MSCI EAFE is a service mark <strong>of</strong> MSCI Barra.<br />
Before investing in any <strong>Dodge</strong> & <strong>Cox</strong> <strong>Fund</strong>, you should carefully consider the <strong>Fund</strong>’s investment objectives, risks, and charges and expenses. To obtain a <strong>Fund</strong>’s prospectus<br />
and summary prospectus, which contain this and other important information, visit www.dodgeandcox.com or call 800-621-3979. Ple<strong>as</strong>e read the prospectus and<br />
summary prospectus carefully before investing.<br />
12/14 ISF FS