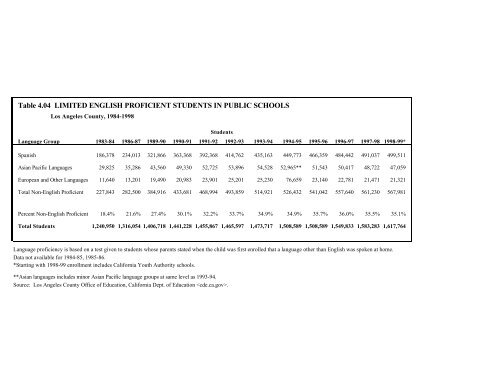
Table 4.04 LIMITED ENGLISH PROFICIENT STUDENTS IN PUBLIC SCHOOLS <strong>Los</strong> <strong>Angeles</strong> County, 1984-1998 Students Language Group 1983-84 1986-87 1989-90 1990-91 1991-92 1992-93 1993-94 1994-95 1995-96 1996-97 1997-98 1998-99* Spanish 186,378 234,013 321,866 363,368 392,368 414,762 435,163 449,773 466,359 484,442 491,037 499,511 Asian Pacific Languages 29,825 35,286 43,560 49,330 52,725 53,896 54,528 52,965** 51,543 50,417 48,722 47,059 European and Other Languages 11,640 13,201 19,490 20,983 23,901 25,201 25,230 76,659 23,140 22,781 21,471 21,321 Total Non-English Pr<strong>of</strong>icient 227,843 282,500 384,916 433,681 468,994 493,859 514,921 526,432 541,042 557,640 561,230 567,981 Percent Non-English Pr<strong>of</strong>icient 18.4% 21.6% 27.4% 30.1% 32.2% 33.7% 34.9% 34.9% 35.7% 36.0% 35.5% 35.1% Total Students 1,240,950 1,316,054 1,406,718 1,441,228 1,455,867 1,465,597 1,473,717 1,508,589 1,508,589 1,549,833 1,583,283 1,617,764 Language pr<strong>of</strong>iciency is based on a test given to students whose parents stated when the child was first enrolled that a language other than English was spoken at home. Data not available for 1984-85, 1985-86. *Starting with 1998-99 enrollment includes California Youth Authority schools. **Asian languages includes minor Asian Pacific language groups at same level as 1993-94. Source: <strong>Los</strong> <strong>Angeles</strong> County Office <strong>of</strong> Education, California Dept. <strong>of</strong> Education .
Table 4.05 SPANISH SPEAKING STUDENTS BY GRADE LEVEL AND ENGLISH PROFICIENCY <strong>Los</strong> <strong>Angeles</strong> County, 1998-99 Spanish Speaking Students in Public Schools Fluent English Pr<strong>of</strong>icient Limited English Pr<strong>of</strong>icienct Grade Number % Number % Total % Kindergarten 8,368 12.2 60,129 87.8 68,497 100.0 1st 8,769 12.2 63,363 87.8 72,132 100.0 2nd 8,732 12.4 61,673 87.6 70,405 100.0 3rd 9,915 14.8 57,265 85.2 67,180 100.0 4th 10,776 18.2 48,533 81.8 59,309 100.0 5th 15,459 26.9 41,963 73.1 57,422 100.0 6th 19,953 38.3 32,100 61.7 52,053 100.0 7th 21,650 43.8 27,817 56.2 49,467 100.0 8th 22,015 46.9 24,968 53.1 46,983 100.0 9th 25,672 48.5 27,210 51.5 52,882 100.0 10th 24,288 56.1 18,993 43.9 43,281 100.0 11th 21,759 62.8 12,901 37.2 34,660 100.0 12th 19,688 69.5 8,620 30.5 28,308 100.0 Ungraded 1,267 8.3 13,916 91.7 15,183 100.0 Total 218,311 30.4 499,451 69.6 717,762 100.0 Source: California Department <strong>of</strong> Education, . Latino Pr<strong>of</strong>iles Study Report, <strong>United</strong> <strong>Way</strong> <strong>of</strong> <strong>Greater</strong> <strong>Los</strong> <strong>Angeles</strong>, 2000
- Page 1 and 2:
American Dream Makers Latino Profil
- Page 3 and 4:
AMERICAN DREAM MAKERS LATINO PROFIL
- Page 5 and 6:
CONTENTS Introduction Latino Profil
- Page 7 and 8:
INTRODUCTION PURPOSE The study was
- Page 9 and 10:
Latino Profiles Committee David Hay
- Page 11 and 12:
AMERICAN DREAM MAKERS ACTION AGENDA
- Page 13 and 14:
Goals Fuel the “Economic Engine
- Page 15 and 16:
Latino Profiles Action Agenda Confe
- Page 17 and 18:
STATISTICAL DATA on Latinos in Los
- Page 19 and 20:
ELDERLY 1.38 Elderly Population by
- Page 21 and 22:
EDUCATION - Continued 4.05 Spanish
- Page 23 and 24:
Los Angeles County Interagency Coun
- Page 25 and 26:
DEMOGRAPHIC PROFILE: Key Findings T
- Page 27 and 28:
Latino and Non-Latino Age Structure
- Page 29 and 30:
CHILDREN AND YOUTH Latino Children
- Page 31 and 32:
Pediatric HIV/AIDS Transmission •
- Page 33 and 34:
•= The Southern California Immigr
- Page 35 and 36:
Table 1.01 RACE/ETHNIC GROUPS Los A
- Page 37 and 38:
TABLE 1.02 RACE/ETHNIC POPULATION E
- Page 39 and 40:
TABLE 1.02 RACE/ETHNIC POPULATION E
- Page 41 and 42:
TABLE 1.02 RACE/ETHNIC POPULATION E
- Page 43 and 44:
TABLE 1.02 RACE/ETHNIC POPULATION E
- Page 45 and 46:
TABLE 1.02 RACE/ETHNIC POPULATION E
- Page 47 and 48:
LATINO POPULATION - 1998 Los Angele
- Page 49 and 50:
Table 1.05 LATINO POPULATION PROFIL
- Page 51 and 52:
Population Growth Table 1.07 CENTRA
- Page 53 and 54:
Population Growth Table 1.09 COLOMB
- Page 55 and 56:
Table 1.11 CUBAN POPULATION PROFILE
- Page 57 and 58:
Population Growth Table 1.13 ECUADO
- Page 59 and 60:
Population Growth Table 1.15 HONDUR
- Page 61 and 62:
Population Growth Table 1.17 NICARG
- Page 63 and 64:
Population Growth Table 1.19 PERUVI
- Page 65 and 66:
Table 1.21 SALVADORAN POPULATION PR
- Page 67 and 68:
Population Growth Table 1.23 VENEZU
- Page 69 and 70:
Table 1.25 AGE STRUCTURE AND MEDIAN
- Page 71 and 72:
ETHNIC CHILDREN'S SCORE CARD 1999 -
- Page 73 and 74:
Table 1.28 CHILDREN LIVING WITH PAR
- Page 75 and 76:
Table 1.30 YOUTH AGE 16-19, WORKING
- Page 77 and 78:
Table 1.32 CHILDREN'S SERVICES CASE
- Page 79 and 80:
Table 1.34 CHILD ABUSE DEATHS CHARA
- Page 81 and 82:
Table 1.36 ACCIDENTAL CHILD DEATHS
- Page 83 and 84:
Table 1.38 ELDERLY POPULATION BY RA
- Page 85 and 86:
Table 1.40 EDUCATIONAL ATTAINMENT -
- Page 87 and 88:
Table 1.42 LABOR FORCE PARTICIPATIO
- Page 89 and 90:
Table 1.44 FOREIGN-BORN PERSONS BY
- Page 91 and 92:
Table 1.46 CITIZENSHIP STATUS, ALL
- Page 93 and 94:
Table 1.48 IMMIGRATION AND NATURALI
- Page 95 and 96:
Table 1.50 LATINO LANGUAGE USE Los
- Page 97 and 98:
Table 1.51 LANGUAGE SPOKEN AT HOME
- Page 99 and 100:
Table 1.51 LANGUAGE SPOKEN AT HOME
- Page 101 and 102:
Table 1.51 LANGUAGE SPOKEN AT HOME
- Page 103 and 104:
Table 1.51 LANGUAGE SPOKEN AT HOME
- Page 105 and 106:
BUILDING STRONG COMMUNITIES: Key Fi
- Page 107 and 108:
high rate of intermarriage with oth
- Page 109 and 110:
•= •= •= •= •= •= •=
- Page 111 and 112:
Latino Physician Shortage •= The
- Page 113 and 114:
Table 2.01 PUBLIC OPINION POLL DATA
- Page 115 and 116:
Table 2.03 BIRTH CHARACTERISTICS BY
- Page 117 and 118:
Table 2.04 BIRTH CHARACTERISTICS BY
- Page 119 and 120:
Table 2.04 BIRTH CHARACTERISTICS BY
- Page 121 and 122:
Table 2.04 BIRTH CHARACTERISTICS BY
- Page 123 and 124:
Table 2.04 BIRTH CHARACTERISTICS BY
- Page 125 and 126:
Table 2.04 BIRTH CHARACTERISTICS BY
- Page 127 and 128:
Table 2.06 YEARS OF POTENTIAL LIFE
- Page 129 and 130:
Table 2.08 MOTOR VEHICLE CRASH DEAT
- Page 131 and 132:
Table 2.10 PHYSICIAN TO POPULATION
- Page 133 and 134:
Table 2.11 CHILD NUTRITION INDICATO
- Page 135 and 136:
Table 2.13 PERSONS WITH NO HEALTH C
- Page 137 and 138:
Table 2.15 CASES OF SELECTED* NOTIF
- Page 139 and 140:
Table 2.17 AIDS CASES REPORTED BY R
- Page 141 and 142:
Table 2.19 ARRESTS BY RACE/ETHNIC G
- Page 143 and 144:
Table 2.19 ARRESTS BY RACE/ETHNIC G
- Page 145 and 146:
Table 2.21 FAMILY/HOUSEHOLD TYPE BY
- Page 147 and 148:
FUELING THE ECONOMIC ENGINE: Key Fi
- Page 149 and 150:
•= •= •= •= •= •= •=
- Page 151 and 152: increasingly recognized by business
- Page 153 and 154: Housing and Home Ownership •= 65.
- Page 155 and 156: Table 3.02 MINORITY AND WOMEN-OWNED
- Page 157 and 158: Table 3.04 LATINO FIRMS BY INDUSTRY
- Page 159 and 160: Table 3.06 EMPLOYMENT AND LABOR FOR
- Page 161 and 162: Table 3.08 OCCUPATIONAL CATEGORIES
- Page 163 and 164: Table 3.10 WORKERS IN FAMILY BY RAC
- Page 165 and 166: Table 3.12 POVERTY RATE BY RACE/ETH
- Page 167 and 168: Table 3.13 LATINOS BELOW POVERTY LE
- Page 169 and 170: Table 3.13 LATINOS BELOW POVERTY LE
- Page 171 and 172: Table 3.13 LATINOS BELOW POVERTY LE
- Page 173 and 174: Table 3.15 POVERTY BY RACE/ETHNIC G
- Page 175 and 176: Table 3.17 PUBLIC ASSISTANCE RECIPI
- Page 177 and 178: Table 3.19 FAMILY INCOME BY ETHNIC
- Page 179 and 180: Table 3.21 HOUSEHOLD INCOME BY RACE
- Page 181 and 182: Table 3.23 RATIO OF FAMILY INCOME T
- Page 183 and 184: Table 3.25 FHA LOANS BY RACE/ETHNIC
- Page 185 and 186: Table 3.27 HOUSING QUALITY INDICATO
- Page 187 and 188: LIFE-LONG LEARNING
- Page 189 and 190: •= Spanish is the home language o
- Page 191 and 192: COMPUTER USE •= Since there is no
- Page 193 and 194: LATINO INTERNET RESOURCES This shor
- Page 195 and 196: Fiera (Spanish Language Internet Se
- Page 197 and 198: Chicano Studies National Latino Res
- Page 199 and 200: Table 4.01 TEACHERS BY RACE/ETHNIC
- Page 201: Table 4.03 PRIVATE AND PUBLIC SCHOO
- Page 205 and 206: Table 4.07 HIGH SCHOOL GRADUATES WI
- Page 207 and 208: Table 4.09 COLLEGE AND UNIVERSITY E
- Page 209 and 210: Table 4.11 EDUCATIONAL ATTAINMENT O
- Page 211 and 212: Table 4.13 HATE CRIME VICTIMS: PERP
- Page 213 and 214: Table 4.15 RELIGIOUS HATE CRIME Los
- Page 215 and 216: Table 4.17 CHILDREN'S COMPUTER USE
- Page 217 and 218: BIBLIOGRAPHY on Latinos in Los Ange
- Page 219 and 220: Arts, Culture and Identity 1 Campoa
- Page 221 and 222: 35 Villaseñor, V. Rain of Gold. Ho
- Page 223 and 224: 35 (1998): 627-634. 14 NALEO Educat
- Page 225 and 226: Capitalism.” Economic Development
- Page 227 and 228: 18 Greene, J. P. Bilingual Educatio
- Page 229 and 230: Elderly 1 Aleman, S. Hispanic Elder
- Page 231 and 232: 22 Waldinger, R. Beyond the Sidestr
- Page 233 and 234: (1995): 127-135. 24 Cervantes, A. I
- Page 235 and 236: 56 Hayes-Bautista, D., Barriers to
- Page 237 and 238: Cancer - Screening Test Among Latin
- Page 239 and 240: Epidemiology 141 (1995): 428-439. 1
- Page 241 and 242: 27 Portes, A. Immigrant America: A
- Page 243 and 244: 5 Camarillo, A. Chicanos in a Chang
- Page 245 and 246: 40 The Tomás Rivera Policy Institu
- Page 247 and 248: Council of La Raza, 1997. 27 The Na
- Page 249 and 250: UNITED WAY LATINO PROFILE PROJECT F
- Page 251 and 252: y focus group participants in many
- Page 253 and 254:
that, yeah, we do contribute social
- Page 255 and 256:
developed in greater depth below, i
- Page 257 and 258:
-You see commercials now that you w
- Page 259 and 260:
over the years, more and more Latin
- Page 261 and 262:
these communities, the African Amer
- Page 263 and 264:
America or South America.’ There
- Page 265 and 266:
organice y llegue a tomar algun dia
- Page 267 and 268:
Low Self Esteem, Low Self Confidenc
- Page 269 and 270:
dominant, second and third generati
- Page 271 and 272:
-[Immigrant Latinos] well, they’r
- Page 273 and 274:
-We brought the family philosophy t
- Page 275 and 276:
SURVEY METHODOLOGY The survey was a
- Page 277 and 278:
Emerging Influence More Latinos tha
- Page 279 and 280:
Bright Futures Strong agreement was
- Page 281 and 282:
Glass Ceiling Non-Latino groups are
- Page 283 and 284:
Comfort With Diversity - Cont. Ther
- Page 285 and 286:
Multilingual Los Angeles Angelenos
- Page 287 and 288:
Academic Success - Cont. 100% Many
- Page 289 and 290:
STUDY ID#: 2133 SUMMER, 1999 LOS AN
- Page 291 and 292:
4. Using the same rating scale, I w
- Page 293 and 294:
Next we have some questions about y
- Page 295 and 296:
12. The following statements are ab
- Page 297 and 298:
20. In what religion were you raise
- Page 299 and 300:
These last questions are for descri
- Page 301 and 302:
39. Was your approximate total hous
- Page 303 and 304:
LOS ANGELES COMMUNITY SURVEY #2133
- Page 305 and 306:
9. I need to find out just a little