The 2003 Index of Hospital Quality
The 2003 Index of Hospital Quality
The 2003 Index of Hospital Quality

You also want an ePaper? Increase the reach of your titles
YUMPU automatically turns print PDFs into web optimized ePapers that Google loves.
<strong>The</strong> <strong>2003</strong><br />
<strong>Index</strong> <strong>of</strong><br />
<strong>Hospital</strong><br />
<strong>Quality</strong><br />
Colm O’Muircheartaigh<br />
Ann Burke<br />
Whitney Murphy
To Whom It May Concern:<br />
U.S. News & World Report’s “America’s Best <strong>Hospital</strong>s” study is the sole and exclusive property<br />
<strong>of</strong> U.S. News & World Report, which owns all rights, including but not limited to copyright, in and<br />
to the attached data and material. Any party wishing to cite, reference, publish or otherwise<br />
disclose the information contained herein may do so only with the prior written consent <strong>of</strong> U.S.<br />
News. Any U.S. News-approved reference or citation must identify the source as “U.S. News &<br />
World Report’s America’s Best <strong>Hospital</strong>s” and with the exception <strong>of</strong> academic journals must include<br />
the credit line: “Data reprinted with permission from U.S. News & World Report.” For permission<br />
to cite or use in any other way, contact permissions@usnews.com or send a written request to<br />
Permissions Department, U.S. News & World Report, 1050 Thomas Jefferson Street, N.W.,<br />
Washington, D.C. 20007-3837. For custom reprints or photocopying permissions, please contact<br />
Robyn Roberts at (212) 221-9595, Extension 323 or robyn@parsintl.com.<br />
1050 Thomas Jefferson Street, N.W., Washington, DC 20007-3837<br />
Tel: 202-955-2000<br />
U.S. News Online: http://www.usnews.com
NORC 6126
<strong>The</strong> <strong>2003</strong> <strong>Index</strong> <strong>of</strong> <strong>Hospital</strong> <strong>Quality</strong><br />
I Introduction . . . . . . . . . . . . . . . . . . . . . . . . . . . . . . . . . . . . . . . . . . . . . . . 1<br />
II <strong>The</strong> <strong>Index</strong> <strong>of</strong> <strong>Hospital</strong> <strong>Quality</strong><br />
A. Universe Definition . . . . . . . . . . . . . . . . . . . . . . . . . . . . . . . . . . . 4<br />
B. Composite Measures <strong>of</strong> Structure . . . . . . . . . . . . . . . . . . . . . . . 8<br />
C. Process . . . . . . . . . . . . . . . . . . . . . . . . . . . . . . . . . . . . . . . . . . . . 16<br />
D. Outcome . . . . . . . . . . . . . . . . . . . . . . . . . . . . . . . . . . . . . . . . . . . 23<br />
E. Calculation <strong>of</strong> the <strong>Index</strong> . . . . . . . . . . . . . . . . . . . . . . . . . . . . . . . 26<br />
F. Summary <strong>of</strong> Changes for <strong>2003</strong> . . . . . . . . . . . . . . . . . . . . . . . . . . 29<br />
III Directions for Future Releases . . . . . . . . . . . . . . . . . . . . . . . . . . . . . . . 30<br />
IV References . . . . . . . . . . . . . . . . . . . . . . . . . . . . . . . . . . . . . . . . . . . . . . . 31<br />
V Appendices<br />
A. Structural Variable Map<br />
B. 2002 Sample Physician Questionnaire (Long Form)<br />
C. 2002/<strong>2003</strong> Sample Physician Questionnaire (Short Form)<br />
D. Predicted Mortality: APR-DRG Methodology<br />
E. Diagnosis-Related Group (DRG) Groupings by Specialty<br />
F. <strong>Index</strong> <strong>of</strong> <strong>Hospital</strong> <strong>Quality</strong> (IHQ) Scores by Specialty<br />
G. Reputation Rankings for Special-Service <strong>Hospital</strong>s<br />
H. <strong>The</strong> <strong>2003</strong> “Honor Roll”
I Introduction<br />
Health care providers and consumers today face a dynamic and <strong>of</strong>ten puzzling array <strong>of</strong><br />
choices with few tools to inform their critical decisions about quality <strong>of</strong> care. No single<br />
standard measure <strong>of</strong> quality <strong>of</strong> care is available for the 6,003 hospitals in the United States.<br />
In 1993, the National Opinion Research Center at the University <strong>of</strong> Chicago (NORC)<br />
developed such a measure. This “report card” is supported and published annually by U.S.<br />
News & World Report in an issue entitled “America’s Best <strong>Hospital</strong>s” that identifies centers<br />
<strong>of</strong> exceptional capability in 17 medical specialties.<br />
In the NORC report card, each hospital receives a score called the <strong>Index</strong> <strong>of</strong> <strong>Hospital</strong> <strong>Quality</strong><br />
(IHQ), which assesses hospital quality by taking into account the three fundamental<br />
dimensions <strong>of</strong> health care delivery: structure, process, and outcome (the Donabedian<br />
paradigm 1,2 ). None <strong>of</strong> these dimensions alone can completely and accurately represent<br />
quality <strong>of</strong> care; all three must be combined to produce a comprehensive measure. Care<br />
starts with the structural characteristics <strong>of</strong> an institution (such as the number <strong>of</strong> patients<br />
served and the range <strong>of</strong> medical technology available), moves through the process <strong>of</strong><br />
delivering care, and produces results, or outcomes, for the patients served. To be most<br />
useful to the consumer and provider <strong>of</strong> care, the IHQ combines robust and sensitive<br />
measures <strong>of</strong> each <strong>of</strong> these dimensions for the universe <strong>of</strong> hospitals across a wide range <strong>of</strong><br />
medical and surgical practice specialties. <strong>The</strong> IHQ draws from secondary sources, such<br />
as the American <strong>Hospital</strong> Association (AHA) Annual Survey <strong>of</strong> <strong>Hospital</strong>s, for data<br />
concerning various quality dimensions. We continually try to improve the specificity and<br />
sensitivity <strong>of</strong> the measures we use to rank hospitals and to identify the best possible<br />
sources <strong>of</strong> data.<br />
<strong>The</strong> following sections define the universe <strong>of</strong> hospitals for the purpose <strong>of</strong> this project,<br />
describe and define the standardized mortality ratios and the structural components, and<br />
explain how process-related data are collected. A description <strong>of</strong> changes made for the<br />
<strong>2003</strong> IHQ is also provided. A short description <strong>of</strong> each <strong>of</strong> the component <strong>of</strong> the index is<br />
provided below:<br />
1
Reputation<br />
Structure<br />
<strong>The</strong> reputational score is based on cumulative information from three NORC<br />
surveys <strong>of</strong> physicians carried out in 2001, 2002, and <strong>2003</strong>. For the 2001 and <strong>2003</strong><br />
surveys, the samples consisted <strong>of</strong> 2,550 board-certified physicians selected from the<br />
American Medical Association (AMA) Physician Masterfile <strong>of</strong> approximately 811,000<br />
physicians. In 2002 the overall sample size was increased from 2,550 to 3,060 to<br />
test response rates when administering a short form questionnaire versus a long<br />
form questionnaire. <strong>The</strong> samples <strong>of</strong> physicians for each year were stratified by<br />
region and by specialty within region. We selected a sample <strong>of</strong> 150 physicians for<br />
each <strong>of</strong> the 17 specialty areas in both 2001 and <strong>2003</strong>. In 2002, 180 physicians were<br />
selected in each specialty.<br />
<strong>The</strong> final aggregated sample includes both non-federal and federal medical and<br />
osteopathic physicians residing in the fifty states and the District <strong>of</strong> Columbia.<br />
<strong>The</strong> structural score is based on data related to the structural characteristics <strong>of</strong> each<br />
specialty within each hospital. <strong>The</strong>se elements represent volume <strong>of</strong> work,<br />
technology, and other characteristics <strong>of</strong> the hospital environment. <strong>The</strong> majority <strong>of</strong><br />
the data elements are derived from the 2001 AHA Annual Survey. <strong>The</strong> volume data<br />
are taken from the MEDPARS database, maintained by the Centers for Medicare<br />
and Medicaid Services (CMS). It contains information on all Medicare discharges<br />
in each specialty. CMS is the federal agency formerly known as the Health Care<br />
Financing Administration (HCFA).<br />
2
Mortality<br />
<strong>The</strong> outcomes measure is based on CMS’s MEDPARS database. An adjusted<br />
mortality rate for each hospital and specialty is computed based on predicted and<br />
actual mortality rates by MEDSTAT Group, Inc. <strong>of</strong> Franklin, Tenn., using the All<br />
Patient Refined Diagnosis Related Group (APR-DRG) method designed by 3M<br />
Health Information Systems. <strong>The</strong> APR-DRG adjusts expected deaths for severity<br />
<strong>of</strong> illness by means <strong>of</strong> principal diagnosis and categories <strong>of</strong> secondary diagnoses.<br />
<strong>The</strong> method is applied to the pooled 1999, 2000 and 2001 set <strong>of</strong> Medicare<br />
reimbursement claims made to CMS by hospitals.<br />
A detailed description <strong>of</strong> these components follows in Section II <strong>of</strong> this report. For a more<br />
exhaustive review <strong>of</strong> the foundation as well as <strong>of</strong> the development and use <strong>of</strong> the individual<br />
measures and the composite index, see “Best <strong>Hospital</strong>s: A Description <strong>of</strong> the Methodology<br />
for the <strong>Index</strong> <strong>of</strong> <strong>Hospital</strong> <strong>Quality</strong>.” 3<br />
3
II <strong>The</strong> <strong>Index</strong> <strong>of</strong> <strong>Hospital</strong> <strong>Quality</strong> (IHQ)<br />
A. Universe Definition<br />
We have implemented a two-stage approach to defining eligible hospitals for each <strong>of</strong> the<br />
IHQ specialty lists. (<strong>Hospital</strong>s ranked solely by reputation do not have to meet<br />
eligibility standards.) First, eligible hospitals must meet at least one <strong>of</strong> the following<br />
criteria:<br />
1) Council <strong>of</strong> Teaching <strong>Hospital</strong>s (COTH) membership, or<br />
2) Medical school affiliation, or<br />
3) A score <strong>of</strong> 9 or higher on the hospital-wide technology index (see Part II, Section<br />
B)<br />
Using these criteria, we identified 2,072 hospitals that were eligible in <strong>2003</strong> for one or more<br />
<strong>of</strong> the 13 IHQ-based rankings. Once eligible hospitals were identified, data for them were<br />
drawn from the 2001 AHA Annual Survey database.<br />
As with any data collection effort, the AHA Annual Survey database is incomplete due to<br />
non-responding hospitals. We have a procedure to allow eligible hospitals that are nonresponders<br />
to the current AHA Annual Survey to remain in our database. First, for all<br />
previously ranked hospitals, we average the two prior years <strong>of</strong> survey data and substitute<br />
the result for the missing data. <strong>Hospital</strong>s lacking data both from the current survey and from<br />
one <strong>of</strong> the previous two surveys are ranked without any structure data. Although nonresponding<br />
hospitals need to be treated separately for the IHQ analysis, it is unnecessary<br />
to do so for the four reputation-only lists.<br />
4
We then created separate analytic universes for each <strong>of</strong> the 13 IHQ-driven specialties,<br />
using criteria such as specialty-specific technology or facilities. <strong>Hospital</strong>s had to have a<br />
specified number <strong>of</strong> discharges across appropriate DRGs. <strong>Hospital</strong>s with insufficient<br />
volume (discharges) were considered eligible for ranking if they received any reputational<br />
nominations (a non-zero reputational score).<br />
Until 2002, the discharges threshold that determined eligibility included all discharges,<br />
regardless <strong>of</strong> the medical-surgical mix. 1 In 2002 and again this year, the mix in certain<br />
specialties was specified: For Cancer; Digestive Disorders; Ear, Nose, and Throat;<br />
Gynecology; Neurology and Neurosurgery; Orthopedics, and Urology, the median ratio <strong>of</strong><br />
surgical to total discharges for hospitals surpassing the all-discharges threshold was<br />
multiplied by total discharges to obtain a minimum for surgical discharges.<br />
For Heart and Heart Surgery, the minimum number <strong>of</strong> surgical discharges for eligibility was<br />
set at 500. To obtain a minimum threshold for all discharges, this number was multiplied<br />
by the median ratio <strong>of</strong> all discharges to surgical discharges for all hospitals surpassing the<br />
surgical discharges threshold. This resulted in a minimum <strong>of</strong> 1,285 total discharges–500<br />
surgical and 785 medical.<br />
We regularly examine the impact <strong>of</strong> hospital mergers on our rankings. Ranking hospitals<br />
responding as new corporate entities for the first time in the AHA database are treated as<br />
a single unit and listed in this report. For this release, one merger among hospitals<br />
previously ranked as independent entities appears on the lists. This hospital is now called<br />
St. Luke's-Cornwall <strong>Hospital</strong>, Newburgh, N.Y., and is made up <strong>of</strong> two previously separate<br />
hospitals: St. Luke's <strong>Hospital</strong>, Newburgh, N.Y., and Cornwall <strong>Hospital</strong>, Cornwall, N.Y.<br />
Figure 1 presents the eligibility criteria and the number <strong>of</strong> hospitals meeting the criteria<br />
from the 2001 AHA Annual Survey. Figure 2 illustrates the eligibility process.<br />
1 <strong>The</strong> exception until 2002 was Heart and Heart Surgery, in which surgical discharges alone<br />
determine the threshold for eligibility. Beginning in 2002, both medical and surgical discharges determine<br />
eligibility.<br />
5
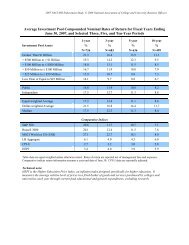
Figure 1. Universe Definition by Specialty<br />
Specialty Minimum<br />
Total<br />
Discharges<br />
6<br />
Minimum<br />
Surgical<br />
Discharges<br />
Number <strong>of</strong><br />
Eligible<br />
<strong>Hospital</strong>s<br />
Cancer 349 78 890<br />
Digestive Disorders 744 209 1,426<br />
Ear, Nose, and Throat 38 4 1,295<br />
Geriatrics* 5,967 -- 1,392<br />
Gynecology 49 46 1,493<br />
Heart and Heart Surgery** 1,285 500 770<br />
Hormonal Disorders 381 -- 1,040<br />
Kidney Disease 200 -- 1,527<br />
Neurology and Neurosurgery 455 80 1,245<br />
Orthopedics 387 345 1,511<br />
Respiratory disorders 873 -- 1,547<br />
Rheumatology 23 -- 1,536<br />
Urology 121 106 1,467<br />
* In addition to the discharge eligibility criteria, a hospital must have a score <strong>of</strong> 1 or more on the<br />
Geriatrics service index for inclusion in the Geriatrics universe. Discharges for Geriatrics are<br />
calculated on a hospital-wide basis and are not DRG-specific.<br />
** In addition to the discharge eligibility criteria, a hospital must have a cardiac catheterization lab,<br />
<strong>of</strong>fer open-heart surgery, or <strong>of</strong>fer angioplasty for inclusion in the Heart and Heart Surgery<br />
universe.
Figure 2. Analysis Procedure for “America’s Best <strong>Hospital</strong>s <strong>2003</strong>"<br />
Yes<br />
Final universe contains nominations<br />
data, mortality data and AHA data<br />
Test for sufficient discharges<br />
(per specialty):<br />
Range <strong>of</strong> discharges: 23-1,285<br />
(total) 4-500 (surgical)<br />
Yes<br />
13 files created (one for<br />
each IHQ-driven specialty)<br />
Rankings for the 13 IHQ-driven<br />
specialties are produced<br />
Top 50 hospitals are published<br />
Yes<br />
<strong>Hospital</strong>s in the FY2001 AHA database<br />
(n=6,003)<br />
Does hospital m eet eligibility criteria?<br />
1: COTH membership<br />
or<br />
2: Sufficient technology (score <strong>of</strong> 9 - 17)<br />
or<br />
3: Medical school affliliation<br />
or<br />
4: (For reputation-only specialties): received one or<br />
more nominations<br />
Yes<br />
<strong>Hospital</strong>s eligible for<br />
ranking<br />
(n=2,072)<br />
W as hospital a FY2001 AHA<br />
responder?<br />
Final universe file contains<br />
nominations data, mortality data and<br />
average <strong>of</strong> the FY2000 and FY1999<br />
AHA survey data<br />
Is specialty one <strong>of</strong> the 13 IHQdriven?<br />
Non-zero reputational score<br />
Eliminated from analysis<br />
7<br />
No<br />
W as hospital a FY2000 AND<br />
FY1999 AHA responder?<br />
Yes No<br />
Yes No<br />
No<br />
No<br />
Final universe file contains only<br />
nominations data and mortality data<br />
Rankings for reputation-only specialties<br />
are produced: (Eyes, Pediatrics,<br />
Psychiatry, Rehabilitation)<br />
Those at or above 3.0% are published<br />
No
B. Composite Measure <strong>of</strong> Structure<br />
<strong>The</strong> structural dimension defines the tools and environment available to care providers in<br />
treating patients. Health care research overwhelmingly supports the use <strong>of</strong> a measure<br />
<strong>of</strong> structure in assessing quality <strong>of</strong> care. However, no prior research has revealed a<br />
single indicator <strong>of</strong> quality that summarizes all others or that adequately represents the<br />
structure construct on its own. Thus, the structural component must be represented by a<br />
composite variable comprising different specialty-specific measures that are weighted<br />
relative to each other.<br />
For the <strong>2003</strong> index, most structural elements are derived from the 2001 AHA Annual<br />
Survey <strong>of</strong> <strong>Hospital</strong>s database and are described below. For the specific mapping <strong>of</strong><br />
variables to the AHA data elements, see Appendix A.<br />
1) Technology indices:<br />
For <strong>2003</strong>, technology elements for all specialties are unchanged. Since the 1996<br />
version <strong>of</strong> the index, our technology indices have reflected the real cost <strong>of</strong> hightechnology<br />
services. While providing a service inside the hospital is convenient<br />
for patients, the cost may be unacceptable to some hospitals. Many hospitals<br />
provide access to technology services through the hospital’s health system, a<br />
local community network, or a contractual arrangement or joint venture with<br />
another provider in the community. We take this into account by giving hospitals<br />
that provide a service such as ultrasound one full point if it is provided on-site;<br />
hospitals that provide the service locally through a formal arrangement receive a<br />
half-point. A hospital receives no more than one point for each element <strong>of</strong> the<br />
index. Figure 3 presents the complete list <strong>of</strong> technologies considered for each<br />
specialty.<br />
8
Figure 3. Technology Indices by Specialty<br />
Technology<br />
All <strong>Hospital</strong> <strong>Index</strong>*<br />
Cancer<br />
Digestive Disorders<br />
Ear, Nose, and Throat<br />
1) Angioplasty T T<br />
2) Cardiac Catheterization Lab T T T<br />
3) Cardiac Intensive Care Beds T T T<br />
4) Computed Tomography Scanner T T T T T T T T T T T T T T<br />
5) Diagnostic Radioisotope Facility T T T T T T T<br />
6) Diagnostic Mammography<br />
Services<br />
T T<br />
7) Extracorporeal Shock Wave<br />
Lithiotripter<br />
9<br />
Heart and Heart Surgery<br />
Hormonal Disorders<br />
Geriatrics<br />
T T T T<br />
8) Magnetic Resonance Imaging T T T T T T T T T T T T<br />
9) Medical/Surgical Intensive Care T<br />
10) Neonatal Intensive Care T T<br />
11) Oncology Services T<br />
12) Open Heart Surgery T T<br />
13) Pediatric Intensive Care Beds T T<br />
14) Positron Emission Tomography<br />
Scanner<br />
15) Reproductive Health<br />
16) Single Photon Emission<br />
Computed Tomography<br />
17) Transplant Services<br />
T T T T T T T T T T T T<br />
T<br />
T T T T T T T T T T T T<br />
18) Ultrasound T T T T T T T T T T T T<br />
19) X-ray Radiation <strong>The</strong>rapy T T T T T T T T T T<br />
TOTAL ELEMENTS 17 7 8 5 9 7 8 8 5 7 5 4 5 8<br />
* <strong>The</strong> All <strong>Hospital</strong> <strong>Index</strong> is used to define the universe <strong>of</strong> eligible hospitals.<br />
Gynecology<br />
Kidney Disease<br />
T<br />
Neurology and Neurosurgery<br />
Orthopedics<br />
Respiratory Disorders<br />
Rheumatology<br />
Urology
2) Volume:<br />
<strong>The</strong> volume measure reflects total medical and surgical discharges in the<br />
appropriate specialty-specific DRG groupings submitted for CMS reimbursement.<br />
<strong>The</strong> measure is incorporated into the structure score for all data-driven<br />
specialties other than Geriatrics and Rheumatology.<br />
In the Heart and Heart Surgery specialty, surgical discharges indicated volume<br />
until 2002, when the volume variable was changed to include both medical and<br />
surgical discharges. <strong>The</strong> methodology now matches the other specialties in this<br />
respect.<br />
Volumes at the extreme for particular hospitals and specialties were trimmed to<br />
eliminate the influence <strong>of</strong> very wide variation. Figure 4 shows the percentile at<br />
which each <strong>of</strong> the volume distributions was trimmed.<br />
3) RNs to beds:<br />
A hospital’s number <strong>of</strong> beds is defined by the AHA as beds set up and staffed at<br />
the end <strong>of</strong> the reporting period. Only nurses with RN degrees from approved<br />
schools <strong>of</strong> nursing and currently registered by their state are considered. Nurses<br />
must be full-time (35 hours/week or more), and on staff. Private-duty nurses,<br />
staff nurses whose salary is financed entirely by outside sources (e.g., an agency<br />
or a research grant), and LPNs are not counted. Registered nurses more<br />
appropriately classified in other occupational categories (e.g., supervisory<br />
nurses, facility administrators) are also not counted.<br />
As with volume, RNs to beds ratios were trimmed to eliminate the influence <strong>of</strong><br />
very wide variation. Figure 4 shows the percentiles at which each <strong>of</strong> the RNs to<br />
beds distributions was trimmed.<br />
10
Figure 4. Percentile Where Volume and RNs/Beds Distributions Were Trimmed<br />
Specialty Volume<br />
Percentile<br />
11<br />
RNs/Beds<br />
Percentile<br />
Cancer 90 95<br />
Digestive Disorders 90 95<br />
Ear, Nose, and Throat 95 95<br />
Geriatrics -- 90<br />
Gynecology 90 95<br />
Heart and Heart Surgery 90 95<br />
Hormonal Disorders no trimming 95<br />
Kidney Disease no trimming 95<br />
Neurology and Neurosurgery no trimming 95<br />
Orthopedics 90 90<br />
Respiratory Disorders 90 95<br />
Rheumatology -- 90<br />
Urology 95 90<br />
4) Trauma:<br />
A second round <strong>of</strong> standardization is performed after trimming extremes.<br />
Restandardization restores balance so that trimmed and untrimmed measures<br />
have the same influence on the final score.<br />
In 1992, a U.S. News survey <strong>of</strong> board-certified physicians ranked the presence <strong>of</strong><br />
an emergency room and a hospital’s trauma provider level high on a list <strong>of</strong><br />
hospital quality indicators. Physicians in nine specialties ranked trauma as one<br />
<strong>of</strong> the top five indicators <strong>of</strong> quality. <strong>The</strong> indications <strong>of</strong> these specialists and<br />
resultant high factor loadings supported the inclusion <strong>of</strong> these data for Digestive<br />
Disorders; Ear, Nose, and Throat; Gynecology; Heart and Heart Surgery;<br />
Hormonal Disorders; Kidney Disease; Neurology and Neurosurgery;<br />
Orthopedics; Respiratory Disorders, and Urology.
<strong>The</strong> trauma indicator is dichotomous and derived from two variables in the AHA<br />
database: whether the hospital has a certified trauma center in the hospital and<br />
the level <strong>of</strong> the trauma center. To receive credit for trauma services, hospitals<br />
must provide Level 1 or Level 2 trauma services in-hospital (as opposed to<br />
providing trauma services only as part <strong>of</strong> a health system, network, or joint<br />
venture). Level 1 trauma service is defined as “a regional resource trauma<br />
center, which is capable <strong>of</strong> providing total care for every aspect <strong>of</strong> injury and<br />
plays a leadership role in trauma research and education.” 4 Level 2 is defined by<br />
the AHA as “a community trauma center, which is capable <strong>of</strong> providing trauma<br />
care to all but the most severely injured patients who require highly specialized<br />
care.” 4 Certification is required.<br />
5) Discharge planning:<br />
<strong>The</strong> three elements <strong>of</strong> discharge planning are patient education services, case<br />
management services, and patient representative services. A service must be<br />
provided within the hospital to receive credit.<br />
6) Service mix:<br />
This indicator ranges from 0 to 9 points and comprises alcohol/drug abuse or<br />
dependency inpatient care, home health services, social work services,<br />
reproductive health services, psychiatric education services, women’s health<br />
center/services, and psychiatric consultation/liaison services. Services must be<br />
provided within the hospital. As <strong>of</strong> <strong>2003</strong>, hospice services were removed from<br />
this indicator since they are accounted for in the hospice/palliative care indicator<br />
and the maximum score for this indicator was therefore reduced from 10 points to<br />
9 points.<br />
7) Geriatric services:<br />
This indicator ranges from 0 to 7 points and comprises arthritis treatment centers,<br />
adult day care programs, patient representative services, geriatric services,<br />
meals on wheels, assisted living, and transportation to health facilities. Again, to<br />
receive credit for a service, it must be provided within the hospital.<br />
12
8) Gynecology services:<br />
This indicator was introduced in 1997. 5 It provides a means to better rate the<br />
quality <strong>of</strong> services a hospital provides for gynecological and obstetric patients.<br />
High factor loadings provide support for this variable’s inclusion. With a range <strong>of</strong><br />
0 to 4, the services included are obstetric care, reproductive health care, birthing<br />
rooms, and women’s health center. We do not award a half-point for items in this<br />
measure.<br />
9) Medical/surgical intensive care beds:<br />
This indicator is included as an important factor in the Kidney Disease specialty.<br />
<strong>The</strong> AHA database provides the number <strong>of</strong> medical and surgical intensive care<br />
beds per facility. To be counted, beds must be physically located within the<br />
hospital and set up and staffed at the end <strong>of</strong> the reporting period.<br />
10) National Cancer Institute (NCI) indicator<br />
This indicator was introduced in 2002. <strong>The</strong> NCI is the principal federal agency<br />
for cancer research and training. NCI-designated cancer centers are the<br />
principal deliverers <strong>of</strong> medical advances to patients and families, and the chief<br />
educators <strong>of</strong> health care pr<strong>of</strong>essionals and the public. 6<br />
<strong>The</strong>re are three classifications <strong>of</strong> NCI-designated cancer centers. Cancer Center<br />
is the first level, denoting a facility that conducts a high volume <strong>of</strong> advanced<br />
laboratory research with federal funding. Clinical Cancer Centers, the next level<br />
up, add clinical cancer research activities. <strong>The</strong> highest level is Comprehensive<br />
Cancer Center. <strong>The</strong>se institutions add prevention research, community outreach<br />
and service activities. 6<br />
We award one point to NCI-designated Clinical and Comprehensive Cancer<br />
Centers. All other hospitals receive zero points.<br />
13
11) Hospice/palliative care indicator:<br />
<strong>The</strong> hospice/palliative care indicator also was added in 2002. It addresses a<br />
hospital's ability in certain specialties to meet the needs <strong>of</strong> patients whose lives<br />
are ending or who are experiencing acute or chronic pain or other symptoms <strong>of</strong><br />
illness. A qualifying hospice program provides care (including pain relief) and<br />
supportive services for the terminally ill and their families. A qualifying palliative<br />
care program provides care by specially trained physicians and other clinicians<br />
for relief <strong>of</strong> acute or chronic pain or to control symptoms <strong>of</strong> illness; in addition,<br />
supportive services such as counseling on advance directives are provided for<br />
patients with advanced disease. In the specialties <strong>of</strong> Cancer, Geriatrics, Heart<br />
and Heart Surgery, and Respiratory Disorders, hospitals receive 1 point if they<br />
have a qualifying hospice or palliative care program and 2 points if they have<br />
both. In Rheumatology, hospitals receive 1 point if they have a qualifying<br />
palliative care program; hospice is not considered. <strong>Hospital</strong>s that provide either<br />
service locally through a formal arrangement receive a full point for each<br />
applicable component <strong>of</strong> the indicator (rather than a half-point as in several other<br />
components <strong>of</strong> the structural dimension).<br />
To combine these structural variables, we weight the elements to create a final<br />
composite measure. Using factor analysis, we force a one-factor solution and use the<br />
resultant loadings as “weight” values for each variable in the composite structural<br />
measure. <strong>The</strong> relative weight assigned to each element varies from specialty to<br />
specialty and from one release to the next within specialty. Figure 5 provides the factor<br />
weights assigned to each element for <strong>2003</strong>.<br />
14
Figure 5. Factor Loading by Specialty<br />
Specialty Technology<br />
Indices<br />
Volume RNs/<br />
Beds<br />
Trauma Discharge<br />
Planning<br />
15<br />
Service<br />
Mix<br />
Geriatric<br />
Services<br />
Gynecology<br />
Services<br />
Medical/<br />
Surgical<br />
Beds<br />
Cancer 65 69 60 71 50<br />
Digestive Disorders 63 65 54 67<br />
Ear, Nose, and Throat 67 64 49 67<br />
Geriatrics 60 34 59 70 65 52<br />
Gynecology 77 54 38 62 78<br />
Heart and Heart Surgery 69 64 43 57 58<br />
Hormonal Disorders 64 53 55 71<br />
Kidney Disease 73 60 43 54 65 79<br />
Neurology and Neurosurgery 62 65 50 68<br />
Orthopedics 57 66 54 69<br />
Respiratory disorders 81 30 20 49 79 67<br />
Rheumatology 85 25 84 60*<br />
Urology 62 69 57 64<br />
* Rheumatology includes palliative care, but not hospice.<br />
NCI<br />
Designation<br />
Hospice/<br />
Palliative<br />
Care
C. Process<br />
<strong>The</strong> process dimension <strong>of</strong> the quality equation is the net effect <strong>of</strong> physicians’ clinical<br />
decision-making. Clinical choices about the use <strong>of</strong> medication or diagnostic tests,<br />
admission to a hospital or one <strong>of</strong> its units, and length <strong>of</strong> stay account for a large<br />
proportion <strong>of</strong> the outcomes experienced by patients. However, national measurements<br />
<strong>of</strong> process are extremely difficult to obtain. We therefore rely on an alternative measure<br />
to act as a proxy. We contend that when a qualified expert identifies a hospital as one <strong>of</strong><br />
the “best,” he or she is, in essence, endorsing the process choices made at that hospital.<br />
Thus, we use the “nomination” <strong>of</strong> a hospital by a board-certified specialist as a measure<br />
<strong>of</strong> process. To collect these nominations, NORC conducts an annual survey <strong>of</strong> boardcertified<br />
physicians. As in the past, we have pooled nominations for the most recent<br />
three years (2001-<strong>2003</strong>) to arrive at the process measure.<br />
Survey sample<br />
<strong>The</strong> sample for the <strong>2003</strong> survey consists <strong>of</strong> 2,550 board-certified physicians<br />
selected from the American Medical Association (AMA) Physician Masterfile <strong>of</strong><br />
approximately 811,000 physicians. From within the Masterfile, we selected a<br />
target population <strong>of</strong> 220,245 board-certified physicians who met the eligibility<br />
requirements listed in Figure 6. Stratifying by region and by specialty within<br />
region, we selected a probability (random) sample <strong>of</strong> 150 physicians from each <strong>of</strong><br />
17 specialty areas, for a total <strong>of</strong> 2,550 (for 2002, 180 physicians were selected<br />
from each <strong>of</strong> the 17 specialty areas). <strong>The</strong> final sample includes non-federal and<br />
federal medical and osteopathic physicians residing in the 50 states and the<br />
District <strong>of</strong> Columbia. Figure 6 displays the list <strong>of</strong> specialties surveyed for <strong>2003</strong>.<br />
16
Eligibility requirements<br />
We defined a probability sample <strong>of</strong> physicians who could properly represent the<br />
17 specialty groupings. We used two rules <strong>of</strong> eligibility: one related to a mapping<br />
between the 17 specialties and the AMA’s list <strong>of</strong> 85 self-designated specialties,<br />
and the second to a mapping between these 85 specialties and the 23 member<br />
boards <strong>of</strong> the American Boards <strong>of</strong> Medical Specialties (ABMS).<br />
Under the first rule, we linked each <strong>of</strong> the 17 specialties to one or more relevant<br />
AMA specialties from the list <strong>of</strong> AMA self-designated practice specialty codes.<br />
Physicians who designated a primary specialty in one <strong>of</strong> the 17 specialties were<br />
preliminarily eligible for the survey. Under the second rule, the physicians must<br />
also be certified by the corresponding member board <strong>of</strong> the ABMS. Figure 6<br />
displays the correspondence between the specialty specified for U.S. News &<br />
World Report, AMA self-designated specialty, and the corresponding member<br />
board.<br />
17
Figure 6. Physician Sample Mapping<br />
“America’s Best<br />
<strong>Hospital</strong>s” Specialty<br />
Cancer<br />
AMA Key Code AMA Self-Designated<br />
Specialty<br />
HEM/22 Hematology<br />
ON/24 Oncology<br />
18<br />
American Board<br />
<strong>of</strong>:<br />
Internal Medicine<br />
Digestive Disorders GE/17 Gastroenterology Internal Medicine<br />
Ear, Nose, and Throat OTO/48 Otolaryngology Otolaryngology<br />
Eyes OPH/46 Ophthalmology Ophthalmology<br />
Geriatrics FPG/38, IMG/38 Geriatrics Internal Medicine<br />
Gynecology<br />
Heart and Heart<br />
Surgery<br />
Hormonal Disorders<br />
GYN/21 Gynecology Obstetrics &<br />
OBG/42 Obstetrics & Gynecology Gynecology<br />
CD/08 Cardiovascular Diseases Internal Medicine<br />
CDS/08 Cardiovascular Surgery Surgery<br />
END/14 Endocrinology<br />
DIA/12 Diabetes<br />
Internal Medicine<br />
Kidney Disease NEP Nephrology Internal Medicine<br />
Neurology and<br />
Neurosurgery<br />
N/36 Neurology Psychiatry &<br />
NS Neurological Surgery Neurology<br />
Orthopedics ORS/85 Orthopedic Surgery Orthopedic Surgery<br />
Pediatrics<br />
PD/55 Pediatrics<br />
ADL/01 Adolescent Medicine<br />
Pediatrics<br />
Psychiatry P/63 Psychiatry Psychiatry &<br />
Rehabilitation PM/62 Physical Medicine & Physical Medicine &<br />
Respiratory Disorders PUD Pulmonary Diseases Internal Medicine<br />
Rheumatology RHU/74 Rheumatology Internal Medicine<br />
Urology U/91 Urological Surgery Urology
Stratification<br />
To compensate for the widely varying number <strong>of</strong> eligible physicians across the<br />
targeted specialties, we used different probabilities <strong>of</strong> selection for each grouping<br />
and proportionate stratification across the four United States Census regions<br />
(Northeast, Midwest, South, and West). Within each <strong>of</strong> the 17 strata, we<br />
achieved a sample that was also geographically representative <strong>of</strong> the spread <strong>of</strong><br />
physicians across the country.<br />
<strong>2003</strong> physician survey<br />
For <strong>2003</strong>, 150 sampled physicians per specialty were mailed a one-page<br />
questionnaire (see Appendix C). In 2002, 150 sampled physicians per specialty<br />
were mailed a three-page questionnaire (see Appendix B) and an additional 30<br />
physicians per specialty were mailed a one-page questionnaire containing only<br />
the hospital nomination item. Since the response rate in 2002 was higher for<br />
physicians who received the short form questionnaire, it was utilized for all<br />
physicians in <strong>2003</strong>. In 2001, half <strong>of</strong> the questionnaires made explicit reference to<br />
the U.S. News & World Report publication and half simply indicated that the<br />
questionnaire was for an annual survey <strong>of</strong> physicians. In 2002 and <strong>2003</strong>, all<br />
questionnaires made reference to U.S. News & World Report.<br />
Along with the questionnaires, physicians were also sent a cover letter, a prepaid<br />
return envelope, and a token incentive in the form <strong>of</strong> a two-dollar bill. One week<br />
after the initial survey mailing, a reminder postcard was sent to the sampled<br />
physicians. Two weeks following the reminder mailing, we sent a United States<br />
Postal Service Priority mailing to non-respondents including the questionnaire, a<br />
cover letter and a business reply envelope. Three weeks after the second<br />
mailing, a third mailing was sent via Federal Express and included the<br />
questionnaire, a cover letter, and a business reply envelope.<br />
19
Response rate<br />
Of the 2,550 physicians sampled for this year’s report, 1,300 (51%) filled out and<br />
returned a questionnaire. In accordance with standard practice, any member <strong>of</strong><br />
the sample found to be ineligible was removed from the denominator <strong>of</strong> the<br />
response rate equation. Subtracting 24 ineligible physicians because they had<br />
retired or died resulted in an overall response rate <strong>of</strong> 51.5%. Figure 7 shows<br />
response rates by specialty for the three years used in the <strong>2003</strong> index.<br />
20
Figure 7. Response Rate by Year*<br />
Specialty 2001 2002 <strong>2003</strong> 3-year total<br />
n % n % n % n %<br />
Cancer 82 54.7 71 39.4 80 53.7 233 49.7<br />
Digestive Disorders 79 52.7 81 45.0 76 50.7 236 49.4<br />
Ear, Nose, and Throat 90 60.0 104 57.8 99 66.9 293 61.6<br />
Eyes 91 60.7 102 56.7 75 50.3 268 56.3<br />
Geriatrics 90 60.0 93 51.7 72 48.3 255 53.7<br />
Gynecology 77 51.3 80 44.4 71 48.0 228 47.9<br />
Heart and Heart Disease 81 54.0 74 41.1 75 50.7 230 48.8<br />
Hormonal Disorders 74 49.3 80 44.4 75 51.4 229 48.3<br />
Kidney Disease 72 48.0 73 40.6 66 44.0 211 44.2<br />
Neurology and Neurosurgery 79 52.7 92 51.1 84 56.4 255 53.3<br />
Orthopedics 72 48.0 92 51.1 73 49.3 237 49.6<br />
Pediatrics 80 53.3 95 52.8 87 58.0 262 54.7<br />
Psychiatry 86 57.3 84 46.7 65 44.2 235 49.9<br />
Rehabilitation 81 54.0 88 48.9 75 50.3 244 51.0<br />
Respiratory Disorders 74 49.3 89 49.4 74 49.7 237 49.5<br />
Rheumatology 86 57.3 103 57.2 74 49.7 263 55.1<br />
Urology 83 55.3 83 46.1 79 53.4 245 51.6<br />
TOTAL 1,377 54.0 1,484 48.5 1,300 51.0 4,161 51.1<br />
Overall Response Rate** 55.0 49.1 51.5 51.8<br />
* In 2001 and <strong>2003</strong>, 150 physicians were sampled for each specialty; in 2002, 180 were sampled per<br />
specialty.<br />
** <strong>The</strong> numerator <strong>of</strong> the overall response rate includes all physicians who returned a questionnaire with at<br />
least one item completed and subtracts ineligible cases from the denominator.<br />
21
Weighting<br />
Weighting was carried out in two steps. First, physicians were assigned weights<br />
that reflected the probabilities <strong>of</strong> selection within specialty groups and the overall<br />
rates <strong>of</strong> response within these groups. Second, the weights from the first step<br />
were post-stratified using the two-dimensional contingency table <strong>of</strong> specialty (17<br />
categories) by census region (Northeast, Midwest, South, and West). To check<br />
the weights, we confirmed that the sum across the sample <strong>of</strong> the weights in each<br />
cell <strong>of</strong> the classifications (specialty x region) equaled the population size.<br />
In 2002, weighting across the three years <strong>of</strong> survey data was modified. In<br />
previous rankings, weights were assigned to physicians for each year individually<br />
as described in the paragraph above, and these year-specific weights were<br />
applied to the nominations for the three years contributing to the reputation score<br />
(2001, 2002, and <strong>2003</strong>). According to this method, a nomination in region X and<br />
specialty Y could have a different weight from another nomination in the same<br />
region and specialty if it was made in a different year. Physicians now are<br />
pooled for all three years, and weights are then assigned as described in the<br />
paragraph above. Using this method, all nominations in region X and specialty Y<br />
have the same weight, regardless <strong>of</strong> the year in which the nomination was made.<br />
Post-stratification was carried out to the current contingency table <strong>of</strong> specialty by<br />
census region counts rather than the mean counts for the three years. This new<br />
method was implemented to reduce the range in weights across specialty and<br />
region and between years.<br />
22
D. Outcome<br />
Many healthcare pr<strong>of</strong>essionals have decried the use <strong>of</strong> mortality rates as an outcomes<br />
measure because <strong>of</strong> limitations in the methods used to adjust for risk. Nonetheless,<br />
research strongly suggests a positive correlation between a better-than-average riskadjusted<br />
mortality rate and overall quality <strong>of</strong> care. 7-16 Based on these findings, we used<br />
adjusted mortality rate as the outcome measure for our quality <strong>of</strong> care model. Predicted<br />
mortality rates were provided by MEDSTAT Group, Inc., <strong>of</strong> Franklin, Tenn., using the All<br />
Patient Refined Diagnosis Related Group (APR-DRG) method designed by 3M Health<br />
Information Systems. <strong>The</strong> APR-DRG adjusts expected deaths for severity <strong>of</strong> illness by<br />
means <strong>of</strong> principle diagnosis and categories <strong>of</strong> secondary diagnoses. A detailed<br />
description <strong>of</strong> the full APR-DRG methodology is provided in Appendix D. <strong>The</strong> method<br />
was applied to the pooled 1999, 2000, and 2001 MEDPARS data set <strong>of</strong> reimbursement<br />
claims made to CMS by hospitals. <strong>The</strong>se complete data sets were the most current<br />
available for analysis.<br />
<strong>2003</strong> DRG refinements<br />
We annually review the DRG groupings for every specialty. <strong>The</strong> groupings are<br />
important because they define the cases included in the mortality measures as<br />
well as the volume measure in the structural component. In <strong>2003</strong>, we conducted<br />
a thorough examination <strong>of</strong> the DRG groupings in Digestive Disorders,<br />
Orthopedics, and Gynecology. Several physicians independently conducted<br />
reviews <strong>of</strong> the DRG groupings (two for Digestive Disorders, two for Orthopedics,<br />
and one representative for Gynecology). Based on the review and<br />
recommendations, the changes in Figure 8 were made for <strong>2003</strong>.<br />
23
Figure 8. Changes to Specialty Definitions for Mortality<br />
Specialty DRGs Added DRGs Deleted<br />
Digestive<br />
Disorders<br />
Orthopedics (none)<br />
Gynecology<br />
172: DIGESTIVE MALIGNANCY W CC<br />
173: DIGESTIVE MALIGNANCY W/O CC<br />
203: MALIGNANCY OF HEPATOBILIARY<br />
SYSTEM OR PANCREAS<br />
354: UTERINE, ADNEXA PROC FOR NON-<br />
OVARIAN/ADNEXAL MALIG W CC<br />
355: UTERINE, ADNEXA PROC FOR NON-<br />
OVARIAN/ADNEXAL MALIG W/O CC<br />
357: UTERINE & ADNEXA PROC FOR<br />
OVARIAN OR ADNEXAL MALIGNANCY<br />
366: MALIGNANCY, FEMALE<br />
REPRODUCTIVE SYSTEM W CC<br />
367: MALIGNANCY, FEMALE<br />
REPRODUCTIVE SYSTEM W/O CC<br />
24<br />
(none)<br />
213: AMPUTATION FOR<br />
MUSCULOSKELETAL SYSTEM &<br />
216: BIOPSIES OF<br />
MUSCULOSKELETAL SYSTEM &<br />
217: WND DEBRID & SKN GRFT<br />
EXCEPT HAND,FOR MUSCSKELET &<br />
240: CONNECTIVE TISSUE<br />
DISORDERS W CC<br />
241: CONNECTIVE TISSUE<br />
DISORDERS W/O CC<br />
As in previous years, we used an “all-cases” mortality rate in four specialties<br />
(Ear, Nose, and Throat, Geriatrics, Gynecology and Rheumatology) rather than a<br />
specialty-specific rate, either because the number <strong>of</strong> hospitals with sufficient<br />
discharges in the particular DRG grouping was too low or because the DRG<br />
groupings proved to be less robust than was desired. Appendix E lists the DRGs<br />
for each specialty.<br />
Mortality scores<br />
Mortality scores are computed by subtracting each specialty-specific mortality<br />
ratio from 1. Using this “reverse scoring,” a mortality ratio <strong>of</strong> 0.25 produces a<br />
score <strong>of</strong> 0.75, a ratio <strong>of</strong> 0.05 produces a score <strong>of</strong> 0.95, and so on. This method<br />
maintains the magnitudes <strong>of</strong> the differences and avoids extreme values. To
dampen the effect <strong>of</strong> year-to-year fluctuations, mortality scores are averaged<br />
over three years.<br />
As with volume and RNs/beds ratios in the structural component, scores at the<br />
extreme in mortality were trimmed to eliminate the influence <strong>of</strong> very wide<br />
variation. Figure 9 shows the percentile at which each <strong>of</strong> the mortality<br />
distributions was trimmed.<br />
Figure 9. Percentile Where Mortality Distributions Were Trimmed<br />
Specialty Percentile<br />
Cancer 95<br />
Digestive Disorders 99<br />
Ear, Nose, and Throat 95<br />
Geriatrics 99<br />
Gynecology 99<br />
Heart and Heart Surgery 95<br />
Hormonal Disorders 95<br />
Kidney Disease 99<br />
Neurology and Neurosurgery 99<br />
Orthopedics 95<br />
Respiratory Disorders 99<br />
Rheumatology 99<br />
Urology 90<br />
As with volume and RNs/beds, restandardization is performed on the mortality<br />
scores after trimming extremes.<br />
25
E. Calculation <strong>of</strong> the <strong>Index</strong><br />
<strong>The</strong> calculation <strong>of</strong> the IHQ for each hospital (other than in specialties ranked solely on<br />
reputation) considers equally the three dimensions <strong>of</strong> quality <strong>of</strong> care: structure, process,<br />
and outcome. Although all three measures represent a specific aspect <strong>of</strong> quality, a<br />
single score provides an easier-to-use result and yields a more accurate portrayal <strong>of</strong><br />
overall quality than would the three aspects individually.<br />
<strong>The</strong>refore, in computing the final scores for a particular specialty, reputational score,<br />
mortality score, and the collective set <strong>of</strong> structural indicators receive arithmetically<br />
equivalent importance.<br />
<strong>The</strong> total formula for calculation <strong>of</strong> the specialty-specific IHQs is:<br />
where:<br />
IHQ i = {[(S 1 * F 1) + (S 2 * F 2) + (...S n * F n)] + [P i * 3F 1-n] + [ M * 3F 1-n]}<br />
IHQi = <strong>Index</strong> for <strong>Hospital</strong> <strong>Quality</strong> for specialty I<br />
S1-n = Structural indicators (STRUCTURE)<br />
F = Factor loading<br />
P = Nomination score (PROCESS)<br />
M = Standardized mortality score (OUTCOME)<br />
<strong>The</strong> general formula for deriving the index scores for tertiary-level hospitals is the same<br />
as when it began in 1993. For presentation purposes, we standardize raw scores, then<br />
equate the raw IHQ scores as computed above to a 100-point scale, where the top<br />
hospital in each specialty receives a score <strong>of</strong> 100.<br />
<strong>The</strong> mean and standard deviation <strong>of</strong> each <strong>of</strong> the 17 specialties are listed in Figure 10.<br />
For the four reputation-only rankings, mean and standard deviation <strong>of</strong> the reputation<br />
score are presented. <strong>The</strong>se data further illustrate that the spread <strong>of</strong> IHQ scores<br />
produces a very small number <strong>of</strong> hospitals two and three standard deviations above the<br />
mean. Horizontal lines in each <strong>of</strong> the 17 specialty lists in Appendices F and G indicate<br />
the cut<strong>of</strong>f points <strong>of</strong> two and three standard deviations above the mean.<br />
26
IHQ scores for the specialties <strong>of</strong> Eyes, Pediatrics, Psychiatry, and Rehabilitation cannot<br />
be calculated, because data for robust and meaningful structural and outcome measures<br />
are not available for these specialties. Thus, as shown in Appendix G, we rank hospitals<br />
in these specialties solely by reputation. Although the four reputation-only specialties<br />
are ranked without the <strong>Index</strong> <strong>of</strong> <strong>Hospital</strong> <strong>Quality</strong>, standard deviations <strong>of</strong> the reputation<br />
scores are still useful in identifying truly superior hospitals (in terms <strong>of</strong> statistically<br />
relevant nomination scores).<br />
27
Figure 10. Mean and Standard Deviations <strong>of</strong> IHQ and Reputation Scores<br />
IHQ Score<br />
Specialty Mean Standard<br />
deviation<br />
28<br />
1 SD above<br />
the mean<br />
2 SDs<br />
above<br />
the mean<br />
3 SDs<br />
above<br />
the mean<br />
Cancer 21.92 6.88 28.80 35.68 42.56<br />
Digestive Disorders 22.45 5.16 27.62 32.78 37.95<br />
Ear, Nose, and Throat 21.38 5.87 27.25 33.12 39.00<br />
Geriatrics 20.85 5.62 26.47 32.09 37.71<br />
Gynecology 21.85 6.20 28.05 34.25 40.45<br />
Heart and Heart Surgery 20.47 7.14 27.60 34.74 41.88<br />
Hormonal Disorders 20.37 6.24 26.61 32.84 39.08<br />
Kidney Disease 29.46 7.10 36.57 43.67 50.77<br />
Neurology and Neurosurgery 20.30 6.60 26.90 33.50 40.09<br />
Orthopedics 20.40 5.42 25.82 31.23 36.65<br />
Respiratory disorders 20.57 5.38 25.96 31.34 36.72<br />
Rheumatology 26.07 5.77 31.83 37.60 43.37<br />
Urology 23.29 4.86 28.15 33.01 37.87<br />
Reputational Score<br />
Specialty Mean Standard<br />
deviation<br />
1 SD above<br />
the mean<br />
2 SDs<br />
above<br />
the mean<br />
3 SDs<br />
above<br />
the mean<br />
Eyes 4.41 13.27 17.68 30.95 44.22<br />
Pediatrics 3.23 7.83 11.05 18.88 26.71<br />
Psychiatry 3.34 7.33 10.67 18.01 25.34<br />
Rehabilitation 3.50 8.90 12.40 21.30 30.20
F. Summary <strong>of</strong> Changes for <strong>2003</strong><br />
• <strong>The</strong> overall sample size <strong>of</strong> the physician survey returned to 2,550 from 3,060 by<br />
reducing the number <strong>of</strong> physicians surveyed to 150 from 180 per specialty (p. 2).<br />
• Hospice Care was removed from the Service Mix <strong>Index</strong>, which changed the<br />
maximum score for this indicator from 10 to 9. Hospice care is taken into<br />
account in the hospice/palliative care indicator which was added to the structural<br />
measures in several specialties in 2002 (p. 12).<br />
• <strong>The</strong> second additional postcard reminder (which was previously sent to all nonresponders<br />
one month after the third mailing) was not utilized in <strong>2003</strong> (p. 19).<br />
• All physicians received the short form <strong>of</strong> the questionnaire, which was introduced<br />
in 2002 (p. 19).<br />
• DRG groupings were updated in Digestive Disorders, Orthopedics, and<br />
Gynecology (p. 23).<br />
29
III Directions for Future Releases<br />
Since its inception, the U.S. News <strong>Index</strong> has used the most rigorous methodology available<br />
to define, measure, and combine the components <strong>of</strong> quality incorporated in its construction.<br />
We will continue to re-examine them. Continuing research will address the way in which<br />
reputational score is used to define process; transformations <strong>of</strong> the raw scores; measures<br />
<strong>of</strong> technology for the structural component, and refinement <strong>of</strong> the definitions <strong>of</strong> non-fatal<br />
outcomes.<br />
We will also continue to investigate the availability and quality <strong>of</strong> 30-day mortality rates as<br />
compared to death-at-discharge rates. <strong>The</strong> ability to measure the outcomes <strong>of</strong> procedures<br />
after a patient’s release from the hospital would enhance the quality <strong>of</strong> the rankings. Before<br />
implementing such a measure, however, we must assess the quality <strong>of</strong> the data available<br />
for input.<br />
As in years past, we welcome input from users <strong>of</strong> the index in charting new directions.<br />
Readers and users are encouraged to contact the authors with suggestions and questions.<br />
30
IV References<br />
1. Donabedian A. Evaluating the quality <strong>of</strong> medical care. <strong>The</strong> Milbank Memorial Fund<br />
Quarterly. 1966; 44:166-203.<br />
2. Donabedian A. Promoting quality through evaluating the process <strong>of</strong> patient care. Med<br />
Care.1968; 6:181.<br />
3. Hill, CA., Winfrey, KL., Rudolph, BA. “Best <strong>Hospital</strong>s”: A description <strong>of</strong> the methodology for<br />
the index <strong>of</strong> hospital quality. Inquiry. 1997; 34(1)80-90.<br />
4. American <strong>Hospital</strong> Association. 1996 Annual Survey <strong>of</strong> <strong>Hospital</strong>s Data Base Documentation<br />
Manual.<br />
5. Ehrlich, RH, Hill CA, Winfrey, KL. 1997 Survey <strong>of</strong> Best <strong>Hospital</strong>s. Chicago: NORC; 1997.<br />
6. <strong>The</strong> Cancer Centers Branch <strong>of</strong> the National Cancer Institute. Policies and guidelines relating<br />
to the cancer-center support grant. Washington, DC: National Cancer Institute; 2000.<br />
7 . United States Department <strong>of</strong> Health and Human Services. Medicare hospital mortality<br />
information. HCFA publication 01-002. Report prepared by Otis R. Bowen and William L.<br />
Roper. Washington, DC:USGPO; 1987.<br />
8. Blumberg MS. Comments on HCFA hospital death rate statistical outliers. HSR: Health<br />
Services Research. 1987; 21:715-40.<br />
9. Dubois RW, Brook RH, Rogers WH. Adjusted hospital death rates: a potential screen or<br />
the quality <strong>of</strong> medical care. AJPH. 1987; 77:1162-6.<br />
10. Gillis KD, Hixson JS. Efficacy <strong>of</strong> statistical outlier analysis for monitoring quality <strong>of</strong> care.<br />
Journal <strong>of</strong> Business and Economic Statistics. 1991; 9:241-52.<br />
11. Green J, Wintfield N, Sharkey P, Passman LJ. <strong>The</strong> importance <strong>of</strong> severity <strong>of</strong> illness in<br />
assessing hospital mortality. JAMA. 1990; 263:241-6.<br />
12. Green J, Passman LJ, Wintfield N. Analyzing hospital mortality: the consequences <strong>of</strong><br />
diversity in patient mix. JAMA. 1991; 265:1849-53.<br />
13. Greenfield S, Aronow HU, Elash<strong>of</strong>f RM, Watanabe D. Flaws in mortality data: the hazards<br />
<strong>of</strong> ignoring comorbid disease. JAMA. 1988; 260:2253-7.<br />
31
14. Rosen HM, Green BA. <strong>The</strong> HCFA excess mortality lists: a methodological critique.<br />
<strong>Hospital</strong> and Health Services Administration. 1987; 2:119-24.<br />
15. Flood AB, Scott WR. Conceptual and methodological issues in measuring the quality <strong>of</strong><br />
care in hospitals. In <strong>Hospital</strong> structure and performance. Baltimore: Johns Hopkins<br />
University Press; 1987.<br />
16. Iezzoni LI, Ash AS, C<strong>of</strong>fman GA, Moskowitz MA. Predicting in-hospital mortality: a<br />
comparison <strong>of</strong> severity measurement approaches. Med Care. 1992; 30:347-59.<br />
32
V Appendices
Appendix A<br />
Structural Variable Map
<strong>The</strong> following variables, used to construct structural elements <strong>of</strong> the <strong>2003</strong> IHQ, were taken from the<br />
2001 Annual Survey <strong>of</strong> <strong>Hospital</strong>s Data Base published by the American <strong>Hospital</strong> Association.<br />
All <strong>Hospital</strong> <strong>Index</strong> (used to define hospital eligibility)<br />
1 point if ANGIOHOS=1, half point if ANGIOSYS, ANGIONET, or ANGIOVEN=1<br />
1 point if CCLABHOS=1, half point if CCLABSYS, CCLABNET, or CCLABVEN=1<br />
1 point if CICBDHOS=1, half point if CICBDSYS, CICBDNET, or CICBDVEN=1<br />
1 point if CTSCNHOS=1, half point if CTSCNSYS, CTSCNNET, or CTSCNVEN=1<br />
1 point if DRADFHOS=1, half point if DRADFSYS, DRADFNET, or DRADFVEN=1<br />
1 point if ESWLHOS=1, half point if ESWLSYS, ESWLNET, or ESWLVEN=1<br />
1 point if MAMMSHOS=1, half point if MAMMSSYS, MAMMSNET, or MAMMSVEN=1<br />
1 point if MRIHOS=1, half point if MRISYS, MRINET, or MRIVEN=1<br />
1 point if MSICHOS=1, half point if MSICSYS, MSICNET, or MSICVEN=1<br />
1 point if NICBDHOS=1, half point if NICBDSYS, NICBDNET, or NICBDVEN=1<br />
1 point if OHSRGHOS=1, half point if OHSRGSYS, OHSRGNET, or OHSRGVEN=1<br />
1 point if PEDBDHOS=1, half point if PEDBDSYS, PEDBDNET, or PEDBDVEN=1<br />
1 point if PETHOS=1, half point if PETSYS, PETNET, or PETVEN=1<br />
1 point if RADTHHOS=1, half point if RADTHSYS, RADTHNET, or RADTHVEN=1<br />
1 point if REPROHOS=1, half point if REPROSYS, REPRONET, or REPROVEN=1<br />
1 point if SPECTHOS=1, half point if SPECTSYS, SPECTNET, or SPECTVEN=1<br />
1 point if ULTSNHOS=1, half point if ULTSNSYS, ULTSNNET, or ULTSNVEN=1<br />
Cancer Technology <strong>Index</strong><br />
1 point if CTSCNHOS=1, half point if CTSCNSYS, CTSCNNET, or CTSCNVEN=1<br />
1 point if MRIHOS=1, half point if MRISYS, MRINET, or MRIVEN=1<br />
1 point if ONCOLHOS=1, half point if ONCOLSYS, ONCOLNET, or ONCOLVEN=1<br />
1 point if PEDICHOS=1, half point if PEDICSYS, PEDICNET, or PEDICVEN=1<br />
1 point if PETHOS=1, half point if PETSYS, PETNET, or PETVEN=1<br />
1 point if RADTHHOS=1, half point if RADTHSYS, RADTHNET, or RADTHVEN=1<br />
1 point if SPECTHOS=1, half point if SPECTSYS, SPECTNET, or SPECTVEN=1
Digestive Disorders Technology <strong>Index</strong><br />
1 point if CTSCNHOS=1, half point if CTSCNSYS, CTSCNNET, or CTSCNVEN=1<br />
1 point if DRADFHOS=1, half point if DRADFSYS, DRADFNET, or DRADFVEN=1<br />
1 point if ESWLHOS=1, half point if ESWLSYS, ESWLNET, or ESWLVEN=1<br />
1 point if MRIHOS=1, half point if MRISYS, MRINET, or MRIVEN=1<br />
1 point if PETHOS=1, half point if PETSYS, PETNET, or PETVEN=1<br />
1 point if RADTHHOS=1, half point if RADTHSYS, RADTHNET, or RADTHVEN=1<br />
1 point if SPECTHOS=1, half point if SPECTSYS, SPECTNET, or SPECTVEN=1<br />
1 point if ULTSNHOS=1, half point if ULTSNSYS, ULTSNNET, or ULTSNVEN=1<br />
Ear, Nose, and Throat Technology <strong>Index</strong><br />
1 point if CTSCNHOS=1, half point if CTSCNSYS, CTSCNNET, or CTSCNVEN=1<br />
1 point if MRIHOS=1, half point if MRISYS, MRINET, or MRIVEN=1<br />
1 point if PETHOS=1, half point if PETSYS, PETNET, or PETVEN=1<br />
1 point if RADTHHOS=1, half point if RADTHSYS, RADTHNET, or RADTHVEN=1<br />
1 point if SPECTHOS=1, half point if SPECTSYS, SPECTNET, or SPECTVEN=1<br />
Heart and Heart Surgery Technology <strong>Index</strong><br />
1 point if ANGIOHOS=1, half point if ANGIOSYS, ANGIONET, or ANGIOVEN=1<br />
1 point if CCLABHOS=1, half point if CCLABSYS, CCLABNET, or CCLABVEN=1<br />
1 point if CICHOS=1, half point if CICSYS, CICNET, or CICVEN=1<br />
1 point if CTSCNHOS=1, half point if CTSCNSYS, CTSCNNET, or CTSCNVEN=1<br />
1 point if MRIHOS=1, half point if MRISYS, MRINET, or MRIVEN=1<br />
1 point if OHSRGHOS=1, half point if OHSRGSYS, OHSRGNET, or OHSRGVEN=1<br />
1 point if PETHOS=1, half point if PETSYS, PETNET, or PETVEN=1<br />
1 point if SPECTHOS=1, half point if SPECTSYS, SPECTNET, or SPECTVEN=1<br />
1 point if ULTSNHOS=1, half point if ULTSNSYS, ULTSNNET, or ULTSNVEN=1<br />
Hormonal Disorders Technology <strong>Index</strong><br />
1 point if CTSCNHOS=1, half point if CTSCNSYS, CTSCNNET, or CTSCNVEN=1<br />
1 point if DRADFHOS=1, half point if DRADFSYS, DRADFNET, or DRADFVEN=1<br />
1 point if MRIHOS=1, half point if MRISYS, MRINET, or MRIVEN=1<br />
1 point if PETHOS=1, half point if PETSYS, PETNET, or PETVEN=1<br />
1 point if RADTHHOS=1, half point if RADTHSYS, RADTHNET, or RADTHVEN=1<br />
1 point if SPECTHOS=1, half point if SPECTSYS, SPECTNET, or SPECTVEN=1<br />
1 point if ULTSNHOS=1, half point if ULTSNSYS, ULTSNNET, or ULTSNVEN=1
Geriatrics Technology <strong>Index</strong><br />
1 point if CCLABHOS=1, half point if CCLABSYS, CCLABNET, or CCLABVEN=1<br />
1 point if CICHOS=1, half point if CICSYS, CICNET, or CICVEN=1<br />
1 point if CTSCNHOS=1, half point if CTSCNSYS, CTSCNNET, or CTSCNVEN=1<br />
1 point if MRIHOS=1, half point if MRISYS, MRINET, or MRIVEN=1<br />
1 point if PETHOS=1, half point if PETSYS, PETNET, or PETVEN=1<br />
1 point if RADTHHOS=1, half point if RADTHSYS, RADTHNET, or RADTHVEN=1<br />
1 point if SPECTHOS=1, half point if SPECTSYS, SPECTNET, or SPECTVEN=1<br />
1 point if ULTSNHOS=1, half point if ULTSNSYS, ULTSNNET, or ULTSNVEN=1<br />
Gynecology Technology <strong>Index</strong><br />
1 point if CTSCNHOS=1, half point if CTSCNSYS, CTSCNNET, or CTSCNVEN=1<br />
1 point if MAMMSHOS=1, half point if MAMMSSYS, MAMMSNET, or MAMMSVEN=1<br />
1 point if MRIHOS=1, half point if MRISYS, MRINET, or MRIVEN=1<br />
1 point if NICHOS=1, half point if NICSYS, NICNET, or NICVEN=1<br />
1 point if PETHOS=1, half point if PETSYS, PETNET, or PETVEN=1<br />
1 point if RADTHHOS=1, half point if RADTHSYS, RADTHNET, or RADTHVEN=1<br />
1 point if SPECTHOS=1, half point if SPECTSYS, SPECTNET, or SPECTVEN=1<br />
1 point if ULTSNHOS=1, half point if ULTSNSYS, ULTSNNET, or ULTSNVEN=1<br />
Kidney Disease Technology <strong>Index</strong><br />
1 point if CTSCNHOS=1, half point if CTSCNSYS, CTSCNNET, or CTSCNVEN=1<br />
1 point if DRADFHOS=1, half point if DRADFSYS, DRADFNET, or DRADFVEN=1<br />
1 point if ESWLHOS=1, half point if ESWLSYS, ESWLNET, or ESWLVEN=1<br />
1 point if TPLNTHOS=1, half point if TPLNTSYS, TPLNTNET, or TPLNTVEN=1<br />
1 point if ULTSNHOS=1, half point if ULTSNSYS, ULTSNNET, or ULTSNVEN=1<br />
Neurology and Neurosurgery Technology <strong>Index</strong><br />
1 point if CTSCNHOS=1, half point if CTSCNSYS, CTSCNNET, or CTSCNVEN=1<br />
1 point if DRADFHOS=1, half point if DRADFSYS, DRADFNET, or DRADFVEN=1<br />
1 point if MRIHOS=1, half point if MRISYS, MRINET, or MRIVEN=1<br />
1 point if PETHOS=1, half point if PETSYS, PETNET, or PETVEN=1<br />
1 point if RADTHHOS=1, half point if RADTHSYS, RADTHNET, or RADTHVEN=1<br />
1 point if SPECTHOS=1, half point if SPECTSYS, SPECTNET, or SPECTVEN=1<br />
1 point if ULTSNHOS=1, half point if ULTSNSYS, ULTSNNET, or ULTSNVEN=1
Orthopedics Technology <strong>Index</strong><br />
1 point if CTSCNHOS=1, half point if CTSCNSYS, CTSCNNET, or CTSCNVEN=1<br />
1 point if MRIHOS=1, half point if MRISYS, MRINET, or MRIVEN=1<br />
1 point if PETHOS=1, half point if PETSYS, PETNET, or PETVEN=1<br />
1 point if SPECTHOS=1, half point if SPECTSYS, SPECTNET, or SPECTVEN=1<br />
1 point if ULTSNHOS=1, half point if ULTSNSYS, ULTSNNET, or ULTSNVEN=1<br />
Respiratory Disorders Technology <strong>Index</strong><br />
1 point if CTSCNHOS=1, half point if CTSCNSYS, CTSCNNET, or CTSCNVEN=1<br />
1 point if DRADFHOS=1, half point if DRADFSYS, DRADFNET, or DRADFVEN=1<br />
1 point if RADTHHOS=1, half point if RADTHSYS, RADTHNET, or RADTHVEN=1<br />
1 point if ULTSNHOS=1, half point if ULTSNSYS, ULTSNNET, or ULTSNVEN=1<br />
Rheumatology Technology <strong>Index</strong><br />
1 point if CTSCNHOS=1, half point if CTSCNSYS, CTSCNNET, or CTSCNVEN=1<br />
1 point if MRIHOS=1, half point if MRISYS, MRINET, or MRIVEN=1<br />
1 point if PETHOS=1, half point if PETSYS, PETNET, or PETVEN=1<br />
1 point if SPECTHOS=1, half point if SPECTSYS, SPECTNET, or SPECTVEN=1<br />
1 point if ULTSNHOS=1, half point if ULTSNSYS, ULTSNNET, or ULTSNVEN=1<br />
Urology Technology <strong>Index</strong><br />
1 point if CTSCNHOS=1, half point if CTSCNSYS, CTSCNNET, or CTSCNVEN=1<br />
1 point if DRADFHOS=1, half point if DRADFSYS, DRADFNET, or DRADFVEN=1<br />
1 point if ESWLHOS=1, half point if ESWLSYS, ESWLNET, or ESWLVEN=1<br />
1 point if MRIHOS=1, half point if MRISYS, MRINET, or MRIVEN=1<br />
1 point if PETHOS=1, half point if PETSYS, PETNET, or PETVEN=1<br />
1 point if RADTHHOS=1, half point if RADTHSYS, RADTHNET, or RADTHVEN=1<br />
1 point if SPECTHOS=1, half point if SPECTSYS, SPECTNET, or SPECTVEN=1<br />
1 point if ULTSNHOS=1, half point if ULTSNSYS, ULTSNNET, or ULTSNVEN=1<br />
Discharge Planning<br />
1 point if CMNGTHOS=1<br />
1 point if PATEDHOS=1<br />
1 point if PATRPHOS =1
Geriatric Services<br />
1 point if ADULTHOS=1<br />
1 point if ARTHCHOS=1<br />
1 point if ASSTLHOS=1<br />
1 point if GERSVHOS=1<br />
1 point if MEALSHOS=1<br />
1 point if PATRPHOS=1<br />
1 point if TPORTHOS=1<br />
Gynecology Services<br />
1 point if BROOMHOS=1<br />
1 point if OBLEV=2 or 3 and OBHOS=1<br />
1 point if REPROHOS=1<br />
1 point if WOMHCHOS=1<br />
Service Mix<br />
1 point if ALCHHOS=1<br />
1 point if COUTRHOS=1<br />
1 point if HOMEHHOS=1<br />
1 point if PSYEDHOS=1<br />
1 point if PSYLSHOS=1<br />
1 point if REPROHOS=1<br />
1 point if SOCWKHOS=1<br />
1 point if WOMHCHOS=1<br />
R.N.'s to Beds<br />
Full-time Registered Nurses (FTRNTF) divided by Total <strong>Hospital</strong> Beds (HOSPBD)<br />
Trauma<br />
"Yes" if TRAUML90=1 or 2 and TRAUMHOS=1<br />
NCI<br />
"Yes" if a National Cancer Institute designated Comprehensive or Clinical Cancer<br />
Center
Hospice/Palliative Care<br />
"H, P" if (HOSPCHOS=1 or HOSPCSYS=1 or HOSPCNET=1 or HOSPCVEN=1) and (PALHOS=1<br />
or PALSYS=1 or PALNET=1 or PALVEN=1)<br />
"H" if HOSPCHOS=1 or HOSPCSYS=1 or HOSPCNET=1 or HOSPCVEN=1<br />
"P" if PALHOS=1 or PALSYS=1 or PALNET=1 or PALVEN=1<br />
Palliative Care<br />
"Yes" if PALHOS=1 or PALSYS=1 or PALNET=1 or PALVEN=1
Appendix B<br />
2002 Sample Physician<br />
Questionnaire (Long Form)
Appendix C<br />
2002/<strong>2003</strong> Sample Physician<br />
Questionnaire (Short Form)
Appendix D<br />
Predicted Mortality: APR-DRG<br />
Methodology
Introduction to DRGs<br />
<strong>The</strong> All Patient Refined Diagnosis Related Groups (APR-DRGs) were developed by 3M<br />
Health Information Systems (3M-HIS) in conjunction with the National Association <strong>of</strong><br />
Children’s <strong>Hospital</strong>s and Related Institutions (NACHRI). APR-DRGs expand the basic<br />
diagnosis-related group (DRG) structure to address patient severity <strong>of</strong> illness, risk <strong>of</strong><br />
mortality, and resource intensity. <strong>The</strong> APR-DRG Version 15.0 uses the Health Care<br />
Financing Administration (HCFA) Version 14.0 DRG methodology. Because APR-DRGs are<br />
based on DRGs and All Patient DRGs (AP-DRGs), a brief explanation <strong>of</strong> both structures will<br />
be useful.<br />
Current HCFA DRG Structure<br />
Created from Adjacent Diagnosis Related Groups (ADGs) which combine patients<br />
into groups with common characteristics, DRGs were developed by Yale University<br />
in the 1970s to relate a hospital’s case mix index to the resource demands and<br />
associated costs experienced by the hospital.<br />
ADGs were created by subdividing an MDC 2 into two groups based on the presence<br />
or absence <strong>of</strong> an operating room procedure. Surgical patients, identified as those<br />
having an operating room procedure, were then classified by type <strong>of</strong> procedure to<br />
form surgical ADGs. Patients with multiple procedures were assigned to the highest<br />
surgical class. Medical patients were divided into smaller groups, based on their<br />
principal diagnosis, to form medical ADGs.<br />
DRGs use ADGs as a base and then further classify patients into selected disease<br />
and procedure categories based on whether or not they have substantial<br />
comorbidities or complications (CC). Approximately 3,000 diagnosis codes have<br />
been designated by HCFA as substantial CCs, (defined by a list <strong>of</strong> additional<br />
diagnosis codes that a panel <strong>of</strong> physicians felt would increase the length <strong>of</strong> stay by<br />
at least one day for 75 percent <strong>of</strong> the patients). This list covers a broad range <strong>of</strong><br />
disease conditions, and no differentiation in severity or complexity level was made<br />
among the additional diagnoses. <strong>The</strong> patient’s age and discharge status were<br />
sometimes used in the definition <strong>of</strong> DRGs.<br />
2 Major Diagnostic Categories (MDCs) are broad medical and surgical categories one step<br />
hierarchically higher than DRGs (several DRGs roll-up into an MDC). MDCs are divided by body<br />
systems such as nervous; ear, nose, and throat; and respiratory.
Current AP-DRG Structure<br />
In 1987, the New York State Department <strong>of</strong> Health entered into an agreement with<br />
3M-HIS to evaluate the applicability <strong>of</strong> DRGs to a non-Medicare population with a<br />
specific focus on neonates and patients with Human Immunodeficiency Virus (HIV)<br />
infections. <strong>The</strong> DRG definitions developed by this relationship are referred to as the<br />
AP-DRGs.<br />
<strong>The</strong> AP-DRGs are modeled after the HCFA DRGs and attempt to improve the DRGs<br />
in an effort to more accurately predict a hospital’s resource demands and associated<br />
costs for all acute care patients. In the creation <strong>of</strong> AP-DRGs, the modifications<br />
made to the DRG structure can be summarized as follows:<br />
C Except for neonates who die or are transferred within the first few days <strong>of</strong><br />
life, AP-DRGs define six ranges <strong>of</strong> birth weight that represent distinct<br />
demands on hospital resources. Within each birth weight range, neonates<br />
are then subdivided based on the presence <strong>of</strong> a significant operating room<br />
procedure, and then further subdivided based on presence <strong>of</strong> multiple major,<br />
minor, or other problems.<br />
C Assignment to neonatal MDC is based on age. Specifically, the AP-DRGs<br />
assign a patient to the neonatal MDC when the age <strong>of</strong> the patient is less<br />
than 29 days at admission regardless <strong>of</strong> the principal diagnosis.<br />
C MDC 25 was created to account for the highly specialized treatment <strong>of</strong><br />
multiple trauma patients. Patients assigned to MDC 25 have at least two<br />
significant trauma diagnoses from different body sites.<br />
C MDC 20 for alcohol and substance abuse was restructured to differentiate<br />
patients based on the substance being abused.<br />
C Across all MDCs, patient with a tracheostomy were put into either <strong>of</strong> two<br />
tracheostomy AP-DRGs: tracheostomy performed for therapeutic reasons<br />
and tracheostomy representing long-term ventilation.<br />
C All liver, bone marrow, heart, kidney, and lung transplant patients were<br />
assigned to an AP-DRG independent <strong>of</strong> the MDC <strong>of</strong> the principal diagnosis.
C For several MDCs, a single major comorbidity and complication (CC) AP-<br />
DRG was formed across all surgical patients within an MDC and a single<br />
major CC AP-DRG was formed across all medical patients within an MDC.<br />
<strong>The</strong> AP-DRGs introduced changes to the HCFA DRGs in an attempt to depart from<br />
using the principal diagnosis as the initial variable for assignment. <strong>The</strong> AP-DRGs<br />
were designed to more accurately group patients into like groups that provide an<br />
operational means <strong>of</strong> defining and measuring a hospital’s case mix complexity.
All Patient Refined DRGs<br />
APR-DRG Objectives<br />
<strong>The</strong> primary objective <strong>of</strong> the HCFA DRG and AP-DRG patient classification systems<br />
was to relate the type <strong>of</strong> patients treated to the hospital resources they consumed.<br />
This limited focus on resource intensity does not allow providers to classify patients<br />
into other groups for meaningful analysis. <strong>The</strong> APR-DRG patient classification<br />
system goes beyond traditional resource intensity measures and was designed with<br />
the ability to address the following needs:<br />
C Compare hospitals across a wide range <strong>of</strong> resource and outcome measures<br />
C Evaluate differences in inpatient mortality rates<br />
C Implement and support critical pathways<br />
C Identify continuous quality improvement initiatives<br />
C Support internal management and planning systems<br />
C Manage capitated payment arrangements.<br />
To meet these needs, the APR-DRG system classifies patients according to severity<br />
<strong>of</strong> illness, risk <strong>of</strong> mortality, and resource intensity. <strong>The</strong>refore, in the APR-DRG<br />
classification system a patient is assigned three distinct descriptors: base APR-<br />
DRG, severity <strong>of</strong> illness subclass, and risk <strong>of</strong> mortality subclass.<br />
Severity <strong>of</strong> illness can be defined as the extent <strong>of</strong> physiologic decompensation or<br />
organ system loss <strong>of</strong> function experienced by the patient. In contrast, risk <strong>of</strong><br />
mortality is defined as the patient’s likelihood <strong>of</strong> dying.<br />
For analyses such as evaluating resource intensity or patient care outcomes, the<br />
base APR-DRGs in conjunction with the severity <strong>of</strong> illness subclass is used. For<br />
evaluating patient mortality, the base APR-DRGs in conjunction with the risk <strong>of</strong><br />
mortality subclass is used.
Development <strong>of</strong> the APR-DRGs<br />
<strong>The</strong> AP-DRGs were used as the base DRGs in the development <strong>of</strong> the APR-DRGs<br />
because they were representative <strong>of</strong> the entire inpatient population and accounted<br />
for populations not included in DRGs at the time <strong>of</strong> development. Several<br />
consolidations, additions, and modifications were made to the AP-DRGs to form the<br />
list <strong>of</strong> APR-DRGs used in the severity <strong>of</strong> illness and risk <strong>of</strong> mortality subclass<br />
assignments.<br />
<strong>The</strong> following list summarizes the revisions made to the AP-DRGs in the creation<br />
<strong>of</strong> the APR-DRGs:<br />
C All age, CC, and major CC splits were consolidated.<br />
C Splits based on discharge status or death were consolidated.<br />
C Definitions based on the presence or absence <strong>of</strong> a complicated principal<br />
diagnosis were consolidated.<br />
C Additional APR-DRGs were created for pediatric patients.<br />
C APR-DRGs for newborns were completely restructured to create medical<br />
and surgical hierarchies within each birth weight range.<br />
C Low volume APR-DRGs were consolidated into other related APR-DRGs.<br />
C APR-DRGs that could be explained by the severity <strong>of</strong> illness subclasses<br />
were consolidated into one APR-DRG.<br />
C Due to risk <strong>of</strong> mortality subclasses, several APR-DRGs were split to account<br />
for significant differences in mortality between patient groups.<br />
APR-DRG Severity <strong>of</strong> Illness Subclass Assignment<br />
With the exception <strong>of</strong> neonatal patients, after a patient has been given an APR-DRG<br />
code, a Severity <strong>of</strong> Illness Subclass is assigned based on the level <strong>of</strong> the secondary<br />
diagnoses, presence <strong>of</strong> certain non-OR procedures, and the interaction among<br />
secondary diagnoses, age, APR-DRG and principal diagnosis. Neonatal patients
Phase I<br />
have their own hierarchical method for determining severity <strong>of</strong> illness and will be<br />
discussed later. <strong>The</strong> four severity <strong>of</strong> illness subclasses are:<br />
Subclass (PSC) Severity <strong>of</strong> Illness<br />
1 Minor (Includes non CC)<br />
2 Moderate<br />
3 Major<br />
4 Extreme<br />
<strong>The</strong> severity <strong>of</strong> illness subclass is used in conjunction with the patient’s base APR-<br />
DRG for analysis such as evaluating resource intensity or patient care outcomes.<br />
A patient’s severity <strong>of</strong> illness subclass should not be used with their DRG because<br />
several DRGs may form one APR-DRG. <strong>The</strong>refore, since severity <strong>of</strong> illness<br />
subclasses correspond to the APR-DRG number and not the DRG, it is important<br />
to use the APR-DRG number to accurately interpret data.<br />
<strong>The</strong> process for assigning a patient a severity <strong>of</strong> illness subclass is a three phase<br />
process and is summarized as follows:<br />
C Secondary diagnoses that are closely related to the principal diagnosis are<br />
eliminated from further analysis.<br />
C Remaining secondary diagnoses are assigned one <strong>of</strong> four distinct Standard Severity<br />
<strong>of</strong> Illness Levels. Figure 1 presents examples <strong>of</strong> secondary diagnoses in each<br />
severity <strong>of</strong> illness level.
Figure 1. Examples <strong>of</strong> Secondary Diagnoses by Severity <strong>of</strong> Illness Level<br />
Severity <strong>of</strong> Illness Level Examples <strong>of</strong> Secondary Diagnoses<br />
Minor Benign hypertension, acute bronchitis, lumbago<br />
Moderate Chronic renal failure, viral pneumonia, diverticulitis<br />
Major Diabetic ketoacidosis, chronic heart failure, acute cholecystitis<br />
Extreme<br />
Septicemia, acute myocardial infarction, cerebral vascular<br />
accident<br />
C <strong>The</strong> Standard Severity <strong>of</strong> Illness Level is modified for some secondary diagnoses<br />
based on age, APR-DRG, and presence <strong>of</strong> non-OR procedures. Figure 2 displays<br />
an example <strong>of</strong> modifications to the standard severity <strong>of</strong> illness level based on the<br />
APR-DRG.<br />
Figure 2. Examples <strong>of</strong> Standard Severity <strong>of</strong> Illness Modifications<br />
Secondary<br />
Standard Severity <strong>of</strong><br />
APR-DRG Modified Severity<br />
Diagnosis<br />
Illness Level<br />
<strong>of</strong> Illness Level<br />
Stridor Moderate Bronchitis and asthma Minor<br />
Chronic renal failure Moderate Diabetes Major<br />
Cardiomegaly Moderate Chronic heart failure Minor<br />
Uncomplicated<br />
diabetes<br />
Minor Vaginal delivery Moderate
Phase II<br />
C All secondary diagnoses that are closely related to other secondary diagnoses are<br />
eliminated from further analysis, and the secondary diagnosis with the highest<br />
Severity <strong>of</strong> Illness Level is retained. This prevents double counting clinically similar<br />
diagnoses.<br />
C <strong>The</strong> Base Severity <strong>of</strong> Illness Subclass <strong>of</strong> the patient is set to the highest Standard<br />
Severity <strong>of</strong> Illness Level <strong>of</strong> any <strong>of</strong> the secondary diagnoses.<br />
C Patients with a Base Severity <strong>of</strong> Illness Subclass <strong>of</strong> major (3) or extreme (4), will be<br />
reduced to the next lower subclass unless the patient has multiple secondary<br />
diagnoses with a high Standard Severity <strong>of</strong> Illness Level. Figure 3 displays the<br />
requirements for keeping a severity <strong>of</strong> illness subclass <strong>of</strong> major or extreme.<br />
Figure 3. Multiple Secondary Diagnoses Requirements<br />
Base Severity <strong>of</strong><br />
Multiple Secondary Diagnoses Requirements<br />
Illness Subclass to Prevent Reduction <strong>of</strong> Severity <strong>of</strong> Illness Subclass<br />
Major Two or more secondary diagnoses that are major or one secondary<br />
diagnosis that is major and at least two secondary diagnoses that are<br />
moderate<br />
Extreme Two or more secondary diagnoses that are extreme or one secondary<br />
diagnosis that is extreme and at least two secondary diagnoses that are<br />
major
Phase III<br />
C A minimum Severity <strong>of</strong> Illness Subclass is established based on the patient’s<br />
principal diagnosis. This accounts for patients assigned to codes that contain both<br />
the underlying disease and an associated manifestation <strong>of</strong> the disease (i.e. diabetes<br />
with hyperosmolar coma), but is only assigned to the APR-DRG that accounts for<br />
the underlying disease.<br />
C A minimum Severity <strong>of</strong> Illness Subclass is established based on combinations <strong>of</strong><br />
principal diagnosis and age for specific APR-DRGs.<br />
C A minimum Severity <strong>of</strong> Illness Subclass is established for some APR-DRGs with<br />
certain APR-DRG and non-OR procedure combinations as well as principal<br />
diagnosis and non-OR procedure combinations<br />
C A minimum Severity <strong>of</strong> Illness Subclass is established based on the presence <strong>of</strong><br />
certain combinations <strong>of</strong> secondary diagnoses. Figure 4 shows the combination <strong>of</strong><br />
secondary diagnoses necessary to increase the severity <strong>of</strong> illness subclass to a<br />
minimum severity <strong>of</strong> illness level. For example, a type 1 combination would be a<br />
major bacterial infection with pleural effusion. If a diagnosis from both <strong>of</strong> these<br />
categories is present plus at least one other secondary diagnosis that is at least a<br />
major severity <strong>of</strong> illness level, then the minimum patient severity <strong>of</strong> illness subclass<br />
will be extreme.
Figure 4. Minimum Severity <strong>of</strong> Illness Requirements<br />
Combination<br />
Type<br />
Combination <strong>of</strong><br />
Categories<br />
1 Specified combinations <strong>of</strong> two<br />
major categories<br />
2 Specified combinations <strong>of</strong> two<br />
moderate categories<br />
3 Specified combinations <strong>of</strong> a<br />
moderate and a minor category<br />
4 Specified combinations <strong>of</strong> two<br />
minor categories<br />
5 Specified combinations <strong>of</strong> two<br />
moderate categories<br />
Additional Secondary<br />
Diagnoses Required<br />
At least one additional<br />
major secondary diagnosis<br />
At least one additional<br />
moderate secondary diagnosis<br />
At least one additional<br />
moderate secondary diagnosis<br />
At least two additional minor<br />
secondary diagnoses<br />
Minimum<br />
Severity <strong>of</strong><br />
Illness<br />
Extreme<br />
Major<br />
Major<br />
Moderate<br />
None Major<br />
C <strong>The</strong> final patient Severity <strong>of</strong> Illness Subclass is selected based on the maximum <strong>of</strong><br />
the Phase II Base Patient Severity <strong>of</strong> Illness Subclass and the Phase III minimum<br />
Severity <strong>of</strong> Illness Subclass<br />
Both medical and surgical patients are assigned a severity <strong>of</strong> illness level <strong>of</strong> 1-4 based on<br />
the assignment process outlined previously.
APR-DRG Risk <strong>of</strong> Mortality Subclass Assignment<br />
Similar to the Severity <strong>of</strong> Illness Subclass assignment, the Risk <strong>of</strong> Mortality Subclass<br />
assignment is based on the level <strong>of</strong> the secondary diagnoses and the interaction among<br />
secondary diagnoses, age, APR-DRG, and principal diagnosis. In general, the patients<br />
Risk <strong>of</strong> Mortality Level and Subclass will be lower than the Severity <strong>of</strong> Illness Level and<br />
Subclass, respectively. Neonatal patients have their own hierarchical method for<br />
determining risk <strong>of</strong> mortality and will be discussed later. <strong>The</strong> four severity <strong>of</strong> illness<br />
subclasses are:<br />
Subclass (PSC2) Risk <strong>of</strong> Mortality<br />
1 Minor (includes non CC)<br />
2 Moderate<br />
3 Major<br />
4 Extreme<br />
<strong>The</strong> risk <strong>of</strong> mortality subclass is used in conjunction with the patient’s base APR-DRG for<br />
evaluating patient mortality. Like the severity <strong>of</strong> illness subclass, a patient’s risk <strong>of</strong> mortality<br />
subclass should not be used with their DRG because several DRGs may form one APR-<br />
DRG. <strong>The</strong>refore, since risk <strong>of</strong> mortality subclasses correspond to the APR-DRG number<br />
and not the DRG, it is important to use the APR-DRG number to accurately interpret data.<br />
<strong>The</strong> process for assigning a patient a risk <strong>of</strong> mortality subclass is a three phase process and<br />
is summarized as follows:<br />
Phase I<br />
C Secondary diagnoses that are closely related to the principal diagnosis are<br />
eliminated from further analysis.<br />
C Remaining secondary diagnoses are assigned one <strong>of</strong> four distinct Risk <strong>of</strong> Mortality<br />
Levels.<br />
C <strong>The</strong> Risk <strong>of</strong> Mortality Level is modified for some secondary diagnosis based on the<br />
patients age and APR-DRG.
Phase II<br />
C All secondary diagnoses that are closely related to other secondary diagnoses are<br />
eliminated from further analysis, and the secondary diagnosis with the highest Risk<br />
<strong>of</strong> Mortality Level is retained. This prevents double counting clinically-similar<br />
diagnoses.<br />
C <strong>The</strong> Base Risk <strong>of</strong> Mortality Subclass <strong>of</strong> the patient is set to the highest Risk <strong>of</strong><br />
Mortality Level <strong>of</strong> any <strong>of</strong> the secondary diagnoses.<br />
C Patients with a Base Risk <strong>of</strong> Mortality Subclass <strong>of</strong> major (3) or extreme (4), will be<br />
reduced to the next lower subclass unless the patient has multiple secondary<br />
diagnoses with a high Risk <strong>of</strong> Mortality Level.<br />
Phase III<br />
C A minimum Risk <strong>of</strong> Mortality Subclass is established based on the patients principal<br />
diagnosis. This accounts for specific APR-DRGs that have a principal diagnosis<br />
indicative <strong>of</strong> a higher risk <strong>of</strong> mortality relative to the other principal diagnoses in the<br />
APR-DRG.<br />
C A minimum Risk <strong>of</strong> Mortality Subclass is established based on the presence <strong>of</strong><br />
certain combinations <strong>of</strong> secondary diagnoses.<br />
C <strong>The</strong> final patient Risk <strong>of</strong> Mortality Subclass is selected based on the maximum <strong>of</strong> the<br />
Phase II Base Risk <strong>of</strong> Mortality Subclass and the Phase III minimum Risk <strong>of</strong><br />
Mortality Subclass.
Appendix E<br />
Diagnosis-Related Group<br />
(DRG) Groupings by Specialty
Cancer<br />
<strong>2003</strong> Diagnosis-Related Group (DRG) Groupings by Specialty<br />
#10 NERVOUS SYSTEM NEOPLASMS W CC<br />
#11 NERVOUS SYSTEM NEOPLASMS W/O CC<br />
#64 EAR, NOSE, MOUTH & THROAT MALIGNANCY<br />
#82 RESPIRATORY NEOPLASMS<br />
#172 DIGESTIVE MALIGNANCY W CC<br />
#173 DIGESTIVE MALIGNANCY W/O CC<br />
#199 HEPATOBILIARY DIAGNOSTIC PROCEDURE FOR MALIGNANCY<br />
#203 MALIGNANCY OF HEPATOBILIARY SYSTEM OR PANCREAS<br />
#239 PATHOLOGICAL FRACTURES & MUSCULOSKELETAL & CONN TISS MALIGNANCY<br />
#257 TOTAL MASTECTOMY FOR MALIGNANCY W CC<br />
#258 TOTAL MASTECTOMY FOR MALIGNANCY W/O CC<br />
#259 SUBTOTAL MASTECTOMY FOR MALIGNANCY W CC<br />
#260 SUBTOTAL MASTECTOMY FOR MALIGNANCY W/O CC<br />
#274 MALIGNANT BREAST DISORDERS W CC<br />
#275 MALIGNANT BREAST DISORDERS W/O CC<br />
#318 KIDNEY & URINARY TRACT NEOPLASMS W CC<br />
#319 KIDNEY & URINARY TRACT NEOPLASMS W/O CC<br />
#338 TESTES PROCEDURES, FOR MALIGNANCY<br />
#344 OTHER MALE REPRODUCTIVE SYSTEM O.R. PROCEDURES FOR MALIGNANCY<br />
#346 MALIGNANCY, MALE REPRODUCTIVE SYSTEM, W CC<br />
#347 MALIGNANCY, MALE REPRODUCTIVE SYSTEM, W/O CC<br />
#354 UTERINE, ADNEXA PROC FOR NON-OVARIAN/ADNEXAL MALIG W CC<br />
#355 UTERINE, ADNEXA PROC FOR NON-OVARIAN/ADNEXAL MALIG W/O CC<br />
#357 UTERINE & ADNEXA PROC FOR OVARIAN OR ADNEXAL MALIGNANCY<br />
#366 MALIGNANCY, FEMALE REPRODUCTIVE SYSTEM W CC<br />
#367 MALIGNANCY, FEMALE REPRODUCTIVE SYSTEM W/O CC<br />
#400 LYMPHOMA & LEUKEMIA W MAJOR O.R. PROCEDURE<br />
#401 LYMPHOMA & NON-ACUTE LEUKEMIA W OTHER O.R. PROC W CC<br />
#402 LYMPHOMA & NON-ACUTE LEUKEMIA W OTHER O.R. PROC W/O CC<br />
#403 LYMPHOMA & NON-ACUTE LEUKEMIA W CC<br />
#404 LYMPHOMA & NON-ACUTE LEUKEMIA W/O CC<br />
#405 ACUTE LEUKEMIA W/O MAJOR O.R. PROCEDURE AGE 0-17<br />
#409 RADIOTHERAPY<br />
#410 CHEMOTHERAPY W/O ACUTE LEUKEMIA AS SECONDARY DIAGNOSIS<br />
#411 HISTORY OF MALIGNANCY W/O ENDOSCOPY<br />
#412 HISTORY OF MALIGNANCY W ENDOSCOPY<br />
#413 OTHER MYELOPROLIF DIS OR POORLY DIFF NEOPL DIAG W CC<br />
#414 OTHER MYELOPROLIF DIS OR POORLY DIFF NEOPL DIAG W/O CC<br />
#473 ACUTE LEUKEMIA W/O MAJOR O.R. PROCEDURE AGE >17<br />
#492 CHEMOTHERAPY W ACUTE LEUKEMIA AS SECONDARY DIAGNOSIS
Digestive Disorders<br />
#146 RECTAL RESECTION W CC<br />
#147 RECTAL RESECTION W/O CC<br />
#148 MAJOR SMALL & LARGE BOWEL PROCEDURES W CC<br />
#149 MAJOR SMALL & LARGE BOWEL PROCEDURES W/O CC<br />
#150 PERITONEAL ADHESIOLYSIS W CC<br />
#151 PERITONEAL ADHESIOLYSIS W/O CC<br />
#152 MINOR SMALL & LARGE BOWEL PROCEDURES W CC<br />
#153 MINOR SMALL & LARGE BOWEL PROCEDURES W/O CC<br />
#154 STOMACH, ESOPHAGEAL & DUODENAL PROCEDURES AGE >17 W CC<br />
#155 STOMACH, ESOPHAGEAL & DUODENAL PROCEDURES AGE >17 W/O CC<br />
#156 STOMACH, ESOPHAGEAL & DUODENAL PROCEDURES AGE 0-17<br />
#170 OTHER DIGESTIVE SYSTEM O.R. PROCEDURES W CC<br />
#171 OTHER DIGESTIVE SYSTEM O.R. PROCEDURES W/O CC<br />
#172 DIGESTIVE MALIGNANCY W CC<br />
#173 DIGESTIVE MALIGNANCY W/O CC<br />
#174 G.I. HEMORRHAGE W CC<br />
#175 G.I. HEMORRHAGE W/O CC<br />
#176 COMPLICATED PEPTIC ULCER<br />
#177 UNCOMPLICATED PEPTIC ULCER W CC<br />
#178 UNCOMPLICATED PEPTIC ULCER W/O CC<br />
#179 INFLAMMATORY BOWEL DISEASE<br />
#180 G.I. OBSTRUCTION W CC<br />
#181 G.I. OBSTRUCTION W/O CC<br />
#182 ESOPHAGITIS, GASTROENT & MISC DIGEST DISORDERS AGE >17 W CC<br />
#183 ESOPHAGITIS, GASTROENT & MISC DIGEST DISORDERS AGE >17 W/O CC<br />
#184 ESOPHAGITIS, GASTROENT & MISC DIGEST DISORDERS AGE 0-17<br />
#188 OTHER DIGESTIVE SYSTEM DIAGNOSES AGE >17 W CC<br />
#189 OTHER DIGESTIVE SYSTEM DIAGNOSES AGE >17 W/O CC<br />
#190 OTHER DIGESTIVE SYSTEM DIAGNOSES AGE 0-17<br />
#191 PANCREAS, LIVER & SHUNT PROCEDURES W CC<br />
#192 PANCREAS, LIVER & SHUNT PROCEDURES W/O CC<br />
#193 BILIARY TRACT PROC EXCEPT ONLY CHOLECYST W OR W/O C.D.E. W CC<br />
#194 BILIARY TRACT PROC EXCEPT ONLY CHOLECYST W OR W/O C.D.E. W/O CC<br />
#195 CHOLECYSTECTOMY W C.D.E. W CC<br />
#196 CHOLECYSTECTOMY W C.D.E. W/O CC<br />
#197 CHOLECYSTECTOMY EXCEPT BY LAPAROSCOPE W/O C.D.E. W CC<br />
#198 CHOLECYSTECTOMY EXCEPT BY LAPAROSCOPE W/O C.D.E. W/O CC<br />
#200 HEPATOBILIARY DIAGNOSTIC PROCEDURE FOR NON-MALIGNANCY<br />
#201 OTHER HEPATOBILIARY OR PANCREAS O.R. PROCEDURES<br />
#202 CIRRHOSIS & ALCOHOLIC HEPATITIS<br />
#203 MALIGNANCY OF HEPATOBILIARY SYSTEM OR PANCREAS<br />
#204 DISORDERS OF PANCREAS EXCEPT MALIGNANCY<br />
#205 DISORDERS OF LIVER EXCEPT MALIG,CIRR,ALC HEPA W CC
#206 DISORDERS OF LIVER EXCEPT MALIG,CIRR,ALC HEPA W/O CC<br />
#207 DISORDERS OF THE BILIARY TRACT W CC<br />
#208 DISORDERS OF THE BILIARY TRACT W/O CC<br />
#493 LAPAROSCOPIC CHOLECYSTECTOMY W/O C.D.E. W CC<br />
#494 LAPAROSCOPIC CHOLECYSTECTOMY W/O C.D.E. W/O CC<br />
Ear, Nose, and Throat<br />
#49 MAJOR HEAD & NECK PROCEDURES<br />
#50 SIALOADENECTOMY<br />
#51 SALIVARY GLAND PROCEDURES EXCEPT SIALOADENECTOMY<br />
#55 MISCELLANEOUS EAR, NOSE, MOUTH & THROAT PROCEDURES<br />
#57 T&A PROC, EXCEPT TONSILLECTOMY &/OR ADENOIDECTOMY ONLY, AGE >17<br />
#58 T&A PROC, EXCEPT TONSILLECTOMY &/OR ADENOIDECTOMY ONLY, AGE 0-17<br />
#59 TONSILLECTOMY &/OR ADENOIDECTOMY ONLY, AGE >17<br />
#61 MYRINGOTOMY W TUBE INSERTION AGE >17<br />
#62 MYRINGOTOMY W TUBE INSERTION AGE 0-17<br />
#63 OTHER EAR, NOSE, MOUTH & THROAT O.R. PROCEDURES<br />
#65 DYSEQUILIBRIUM<br />
#66 EPISTAXIS<br />
#67 EPIGLOTTITIS<br />
#68 OTITIS MEDIA & URI AGE >17 W CC<br />
#69 OTITIS MEDIA & URI AGE >17 W/O CC<br />
#70 OTITIS MEDIA & URI AGE 0-17<br />
#71 LARYNGOTRACHEITIS<br />
#72 NASAL TRAUMA & DEFORMITY<br />
#73 OTHER EAR, NOSE, MOUTH & THROAT DIAGNOSES AGE >17<br />
#74 OTHER EAR, NOSE, MOUTH & THROAT DIAGNOSES AGE 0-17<br />
Geriatrics<br />
ALL CASES
Gynecology<br />
#353 PELVIC EVISCERATION, RADICAL HYSTERECTOMY & RADICAL VULVECTOMY<br />
#354 UTERINE, ADNEXA PROC FOR NON-OVARIAN/ADNEXAL MALIG W CC<br />
#355 UTERINE, ADNEXA PROC FOR NON-OVARIAN/ADNEXAL MALIG W/O CC<br />
#356 FEMALE REPRODUCTIVE SYSTEM RECONSTRUCTIVE PROCEDURES<br />
#357 UTERINE & ADNEXA PROC FOR OVARIAN OR ADNEXAL MALIGNANCY<br />
#358 UTERINE & ADNEXA PROC FOR NON-MALIGNANCY W CC<br />
#359 UTERINE & ADNEXA PROC FOR NON-MALIGNANCY W/O CC<br />
#360 VAGINA, CERVIX & VULVA PROCEDURES<br />
#361 LAPAROSCOPY & INCISIONAL TUBAL INTERRUPTION<br />
#362 ENDOSCOPIC TUBAL INTERRUPTION<br />
#363 D&C, CONIZATION & RADIO-IMPLANT, FOR MALIGNANCY<br />
#364 D&C, CONIZATION EXCEPT FOR MALIGNANCY<br />
#365 OTHER FEMALE REPRODUCTIVE SYSTEM O.R. PROCEDURES<br />
#366 MALIGNANCY, FEMALE REPRODUCTIVE SYSTEM W CC<br />
#367 MALIGNANCY, FEMALE REPRODUCTIVE SYSTEM W/O CC<br />
#368 INFECTIONS, FEMALE REPRODUCTIVE SYSTEM<br />
#369 MENSTRUAL & OTHER FEMALE REPRODUCTIVE SYSTEM DISORDERS
Heart and Heart Surgery<br />
#75 MAJOR CHEST PROCEDURES<br />
#104 CARDIAC VALVE & OTHER MAJOR CARDIOTHORACIC PX W CARDIAC CATH<br />
#105 CARDIAC VALVE & OTHER MAJOR CARDIOTHORACIC PX W/O CARDIAC CATH<br />
#106 CORONARY BYPASS WITH PTCA<br />
#107 CORONARY BYPASS WITH CARDIAC CATH<br />
#108 OTHER CARDIOTHORACIC PROCEDURES<br />
#110 MAJOR CARDIOVASCULAR PROCEDURES W CC<br />
#111 MAJOR CARDIOVASCULAR PROCEDURES W/O CC<br />
#115 PRM CARD PACEM IMPL W AMI,HRT FAIL OR SHK,OR AICD LEAD OR GNRTR<br />
PROC<br />
#116 OTHER PERMANENT CARDIAC PACEMAKER IMPLANTATION<br />
#117 CARDIAC PACEMAKER REVISION EXCEPT DEVICE REPLACEMENT<br />
#118 CARDIAC PACEMAKER DEVICE REPLACEMENT<br />
#121 CIRCULATORY DISORDERS W AMI & MAJOR COMP, DISCHARGED ALIVE<br />
#122 CIRCULATORY DISORDERS W AMI W/O MAJOR COMP, DISCHARGED ALIVE<br />
#123 CIRCULATORY DISORDERS W AMI, EXPIRED<br />
#126 ACUTE & SUBACUTE ENDOCARDITIS<br />
#127 HEART FAILURE & SHOCK<br />
#132 ATHEROSCLEROSIS W CC<br />
#133 ATHEROSCLEROSIS W/O CC<br />
#134 HYPERTENSION<br />
#135 CARDIAC CONGENITAL & VALVULAR DISORDERS AGE >17 W CC<br />
#136 CARDIAC CONGENITAL & VALVULAR DISORDERS AGE >17 W/O CC<br />
#137 CARDIAC CONGENITAL & VALVULAR DISORDERS AGE 0-17<br />
#138 CARDIAC ARRHYTHMIA & CONDUCTION DISORDERS W CC<br />
#139 CARDIAC ARRHYTHMIA & CONDUCTION DISORDERS W/O CC<br />
#140 ANGINA PECTORIS<br />
#143 CHEST PAIN<br />
#144 OTHER CIRCULATORY SYSTEM DIAGNOSES W CC<br />
#145 OTHER CIRCULATORY SYSTEM DIAGNOSES W/O CC<br />
#514 CARDIAC DEFIBRILLATOR IMPLANT W CARDIAC CATH<br />
#515 CARDIAC DEFIBRILLATOR IMPLANT W/O CARDIAC CATH<br />
#516 PERCUTANEOUS CARDIOVASCULAR PROC W AMI<br />
#517 PERC CARDIO PROC W CORONARY ARTERY STENT W/O AMI<br />
#518 PERC CARDIO PROC W/O CORONARY ARTERY STENT OR AMI
Hormonal Disorders<br />
#286 ADRENAL & PITUITARY PROCEDURES<br />
#287 SKIN GRAFTS & WOUND DEBRID FOR ENDOC, NUTRIT & METAB DISORDERS<br />
#288 O.R. PROCEDURES FOR OBESITY<br />
#289 PARATHYROID PROCEDURES<br />
#290 THYROID PROCEDURES<br />
#292 OTHER ENDOCRINE, NUTRIT & METAB O.R. PROC W CC<br />
#293 OTHER ENDOCRINE, NUTRIT & METAB O.R. PROC W/O CC<br />
#294 DIABETES AGE >35<br />
#295 DIABETES AGE 0-35<br />
#296 NUTRITIONAL & MISC METABOLIC DISORDERS AGE >17 W CC<br />
#297 NUTRITIONAL & MISC METABOLIC DISORDERS AGE >17 W/O CC<br />
#298 NUTRITIONAL & MISC METABOLIC DISORDERS AGE 0-17<br />
#299 INBORN ERRORS OF METABOLISM<br />
#300 ENDOCRINE DISORDERS W CC<br />
#301 ENDOCRINE DISORDERS W/O CC<br />
Kidney Disease<br />
#316 RENAL FAILURE<br />
#317 ADMIT FOR RENAL DIALYSIS<br />
#320 KIDNEY & URINARY TRACT INFECTIONS AGE >17 W CC<br />
#321 KIDNEY & URINARY TRACT INFECTIONS AGE >17 W/O CC<br />
#322 KIDNEY & URINARY TRACT INFECTIONS AGE 0-17<br />
#325 KIDNEY & URINARY TRACT SIGNS & SYMPTOMS AGE >17 W CC<br />
#326 KIDNEY & URINARY TRACT SIGNS & SYMPTOMS AGE >17 W/O CC<br />
#327 KIDNEY & URINARY TRACT SIGNS & SYMPTOMS AGE 0-17<br />
#331 OTHER KIDNEY & URINARY TRACT DIAGNOSES AGE >17 W CC<br />
#332 OTHER KIDNEY & URINARY TRACT DIAGNOSES AGE >17 W/O CC<br />
#333 OTHER KIDNEY & URINARY TRACT DIAGNOSES AGE 0-17
Neurology and Neurosurgery<br />
#1 CRANIOTOMY AGE >17 EXCEPT FOR TRAUMA<br />
#2 CRANIOTOMY FOR TRAUMA AGE >17<br />
#3 CRANIOTOMY AGE 0-17<br />
#4 SPINAL PROCEDURES<br />
#5 EXTRACRANIAL VASCULAR PROCEDURES<br />
#6 CARPAL TUNNEL RELEASE<br />
#7 PERIPH & CRANIAL NERVE & OTHER NERV SYST PROC W CC<br />
#8 PERIPH & CRANIAL NERVE & OTHER NERV SYST PROC W/O CC<br />
#9 SPINAL DISORDERS & INJURIES<br />
#12 DEGENERATIVE NERVOUS SYSTEM DISORDERS<br />
#13 MULTIPLE SCLEROSIS & CEREBELLAR ATAXIA<br />
#14 SPECIFIC CEREBROVASCULAR DISORDERS EXCEPT TIA<br />
#15 TRANSIENT ISCHEMIC ATTACK & PRECEREBRAL OCCLUSIONS<br />
#16 NONSPECIFIC CEREBROVASCULAR DISORDERS W CC<br />
#17 NONSPECIFIC CEREBROVASCULAR DISORDERS W/O CC<br />
#18 CRANIAL & PERIPHERAL NERVE DISORDERS W CC<br />
#19 CRANIAL & PERIPHERAL NERVE DISORDERS W/O CC<br />
#20 NERVOUS SYSTEM INFECTION EXCEPT VIRAL MENINGITIS<br />
#21 VIRAL MENINGITIS<br />
#22 HYPERTENSIVE ENCEPHALOPATHY<br />
#23 NONTRAUMATIC STUPOR & COMA<br />
#24 SEIZURE & HEADACHE AGE >17 W CC<br />
#25 SEIZURE & HEADACHE AGE >17 W/O CC<br />
#26 SEIZURE & HEADACHE AGE 0-17<br />
#27 TRAUMATIC STUPOR & COMA, COMA >1 HR<br />
#28 TRAUMATIC STUPOR & COMA, COMA 17 W CC<br />
#29 TRAUMATIC STUPOR & COMA, COMA 17 W/O CC<br />
#30 TRAUMATIC STUPOR & COMA, COMA 17 W CC<br />
#32 CONCUSSION AGE >17 W/O CC<br />
#33 CONCUSSION AGE 0-17<br />
#34 OTHER DISORDERS OF NERVOUS SYSTEM W CC<br />
#35 OTHER DISORDERS OF NERVOUS SYSTEM W/O CC
Orthopedics<br />
#209 MAJOR JOINT & LIMB REATTACHMENT PROCEDURES OF LOWER EXTREMITY<br />
#210 HIP & FEMUR PROCEDURES EXCEPT MAJOR JOINT AGE >17 W CC<br />
#211 HIP & FEMUR PROCEDURES EXCEPT MAJOR JOINT AGE >17 W/O CC<br />
#212 HIP & FEMUR PROCEDURES EXCEPT MAJOR JOINT AGE 0-17<br />
#218 LOWER EXTREM & HUMER PROC EXCEPT HIP,FOOT,FEMUR AGE >17 W CC<br />
#219 LOWER EXTREM & HUMER PROC EXCEPT HIP,FOOT,FEMUR AGE >17 W/O CC<br />
#220 LOWER EXTREM & HUMER PROC EXCEPT HIP,FOOT,FEMUR AGE 0-17<br />
#223 MAJOR SHOULDER/ELBOW PROC, OR OTHER UPPER EXTREMITY PROC W CC<br />
#224 SHOULDER,ELBOW OR FOREARM PROC,EXC MAJOR JOINT PROC, W/O CC<br />
#225 FOOT PROCEDURES<br />
#226 SOFT TISSUE PROCEDURES W CC<br />
#227 SOFT TISSUE PROCEDURES W/O CC<br />
#228 MAJOR THUMB OR JOINT PROC,OR OTH HAND OR WRIST PROC W CC<br />
#229 HAND OR WRIST PROC, EXCEPT MAJOR JOINT PROC, W/O CC<br />
#230 LOCAL EXCISION & REMOVAL OF INT FIX DEVICES OF HIP & FEMUR<br />
#231 LOCAL EXCISION & REMOVAL OF INT FIX DEVICES EXCEPT HIP & FEMUR<br />
#232 ARTHROSCOPY<br />
#233 OTHER MUSCULOSKELET SYS & CONN TISS O.R. PROC W CC<br />
#234 OTHER MUSCULOSKELET SYS & CONN TISS O.R. PROC W/O CC<br />
#235 FRACTURES OF FEMUR<br />
#236 FRACTURES OF HIP & PELVIS<br />
#237 SPRAINS, STRAINS, & DISLOCATIONS OF HIP, PELVIS & THIGH<br />
#238 OSTEOMYELITIS<br />
#248 TENDONITIS, MYOSITIS & BURSITIS<br />
#250 FX, SPRN, STRN & DISL OF FOREARM, HAND, FOOT AGE >17 W CC<br />
#251 FX, SPRN, STRN & DISL OF FOREARM, HAND, FOOT AGE >17 W/O CC<br />
#252 FX, SPRN, STRN & DISL OF FOREARM, HAND, FOOT AGE 0-17<br />
#253 FX, SPRN, STRN & DISL OF UPARM,LOWLEG EX FOOT AGE >17 W CC<br />
#254 FX, SPRN, STRN & DISL OF UPARM,LOWLEG EX FOOT AGE >17 W/O CC<br />
#255 FX, SPRN, STRN & DISL OF UPARM, LOWLEG EX FOOT AGE 0-17<br />
#471 BILATERAL OR MULTIPLE MAJOR JOINT PROCS OF LOWER EXTREMITY<br />
#485 LIMB REATTACHMENT, HIP AND FEMUR PROC FOR MULTIPLE SIGNIFICANT TRAUM<br />
#491 MAJOR JOINT & LIMB REATTACHMENT PROCEDURES OF UPPER EXTREMITY<br />
#496 COMBINED ANTERIOR/POSTERIOR SPINAL FUSION<br />
#497 SPINAL FUSION EXCEPT CERVICAL W CC<br />
#498 SPINAL FUSION EXCEPT CERVICAL W/O CC<br />
#501 KNEE PROCEDURES W PDX OF INFECTION W CC<br />
#502 KNEE PROCEDURES W PDX OF INFECTION W/O CC<br />
#503 KNEE PROCEDURES W/O PDX OF INFECTION
Respiratory Disorders<br />
#76 OTHER RESP SYSTEM O.R. PROCEDURES W CC<br />
#77 OTHER RESP SYSTEM O.R. PROCEDURES W/O CC<br />
#78 PULMONARY EMBOLISM<br />
#79 RESPIRATORY INFECTIONS & INFLAMMATIONS AGE >17 W CC<br />
#80 RESPIRATORY INFECTIONS & INFLAMMATIONS AGE >17 W/O CC<br />
#81 RESPIRATORY INFECTIONS & INFLAMMATIONS AGE 0-17<br />
#85 PLEURAL EFFUSION W CC<br />
#86 PLEURAL EFFUSION W/O CC<br />
#87 PULMONARY EDEMA & RESPIRATORY FAILURE<br />
#88 CHRONIC OBSTRUCTIVE PULMONARY DISEASE<br />
#89 SIMPLE PNEUMONIA & PLEURISY AGE >17 W CC<br />
#90 SIMPLE PNEUMONIA & PLEURISY AGE >17 W/O CC<br />
#91 SIMPLE PNEUMONIA & PLEURISY AGE 0-17<br />
#92 INTERSTITIAL LUNG DISEASE W CC<br />
#93 INTERSTITIAL LUNG DISEASE W/O CC<br />
#94 PNEUMOTHORAX W CC<br />
#95 PNEUMOTHORAX W/O CC<br />
#96 BRONCHITIS & ASTHMA AGE >17 W CC<br />
#97 BRONCHITIS & ASTHMA AGE >17 W/O CC<br />
#98 BRONCHITIS & ASTHMA AGE 0-17<br />
#99 RESPIRATORY SIGNS & SYMPTOMS W CC<br />
#100 RESPIRATORY SIGNS & SYMPTOMS W/O CC<br />
#101 OTHER RESPIRATORY SYSTEM DIAGNOSES W CC<br />
#102 OTHER RESPIRATORY SYSTEM DIAGNOSES W/O CC<br />
#128 DEEP VEIN THROMBOPHLEBITIS<br />
#475 RESPIRATORY SYSTEM DIAGNOSIS WITH VENTILATOR SUPPORT<br />
Rheumatology<br />
#242 SEPTIC ARTHRITIS<br />
#244 BONE DISEASES & SPECIFIC ARTHROPATHIES W CC<br />
#245 BONE DISEASES & SPECIFIC ARTHROPATHIES W/O CC<br />
#246 NON-SPECIFIC ARTHROPATHIES<br />
#247 SIGNS & SYMPTOMS OF MUSCULOSKELETAL SYSTEM & CONN TISSUE<br />
#256 OTHER MUSCULOSKELETAL SYSTEM & CONNECTIVE TISSUE DIAGNOSES
Urology<br />
#302 KIDNEY TRANSPLANT<br />
#303 KIDNEY,URETER & MAJOR BLADDER PROCEDURES FOR NEOPLASM<br />
#304 KIDNEY,URETER & MAJOR BLADDER PROC FOR NON-NEOPL W CC<br />
#305 KIDNEY,URETER & MAJOR BLADDER PROC FOR NON-NEOPL W/O CC<br />
#306 PROSTATECTOMY W CC<br />
#307 PROSTATECTOMY W/O CC<br />
#308 MINOR BLADDER PROCEDURES W CC<br />
#309 MINOR BLADDER PROCEDURES W/O CC<br />
#310 TRANSURETHRAL PROCEDURES W CC<br />
#311 TRANSURETHRAL PROCEDURES W/O CC<br />
#312 URETHRAL PROCEDURES, AGE >17 W CC<br />
#313 URETHRAL PROCEDURES, AGE >17 W/O CC<br />
#314 URETHRAL PROCEDURES, AGE 0-17<br />
#315 OTHER KIDNEY & URINARY TRACT O.R. PROCEDURES<br />
#323 URINARY STONES W CC, &/OR ESW LITHOTRIPSY<br />
#324 URINARY STONES W/O CC<br />
#328 URETHRAL STRICTURE AGE >17 W CC<br />
#329 URETHRAL STRICTURE AGE >17 W/O CC<br />
#330 URETHRAL STRICTURE AGE 0-17<br />
#334 MAJOR MALE PELVIC PROCEDURES W CC<br />
#335 MAJOR MALE PELVIC PROCEDURES W/O CC<br />
#336 TRANSURETHRAL PROSTATECTOMY W CC<br />
#337 TRANSURETHRAL PROSTATECTOMY W/O CC<br />
#339 TESTES PROCEDURES, NON-MALIGNANCY AGE >17<br />
#340 TESTES PROCEDURES, NON-MALIGNANCY AGE 0-17<br />
#341 PENIS PROCEDURES<br />
#342 CIRCUMCISION AGE >17<br />
#343 CIRCUMCISION AGE 0-17<br />
#348 BENIGN PROSTATIC HYPERTROPHY W CC<br />
#349 BENIGN PROSTATIC HYPERTROPHY W/O CC<br />
#350 INFLAMMATION OF THE MALE REPRODUCTIVE SYSTEM<br />
#351 STERILIZATION, MALE<br />
#352 OTHER MALE REPRODUCTIVE SYSTEM DIAGNOSES
Appendix F<br />
<strong>Index</strong> <strong>of</strong> <strong>Hospital</strong> <strong>Quality</strong> (IHQ)<br />
Scores by Specialty
<strong>2003</strong> Cancer Best <strong>Hospital</strong> List<br />
Technology NCI Hospice,<br />
U.S. News Reputational Mortality R.N.'s score cancer palliative<br />
Rank <strong>Hospital</strong> <strong>Index</strong> score rate Discharges to beds (<strong>of</strong> 7) center care<br />
1 University <strong>of</strong> Texas, M. D. Anderson Cancer Center, Houston 100.0 74.6 0.77 4924 2.97 6.0 Yes P<br />
2 Memorial Sloan-Kettering Cancer Center, New York 97.2 71.9 0.73 5275 2.32 6.0 Yes<br />
3 Johns Hopkins <strong>Hospital</strong>, Baltimore 70.9 38.6 0.52 1712 1.76 7.0 Yes H, P<br />
4 Dana-Farber Cancer Institute, Boston 68.6 45.4 0.89 237 3.07 6.0 Yes P<br />
5 Mayo Clinic, Rochester, Minn. 62.6 30.5 0.58 4308 1.51 7.0 Yes H, P<br />
6 University <strong>of</strong> Chicago <strong>Hospital</strong>s 43.0 9.9 0.69 1686 1.86 7.0 Yes H, P (+3 SD)<br />
7 Duke University Medical Center, Durham, N.C. 42.4 10.9 0.81 3082 2.55 7.0 Yes H, P<br />
8 UCLA Medical Center, Los Angeles 41.6 8.6 0.69 1245 1.94 7.0 Yes H, P<br />
9 University <strong>of</strong> Michigan Medical Center, Ann Arbor 41.0 6.6 0.48 1578 1.87 7.0 Yes P<br />
10 Vanderbilt University Medical Center, Nashville 38.2 6.8 0.71 1004 2.24 7.0 Yes P<br />
11 H. Lee M<strong>of</strong>fitt Cancer Center & Research Institute, Tampa 37.8 3.2 0.57 1456 2.52 6.0 Yes H, P<br />
12 University <strong>of</strong> Pittsburgh Medical Center 37.4 2.8 0.50 1890 1.52 6.5 Yes H, P<br />
13 Fox Chase Cancer Center, Philadelphia 37.2 7.0 0.77 924 2.01 5.0 Yes H, P<br />
14 University <strong>Hospital</strong>s <strong>of</strong> Cleveland 37.1 1.4 0.53 1623 1.84 7.0 Yes H, P<br />
15 University <strong>of</strong> Washington Medical Center, Seattle 36.5 8.8 0.54 886 1.38 6.0 No H<br />
16 <strong>Hospital</strong> <strong>of</strong> the University <strong>of</strong> Pennsylvania, Philadelphia 36.4 7.0 0.90 1614 1.79 6.0 Yes H<br />
17 University <strong>of</strong> California, San Francisco Medical Center 36.3 6.5 0.79 746 2.02 7.0 Yes P (+2 SD)<br />
18 Stanford <strong>Hospital</strong> and Clinics, Stanford, Calif. 35.5 13.1 0.90 938 1.56 4.0 No H<br />
19 Clarian Health Partners (IU and Methodist <strong>Hospital</strong>s), Indianapolis 35.5 5.4 0.82 2139 0.94 7.0 Yes H, P<br />
20 University <strong>of</strong> Wisconsin <strong>Hospital</strong> and Clinics, Madison 35.4 3.4 0.58 1106 1.05 7.0 Yes H<br />
21 North Carolina Baptist <strong>Hospital</strong>, Winston-Salem 35.2 2.5 0.74 1831 1.68 7.0 Yes H, P<br />
22 Barnes-Jewish <strong>Hospital</strong>, St. Louis 35.0 2.3 0.70 2566 1.46 6.5 Yes H, P<br />
23 University <strong>of</strong> Virginia Medical Center, Charlottesville 34.8 0.0 0.61 1297 2.25 7.0 Yes H, P<br />
24 University <strong>of</strong> North Carolina <strong>Hospital</strong>s, Chapel Hill 34.6 0.6 0.64 1370 1.64 7.0 Yes H, P<br />
25 Arthur G. James Cancer <strong>Hospital</strong>, Columbus, Ohio 34.3 0.6 0.57 2180 1.53 6.5 Yes P<br />
26 Massachusetts General <strong>Hospital</strong>, Boston 33.8 8.9 1.04 2090 1.82 7.0 No H, P<br />
27 Fairview-University Medical Center, Minneapolis 33.6 2.0 0.63 1226 0.50 7.0 Yes H, P<br />
28 University <strong>of</strong> Alabama <strong>Hospital</strong> at Birmingham 33.4 1.0 0.75 1640 1.45 7.0 Yes H, P<br />
29 Yale-New Haven <strong>Hospital</strong>, New Haven, Conn. 33.2 0.0 0.59 1191 1.43 7.0 Yes H<br />
30 Dartmouth-Hitchcock Medical Center, Lebanon, N.H. 33.2 0.4 0.70 1189 1.88 6.0 Yes H, P<br />
31 New York-Presbyterian <strong>Hospital</strong> 32.9 6.1 1.16 3774 1.41 7.0 Yes H, P<br />
32 Northwestern Memorial <strong>Hospital</strong>, Chicago 32.8 3.1 0.97 2228 1.87 6.0 Yes H, P<br />
33 Roswell Park Cancer Institute, Buffalo 32.7 4.6 1.04 1188 2.34 5.5 Yes H, P<br />
34 Thomas Jefferson University <strong>Hospital</strong>, Philadelphia 32.5 1.2 0.80 1847 1.62 5.5 Yes H, P<br />
35 University <strong>of</strong> Colorado <strong>Hospital</strong>, Denver 32.4 0.4 0.45 487 2.25 6.0 Yes P<br />
36 University <strong>of</strong> Iowa <strong>Hospital</strong>s and Clinics, Iowa City 32.2 1.0 0.80 1222 1.35 7.0 Yes H, P<br />
37 Harper University <strong>Hospital</strong>, Detroit 32.2 0.0 0.64 1563 0.89 6.0 Yes H, P<br />
38 Nebraska Health System, Omaha 32.0 2.6 0.89 900 1.56 7.0 Yes H, P<br />
39 Oregon Health & Science University <strong>Hospital</strong>, Portland 31.5 0.5 0.75 668 2.14 6.5 Yes H, P<br />
40 University <strong>of</strong> California, Davis Medical Center, Sacramento 31.3 0.5 0.82 798 2.97 7.0 Yes H, P<br />
41 UCSD Medical Center, San Diego 31.2 0.0 0.58 572 1.73 5.0 Yes H<br />
42 City <strong>of</strong> Hope National Medical Center, Duarte, Calif. 31.1 2.5 0.88 897 1.37 6.0 Yes H, P<br />
43 University <strong>of</strong> Utah <strong>Hospital</strong>s and Clinics, Salt Lake City 31.1 0.0 0.54 714 1.41 6.0 Yes<br />
44 Summa Health System, Akron, Ohio 31.0 0.0 0.53 1114 2.21 6.5 No H, P<br />
45 Shands at the University <strong>of</strong> Florida, Gainesville 30.9 1.0 0.62 1496 1.62 6.0 No H, P<br />
46 Cleveland Clinic 30.8 2.7 0.83 2279 2.12 7.0 No H, P<br />
47 Georgetown University <strong>Hospital</strong>, Washington, D.C. 30.8 0.6 0.77 580 1.51 7.0 Yes H, P<br />
48 Henry Ford <strong>Hospital</strong>, Detroit 30.5 0.5 0.66 1455 1.79 6.5 No H, P<br />
49 University Medical Center, Tucson, Ariz. 30.5 1.2 0.69 452 1.78 6.0 Yes<br />
50 Baylor University Medical Center, Dallas 30.4 2.5 0.77 1901 1.62 6.0 No H, P
<strong>2003</strong> Digestive Disorders Best <strong>Hospital</strong> List<br />
Technology<br />
U.S. News Reputational Mortality R.N.'s score Trauma<br />
Rank <strong>Hospital</strong> <strong>Index</strong> score rate Discharges to beds (<strong>of</strong> 8) Center<br />
1 Mayo Clinic, Rochester, Minn. 100.0 61.6 0.75 8381 1.51 8.0 No<br />
2 Cleveland Clinic 73.4 38.1 0.72 4760 2.12 8.0 No<br />
3 Johns Hopkins <strong>Hospital</strong>, Baltimore 72.2 35.9 0.73 3638 1.76 7.5 Yes<br />
4 Massachusetts General <strong>Hospital</strong>, Boston 62.1 28.6 0.87 4722 1.82 8.0 Yes<br />
5 Mount Sinai Medical Center, New York 51.9 22.1 1.09 6508 1.68 8.0 Yes<br />
6 University <strong>of</strong> Chicago <strong>Hospital</strong>s 49.7 18.6 0.86 2241 1.86 8.0 Yes<br />
7 UCLA Medical Center, Los Angeles 45.1 15.7 0.99 2496 1.94 8.0 Yes<br />
8 Duke University Medical Center, Durham, N.C. 44.8 14.2 0.92 4234 2.55 8.0 Yes<br />
9 University <strong>of</strong> California, San Francisco Medical Center 44.5 14.9 0.75 1875 2.02 8.0 No<br />
10 Brigham and Women's <strong>Hospital</strong>, Boston 38.2 7.7 0.77 2773 1.64 7.5 Yes (+3 SD)<br />
11 Barnes-Jewish <strong>Hospital</strong>, St. Louis 37.5 7.3 0.81 6106 1.46 8.0 Yes<br />
12 <strong>Hospital</strong> <strong>of</strong> the University <strong>of</strong> Pennsylvania, Philadelphia 36.6 10.7 1.20 2245 1.79 8.0 Yes<br />
13 University <strong>of</strong> Michigan Medical Center, Ann Arbor 36.0 4.9 0.74 3128 1.87 8.0 Yes<br />
14 Medical University <strong>of</strong> South Carolina, Charleston 35.9 9.8 1.15 2838 1.84 6.0 Yes<br />
15 Beth Israel Deaconess Medical Center, Boston 34.8 4.1 0.72 4108 2.23 7.0 Yes<br />
16 University <strong>of</strong> Pittsburgh Medical Center 34.7 5.0 0.83 4318 1.52 8.0 Yes<br />
17 Shands at the University <strong>of</strong> Florida, Gainesville 34.2 4.7 0.82 3662 1.62 7.0 Yes<br />
18 University <strong>of</strong> North Carolina <strong>Hospital</strong>s, Chapel Hill 34.1 3.9 0.78 3115 1.64 7.5 Yes<br />
19 Clarian Health Partners (IU and Methodist <strong>Hospital</strong>s), Indianapolis 33.5 8.0 1.01 5902 0.94 8.0 No (+2 SD)<br />
20 Yale-New Haven <strong>Hospital</strong>, New Haven, Conn. 32.5 2.9 0.74 2543 1.43 8.0 Yes<br />
21 University <strong>of</strong> Washington Medical Center, Seattle 32.3 5.1 0.72 1478 1.38 8.0 No<br />
22 Baylor University Medical Center, Dallas 32.3 2.8 0.83 4949 1.62 8.0 Yes<br />
23 Northwestern Memorial <strong>Hospital</strong>, Chicago 31.8 3.8 0.99 3483 1.87 8.0 Yes<br />
24 Summa Health System, Akron, Ohio 31.7 0.0 0.62 3995 2.21 8.0 Yes<br />
25 Cedars-Sinai Medical Center, Los Angeles 31.5 3.3 0.94 4983 1.54 8.0 Yes<br />
26 University <strong>of</strong> Wisconsin <strong>Hospital</strong> and Clinics, Madison 31.5 1.0 0.55 2299 1.05 8.0 Yes<br />
27 St. Louis University <strong>Hospital</strong> 31.3 2.0 0.67 1937 1.41 7.5 Yes<br />
28 F.G. McGaw <strong>Hospital</strong> at Loyola University, Maywood, Ill. 31.0 1.9 0.84 2799 1.72 8.0 Yes<br />
29 University <strong>of</strong> Virginia Medical Center, Charlottesville 31.0 1.4 0.81 3078 2.25 8.0 Yes<br />
30 William Beaumont <strong>Hospital</strong>, Royal Oak, Mich. 31.0 0.9 0.77 6260 1.75 8.0 Yes<br />
31 Memorial Sloan-Kettering Cancer Center, New York 30.9 1.7 0.68 3409 2.32 7.0 No<br />
32 University <strong>of</strong> Miami, Jackson Memorial <strong>Hospital</strong> 30.8 4.2 0.82 1849 1.53 8.0 No<br />
33 University <strong>Hospital</strong>s <strong>of</strong> Cleveland 30.7 0.5 0.75 3214 1.84 8.0 Yes<br />
34 Advocate Lutheran General <strong>Hospital</strong>, Park Ridge, Ill. 30.5 0.0 0.49 3429 0.94 6.5 Yes<br />
35 New York-Presbyterian <strong>Hospital</strong> 30.5 6.8 1.36 6339 1.41 8.0 Yes<br />
36 Parkland Memorial <strong>Hospital</strong>, Dallas 30.5 4.0 0.93 1010 1.72 8.0 Yes<br />
37 Lahey Clinic, Burlington, Mass. 30.3 0.9 0.72 2819 1.46 7.0 Yes<br />
38 Thomas Jefferson University <strong>Hospital</strong>, Philadelphia 30.3 0.4 0.73 3524 1.62 7.0 Yes<br />
39 Good Samaritan Regional Medical Center, Phoenix 30.2 0.0 0.54 2145 1.14 7.5 Yes<br />
40 Henry Ford <strong>Hospital</strong>, Detroit 30.1 0.5 0.79 3663 1.79 7.5 Yes<br />
41 St. Joseph's <strong>Hospital</strong>, Tampa 30.0 0.0 0.65 3019 1.31 7.0 Yes<br />
42 Tufts-New England Medical Center, Boston 29.8 2.0 0.77 1257 2.44 7.0 Yes<br />
43 Mayo Clinic, Jacksonville, Fla. 29.7 1.9 0.72 2287 1.75 7.0 No<br />
44 Allegheny General <strong>Hospital</strong>, Pittsburgh 29.5 0.4 0.77 2476 2.00 7.5 Yes<br />
45 Abbott Northwestern <strong>Hospital</strong>, Minneapolis 29.4 0.0 0.74 3924 1.24 8.0 Yes<br />
46 Meridia Hillcrest <strong>Hospital</strong>, Cleveland 29.4 0.0 0.68 2582 1.26 7.5 Yes<br />
47 Temple University <strong>Hospital</strong>, Philadelphia 29.3 1.3 0.82 1689 1.73 8.0 Yes<br />
48 Florida <strong>Hospital</strong>, Orlando 29.3 0.0 0.66 7255 1.65 8.0 No<br />
49 Memorial <strong>Hospital</strong> West, Pembroke Pines, Fla. 29.3 0.0 0.55 850 1.97 6.5 Yes<br />
50 Christ <strong>Hospital</strong>, Cincinnati 29.3 0.0 0.60 2199 1.07 7.0 Yes
<strong>2003</strong> Ear, Nose, and Throat Best <strong>Hospital</strong> List<br />
<strong>Hospital</strong>wide Technology<br />
U.S. News Reputational mortality R.N.'s score Trauma<br />
Rank <strong>Hospital</strong> <strong>Index</strong> score rate Discharges to beds (<strong>of</strong> 5) Center<br />
1 Johns Hopkins <strong>Hospital</strong>, Baltimore 100.0 52.1 0.74 285 1.76 5.0 Yes<br />
2 Massachusetts Eye and Ear Infirmary, Boston 72.8 32.1 0.12 309 2.02 3.0 Yes<br />
3 University <strong>of</strong> Iowa <strong>Hospital</strong>s and Clinics, Iowa City 70.0 31.3 0.85 247 1.35 5.0 Yes<br />
4 Mayo Clinic, Rochester, Minn. 60.6 24.6 0.79 668 1.51 5.0 No<br />
5 University <strong>of</strong> Michigan Medical Center, Ann Arbor 55.7 18.5 0.74 297 1.87 5.0 Yes<br />
6 UCLA Medical Center, Los Angeles 50.8 16.6 0.89 349 1.94 5.0 Yes<br />
7 University <strong>of</strong> Pittsburgh Medical Center 50.4 16.7 0.88 343 1.52 5.0 Yes<br />
8 <strong>Hospital</strong> <strong>of</strong> the University <strong>of</strong> Pennsylvania, Philadelphia 47.5 15.6 1.01 281 1.79 5.0 Yes<br />
9 Cleveland Clinic 47.3 13.3 0.67 232 2.12 5.0 No<br />
10 University <strong>of</strong> Texas, M. D. Anderson Cancer Center, Houston 47.0 19.1 1.11 128 2.97 5.0 No<br />
11 Barnes-Jewish <strong>Hospital</strong>, St. Louis 43.8 11.3 0.84 421 1.46 5.0 Yes<br />
12 Vanderbilt University Medical Center, Nashville 43.0 11.5 0.95 279 2.24 5.0 Yes<br />
13 Stanford <strong>Hospital</strong> and Clinics, Stanford, Calif. 42.7 14.3 0.89 162 1.56 3.0 No<br />
14 University <strong>of</strong> Washington Medical Center, Seattle 41.5 11.1 0.72 120 1.38 5.0 No<br />
15 University <strong>of</strong> California, San Francisco Medical Center 40.8 10.9 0.83 157 2.02 5.0 No (+3 SD)<br />
16 Mount Sinai Medical Center, New York 37.5 9.6 1.13 458 1.68 5.0 Yes<br />
17 University <strong>of</strong> Virginia Medical Center, Charlottesville 35.9 5.9 0.88 198 2.25 5.0 Yes<br />
18 Memorial Sloan-Kettering Cancer Center, New York 35.7 6.1 0.84 283 2.32 5.0 No<br />
19 Shands at the University <strong>of</strong> Florida, Gainesville 34.9 4.2 0.79 255 1.62 4.0 Yes<br />
20 University <strong>Hospital</strong>, Cincinnati 34.8 5.2 0.80 172 1.16 5.0 Yes<br />
21 Duke University Medical Center, Durham, N.C. 33.8 5.2 0.92 161 2.55 5.0 Yes<br />
22 Methodist <strong>Hospital</strong>, Houston 33.7 6.0 0.88 215 1.33 5.0 No (+2 SD)<br />
23 Northwestern Memorial <strong>Hospital</strong>, Chicago 32.9 3.5 0.92 262 1.87 5.0 Yes<br />
24 University <strong>of</strong> California, Davis Medical Center, Sacramento 32.7 3.6 0.85 157 2.97 5.0 Yes<br />
25 University <strong>of</strong> Wisconsin <strong>Hospital</strong> and Clinics, Madison 32.4 2.0 0.68 207 1.05 5.0 Yes<br />
26 Parkland Memorial <strong>Hospital</strong>, Dallas 32.1 4.5 0.87 59 1.72 5.0 Yes<br />
27 Ohio State University Medical Center, Columbus 32.0 4.3 0.74 102 0.98 3.5 Yes<br />
28 F.G. McGaw <strong>Hospital</strong> at Loyola University, Maywood, Ill. 32.0 1.7 0.79 217 1.72 5.0 Yes<br />
29 Fairview-University Medical Center, Minneapolis 31.9 3.3 0.68 376 0.50 5.0 No<br />
30 University <strong>of</strong> Miami, Jackson Memorial <strong>Hospital</strong> 31.8 3.4 0.82 226 1.53 5.0 No<br />
31 University <strong>of</strong> Chicago <strong>Hospital</strong>s 31.7 2.7 0.80 111 1.86 5.0 Yes<br />
32 Summa Health System, Akron, Ohio 31.7 0.0 0.62 239 2.21 5.0 Yes<br />
33 North Carolina Baptist <strong>Hospital</strong>, Winston-Salem 31.5 3.6 0.95 191 1.68 5.0 Yes<br />
34 University <strong>Hospital</strong>s <strong>of</strong> Cleveland 31.4 0.6 0.67 171 1.84 5.0 Yes<br />
35 Henry Ford <strong>Hospital</strong>, Detroit 31.4 0.3 0.71 230 1.79 4.5 Yes<br />
36 Thomas Jefferson University <strong>Hospital</strong>, Philadelphia 31.3 2.3 0.85 258 1.62 4.0 Yes<br />
37 University <strong>of</strong> North Carolina <strong>Hospital</strong>s, Chapel Hill 31.2 2.9 0.90 183 1.64 5.0 Yes<br />
38 University <strong>of</strong> Alabama <strong>Hospital</strong> at Birmingham 30.9 3.0 0.97 314 1.45 5.0 Yes<br />
39 Abbott Northwestern <strong>Hospital</strong>, Minneapolis 30.7 0.0 0.66 374 1.24 5.0 Yes<br />
40 Yale-New Haven <strong>Hospital</strong>, New Haven, Conn. 30.4 1.1 0.83 262 1.43 5.0 Yes<br />
41 William Beaumont <strong>Hospital</strong>, Royal Oak, Mich. 30.4 0.0 0.77 292 1.75 5.0 Yes<br />
42 Lahey Clinic, Burlington, Mass. 30.2 1.1 0.58 142 1.46 4.0 Yes<br />
43 University <strong>of</strong> Illinois Medical Center at Chicago 29.9 3.3 0.83 112 1.72 2.5 Yes<br />
44 Akron General Medical Center, Akron, Ohio 29.8 0.0 0.73 199 1.34 5.0 Yes<br />
45 New York Eye and Ear Infirmary, New York 29.5 1.6 0.00 44 2.47 3.5 Yes<br />
46 University <strong>of</strong> Colorado <strong>Hospital</strong>, Denver 29.5 0.4 0.65 68 2.25 5.0 Yes<br />
47 Advocate Lutheran General <strong>Hospital</strong>, Park Ridge, Ill. 29.4 0.0 0.62 242 0.94 4.0 Yes<br />
48 Rush-Presbyterian-St. Luke's Medical Center, Chicago 29.3 1.4 0.67 161 1.18 5.0 No<br />
49 <strong>Hospital</strong> <strong>of</strong> St. Raphael, New Haven, Conn. 29.3 0.0 0.72 250 0.88 4.5 Yes<br />
50 Beth Israel Deaconess Medical Center, Boston 29.3 0.3 0.80 210 2.23 4.0 Yes
<strong>2003</strong> Geriatrics Best <strong>Hospital</strong> List<br />
<strong>Hospital</strong>wide Technology Discharge Service Geriatric Hospice,<br />
U.S. News Reputational mortality R.N.'s score planning mix services palliative<br />
Rank <strong>Hospital</strong> <strong>Index</strong> score rate to beds (<strong>of</strong> 8) (<strong>of</strong> 3) (<strong>of</strong> 9) (<strong>of</strong> 7) care<br />
1 UCLA Medical Center, Los Angeles 100.0 51.4 0.89 1.94 8.0 3 5 3 H, P<br />
2 Johns Hopkins <strong>Hospital</strong>, Baltimore 87.9 40.7 0.74 1.76 8.0 3 7 4 H, P<br />
3 Mount Sinai Medical Center, New York 71.7 34.1 1.13 1.68 8.0 3 8 2 H, P<br />
4 Massachusetts General <strong>Hospital</strong>, Boston 57.7 21.2 0.88 1.82 8.0 3 8 4 H, P<br />
5 Duke University Medical Center, Durham, N.C. 54.5 20.1 0.92 2.55 8.0 3 7 3 H, P<br />
6 Mayo Clinic, Rochester, Minn. 47.6 12.7 0.79 1.51 8.0 3 9 5 H, P<br />
7 Yale-New Haven <strong>Hospital</strong>, New Haven, Conn. 47.0 14.5 0.83 1.43 8.0 3 7 3 H<br />
8 University <strong>of</strong> Michigan Medical Center, Ann Arbor 41.1 8.8 0.74 1.87 8.0 3 8 4 P<br />
9 St. Louis University <strong>Hospital</strong> 39.6 8.6 0.73 1.41 8.0 3 6 3 H<br />
10 Cleveland Clinic 39.4 6.9 0.67 2.12 8.0 3 8 3 H, P (+3 SD)<br />
11 University <strong>of</strong> Washington Medical Center, Seattle 37.5 7.8 0.72 1.38 8.0 2 6 3 H<br />
12 University <strong>of</strong> Chicago <strong>Hospital</strong>s 37.1 5.8 0.80 1.86 8.0 3 8 5 H, P<br />
13 Barnes-Jewish <strong>Hospital</strong>, St. Louis 36.9 7.3 0.84 1.46 8.0 3 5 4 H, P<br />
14 University <strong>Hospital</strong>s <strong>of</strong> Cleveland 34.9 3.0 0.67 1.84 8.0 3 8 5 H, P<br />
15 University <strong>of</strong> California, San Francisco Medical Center 34.2 5.6 0.83 2.02 8.0 3 6 4 P<br />
16 New York-Presbyterian <strong>Hospital</strong> 33.7 7.6 1.17 1.41 8.0 3 9 4 H, P<br />
17 Rush-Presbyterian-St. Luke's Medical Center, Chicago 33.6 2.7 0.67 1.18 8.0 3 8 5 H<br />
18 <strong>Hospital</strong> <strong>of</strong> the University <strong>of</strong> Pennsylvania, Philadelphia 33.5 6.8 1.01 1.79 8.0 3 8 3 H<br />
19 Beth Israel Deaconess Medical Center, Boston 33.3 4.6 0.80 2.23 7.0 3 7 3 H, P<br />
20 University <strong>of</strong> Pittsburgh Medical Center 32.5 3.0 0.88 1.52 8.0 3 7 7 H, P<br />
21 NYU Medical Center, New York 32.5 6.6 1.01 1.18 7.5 3 7 2 H, P (+2 SD)<br />
22 Summa Health System, Akron, Ohio 32.0 1.0 0.62 2.21 8.0 3 9 3 H, P<br />
23 University <strong>of</strong> Wisconsin <strong>Hospital</strong> and Clinics, Madison 31.5 1.9 0.68 1.05 8.0 3 8 4 H<br />
24 North Carolina Baptist <strong>Hospital</strong>, Winston-Salem 30.6 3.3 0.95 1.68 8.0 3 8 4 H, P<br />
25 University <strong>of</strong> Miami, Jackson Memorial <strong>Hospital</strong> 30.3 1.5 0.82 1.53 8.0 3 9 4 H, P<br />
26 Brigham and Women's <strong>Hospital</strong>, Boston 30.2 1.5 0.76 1.64 7.5 3 7 4 H, P<br />
27 University <strong>of</strong> Colorado <strong>Hospital</strong>, Denver 30.1 1.9 0.65 2.25 7.0 3 5 3 P<br />
28 Stanford <strong>Hospital</strong> and Clinics, Stanford, Calif. 30.1 4.8 0.89 1.56 6.0 3 6 2 H<br />
29 University <strong>of</strong> Alabama <strong>Hospital</strong> at Birmingham 30.1 2.9 0.97 1.45 8.0 3 9 4 H, P<br />
30 Fairview-University Medical Center, Minneapolis 29.9 0.5 0.68 0.50 7.0 3 9 5 H, P<br />
31 Northwestern Memorial <strong>Hospital</strong>, Chicago 29.8 2.5 0.92 1.87 8.0 3 8 4 H, P<br />
32 Thomas Jefferson University <strong>Hospital</strong>, Philadelphia 29.6 2.0 0.85 1.62 7.0 3 8 4 H, P<br />
33 Christ <strong>Hospital</strong>, Cincinnati 29.4 0.0 0.52 1.07 7.5 3 6 3 H, P<br />
34 Scripps Mercy <strong>Hospital</strong>, San Diego 29.3 0.0 0.68 0.88 7.0 3 8 5 H, P<br />
35 Methodist <strong>Hospital</strong>, Houston 29.2 1.9 0.88 1.33 8.0 3 9 3 H, P<br />
36 University <strong>Hospital</strong> <strong>of</strong> Arkansas, Little Rock 29.1 4.0 0.88 2.55 7.0 3 5 3<br />
37 Boston Medical Center 29.1 3.7 0.97 1.30 6.0 3 7 5 P<br />
38 F.G. McGaw <strong>Hospital</strong> at Loyola University, Maywood, Ill. 29.1 1.4 0.79 1.72 8.0 3 8 3 H<br />
39 Advocate Lutheran General <strong>Hospital</strong>, Park Ridge, Ill. 29.1 0.0 0.62 0.94 7.0 3 8 3 H, P<br />
40 Lahey Clinic, Burlington, Mass. 29.0 0.0 0.58 1.46 7.0 3 7 4<br />
41 Emory University <strong>Hospital</strong>, Atlanta 29.0 4.0 0.91 1.43 8.0 3 6 1 P<br />
42 Strong Memorial <strong>Hospital</strong>-University <strong>of</strong> Rochester, N.Y. 29.0 2.9 1.02 2.01 7.5 3 9 4 H, P<br />
43 Ingalls <strong>Hospital</strong>, Harvey, Ill. 28.9 0.0 0.64 0.67 8.0 3 9 2 H, P<br />
44 Miami Valley <strong>Hospital</strong>, Dayton, Ohio 28.8 0.5 0.69 1.02 8.0 3 7 4 P<br />
45 Shands at the University <strong>of</strong> Florida, Gainesville 28.8 1.5 0.79 1.62 7.0 3 8 2 H, P<br />
46 William Beaumont <strong>Hospital</strong>, Royal Oak, Mich. 28.8 0.5 0.77 1.75 8.0 3 7 4 H, P<br />
47 Pennsylvania <strong>Hospital</strong>, Philadelphia 28.5 0.5 0.72 0.98 7.0 3 7 4 H, P<br />
48 University <strong>of</strong> North Carolina <strong>Hospital</strong>s, Chapel Hill 28.5 1.5 0.90 1.64 8.0 3 9 3 H, P<br />
49 Akron General Medical Center, Akron, Ohio 28.4 0.0 0.73 1.34 8.0 3 8 3 H, P<br />
50 Henry Ford <strong>Hospital</strong>, Detroit 28.4 0.0 0.71 1.79 7.5 3 6 4 H, P
<strong>2003</strong> Gynecology Best <strong>Hospital</strong> List<br />
<strong>Hospital</strong>wide Technology Gynecology<br />
U.S. News Reputational mortality R.N.'s score Trauma services<br />
Rank <strong>Hospital</strong> <strong>Index</strong> score rate Discharges to beds (<strong>of</strong> 8) Center (<strong>of</strong> 4)<br />
1 Johns Hopkins <strong>Hospital</strong>, Baltimore 100.0 34.3 0.74 336 1.76 8.0 Yes 4<br />
2 Mayo Clinic, Rochester, Minn. 87.5 29.7 0.79 1480 1.51 8.0 No 3<br />
3 Brigham and Women's <strong>Hospital</strong>, Boston 68.4 19.0 0.76 577 1.64 7.5 Yes 4<br />
4 University <strong>of</strong> Texas, M. D. Anderson Cancer Center, Houston 66.9 23.7 1.11 240 2.97 7.0 No 0<br />
5 Duke University Medical Center, Durham, N.C. 61.6 16.7 0.92 568 2.55 8.0 Yes 4<br />
6 Massachusetts General <strong>Hospital</strong>, Boston 60.3 15.7 0.88 460 1.82 8.0 Yes 4<br />
7 UCLA Medical Center, Los Angeles 55.6 13.4 0.89 329 1.94 8.0 Yes 4<br />
8 Parkland Memorial <strong>Hospital</strong>, Dallas 46.8 9.6 0.87 125 1.72 8.0 Yes 4<br />
9 <strong>Hospital</strong> <strong>of</strong> the University <strong>of</strong> Pennsylvania, Philadelphia 46.8 10.3 1.01 259 1.79 8.0 Yes 4<br />
10 University <strong>of</strong> California, San Francisco Medical Center 46.3 9.8 0.83 131 2.02 8.0 No 4<br />
11 Memorial Sloan-Kettering Cancer Center, New York 45.9 10.4 0.84 309 2.32 7.0 No 1<br />
12 Cleveland Clinic 45.3 7.3 0.67 655 2.12 8.0 No 4<br />
13 New York-Presbyterian <strong>Hospital</strong> 44.5 10.3 1.17 749 1.41 8.0 Yes 4<br />
14 Yale-New Haven <strong>Hospital</strong>, New Haven, Conn. 41.5 6.1 0.83 407 1.43 8.0 Yes 4<br />
15 University <strong>of</strong> Michigan Medical Center, Ann Arbor 40.6 4.7 0.74 410 1.87 8.0 Yes 4 (+3 SD)<br />
16 Stanford <strong>Hospital</strong> and Clinics, Stanford, Calif. 39.6 8.0 0.89 288 1.56 5.0 No 2<br />
17 Northwestern Memorial <strong>Hospital</strong>, Chicago 39.3 5.6 0.92 331 1.87 8.0 Yes 4<br />
18 Methodist <strong>Hospital</strong>, Houston 38.3 5.9 0.88 518 1.33 7.0 No 4<br />
19 University <strong>of</strong> Chicago <strong>Hospital</strong>s 38.1 3.9 0.80 338 1.86 8.0 Yes 4<br />
20 University <strong>of</strong> Colorado <strong>Hospital</strong>, Denver 37.2 3.1 0.65 113 2.25 8.0 Yes 4<br />
21 University <strong>of</strong> North Carolina <strong>Hospital</strong>s, Chapel Hill 36.5 4.0 0.90 375 1.64 8.0 Yes 4<br />
22 Barnes-Jewish <strong>Hospital</strong>, St. Louis 36.0 3.6 0.84 625 1.46 7.5 Yes 4<br />
23 Cedars-Sinai Medical Center, Los Angeles 35.7 4.1 0.95 610 1.54 8.0 Yes 4<br />
24 University <strong>of</strong> Virginia Medical Center, Charlottesville 35.2 3.1 0.88 404 2.25 8.0 Yes 4<br />
25 William Beaumont <strong>Hospital</strong>, Royal Oak, Mich. 35.1 2.3 0.77 673 1.75 8.0 Yes 4<br />
26 Christ <strong>Hospital</strong>, Cincinnati 35.0 0.9 0.52 340 1.07 7.0 Yes 4<br />
27 University <strong>of</strong> Washington Medical Center, Seattle 34.9 2.9 0.72 288 1.38 8.0 No 4<br />
28 Vanderbilt University Medical Center, Nashville 34.9 4.0 0.95 388 2.24 8.0 Yes 3<br />
29 Magee-Womens <strong>Hospital</strong>, Pittsburgh 34.8 1.6 0.32 508 1.32 6.0 No 4<br />
30 Mount Sinai Medical Center, New York 34.5 4.8 1.13 355 1.68 8.0 Yes 4 (+2 SD)<br />
31 Thomas Jefferson University <strong>Hospital</strong>, Philadelphia 34.2 2.8 0.85 438 1.62 7.0 Yes 4<br />
32 Harper University <strong>Hospital</strong>, Detroit 33.9 2.7 0.73 225 0.89 7.5 Yes 3<br />
33 University <strong>of</strong> Alabama <strong>Hospital</strong> at Birmingham 33.9 3.4 0.97 653 1.45 8.0 Yes 4<br />
34 Exempla St. Joseph <strong>Hospital</strong>, Denver 33.4 1.4 0.52 248 1.15 7.0 No 3<br />
35 University <strong>of</strong> California, Irvine Medical Center, Orange 33.2 4.5 0.82 90 1.19 6.0 Yes 1<br />
36 Georgetown University <strong>Hospital</strong>, Washington, D.C. 33.0 1.6 0.73 169 1.51 8.0 Yes 4<br />
37 USC University <strong>Hospital</strong>, Los Angeles 32.8 4.1 0.59 51 1.11 5.0 No 0<br />
38 Summa Health System, Akron, Ohio 32.7 0.0 0.62 325 2.21 7.5 Yes 4<br />
39 Emory University <strong>Hospital</strong>, Atlanta 32.6 4.5 0.91 265 1.43 7.5 No 1<br />
40 University <strong>of</strong> Utah <strong>Hospital</strong>s and Clinics, Salt Lake City 32.6 2.7 0.77 208 1.41 8.0 No 3<br />
41 NYU Medical Center, New York 32.2 3.1 1.01 502 1.18 7.5 Yes 4<br />
42 University <strong>Hospital</strong>s <strong>of</strong> Cleveland 32.2 0.0 0.67 401 1.84 8.0 Yes 4<br />
43 Beth Israel Deaconess Medical Center, Boston 32.2 1.4 0.80 286 2.23 7.0 Yes 4<br />
44 Miami Valley <strong>Hospital</strong>, Dayton, Ohio 31.9 0.4 0.69 469 1.02 8.0 Yes 4<br />
45 Akron General Medical Center, Akron, Ohio 31.8 0.6 0.73 350 1.34 7.5 Yes 4<br />
46 Baylor University Medical Center, Dallas 31.8 1.8 0.91 550 1.62 8.0 Yes 4<br />
47 Shands at the University <strong>of</strong> Florida, Gainesville 31.7 1.0 0.79 337 1.62 7.0 Yes 4<br />
48 Rush-Presbyterian-St. Luke's Medical Center, Chicago 31.6 1.4 0.67 247 1.18 8.0 No 3<br />
49 University <strong>of</strong> Wisconsin <strong>Hospital</strong> and Clinics, Madison 31.5 1.4 0.68 258 1.05 7.0 Yes 2<br />
50 University <strong>of</strong> Iowa <strong>Hospital</strong>s and Clinics, Iowa City 31.4 1.3 0.85 407 1.35 8.0 Yes 4
<strong>2003</strong> Heart and Heart Surgery Best <strong>Hospital</strong> List<br />
Technology Hospice,<br />
U.S. News Reputational Mortality R.N.'s score Trauma palliative<br />
Rank <strong>Hospital</strong> <strong>Index</strong> score rate Discharges to beds (<strong>of</strong> 9) Center care<br />
1 Cleveland Clinic 100.0 73.2 0.58 13824 2.12 9.0 No H, P<br />
2 Mayo Clinic, Rochester, Minn. 82.0 58.2 0.84 15729 1.51 9.0 No H, P<br />
3 Brigham and Women's <strong>Hospital</strong>, Boston 61.7 32.4 0.61 7504 1.64 8.5 Yes H, P<br />
4 Duke University Medical Center, Durham, N.C. 61.6 34.6 0.84 10635 2.55 9.0 Yes H, P<br />
5 Massachusetts General <strong>Hospital</strong>, Boston 60.2 31.3 0.76 10568 1.82 9.0 Yes H, P<br />
6 Johns Hopkins <strong>Hospital</strong>, Baltimore 58.6 31.4 0.79 6153 1.76 9.0 Yes H, P<br />
7 Emory University <strong>Hospital</strong>, Atlanta 42.0 18.1 0.85 7392 1.43 9.0 No P (+3 SD)<br />
8 Texas Heart Institute at St. Luke's Episcopal <strong>Hospital</strong>, Houston 40.2 13.7 0.80 10425 1.39 9.0 No H, P<br />
9 Stanford <strong>Hospital</strong> and Clinics, Stanford, Calif. 37.9 18.3 0.91 4517 1.56 7.0 No H<br />
10 Barnes-Jewish <strong>Hospital</strong>, St. Louis 37.2 8.9 0.81 11177 1.46 9.0 Yes H, P<br />
11 New York-Presbyterian <strong>Hospital</strong> 36.2 11.8 1.00 13765 1.41 9.0 Yes H, P<br />
12 UCLA Medical Center, Los Angeles 35.0 8.1 0.82 4045 1.94 9.0 Yes H, P<br />
13 Washington <strong>Hospital</strong> Center, Washington, D.C. 35.0 6.0 0.73 13400 1.43 8.0 Yes H, P (+2 SD)<br />
14 William Beaumont <strong>Hospital</strong>, Royal Oak, Mich. 33.3 2.7 0.74 18141 1.75 9.0 Yes H, P<br />
15 Methodist <strong>Hospital</strong>, Houston 32.5 8.5 0.94 10920 1.33 9.0 No H, P<br />
16 Cedars-Sinai Medical Center, Los Angeles 31.9 4.9 0.90 9244 1.54 9.0 Yes H, P<br />
17 Summa Health System, Akron, Ohio 31.8 0.5 0.68 6886 2.21 9.0 Yes H, P<br />
18 University <strong>of</strong> California, San Francisco Medical Center 31.4 6.8 0.78 2711 2.02 9.0 No P<br />
19 Abbott Northwestern <strong>Hospital</strong>, Minneapolis 31.2 1.1 0.67 10379 1.24 9.0 Yes P<br />
20 University <strong>Hospital</strong>s <strong>of</strong> Cleveland 31.0 0.0 0.66 5614 1.84 9.0 Yes H, P<br />
21 Sentara Norfolk General <strong>Hospital</strong>, Norfolk, Va. 30.8 0.0 0.58 8466 1.32 8.5 Yes H, P<br />
22 University <strong>of</strong> Michigan Medical Center, Ann Arbor 30.7 3.1 0.78 5403 1.87 9.0 Yes P<br />
23 Beth Israel Deaconess Medical Center, Boston 30.7 4.1 0.89 8911 2.23 8.0 Yes H, P<br />
24 Parkland Memorial <strong>Hospital</strong>, Dallas 30.5 2.6 0.61 1541 1.72 9.0 Yes P<br />
25 University <strong>of</strong> Alabama <strong>Hospital</strong> at Birmingham 30.4 7.1 1.03 7116 1.45 9.0 Yes H, P<br />
26 St. Luke's <strong>Hospital</strong>, Bethlehem, Pa. 30.3 0.0 0.64 8310 0.73 9.0 Yes H, P<br />
27 Henry Ford <strong>Hospital</strong>, Detroit 30.3 0.0 0.73 7880 1.79 8.5 Yes H, P<br />
28 F.G. McGaw <strong>Hospital</strong> at Loyola University, Maywood, Ill. 30.2 1.6 0.71 4897 1.72 9.0 Yes H<br />
29 St. Francis <strong>Hospital</strong>, Roslyn, N.Y. 30.0 1.2 0.77 15199 1.31 8.5 Yes H, P<br />
30 University <strong>of</strong> Chicago <strong>Hospital</strong>s 30.0 1.6 0.75 3481 1.86 9.0 Yes H, P<br />
31 University <strong>of</strong> Pittsburgh Medical Center 30.0 2.1 0.82 6960 1.52 9.0 Yes H, P<br />
32 <strong>Hospital</strong> <strong>of</strong> the University <strong>of</strong> Pennsylvania, Philadelphia 29.8 5.9 0.94 4904 1.79 9.0 Yes H<br />
33 Christ <strong>Hospital</strong>, Cincinnati 29.8 0.0 0.47 6903 1.07 8.5 Yes H, P<br />
34 Lenox Hill <strong>Hospital</strong>, New York 29.7 6.3 0.97 6894 1.65 9.0 No H, P<br />
35 St. Vincent's Medical Center, Jacksonville, Fla. 29.7 0.0 0.71 7286 1.12 9.0 Yes H, P<br />
36 Florida <strong>Hospital</strong>, Orlando 29.7 0.4 0.67 21337 1.65 9.0 No P<br />
37 North Carolina Baptist <strong>Hospital</strong>, Winston-Salem 29.4 1.5 0.85 7474 1.68 9.0 Yes H, P<br />
38 Scripps Memorial <strong>Hospital</strong> La Jolla, Calif. 29.3 1.6 0.70 3347 0.79 9.0 Yes H, P<br />
39 Hackensack University Medical Center, Hackensack, N.J. 29.3 0.0 0.82 10588 2.07 9.0 Yes H, P<br />
40 Delray Medical Center, Delray Beach, Fla. 29.1 0.0 0.72 9046 0.90 8.5 Yes H, P<br />
41 Hamot Medical Center, Erie, Pa. 29.0 0.0 0.70 5519 1.63 8.0 Yes H, P<br />
42 Mission St. Joseph's Health, Asheville, N.C. 28.8 0.5 0.45 86 1.64 9.0 Yes H, P<br />
43 Northwestern Memorial <strong>Hospital</strong>, Chicago 28.8 0.5 0.79 5013 1.87 9.0 Yes H, P<br />
44 Pitt County Memorial <strong>Hospital</strong>, Greenville, N.C. 28.7 0.5 0.82 9878 1.20 9.0 Yes H, P<br />
45 Riverside Methodist <strong>Hospital</strong>s, Columbus, Ohio 28.7 1.0 0.84 15621 1.14 9.0 Yes H, P<br />
46 Lankenau <strong>Hospital</strong>, Wynnewood, Pa. 28.6 0.5 0.63 6236 1.22 8.5 No H, P<br />
47 St. Vincent <strong>Hospital</strong> and Health Center, Indianapolis 28.6 2.0 0.85 12904 1.24 8.0 Yes H, P<br />
48 Lehigh Valley <strong>Hospital</strong>, Allentown, Pa. 28.6 0.0 0.77 9202 1.19 8.5 Yes H, P<br />
49 Sinai <strong>Hospital</strong> <strong>of</strong> Baltimore 28.6 0.5 0.72 5512 0.71 9.0 Yes H, P<br />
50 Mercy Medical Center, Canton, Ohio 28.5 0.5 0.71 4940 1.21 9.0 Yes H
<strong>2003</strong> Hormonal Disorders Best <strong>Hospital</strong> List<br />
Technology<br />
U.S. News Reputational Mortality R.N.'s score Trauma<br />
Rank <strong>Hospital</strong> <strong>Index</strong> score rate Discharges to beds (<strong>of</strong> 7) Center<br />
1 Mayo Clinic, Rochester, Minn. 100.0 69.8 0.81 1695 1.51 7.0 No<br />
2 Massachusetts General <strong>Hospital</strong>, Boston 91.9 59.3 0.68 1372 1.82 7.0 Yes<br />
3 Johns Hopkins <strong>Hospital</strong>, Baltimore 67.3 37.3 0.66 846 1.76 7.0 Yes<br />
4 University <strong>of</strong> California, San Francisco Medical Center 46.0 18.4 0.40 512 2.02 7.0 No<br />
5 University <strong>of</strong> Virginia Medical Center, Charlottesville 44.6 14.8 0.60 1055 2.25 7.0 Yes<br />
6 Barnes-Jewish <strong>Hospital</strong>, St. Louis 44.5 14.5 0.73 1866 1.46 7.0 Yes<br />
7 Brigham and Women's <strong>Hospital</strong>, Boston 43.4 14.5 0.53 721 1.64 6.5 Yes<br />
8 UCLA Medical Center, Los Angeles 43.3 13.9 0.56 790 1.94 7.0 Yes<br />
9 Beth Israel Deaconess Medical Center, Boston 42.1 12.2 0.48 952 2.23 6.0 Yes<br />
10 New York-Presbyterian <strong>Hospital</strong> 41.6 17.7 1.46 2159 1.41 7.0 Yes<br />
11 University <strong>of</strong> Washington Medical Center, Seattle 39.5 13.6 0.49 378 1.38 7.0 No (+3 SD)<br />
12 Cleveland Clinic 38.3 11.0 0.64 1209 2.12 7.0 No<br />
13 University <strong>of</strong> Michigan Medical Center, Ann Arbor 37.0 7.6 0.56 927 1.87 7.0 Yes<br />
14 Northwestern Memorial <strong>Hospital</strong>, Chicago 36.3 7.8 0.69 1064 1.87 7.0 Yes<br />
15 University <strong>of</strong> Chicago <strong>Hospital</strong>s 35.4 9.1 0.82 690 1.86 7.0 Yes<br />
16 Duke University Medical Center, Durham, N.C. 35.3 6.2 0.57 934 2.55 7.0 Yes<br />
17 Parkland Memorial <strong>Hospital</strong>, Dallas 34.4 7.0 0.61 431 1.72 7.0 Yes<br />
18 Vanderbilt University Medical Center, Nashville 33.3 5.2 0.67 894 2.24 7.0 Yes (+2 SD)<br />
19 Henry Ford <strong>Hospital</strong>, Detroit 32.1 1.5 0.66 1979 1.79 6.5 Yes<br />
20 Oregon Health & Science University <strong>Hospital</strong>, Portland 31.5 3.1 0.44 460 2.14 6.5 Yes<br />
21 Florida <strong>Hospital</strong>, Orlando 30.3 0.0 0.40 2017 1.65 7.0 No<br />
22 University <strong>of</strong> Colorado <strong>Hospital</strong>, Denver 30.3 3.3 0.61 354 2.25 7.0 Yes<br />
23 University <strong>Hospital</strong>s <strong>of</strong> Cleveland 30.0 0.5 0.55 1136 1.84 7.0 Yes<br />
24 William Beaumont <strong>Hospital</strong>, Royal Oak, Mich. 30.0 0.0 0.63 1592 1.75 7.0 Yes<br />
25 Washington <strong>Hospital</strong> Center, Washington, D.C. 29.7 0.5 0.66 1898 1.43 6.0 Yes<br />
26 University <strong>of</strong> Alabama <strong>Hospital</strong> at Birmingham 29.6 1.9 0.69 1134 1.45 7.0 Yes<br />
27 Inova Fairfax <strong>Hospital</strong>, Falls Church, Va. 29.4 0.5 0.43 828 1.94 6.0 Yes<br />
28 St. Louis University <strong>Hospital</strong> 29.4 1.0 0.34 720 1.41 7.0 Yes<br />
29 University <strong>of</strong> Iowa <strong>Hospital</strong>s and Clinics, Iowa City 29.3 1.8 0.55 666 1.35 7.0 Yes<br />
30 St. Joseph Mercy <strong>Hospital</strong>, Ann Arbor 29.2 0.0 0.50 1023 1.85 6.0 Yes<br />
31 Yale-New Haven <strong>Hospital</strong>, New Haven, Conn. 29.1 2.6 0.71 800 1.43 7.0 Yes<br />
32 Strong Memorial <strong>Hospital</strong>-University <strong>of</strong> Rochester, N.Y. 29.0 1.0 0.59 810 2.01 6.5 Yes<br />
33 Evanston Northwestern Healthcare, Evanston, Ill. 29.0 0.0 0.54 1254 1.31 7.0 Yes<br />
34 University <strong>of</strong> Miami, Jackson Memorial <strong>Hospital</strong> 29.0 2.8 0.51 683 1.53 7.0 No<br />
35 Ohio State University Medical Center, Columbus 29.0 2.4 0.30 713 0.98 5.5 Yes<br />
36 University <strong>of</strong> Pittsburgh Medical Center 28.9 1.9 0.81 1312 1.52 7.0 Yes<br />
37 University <strong>of</strong> North Carolina <strong>Hospital</strong>s, Chapel Hill 28.8 1.0 0.60 774 1.64 7.0 Yes<br />
38 University <strong>of</strong> California, Davis Medical Center, Sacramento 28.8 0.0 0.29 582 2.97 7.0 Yes<br />
39 Abbott Northwestern <strong>Hospital</strong>, Minneapolis 28.5 0.0 0.41 908 1.24 7.0 Yes<br />
40 <strong>Hospital</strong> <strong>of</strong> the University <strong>of</strong> Pennsylvania, Philadelphia 28.4 4.8 1.10 806 1.79 7.0 Yes<br />
41 Los Angeles County-Harbor-UCLA Medical Center 28.3 2.0 0.26 189 1.88 4.5 Yes<br />
42 F.G. McGaw <strong>Hospital</strong> at Loyola University, Maywood, Ill. 28.3 1.0 0.66 736 1.72 7.0 Yes<br />
43 Good Samaritan Regional Medical Center, Phoenix 28.2 0.9 0.38 548 1.14 7.0 Yes<br />
44 Lahey Clinic, Burlington, Mass. 28.2 0.4 0.48 720 1.46 6.0 Yes<br />
45 University <strong>Hospital</strong>, Cincinnati 28.0 0.4 0.49 709 1.16 7.0 Yes<br />
46 Froedtert Memorial Lutheran <strong>Hospital</strong>, Milwaukee 27.9 0.5 0.57 909 1.46 6.0 Yes<br />
47 Deaconess <strong>Hospital</strong>, Evansville, Ind. 27.8 0.0 0.50 934 1.06 7.0 Yes<br />
48 St. Vincent Medical Center, Toledo, Ohio 27.8 0.0 0.56 800 1.56 6.5 Yes<br />
49 Mount Sinai Medical Center, New York 27.8 5.4 1.57 2049 1.68 7.0 Yes<br />
50 Poudre Valley <strong>Hospital</strong>, Fort Collins, Colo. 27.7 0.0 0.50 495 2.22 6.0 Yes
<strong>2003</strong> Kidney Disease Best <strong>Hospital</strong> List<br />
Technology Discharge Medical/<br />
U.S. News Reputational Mortality R.N.'s score Trauma planning Surgical<br />
Rank <strong>Hospital</strong> <strong>Index</strong> score rate Discharges to beds (<strong>of</strong> 5) Center (<strong>of</strong> 3) Beds<br />
1 Massachusetts General <strong>Hospital</strong>, Boston 100.0 31.3 0.75 1151 1.82 5.0 Yes 3 66<br />
2 Brigham and Women's <strong>Hospital</strong>, Boston 94.9 29.4 0.65 795 1.64 5.0 Yes 3 38<br />
3 Mayo Clinic, Rochester, Minn. 88.2 25.2 0.83 1408 1.51 5.0 No 3 96<br />
4 Johns Hopkins <strong>Hospital</strong>, Baltimore 86.3 25.1 0.73 912 1.76 4.5 Yes 3 49<br />
5 New York-Presbyterian <strong>Hospital</strong> 85.4 24.0 1.22 2259 1.41 5.0 Yes 3 107<br />
6 Cleveland Clinic 81.6 23.1 0.74 1103 2.12 5.0 No 3 44<br />
7 UCLA Medical Center, Los Angeles 75.8 18.5 0.63 1057 1.94 5.0 Yes 3 58<br />
8 Duke University Medical Center, Durham, N.C. 67.4 16.0 0.85 1181 2.55 5.0 Yes 3 34<br />
9 Barnes-Jewish <strong>Hospital</strong>, St. Louis 64.8 12.0 0.77 1981 1.46 5.0 Yes 3 80<br />
10 <strong>Hospital</strong> <strong>of</strong> the University <strong>of</strong> Pennsylvania, Philadelphia 63.1 12.4 0.55 791 1.79 5.0 Yes 3 41<br />
11 Vanderbilt University Medical Center, Nashville 62.5 13.7 0.77 909 2.24 4.5 Yes 3 28<br />
12 University <strong>of</strong> California, San Francisco Medical Center 59.4 12.6 0.78 705 2.02 5.0 No 3 36<br />
13 University <strong>of</strong> Colorado <strong>Hospital</strong>, Denver 59.1 11.3 0.50 449 2.25 4.0 Yes 3 24<br />
14 University <strong>of</strong> Michigan Medical Center, Ann Arbor 58.3 9.7 0.56 1008 1.87 5.0 Yes 3 40<br />
15 Parkland Memorial <strong>Hospital</strong>, Dallas 57.6 9.4 0.49 701 1.72 5.0 Yes 3 37<br />
16 University <strong>of</strong> Washington Medical Center, Seattle 56.1 11.2 0.58 469 1.38 5.0 No 2 19<br />
17 University <strong>of</strong> Pittsburgh Medical Center 54.4 7.0 0.90 1162 1.52 5.0 Yes 3 123<br />
18 Stanford <strong>Hospital</strong> and Clinics, Stanford, Calif. 52.4 10.2 0.89 523 1.56 4.5 No 3 33<br />
19 University <strong>of</strong> Chicago <strong>Hospital</strong>s 51.8 6.1 0.44 803 1.86 5.0 Yes 3 33 (+3 SD)<br />
20 University <strong>of</strong> Alabama <strong>Hospital</strong> at Birmingham 50.1 7.6 1.05 1412 1.45 4.0 Yes 3 61<br />
21 University <strong>of</strong> Miami, Jackson Memorial <strong>Hospital</strong> 49.7 3.1 0.41 752 1.53 5.0 No 3 120<br />
22 Rush-Presbyterian-St. Luke's Medical Center, Chicago 48.9 5.2 0.56 1260 1.18 5.0 No 3 51<br />
23 Shands at the University <strong>of</strong> Florida, Gainesville 48.2 4.5 0.52 1149 1.62 5.0 Yes 3 30<br />
24 University <strong>of</strong> Maryland Medical System, Baltimore 48.1 3.7 0.47 1207 1.37 5.0 No 3 69<br />
25 Fairview-University Medical Center, Minneapolis 47.2 5.4 0.50 754 0.50 5.0 No 3 39<br />
26 Tufts-New England Medical Center, Boston 46.4 6.5 0.91 423 2.44 5.0 Yes 3 30<br />
27 Henry Ford <strong>Hospital</strong>, Detroit 46.4 1.0 0.47 1780 1.79 5.0 Yes 3 78<br />
28 Emory University <strong>Hospital</strong>, Atlanta 46.1 5.3 0.73 830 1.43 4.5 No 3 48<br />
29 University <strong>of</strong> Wisconsin <strong>Hospital</strong> and Clinics, Madison 45.2 4.4 0.61 801 1.05 5.0 Yes 3 24<br />
30 Beth Israel Deaconess Medical Center, Boston 44.5 3.9 0.81 1030 2.23 5.0 Yes 3 40<br />
31 Florida <strong>Hospital</strong>, Orlando 44.1 0.0 0.56 1994 1.65 5.0 No 3 102<br />
32 Yale-New Haven <strong>Hospital</strong>, New Haven, Conn. 43.8 4.5 1.00 986 1.43 5.0 Yes 3 52 (+2 SD)<br />
33 Hennepin County Medical Center, Minneapolis 43.5 2.1 0.37 752 0.58 5.0 Yes 3 40<br />
34 William Beaumont <strong>Hospital</strong>, Royal Oak, Mich. 43.4 1.0 0.69 1943 1.75 5.0 Yes 3 60<br />
35 Froedtert Memorial Lutheran <strong>Hospital</strong>, Milwaukee 43.4 1.2 0.31 931 1.46 5.0 Yes 3 31<br />
36 University <strong>of</strong> North Carolina <strong>Hospital</strong>s, Chapel Hill 43.3 3.5 0.68 1082 1.64 4.5 Yes 3 16<br />
37 Northwestern Memorial <strong>Hospital</strong>, Chicago 42.6 1.5 0.65 1059 1.87 5.0 Yes 3 58<br />
38 Methodist <strong>Hospital</strong>, Houston 42.1 4.3 0.90 970 1.33 4.5 No 3 43<br />
39 Ohio State University Medical Center, Columbus 41.7 1.7 0.60 1099 0.98 4.0 Yes 3 57<br />
40 University <strong>of</strong> Virginia Medical Center, Charlottesville 41.6 1.5 0.68 1053 2.25 5.0 Yes 3 45<br />
41 Denver Health and <strong>Hospital</strong>s 41.4 0.0 0.09 226 2.00 4.0 Yes 3 31<br />
42 Memorial Hermann <strong>Hospital</strong>, Houston 41.3 1.1 0.57 734 1.23 5.0 Yes 3 60<br />
43 University Health System, San Antonio 41.2 0.5 0.29 447 1.48 4.5 Yes 3 37<br />
44 St. Louis University <strong>Hospital</strong> 41.1 0.6 0.40 745 1.41 4.5 Yes 3 43<br />
45 Tampa General <strong>Hospital</strong> 40.8 0.0 0.36 718 0.92 5.0 Yes 3 57<br />
46 University <strong>Hospital</strong>s <strong>of</strong> Cleveland 40.7 1.6 0.73 1214 1.84 5.0 Yes 3 30<br />
47 University <strong>of</strong> Missouri <strong>Hospital</strong>s and Clinics, Columbia 40.4 2.0 0.64 374 1.82 3.0 Yes 3 54<br />
48 Baptist St. Anthony's Health System, Amarillo, Texas 40.2 0.0 0.23 725 1.47 5.0 No 3 31<br />
49 Summa Health System, Akron, Ohio 40.2 0.0 0.57 1513 2.21 5.0 Yes 3 35<br />
50 Temple University <strong>Hospital</strong>, Philadelphia 40.2 0.5 0.64 820 1.73 5.0 Yes 3 56
<strong>2003</strong> Neurology and Neurosurgery Best <strong>Hospital</strong> List<br />
Technology<br />
U.S. News Reputational Mortality R.N.'s score Trauma<br />
Rank <strong>Hospital</strong> <strong>Index</strong> score rate Discharges to beds (<strong>of</strong> 7) Center<br />
1 Mayo Clinic, Rochester, Minn. 100.0 58.5 0.95 5092 1.51 7.0 No<br />
2 Massachusetts General <strong>Hospital</strong>, Boston 91.6 52.8 1.09 3590 1.82 7.0 Yes<br />
3 Johns Hopkins <strong>Hospital</strong>, Baltimore 89.0 47.0 0.70 2555 1.76 7.0 Yes<br />
4 New York-Presbyterian <strong>Hospital</strong> 84.2 45.9 1.09 5104 1.41 7.0 Yes<br />
5 University <strong>of</strong> California, San Francisco Medical Center 62.8 33.3 1.07 1779 2.02 7.0 No<br />
6 Cleveland Clinic 60.8 24.3 0.62 3377 2.12 7.0 No<br />
7 Barnes-Jewish <strong>Hospital</strong>, St. Louis 45.9 13.5 0.93 4687 1.46 7.0 Yes<br />
8 UCLA Medical Center, Los Angeles 42.6 13.0 0.93 2142 1.94 7.0 Yes<br />
9 <strong>Hospital</strong> <strong>of</strong> the University <strong>of</strong> Pennsylvania, Philadelphia 41.9 15.2 1.14 2113 1.79 7.0 Yes (+3 SD)<br />
10 St. Joseph's <strong>Hospital</strong> and Medical Center, Phoenix 38.8 13.4 1.06 3075 0.91 5.0 Yes<br />
11 Methodist <strong>Hospital</strong>, Houston 36.7 7.4 0.78 3784 1.33 7.0 No<br />
12 NYU Medical Center, New York 34.6 3.8 0.68 3189 1.18 6.5 Yes<br />
13 Duke University Medical Center, Durham, N.C. 34.3 7.3 1.06 2851 2.55 7.0 Yes (+2 SD)<br />
14 William Beaumont <strong>Hospital</strong>, Royal Oak, Mich. 33.4 0.0 0.75 5270 1.75 7.0 Yes<br />
15 University <strong>of</strong> Chicago <strong>Hospital</strong>s 33.2 3.8 0.71 1298 1.86 7.0 Yes<br />
16 Brigham and Women's <strong>Hospital</strong>, Boston 32.2 7.5 1.09 1908 1.64 6.5 Yes<br />
17 Henry Ford <strong>Hospital</strong>, Detroit 32.2 1.8 0.77 3230 1.79 6.5 Yes<br />
18 Harper University <strong>Hospital</strong>, Detroit 32.1 0.4 0.41 1931 0.89 6.5 Yes<br />
19 Summa Health System, Akron, Ohio 31.9 0.0 0.64 2975 2.21 7.0 Yes<br />
20 University <strong>of</strong> Illinois Medical Center at Chicago 31.8 1.7 0.48 814 1.72 4.5 Yes<br />
21 Shands at the University <strong>of</strong> Florida, Gainesville 31.7 3.7 0.84 2421 1.62 6.0 Yes<br />
22 University <strong>Hospital</strong>s <strong>of</strong> Cleveland 31.6 1.3 0.72 2478 1.84 7.0 Yes<br />
23 Mount Sinai Medical Center, New York 31.6 3.2 0.90 2916 1.68 7.0 Yes<br />
24 Florida <strong>Hospital</strong>, Orlando 31.4 0.5 0.82 6106 1.65 7.0 No<br />
25 Stanford <strong>Hospital</strong> and Clinics, Stanford, Calif. 31.2 8.0 0.95 1731 1.56 5.0 No<br />
26 Denver Health and <strong>Hospital</strong>s 31.2 0.4 0.03 355 2.00 5.5 Yes<br />
27 Fairview-University Medical Center, Minneapolis 31.1 2.6 0.45 1673 0.50 7.0 No<br />
28 Ingalls <strong>Hospital</strong>, Harvey, Ill. 30.9 0.0 0.42 1553 0.67 7.0 Yes<br />
29 Evanston Northwestern Healthcare, Evanston, Ill. 30.9 0.9 0.71 2950 1.31 7.0 Yes<br />
30 University <strong>of</strong> Michigan Medical Center, Ann Arbor 30.8 5.5 1.04 1737 1.87 7.0 Yes<br />
31 Rush-Presbyterian-St. Luke's Medical Center, Chicago 30.7 1.6 0.51 1781 1.18 7.0 No<br />
32 St. Vincent <strong>Hospital</strong> and Health Center, Indianapolis 30.6 0.0 0.64 3437 1.24 6.0 Yes<br />
33 Abbott Northwestern <strong>Hospital</strong>, Minneapolis 30.6 0.5 0.71 3263 1.24 7.0 Yes<br />
34 University <strong>of</strong> Virginia Medical Center, Charlottesville 30.4 3.4 1.04 3252 2.25 7.0 Yes<br />
35 Beth Israel Deaconess Medical Center, Boston 30.3 1.8 0.82 2608 2.23 6.0 Yes<br />
36 University <strong>of</strong> Pittsburgh Medical Center 30.2 3.9 1.10 3756 1.52 7.0 Yes<br />
37 St. Elizabeth Medical Center-North, Covington, Ky. 30.1 0.0 0.48 1750 1.35 4.5 Yes<br />
38 Georgetown University <strong>Hospital</strong>, Washington, D.C. 29.7 1.0 0.65 1036 1.51 7.0 Yes<br />
39 University <strong>of</strong> Washington Medical Center, Seattle 29.4 3.5 0.68 750 1.38 7.0 No<br />
40 William Beaumont <strong>Hospital</strong>-Troy, Troy, Mich. 29.4 0.0 0.65 1540 1.91 6.5 Yes<br />
41 University <strong>of</strong> Colorado <strong>Hospital</strong>, Denver 29.4 0.8 0.67 746 2.25 7.0 Yes<br />
42 <strong>Hospital</strong> <strong>of</strong> St. Raphael, New Haven, Conn. 29.3 0.0 0.56 1925 0.88 6.5 Yes<br />
43 Baptist St. Anthony's Health System, Amarillo, Texas 29.3 0.0 0.48 2400 1.47 5.0 No<br />
44 Advocate Lutheran General <strong>Hospital</strong>, Park Ridge, Ill. 29.0 0.0 0.60 2376 0.94 6.0 Yes<br />
45 Northwestern Memorial <strong>Hospital</strong>, Chicago 29.0 1.7 0.91 2364 1.87 7.0 Yes<br />
46 Christ <strong>Hospital</strong>, Cincinnati 29.0 0.0 0.58 1604 1.07 6.5 Yes<br />
47 Memorial Sloan-Kettering Cancer Center, New York 29.0 1.4 0.57 527 2.32 7.0 No<br />
48 Mercy Medical Center, Mason City, Iowa 28.9 0.0 0.53 1402 1.26 5.0 Yes<br />
49 Akron General Medical Center, Akron, Ohio 28.8 0.0 0.71 2256 1.34 7.0 Yes<br />
50 Thomas Jefferson University <strong>Hospital</strong>, Philadelphia 28.8 1.7 0.91 2966 1.62 6.0 Yes
<strong>2003</strong> Orthopedics Best <strong>Hospital</strong> List<br />
Technology<br />
U.S. News Reputational Mortality R.N.'s score Trauma<br />
Rank <strong>Hospital</strong> <strong>Index</strong> score rate Discharges to beds (<strong>of</strong> 5) Center<br />
1 Mayo Clinic, Rochester, Minn. 100.0 56.1 0.69 8147 1.51 5.0 No<br />
2 <strong>Hospital</strong> for Special Surgery, New York 84.2 41.5 0.08 7692 1.72 5.0 Yes<br />
3 Massachusetts General <strong>Hospital</strong>, Boston 77.6 38.6 0.83 3490 1.82 5.0 Yes<br />
4 Johns Hopkins <strong>Hospital</strong>, Baltimore 58.8 24.2 0.70 1649 1.76 5.0 Yes<br />
5 Cleveland Clinic 53.1 19.4 0.47 3441 2.12 5.0 No<br />
6 Duke University Medical Center, Durham, N.C. 43.9 13.7 0.93 2714 2.55 5.0 Yes<br />
7 UCLA Medical Center, Los Angeles 41.1 14.6 1.34 1687 1.94 5.0 Yes<br />
8 University <strong>of</strong> Iowa <strong>Hospital</strong>s and Clinics, Iowa City 39.6 10.3 0.76 1627 1.35 5.0 Yes<br />
9 Harborview Medical Center, Seattle 37.8 9.1 0.66 1007 2.18 4.5 Yes<br />
10 University <strong>of</strong> Washington Medical Center, Seattle 37.0 9.4 0.60 1042 1.38 5.0 No (+3 SD)<br />
11 Rush-Presbyterian-St. Luke's Medical Center, Chicago 35.6 6.7 0.41 2498 1.18 5.0 No<br />
12 Stanford <strong>Hospital</strong> and Clinics, Stanford, Calif. 35.0 7.8 0.65 2063 1.56 3.0 No<br />
13 University <strong>of</strong> Pittsburgh Medical Center 34.9 7.2 0.97 2052 1.52 5.0 Yes<br />
14 Brigham and Women's <strong>Hospital</strong>, Boston 34.3 5.1 0.66 2509 1.64 4.5 Yes<br />
15 Barnes-Jewish <strong>Hospital</strong>, St. Louis 33.2 7.1 1.18 2819 1.46 5.0 Yes<br />
16 Parkland Memorial <strong>Hospital</strong>, Dallas 32.8 6.3 0.80 596 1.72 5.0 Yes<br />
17 University <strong>of</strong> California, San Francisco Medical Center 32.7 7.7 0.90 1068 2.02 5.0 No<br />
18 New York-Presbyterian <strong>Hospital</strong> 32.6 7.3 1.26 3167 1.41 5.0 Yes<br />
19 Thomas Jefferson University <strong>Hospital</strong>, Philadelphia 32.5 4.0 0.66 3983 1.62 4.0 Yes<br />
20 Northwestern Memorial <strong>Hospital</strong>, Chicago 32.3 4.5 0.86 2423 1.87 5.0 Yes<br />
21 University <strong>Hospital</strong>s <strong>of</strong> Cleveland 32.2 2.4 0.52 2369 1.84 5.0 Yes<br />
22 University <strong>of</strong> Michigan Medical Center, Ann Arbor 31.6 4.0 0.69 1305 1.87 5.0 Yes (+2 SD)<br />
23 University <strong>of</strong> Chicago <strong>Hospital</strong>s 31.0 3.6 0.69 1245 1.86 5.0 Yes<br />
24 <strong>Hospital</strong> for Joint Diseases Orthopedic Institute, New York 30.8 4.0 0.18 2022 1.04 4.0 No<br />
25 Shands at the University <strong>of</strong> Florida, Gainesville 30.4 2.8 0.73 2448 1.62 4.0 Yes<br />
26 New England Baptist <strong>Hospital</strong>, Boston 30.3 3.6 0.65 3044 1.24 5.0 No<br />
27 Vanderbilt University Medical Center, Nashville 30.2 1.6 0.50 1467 2.24 5.0 Yes<br />
28 University <strong>of</strong> Virginia Medical Center, Charlottesville 29.9 1.2 0.59 2061 2.25 5.0 Yes<br />
29 Baylor University Medical Center, Dallas 29.4 1.2 0.68 3676 1.62 5.0 Yes<br />
30 Summa Health System, Akron, Ohio 29.2 0.0 0.40 3563 2.21 5.0 Yes<br />
31 University <strong>of</strong> Wisconsin <strong>Hospital</strong> and Clinics, Madison 29.2 1.8 0.54 1370 1.05 5.0 Yes<br />
32 University <strong>of</strong> California, Davis Medical Center, Sacramento 29.1 1.6 0.58 1171 2.97 5.0 Yes<br />
33 Methodist <strong>Hospital</strong>, Houston 29.0 4.4 0.99 3192 1.33 5.0 No<br />
34 Fairview-University Medical Center, Minneapolis 28.9 3.2 0.53 1968 0.50 5.0 No<br />
35 Grant Medical Center, Columbus, Ohio 28.8 0.0 0.50 2927 1.31 5.0 Yes<br />
36 Georgetown University <strong>Hospital</strong>, Washington, D.C. 28.7 1.0 0.49 930 1.51 5.0 Yes<br />
37 William Beaumont <strong>Hospital</strong>, Royal Oak, Mich. 28.4 0.4 0.66 5427 1.75 5.0 Yes<br />
38 University <strong>of</strong> Miami, Jackson Memorial <strong>Hospital</strong> 28.3 2.8 0.57 766 1.53 5.0 No<br />
39 F.G. McGaw <strong>Hospital</strong> at Loyola University, Maywood, Ill. 28.2 1.4 0.70 1378 1.72 5.0 Yes<br />
40 University Health System, San Antonio 28.1 1.6 0.53 633 1.48 4.0 Yes<br />
41 Poudre Valley <strong>Hospital</strong>, Fort Collins, Colo. 28.1 0.0 0.62 2029 2.22 5.0 Yes<br />
42 University <strong>of</strong> Alabama <strong>Hospital</strong> at Birmingham 28.0 2.0 0.93 1895 1.45 5.0 Yes<br />
43 Evanston Northwestern Healthcare, Evanston, Ill. 28.0 0.0 0.60 3355 1.31 5.0 Yes<br />
44 Advocate Lutheran General <strong>Hospital</strong>, Park Ridge, Ill. 27.9 0.4 0.40 2381 0.94 4.0 Yes<br />
45 Yale-New Haven <strong>Hospital</strong>, New Haven, Conn. 27.9 1.2 0.68 1310 1.43 5.0 Yes<br />
46 St. Joseph's <strong>Hospital</strong>, Tampa 27.9 0.6 0.59 1687 1.31 4.5 Yes<br />
47 Clarian Health Partners (IU and Methodist <strong>Hospital</strong>s), Indianapolis 27.7 2.4 0.70 4216 0.94 5.0 No<br />
48 University <strong>of</strong> Tennessee Medical Center, Memphis 27.7 5.8 0.86 105 1.04 4.5 No<br />
49 Union Memorial <strong>Hospital</strong>, Baltimore 27.6 0.0 0.45 1462 1.38 4.5 Yes<br />
50 North Carolina Baptist <strong>Hospital</strong>, Winston-Salem 27.6 1.4 0.93 2133 1.68 5.0 Yes
<strong>2003</strong> Respiratory Disorders Best <strong>Hospital</strong> List<br />
Technology Discharge Hospice,<br />
U.S. News Reputational Mortality R.N.'s score Trauma planning palliative<br />
Rank <strong>Hospital</strong> <strong>Index</strong> score rate Discharges to beds (<strong>of</strong> 4) Center (<strong>of</strong> 3) care<br />
1 National Jewish Medical and Research Center, Denver 100.0 53.0 0.00 97 2.14 2.5 No 3<br />
2 Mayo Clinic, Rochester, Minn. 84.2 43.0 0.92 4644 1.51 4.0 No 3 H, P<br />
3 Johns Hopkins <strong>Hospital</strong>, Baltimore 72.2 33.0 0.82 1599 1.76 4.0 Yes 3 H, P<br />
4 Barnes-Jewish <strong>Hospital</strong>, St. Louis 52.2 19.1 0.88 4944 1.46 4.0 Yes 3 H, P<br />
5 Massachusetts General <strong>Hospital</strong>, Boston 52.1 18.9 0.88 3460 1.82 4.0 Yes 3 H, P<br />
6 University <strong>of</strong> California, San Francisco Medical Center 49.8 17.6 0.73 1317 2.02 4.0 No 3 P<br />
7 University <strong>of</strong> Colorado <strong>Hospital</strong>, Denver 47.4 13.9 0.60 1057 2.25 4.0 Yes 3 P<br />
8 UCSD Medical Center, San Diego 43.5 13.2 0.81 1366 1.73 4.0 Yes 3 H<br />
9 Duke University Medical Center, Durham, N.C. 43.0 13.8 1.01 3049 2.55 4.0 Yes 3 H, P<br />
10 University <strong>of</strong> Michigan Medical Center, Ann Arbor 42.2 11.4 0.75 2130 1.87 4.0 Yes 3 P<br />
11 Cleveland Clinic 40.8 11.1 0.82 2773 2.12 4.0 No 3 H, P (+3 SD)<br />
12 <strong>Hospital</strong> <strong>of</strong> the University <strong>of</strong> Pennsylvania, Philadelphia 36.1 9.8 0.99 1356 1.79 4.0 Yes 3 H<br />
13 University <strong>of</strong> Washington Medical Center, Seattle 35.0 11.3 1.05 873 1.38 4.0 No 2 H<br />
14 UCLA Medical Center, Los Angeles 34.3 6.1 0.82 1714 1.94 4.0 Yes 3 H, P<br />
15 Brigham and Women's <strong>Hospital</strong>, Boston 32.7 5.8 0.92 2343 1.64 4.0 Yes 3 H, P (+2 SD)<br />
16 Yale-New Haven <strong>Hospital</strong>, New Haven, Conn. 31.2 4.9 0.88 2437 1.43 4.0 Yes 3 H<br />
17 University <strong>of</strong> Pittsburgh Medical Center 31.2 5.3 0.98 2489 1.52 4.0 Yes 3 H, P<br />
18 University <strong>of</strong> Alabama <strong>Hospital</strong> at Birmingham 31.1 5.0 0.94 2096 1.45 4.0 Yes 3 H, P<br />
19 University <strong>of</strong> Chicago <strong>Hospital</strong>s 30.9 3.7 0.82 1449 1.86 4.0 Yes 3 H, P<br />
20 University <strong>Hospital</strong>s <strong>of</strong> Cleveland 30.8 1.1 0.62 2824 1.84 4.0 Yes 3 H, P<br />
21 Stanford <strong>Hospital</strong> and Clinics, Stanford, Calif. 30.3 6.7 1.02 1551 1.56 4.0 No 3 H<br />
22 New York-Presbyterian <strong>Hospital</strong> 30.2 6.8 1.21 5365 1.41 4.0 Yes 3 H, P<br />
23 Vanderbilt University Medical Center, Nashville 30.1 5.2 0.98 2143 2.24 4.0 Yes 3 P<br />
24 Henry Ford <strong>Hospital</strong>, Detroit 30.0 1.5 0.72 3818 1.79 4.0 Yes 3 H, P<br />
25 University <strong>of</strong> Iowa <strong>Hospital</strong>s and Clinics, Iowa City 29.9 2.8 0.77 1319 1.35 4.0 Yes 3 H, P<br />
26 Christ <strong>Hospital</strong>, Cincinnati 29.9 0.0 0.53 2456 1.07 4.0 Yes 3 H, P<br />
27 Denver Health and <strong>Hospital</strong>s 29.6 0.4 0.04 655 2.00 3.5 Yes 3 H, P<br />
28 University <strong>of</strong> Virginia Medical Center, Charlottesville 29.3 1.9 0.78 2446 2.25 4.0 Yes 3 H, P<br />
29 University Health System, San Antonio 28.9 0.6 0.56 674 1.48 4.0 Yes 3 P<br />
30 Southwest General Health Center, Middleburg Heights, Ohio 28.7 0.4 0.58 2568 0.62 4.0 Yes 3 H<br />
31 Miami Valley <strong>Hospital</strong>, Dayton, Ohio 28.7 0.4 0.61 3515 1.02 4.0 Yes 3 P<br />
32 Lahey Clinic, Burlington, Mass. 28.5 0.9 0.61 2013 1.46 4.0 Yes 3<br />
33 Summa Health System, Akron, Ohio 28.3 0.0 0.68 5244 2.21 4.0 Yes 3 H, P<br />
34 Grandview <strong>Hospital</strong> and Medical Center, Dayton, Ohio 28.2 0.0 0.53 1558 1.24 3.5 No 3 H, P<br />
35 University <strong>of</strong> Wisconsin <strong>Hospital</strong> and Clinics, Madison 28.1 0.8 0.64 1409 1.05 4.0 Yes 3 H<br />
36 CHP <strong>Hospital</strong> and Surgical Center, Lorain, Ohio 28.1 0.0 0.64 2437 0.74 4.0 Yes 3 H, P<br />
37 Parkland Memorial <strong>Hospital</strong>, Dallas 28.1 1.9 0.76 868 1.72 4.0 Yes 3 P<br />
38 LDS <strong>Hospital</strong>, Salt Lake City 28.0 1.1 0.74 1552 1.01 4.0 Yes 3 H, P<br />
39 Akron General Medical Center, Akron, Ohio 28.0 0.0 0.69 3721 1.34 4.0 Yes 3 H, P<br />
40 Meridia Hillcrest <strong>Hospital</strong>, Cleveland 28.0 0.0 0.68 2700 1.26 4.0 Yes 3 H, P<br />
41 Swedish Medical Center, Englewood, Colo. 27.9 0.4 0.63 1498 1.45 4.0 Yes 2 H, P<br />
42 University <strong>of</strong> North Carolina <strong>Hospital</strong>s, Chapel Hill 27.9 2.5 0.94 2621 1.64 4.0 Yes 3 H, P<br />
43 Boulder Community <strong>Hospital</strong>, Boulder, Colo. 27.8 0.0 0.57 1090 1.39 4.0 No 3 H, P<br />
44 Martin Memorial Medical Center, Stuart, Fla. 27.8 0.0 0.57 2928 1.25 4.0 No 3 H<br />
45 Mercy <strong>Hospital</strong>, Coon Rapids, Minn. 27.8 0.0 0.53 1240 0.65 3.5 Yes 2 H, P<br />
46 Regions <strong>Hospital</strong>, Saint Paul, Minn. 27.8 0.0 0.61 1911 0.39 3.5 Yes 3 H, P<br />
47 University <strong>Hospital</strong>, Cincinnati 27.8 0.0 0.66 1676 1.16 4.0 Yes 3 H, P<br />
48 Providence Holy Cross Medical Center, Mission Hills, Calif. 27.8 0.0 0.63 1129 0.82 4.0 Yes 3 H, P<br />
49 MetroHealth Medical Center, Cleveland 27.8 0.4 0.68 1733 0.66 4.0 Yes 3 H, P<br />
50 Fairview <strong>Hospital</strong>, Cleveland 27.7 0.0 0.66 2061 0.95 4.0 Yes 3 H, P
<strong>2003</strong> Rheumatology Best <strong>Hospital</strong> List<br />
<strong>Hospital</strong>wide Technology Discharge<br />
U.S. News Reputational mortality R.N.'s score planning Palliative<br />
Rank <strong>Hospital</strong> <strong>Index</strong> score rate to beds (<strong>of</strong> 5) (<strong>of</strong> 3) care<br />
1 Mayo Clinic, Rochester, Minn. 100.0 51.2 0.79 1.51 5.0 3 Yes<br />
2 Johns Hopkins <strong>Hospital</strong>, Baltimore 99.5 50.4 0.74 1.76 5.0 3 Yes<br />
3 <strong>Hospital</strong> for Special Surgery, New York 74.3 25.3 0.06 1.72 5.0 3 Yes<br />
4 Cleveland Clinic 71.3 28.4 0.67 2.12 5.0 3 Yes<br />
5 UCLA Medical Center, Los Angeles 66.7 27.0 0.89 1.94 5.0 3 Yes<br />
6 University <strong>of</strong> Alabama <strong>Hospital</strong> at Birmingham 62.7 24.8 0.97 1.45 5.0 3 Yes<br />
7 Massachusetts General <strong>Hospital</strong>, Boston 61.0 22.7 0.88 1.82 5.0 3 Yes<br />
8 Brigham and Women's <strong>Hospital</strong>, Boston 57.2 19.0 0.76 1.64 4.5 3 Yes<br />
9 Duke University Medical Center, Durham, N.C. 49.3 14.3 0.92 2.55 5.0 3 Yes<br />
10 University <strong>of</strong> California, San Francisco Medical Center 46.7 11.4 0.83 2.02 5.0 3 Yes<br />
11 <strong>Hospital</strong> for Joint Diseases Orthopedic Institute, New York 45.2 6.1 0.31 1.04 4.0 3 Yes (+3 SD)<br />
12 Stanford <strong>Hospital</strong> and Clinics, Stanford, Calif. 42.4 11.3 0.89 1.56 3.0 3 No<br />
13 University <strong>of</strong> Pittsburgh Medical Center 42.0 8.3 0.88 1.52 5.0 3 Yes<br />
14 Barnes-Jewish <strong>Hospital</strong>, St. Louis 40.9 7.2 0.84 1.46 5.0 3 Yes<br />
15 University <strong>of</strong> Michigan Medical Center, Ann Arbor 40.7 5.9 0.74 1.87 5.0 3 Yes<br />
16 Denver Health and <strong>Hospital</strong>s 39.9 0.0 0.06 2.00 4.0 3 Yes<br />
17 University <strong>of</strong> Chicago <strong>Hospital</strong>s 39.0 5.2 0.80 1.86 5.0 3 Yes<br />
18 Benedictine <strong>Hospital</strong>, Kingston, N.Y. 38.5 0.0 0.02 0.54 3.5 3 Yes<br />
19 NYU Medical Center, New York 38.1 7.2 1.01 1.18 4.5 3 Yes<br />
20 University <strong>of</strong> Colorado <strong>Hospital</strong>, Denver 38.0 3.0 0.65 2.25 5.0 3 Yes<br />
21 University <strong>of</strong> Washington Medical Center, Seattle 37.6 5.7 0.72 1.38 5.0 2 No (+2 SD)<br />
22 University <strong>Hospital</strong>s <strong>of</strong> Cleveland 36.7 2.2 0.67 1.84 5.0 3 Yes<br />
23 St. Luke's-Cornwall <strong>Hospital</strong>, Newburgh, N.Y. 36.6 0.0 0.11 0.75 3.0 3 No<br />
24 Hughston Sports Medicine <strong>Hospital</strong>, Columbus, Ga. 36.5 0.0 0.14 0.80 3.0 3 No<br />
25 Rehabilitation Institute <strong>of</strong> Michigan, Detroit 36.4 0.0 0.09 0.65 2.5 2 Yes<br />
26 Northwestern Memorial <strong>Hospital</strong>, Chicago 36.2 4.3 0.92 1.87 5.0 3 Yes<br />
27 Parkland Memorial <strong>Hospital</strong>, Dallas 36.2 3.8 0.87 1.72 5.0 3 Yes<br />
28 New York-Presbyterian <strong>Hospital</strong> 35.5 6.4 1.17 1.41 5.0 3 Yes<br />
29 National Rehabilitation <strong>Hospital</strong>, Washington, D.C. 35.4 0.0 0.13 0.51 2.0 3 No<br />
30 Methodist Rehabilitation Center, Jackson, Miss. 35.1 0.0 0.16 0.48 2.0 3 No<br />
31 Christ <strong>Hospital</strong>, Cincinnati 34.9 0.0 0.52 1.07 4.5 3 Yes<br />
32 <strong>Hospital</strong> <strong>of</strong> the University <strong>of</strong> Pennsylvania, Philadelphia 34.7 5.3 1.01 1.79 5.0 3 No<br />
33 Rehabilitation Institute <strong>of</strong> Chicago 34.5 0.0 0.09 0.38 2.5 2 No<br />
34 Summa Health System, Akron, Ohio 34.4 0.0 0.62 2.21 5.0 3 Yes<br />
35 Grandview <strong>Hospital</strong> and Medical Center, Dayton, Ohio 34.4 0.0 0.57 1.24 4.5 3 Yes<br />
36 Baptist Health Rehabilitation Institute, Little Rock, Ark. 34.3 0.0 0.08 0.18 2.5 2 No<br />
37 University <strong>of</strong> Miami, Jackson Memorial <strong>Hospital</strong> 34.3 1.8 0.82 1.53 5.0 3 Yes<br />
38 Beth Israel Deaconess Medical Center, Boston 34.2 2.3 0.80 2.23 4.0 3 Yes<br />
39 Georgetown University <strong>Hospital</strong>, Washington, D.C. 33.9 0.7 0.73 1.51 5.0 3 Yes<br />
40 West Jefferson Medical Center, Marrero, La. 33.9 0.0 0.43 0.97 4.0 3 No<br />
41 Abbott Northwestern <strong>Hospital</strong>, Minneapolis 33.6 0.0 0.66 1.24 5.0 3 Yes<br />
42 Fairview-University Medical Center, Minneapolis 33.6 0.7 0.68 0.50 5.0 3 Yes<br />
43 Vanderbilt University Medical Center, Nashville 33.6 2.7 0.95 2.24 5.0 3 Yes<br />
44 Rusk Rehabilitation Center, Columbia, Mo. 33.5 0.0 0.02 0.32 1.5 2 No<br />
45 Sheltering Arms Rehabilitation <strong>Hospital</strong>, Richmond, Va. 33.5 0.0 0.13 0.28 1.5 2 No<br />
46 Advocate Lutheran General <strong>Hospital</strong>, Park Ridge, Ill. 33.4 0.4 0.62 0.94 4.0 3 Yes<br />
47 Ingalls <strong>Hospital</strong>, Harvey, Ill. 33.4 0.0 0.64 0.67 5.0 3 Yes<br />
48 University <strong>of</strong> Iowa <strong>Hospital</strong>s and Clinics, Iowa City 33.3 1.6 0.85 1.35 5.0 3 Yes<br />
49 Scripps Mercy <strong>Hospital</strong>, San Diego 33.3 0.8 0.68 0.88 4.0 3 Yes<br />
50 Marianjoy Rehabilitation <strong>Hospital</strong> and Clinics, Wheaton, Ill. 33.3 0.0 0.03 0.20 0.0 3 No
<strong>2003</strong> Urology Best <strong>Hospital</strong> List<br />
Technology<br />
U.S. News Reputational Mortality R.N.'s score Trauma<br />
Rank <strong>Hospital</strong> <strong>Index</strong> score rate Discharges to beds (<strong>of</strong> 8) Center<br />
1 Johns Hopkins <strong>Hospital</strong>, Baltimore 100.0 75.7 0.75 1321 1.76 7.5 Yes<br />
2 Cleveland Clinic 80.3 55.0 0.50 1790 2.12 8.0 No<br />
3 Mayo Clinic, Rochester, Minn. 65.1 39.9 0.76 3871 1.51 8.0 No<br />
4 UCLA Medical Center, Los Angeles 53.3 28.2 1.30 1313 1.94 8.0 Yes<br />
5 Barnes-Jewish <strong>Hospital</strong>, St. Louis 49.1 21.7 0.84 1648 1.46 8.0 Yes<br />
6 Massachusetts General <strong>Hospital</strong>, Boston 46.4 17.7 0.58 1274 1.82 8.0 Yes<br />
7 Memorial Sloan-Kettering Cancer Center, New York 46.2 18.7 0.40 1096 2.32 7.0 No<br />
8 Duke University Medical Center, Durham, N.C. 45.2 17.4 0.82 1654 2.55 8.0 Yes<br />
9 Methodist <strong>Hospital</strong>, Houston 40.7 14.3 0.71 1406 1.33 7.5 No<br />
10 New York-Presbyterian <strong>Hospital</strong> 40.3 14.9 1.37 3438 1.41 8.0 Yes<br />
11 University <strong>of</strong> California, San Francisco Medical Center 39.7 14.5 0.98 798 2.02 8.0 No (+3 SD)<br />
12 University <strong>of</strong> Michigan Medical Center, Ann Arbor 37.5 8.4 0.64 1275 1.87 8.0 Yes<br />
13 University <strong>of</strong> Texas, M. D. Anderson Cancer Center, Houston 36.8 10.6 0.78 880 2.97 7.0 No<br />
14 Stanford <strong>Hospital</strong> and Clinics, Stanford, Calif. 35.6 12.4 1.16 672 1.56 5.5 No<br />
15 University <strong>of</strong> Virginia Medical Center, Charlottesville 35.3 5.1 0.10 677 2.25 8.0 Yes<br />
16 Lahey Clinic, Burlington, Mass. 34.7 4.2 0.10 905 1.46 7.0 Yes<br />
17 Northwestern Memorial <strong>Hospital</strong>, Chicago 34.2 4.2 0.46 1269 1.87 8.0 Yes<br />
18 Clarian Health Partners (IU and Methodist <strong>Hospital</strong>s), Indianapolis 33.7 7.2 0.64 1643 0.94 8.0 No<br />
19 <strong>Hospital</strong> <strong>of</strong> the University <strong>of</strong> Pennsylvania, Philadelphia 33.5 6.2 1.12 1032 1.79 8.0 Yes<br />
20 Vanderbilt University Medical Center, Nashville 33.4 4.4 0.67 953 2.24 7.5 Yes (+2 SD)<br />
21 University <strong>of</strong> Iowa <strong>Hospital</strong>s and Clinics, Iowa City 32.4 4.4 0.68 695 1.35 8.0 Yes<br />
22 Yale-New Haven <strong>Hospital</strong>, New Haven, Conn. 31.2 0.8 0.29 838 1.43 8.0 Yes<br />
23 Shands at the University <strong>of</strong> Florida, Gainesville 31.0 2.4 0.76 1017 1.62 7.0 Yes<br />
24 Georgetown University <strong>Hospital</strong>, Washington, D.C. 30.6 1.4 0.00 351 1.51 8.0 Yes<br />
25 Thomas Jefferson University <strong>Hospital</strong>, Philadelphia 30.6 1.7 0.69 951 1.62 7.0 Yes<br />
26 North Carolina Baptist <strong>Hospital</strong>, Winston-Salem 30.5 2.1 0.87 895 1.68 8.0 Yes<br />
27 Henry Ford <strong>Hospital</strong>, Detroit 30.3 0.4 0.51 969 1.79 7.5 Yes<br />
28 St. Joseph Mercy <strong>Hospital</strong>, Ann Arbor 30.2 0.0 0.27 803 1.85 7.0 Yes<br />
29 Brigham and Women's <strong>Hospital</strong>, Boston 30.0 4.2 1.21 671 1.64 7.5 Yes<br />
30 William Beaumont <strong>Hospital</strong>, Royal Oak, Mich. 29.9 0.4 0.66 1916 1.75 8.0 Yes<br />
31 NYU Medical Center, New York 29.7 4.1 1.33 1493 1.18 7.5 Yes<br />
32 Emory University <strong>Hospital</strong>, Atlanta 29.7 2.8 0.81 1101 1.43 7.5 No<br />
33 University <strong>of</strong> Wisconsin <strong>Hospital</strong> and Clinics, Madison 29.6 0.4 0.51 1142 1.05 8.0 Yes<br />
34 Abbott Northwestern <strong>Hospital</strong>, Minneapolis 29.4 0.0 0.52 903 1.24 8.0 Yes<br />
35 University <strong>Hospital</strong>s <strong>of</strong> Cleveland 29.4 0.8 0.68 735 1.84 8.0 Yes<br />
36 University <strong>of</strong> Miami, Jackson Memorial <strong>Hospital</strong> 29.3 2.3 0.62 663 1.53 8.0 No<br />
37 Washington <strong>Hospital</strong> Center, Washington, D.C. 29.3 0.6 0.61 935 1.43 6.0 Yes<br />
38 Cox Health Systems, Springfield, Mo. 29.2 0.0 0.63 1148 1.30 8.0 Yes<br />
39 St. John's Regional Health Center, Springfield, Mo. 29.2 0.0 0.39 959 0.87 7.5 Yes<br />
40 Carolinas Medical Center, Charlotte, N.C. 29.0 0.0 0.73 1062 1.60 7.5 Yes<br />
41 Sentara Norfolk General <strong>Hospital</strong>, Norfolk, Va. 29.0 0.0 0.61 908 1.32 7.5 Yes<br />
42 Wesley Medical Center, Wichita, Kan. 29.0 0.0 0.43 801 1.23 7.0 Yes<br />
43 Good Samaritan Regional Medical Center, Phoenix 29.0 0.0 0.29 610 1.14 7.5 Yes<br />
44 University <strong>of</strong> Pittsburgh Medical Center 28.9 0.3 0.84 910 1.52 8.0 Yes<br />
45 Pitt County Memorial <strong>Hospital</strong>, Greenville, N.C. 28.9 0.0 0.53 798 1.20 8.0 Yes<br />
46 Froedtert Memorial Lutheran <strong>Hospital</strong>, Milwaukee 28.9 0.4 0.57 698 1.46 7.0 Yes<br />
47 Baylor University Medical Center, Dallas 28.9 1.2 1.08 1222 1.62 8.0 Yes<br />
48 Florida <strong>Hospital</strong>, Orlando 28.9 0.6 0.58 1975 1.65 8.0 No<br />
49 Memorial Regional <strong>Hospital</strong>, Hollywood, Fla. 28.8 0.0 0.19 298 1.34 8.0 Yes<br />
50 Danbury <strong>Hospital</strong>, Danbury, Conn. 28.8 0.0 0.26 320 1.42 8.0 Yes
Appendix G<br />
Reputation Rankings for<br />
Special-Service <strong>Hospital</strong>s
<strong>2003</strong> Ophthalmology Reputational Score<br />
Reputational<br />
Rank <strong>Hospital</strong> Score<br />
1 Wilmer Eye Institute, Johns Hopkins <strong>Hospital</strong>, Baltimore 79.4<br />
2 Bascom Palmer Eye Institute, Miami 76.6<br />
3 Wills Eye <strong>Hospital</strong>, Philadelphia 61.7 (+3 SD)<br />
4 Massachusetts Eye and Ear Infirmary, Boston 43.1<br />
5 Jules Stein Eye Institute, UCLA Medical Center, Los Angeles 37.3 (+2 SD)<br />
6 University <strong>of</strong> Iowa <strong>Hospital</strong>s and Clinics, Iowa City 22.9<br />
7 Doheny Eye Institute, USC University <strong>Hospital</strong>, Los Angeles 13.1<br />
8 Duke University Medical Center, Durham, N.C. 11.2<br />
9 Barnes-Jewish <strong>Hospital</strong>, St. Louis 10.6<br />
10 Mayo Clinic, Rochester, Minn. 8.8<br />
11 Cleveland Clinic 8.2<br />
12 University <strong>of</strong> California, San Francisco Medical Center 6.8<br />
13 Cullen Eye Institute, Methodist <strong>Hospital</strong>, Houston 6.1<br />
14 University <strong>of</strong> Michigan Medical Center, Ann Arbor 5.2<br />
15 Emory University <strong>Hospital</strong>, Atlanta 5.2<br />
16 New York Eye and Ear Infirmary, New York 5.0<br />
17 Manhattan Eye, Ear and Throat <strong>Hospital</strong>, New York 3.7<br />
18 New York-Presbyterian <strong>Hospital</strong> 3.6<br />
19 University <strong>of</strong> Illinois Medical Center at Chicago 3.6<br />
20 <strong>Hospital</strong> <strong>of</strong> the University <strong>of</strong> Pennsylvania, Philadelphia 3.1
<strong>2003</strong> Pediatrics Reputational Score<br />
Reputational<br />
Rank <strong>Hospital</strong> Score<br />
1 Children's <strong>Hospital</strong> <strong>of</strong> Philadelphia 58.0<br />
2 Children's <strong>Hospital</strong> Boston 55.4<br />
3 Johns Hopkins <strong>Hospital</strong>, Baltimore 35.4 (+3 SD)<br />
(+2 SD)<br />
4 Children's <strong>Hospital</strong> <strong>of</strong> New York-Presbyterian 18.0<br />
5 Texas Children's <strong>Hospital</strong>, Houston 13.9<br />
6 Rainbow Babies & Children's <strong>Hospital</strong>, Cleveland 13.9<br />
7 Children's <strong>Hospital</strong> <strong>of</strong> Pittsburgh 12.9<br />
8 Children's <strong>Hospital</strong> Medical Center, Cincinnati 12.9<br />
9 Children's <strong>Hospital</strong>, Denver 11.3<br />
10 University <strong>of</strong> California, San Francisco Medical Center 10.5<br />
11 Children's Memorial <strong>Hospital</strong>, Chicago 9.8<br />
12 Childrens <strong>Hospital</strong> Los Angeles 9.6<br />
13 Mattel Children's <strong>Hospital</strong> at UCLA, Los Angeles 8.8<br />
14 Children's National Medical Center, Washington, D.C. 8.6<br />
15 Children's <strong>Hospital</strong> and Medical Center, Seattle 7.8<br />
16 Massachusetts General <strong>Hospital</strong>, Boston 7.6<br />
17 Mayo Clinic, Rochester, Minn. 7.5<br />
18 Lucile Packard Children's <strong>Hospital</strong> at Stanford, Palo Alto, Calif. 7.4<br />
19 Duke University Medical Center, Durham, N.C. 5.9<br />
20 St. Jude Children's Research <strong>Hospital</strong>, Memphis 5.1<br />
21 St. Louis Children's <strong>Hospital</strong> 4.4<br />
22 St. Christopher's <strong>Hospital</strong> for Children, Philadelphia 4.1<br />
23 Barnes-Jewish <strong>Hospital</strong>, St. Louis 3.9<br />
24 Miami Children's <strong>Hospital</strong> 3.5<br />
25 NYU Medical Center, New York 3.3<br />
26 Yale-New Haven <strong>Hospital</strong>, New Haven, Conn. 3.2<br />
27 Strong Memorial <strong>Hospital</strong>-University <strong>of</strong> Rochester, N.Y. 3.0<br />
28 Cleveland Clinic 3.0
<strong>2003</strong> Psychiatry Reputational Score<br />
Reputational<br />
Rank <strong>Hospital</strong> Score<br />
1 Massachusetts General <strong>Hospital</strong>, Boston 51.4<br />
2 New York-Presbyterian <strong>Hospital</strong> 40.5<br />
3 Johns Hopkins <strong>Hospital</strong>, Baltimore 34.8<br />
4 McLean <strong>Hospital</strong>, Belmont, Mass. 26.4 (+3 SD)<br />
5 <strong>The</strong> Menninger Clinic, Houston 23.5<br />
6 UCLA Neuropsychiatric <strong>Hospital</strong>, Los Angeles 22.6 (+2 SD)<br />
7 Yale-New Haven <strong>Hospital</strong>, New Haven, Conn. 15.5<br />
8 Mayo Clinic, Rochester, Minn. 14.3<br />
9 Stanford <strong>Hospital</strong> and Clinics, Stanford, Calif. 12.5<br />
10 Duke University Medical Center, Durham, N.C. 12.3<br />
11 Sheppard and Enoch Pratt <strong>Hospital</strong>, Baltimore 11.5<br />
12 University <strong>of</strong> Pittsburgh Medical Center 9.0<br />
13 Austen Riggs Center, Stockbridge, Mass. 7.6<br />
14 University <strong>of</strong> Iowa <strong>Hospital</strong>s and Clinics, Iowa City 7.2<br />
15 Barnes-Jewish <strong>Hospital</strong>, St. Louis 6.9<br />
16 University <strong>of</strong> California, San Francisco Medical Center 6.8<br />
17 Emory University <strong>Hospital</strong>, Atlanta 6.8<br />
18 NYU Medical Center, New York 6.3<br />
19 <strong>Hospital</strong> <strong>of</strong> the University <strong>of</strong> Pennsylvania, Philadelphia 5.9<br />
20 University <strong>of</strong> Michigan Medical Center, Ann Arbor 5.8<br />
21 Methodist <strong>Hospital</strong>, Houston 4.3<br />
22 Cleveland Clinic 4.0<br />
23 Montefiore Medical Center, Bronx, N.Y. 3.9<br />
24 Parkland Memorial <strong>Hospital</strong>, Dallas 3.9<br />
25 Medical University <strong>of</strong> South Carolina, Charleston 3.8<br />
26 Butler <strong>Hospital</strong>, Providence, R.I. 3.5<br />
27 University <strong>of</strong> Washington Medical Center, Seattle 3.5<br />
28 Ohio State University Medical Center, Columbus 3.3<br />
29 Mount Sinai Medical Center, New York 3.0<br />
30 University <strong>of</strong> Maryland Medical System, Baltimore 3.0
<strong>2003</strong> Rehabilitation Reputational Score<br />
Reputational<br />
Rank <strong>Hospital</strong> Score<br />
1 Rehabilitation Institute <strong>of</strong> Chicago 72.2<br />
2 TIRR-<strong>The</strong> Institute for Rehabilitation and Research, Houston 42.3<br />
3 University <strong>of</strong> Washington Medical Center, Seattle 37.7<br />
4 Mayo Clinic, Rochester, Minn. 30.7 (+3 SD)<br />
5 Craig <strong>Hospital</strong>, Englewood, Colo. 26.7<br />
6 Kessler Institute for Rehabilitation, West Orange, N.J. 26.1 (+2 SD)<br />
7 Rusk Institute, NYU Medical Center, New York 15.1<br />
8 Thomas Jefferson University <strong>Hospital</strong>, Philadelphia 15.0<br />
9 Spaulding Rehabilitation <strong>Hospital</strong>, Boston 14.7<br />
10 Ohio State University Medical Center, Columbus 14.2<br />
11 Rancho Los Amigos National Rehabilitation Center, Downey, Calif. 13.5<br />
12 Johns Hopkins <strong>Hospital</strong>, Baltimore 12.7<br />
13 National Rehabilitation <strong>Hospital</strong>, Washington, D.C. 11.2<br />
14 University <strong>of</strong> Michigan Medical Center, Ann Arbor 9.5<br />
15 Moss Rehabilitation <strong>Hospital</strong>, Albert Einstein Medical Center, Philadelphia 8.1<br />
16 Shepherd Center, Atlanta 6.6<br />
17 Mount Sinai Medical Center, New York 5.3<br />
18 Stanford <strong>Hospital</strong> and Clinics, Stanford, Calif. 4.4<br />
19 Temple University <strong>Hospital</strong>, Philadelphia 4.0<br />
20 UCLA Medical Center, Los Angeles 3.8<br />
21 New York-Presbyterian <strong>Hospital</strong> 3.8<br />
22 Cleveland Clinic 3.7<br />
23 University <strong>of</strong> Alabama <strong>Hospital</strong> at Birmingham 3.3
Appendix H<br />
<strong>The</strong> <strong>2003</strong> “Honor Roll”
<strong>The</strong> Honor Roll<br />
To lend additional perspective, we have constructed a measure called the Honor Roll to<br />
indicate excellence across a broad range <strong>of</strong> specialties.<br />
To be listed on the Honor Roll, a hospital must rank at least two standard deviations (SDs)<br />
above the mean in at least six <strong>of</strong> the 17 specialties. A hospital’s ranking in the Honor Roll<br />
is based on points, assigned as follows:<br />
C If a hospital ranks between two and three SDs above the mean in a<br />
specialty, it receives one point.<br />
C If a hospital ranks at least three SDs above the mean, it receives two points.<br />
Using standard deviations above the mean as the criteria for inclusion in the Honor Roll sets<br />
a threshold for overall excellence. <strong>The</strong> Honor Roll also gives an indication <strong>of</strong> the relative<br />
distances between the best hospitals which is not possible to determine solely from the<br />
rankings.
<strong>The</strong> <strong>2003</strong> Honor Roll<br />
Rank <strong>Hospital</strong> Points 3 SDs<br />
over<br />
the<br />
mean<br />
1 Johns Hopkins <strong>Hospital</strong>, Baltimore 32 16 0<br />
2 Mayo Clinic, Rochester, Minn. 28 14 0<br />
3 UCLA Medical Center, Los Angeles 24 10 4<br />
4 Massachusetts General <strong>Hospital</strong>, Boston 24 12 0<br />
5 Cleveland Clinic 23 11 1<br />
6 Duke University Medical Center, Durham, N.C. 22 9 4<br />
7 University <strong>of</strong> California, San Francisco Medical Center 21 9 3<br />
8 Barnes-Jewish <strong>Hospital</strong>, St. Louis 18 6 6<br />
9 University <strong>of</strong> Michigan Medical Center, Ann Arbor 16 5 6<br />
10 University <strong>of</strong> Washington Medical Center, Seattle 15 5 5<br />
11 New York-Presbyterian <strong>Hospital</strong> 15 6 3<br />
12 Brigham and Women’s <strong>Hospital</strong>, Boston 14 6 2<br />
13 <strong>Hospital</strong> <strong>of</strong> the University <strong>of</strong> Pennsylvania, Philadelphia 13 4 5<br />
14 University <strong>of</strong> Chicago <strong>Hospital</strong>s 10 3 4<br />
15 Stanford <strong>Hospital</strong> and Clinics, Stanford, Calif. 9 2 5<br />
15 University <strong>of</strong> Pittsburgh Medical Center 9 2 5<br />
17 Vanderbilt University Medical Center, Nashville 8 2 4<br />
2 SDs<br />
over<br />
the<br />
mean
Contact Information<br />
This document can be viewed or downloaded online in its entirety and is available at the<br />
NORC website at the following address: http://norc.uchicago.edu<br />
Specific questions or comments about the contents <strong>of</strong> this report can be sent via e-mail to<br />
Best<strong>Hospital</strong>s@norcmail.uchicago.edu