The 2003 Index of Hospital Quality
The 2003 Index of Hospital Quality
The 2003 Index of Hospital Quality

Create successful ePaper yourself
Turn your PDF publications into a flip-book with our unique Google optimized e-Paper software.
<strong>The</strong> <strong>2003</strong><br />
<strong>Index</strong> <strong>of</strong><br />
<strong>Hospital</strong><br />
<strong>Quality</strong><br />
Colm O’Muircheartaigh<br />
Ann Burke<br />
Whitney Murphy
To Whom It May Concern:<br />
U.S. News & World Report’s “America’s Best <strong>Hospital</strong>s” study is the sole and exclusive property<br />
<strong>of</strong> U.S. News & World Report, which owns all rights, including but not limited to copyright, in and<br />
to the attached data and material. Any party wishing to cite, reference, publish or otherwise<br />
disclose the information contained herein may do so only with the prior written consent <strong>of</strong> U.S.<br />
News. Any U.S. News-approved reference or citation must identify the source as “U.S. News &<br />
World Report’s America’s Best <strong>Hospital</strong>s” and with the exception <strong>of</strong> academic journals must include<br />
the credit line: “Data reprinted with permission from U.S. News & World Report.” For permission<br />
to cite or use in any other way, contact permissions@usnews.com or send a written request to<br />
Permissions Department, U.S. News & World Report, 1050 Thomas Jefferson Street, N.W.,<br />
Washington, D.C. 20007-3837. For custom reprints or photocopying permissions, please contact<br />
Robyn Roberts at (212) 221-9595, Extension 323 or robyn@parsintl.com.<br />
1050 Thomas Jefferson Street, N.W., Washington, DC 20007-3837<br />
Tel: 202-955-2000<br />
U.S. News Online: http://www.usnews.com
NORC 6126
<strong>The</strong> <strong>2003</strong> <strong>Index</strong> <strong>of</strong> <strong>Hospital</strong> <strong>Quality</strong><br />
I Introduction . . . . . . . . . . . . . . . . . . . . . . . . . . . . . . . . . . . . . . . . . . . . . . . 1<br />
II <strong>The</strong> <strong>Index</strong> <strong>of</strong> <strong>Hospital</strong> <strong>Quality</strong><br />
A. Universe Definition . . . . . . . . . . . . . . . . . . . . . . . . . . . . . . . . . . . 4<br />
B. Composite Measures <strong>of</strong> Structure . . . . . . . . . . . . . . . . . . . . . . . 8<br />
C. Process . . . . . . . . . . . . . . . . . . . . . . . . . . . . . . . . . . . . . . . . . . . . 16<br />
D. Outcome . . . . . . . . . . . . . . . . . . . . . . . . . . . . . . . . . . . . . . . . . . . 23<br />
E. Calculation <strong>of</strong> the <strong>Index</strong> . . . . . . . . . . . . . . . . . . . . . . . . . . . . . . . 26<br />
F. Summary <strong>of</strong> Changes for <strong>2003</strong> . . . . . . . . . . . . . . . . . . . . . . . . . . 29<br />
III Directions for Future Releases . . . . . . . . . . . . . . . . . . . . . . . . . . . . . . . 30<br />
IV References . . . . . . . . . . . . . . . . . . . . . . . . . . . . . . . . . . . . . . . . . . . . . . . 31<br />
V Appendices<br />
A. Structural Variable Map<br />
B. 2002 Sample Physician Questionnaire (Long Form)<br />
C. 2002/<strong>2003</strong> Sample Physician Questionnaire (Short Form)<br />
D. Predicted Mortality: APR-DRG Methodology<br />
E. Diagnosis-Related Group (DRG) Groupings by Specialty<br />
F. <strong>Index</strong> <strong>of</strong> <strong>Hospital</strong> <strong>Quality</strong> (IHQ) Scores by Specialty<br />
G. Reputation Rankings for Special-Service <strong>Hospital</strong>s<br />
H. <strong>The</strong> <strong>2003</strong> “Honor Roll”
I Introduction<br />
Health care providers and consumers today face a dynamic and <strong>of</strong>ten puzzling array <strong>of</strong><br />
choices with few tools to inform their critical decisions about quality <strong>of</strong> care. No single<br />
standard measure <strong>of</strong> quality <strong>of</strong> care is available for the 6,003 hospitals in the United States.<br />
In 1993, the National Opinion Research Center at the University <strong>of</strong> Chicago (NORC)<br />
developed such a measure. This “report card” is supported and published annually by U.S.<br />
News & World Report in an issue entitled “America’s Best <strong>Hospital</strong>s” that identifies centers<br />
<strong>of</strong> exceptional capability in 17 medical specialties.<br />
In the NORC report card, each hospital receives a score called the <strong>Index</strong> <strong>of</strong> <strong>Hospital</strong> <strong>Quality</strong><br />
(IHQ), which assesses hospital quality by taking into account the three fundamental<br />
dimensions <strong>of</strong> health care delivery: structure, process, and outcome (the Donabedian<br />
paradigm 1,2 ). None <strong>of</strong> these dimensions alone can completely and accurately represent<br />
quality <strong>of</strong> care; all three must be combined to produce a comprehensive measure. Care<br />
starts with the structural characteristics <strong>of</strong> an institution (such as the number <strong>of</strong> patients<br />
served and the range <strong>of</strong> medical technology available), moves through the process <strong>of</strong><br />
delivering care, and produces results, or outcomes, for the patients served. To be most<br />
useful to the consumer and provider <strong>of</strong> care, the IHQ combines robust and sensitive<br />
measures <strong>of</strong> each <strong>of</strong> these dimensions for the universe <strong>of</strong> hospitals across a wide range <strong>of</strong><br />
medical and surgical practice specialties. <strong>The</strong> IHQ draws from secondary sources, such<br />
as the American <strong>Hospital</strong> Association (AHA) Annual Survey <strong>of</strong> <strong>Hospital</strong>s, for data<br />
concerning various quality dimensions. We continually try to improve the specificity and<br />
sensitivity <strong>of</strong> the measures we use to rank hospitals and to identify the best possible<br />
sources <strong>of</strong> data.<br />
<strong>The</strong> following sections define the universe <strong>of</strong> hospitals for the purpose <strong>of</strong> this project,<br />
describe and define the standardized mortality ratios and the structural components, and<br />
explain how process-related data are collected. A description <strong>of</strong> changes made for the<br />
<strong>2003</strong> IHQ is also provided. A short description <strong>of</strong> each <strong>of</strong> the component <strong>of</strong> the index is<br />
provided below:<br />
1
Reputation<br />
Structure<br />
<strong>The</strong> reputational score is based on cumulative information from three NORC<br />
surveys <strong>of</strong> physicians carried out in 2001, 2002, and <strong>2003</strong>. For the 2001 and <strong>2003</strong><br />
surveys, the samples consisted <strong>of</strong> 2,550 board-certified physicians selected from the<br />
American Medical Association (AMA) Physician Masterfile <strong>of</strong> approximately 811,000<br />
physicians. In 2002 the overall sample size was increased from 2,550 to 3,060 to<br />
test response rates when administering a short form questionnaire versus a long<br />
form questionnaire. <strong>The</strong> samples <strong>of</strong> physicians for each year were stratified by<br />
region and by specialty within region. We selected a sample <strong>of</strong> 150 physicians for<br />
each <strong>of</strong> the 17 specialty areas in both 2001 and <strong>2003</strong>. In 2002, 180 physicians were<br />
selected in each specialty.<br />
<strong>The</strong> final aggregated sample includes both non-federal and federal medical and<br />
osteopathic physicians residing in the fifty states and the District <strong>of</strong> Columbia.<br />
<strong>The</strong> structural score is based on data related to the structural characteristics <strong>of</strong> each<br />
specialty within each hospital. <strong>The</strong>se elements represent volume <strong>of</strong> work,<br />
technology, and other characteristics <strong>of</strong> the hospital environment. <strong>The</strong> majority <strong>of</strong><br />
the data elements are derived from the 2001 AHA Annual Survey. <strong>The</strong> volume data<br />
are taken from the MEDPARS database, maintained by the Centers for Medicare<br />
and Medicaid Services (CMS). It contains information on all Medicare discharges<br />
in each specialty. CMS is the federal agency formerly known as the Health Care<br />
Financing Administration (HCFA).<br />
2
Mortality<br />
<strong>The</strong> outcomes measure is based on CMS’s MEDPARS database. An adjusted<br />
mortality rate for each hospital and specialty is computed based on predicted and<br />
actual mortality rates by MEDSTAT Group, Inc. <strong>of</strong> Franklin, Tenn., using the All<br />
Patient Refined Diagnosis Related Group (APR-DRG) method designed by 3M<br />
Health Information Systems. <strong>The</strong> APR-DRG adjusts expected deaths for severity<br />
<strong>of</strong> illness by means <strong>of</strong> principal diagnosis and categories <strong>of</strong> secondary diagnoses.<br />
<strong>The</strong> method is applied to the pooled 1999, 2000 and 2001 set <strong>of</strong> Medicare<br />
reimbursement claims made to CMS by hospitals.<br />
A detailed description <strong>of</strong> these components follows in Section II <strong>of</strong> this report. For a more<br />
exhaustive review <strong>of</strong> the foundation as well as <strong>of</strong> the development and use <strong>of</strong> the individual<br />
measures and the composite index, see “Best <strong>Hospital</strong>s: A Description <strong>of</strong> the Methodology<br />
for the <strong>Index</strong> <strong>of</strong> <strong>Hospital</strong> <strong>Quality</strong>.” 3<br />
3
II <strong>The</strong> <strong>Index</strong> <strong>of</strong> <strong>Hospital</strong> <strong>Quality</strong> (IHQ)<br />
A. Universe Definition<br />
We have implemented a two-stage approach to defining eligible hospitals for each <strong>of</strong> the<br />
IHQ specialty lists. (<strong>Hospital</strong>s ranked solely by reputation do not have to meet<br />
eligibility standards.) First, eligible hospitals must meet at least one <strong>of</strong> the following<br />
criteria:<br />
1) Council <strong>of</strong> Teaching <strong>Hospital</strong>s (COTH) membership, or<br />
2) Medical school affiliation, or<br />
3) A score <strong>of</strong> 9 or higher on the hospital-wide technology index (see Part II, Section<br />
B)<br />
Using these criteria, we identified 2,072 hospitals that were eligible in <strong>2003</strong> for one or more<br />
<strong>of</strong> the 13 IHQ-based rankings. Once eligible hospitals were identified, data for them were<br />
drawn from the 2001 AHA Annual Survey database.<br />
As with any data collection effort, the AHA Annual Survey database is incomplete due to<br />
non-responding hospitals. We have a procedure to allow eligible hospitals that are nonresponders<br />
to the current AHA Annual Survey to remain in our database. First, for all<br />
previously ranked hospitals, we average the two prior years <strong>of</strong> survey data and substitute<br />
the result for the missing data. <strong>Hospital</strong>s lacking data both from the current survey and from<br />
one <strong>of</strong> the previous two surveys are ranked without any structure data. Although nonresponding<br />
hospitals need to be treated separately for the IHQ analysis, it is unnecessary<br />
to do so for the four reputation-only lists.<br />
4
We then created separate analytic universes for each <strong>of</strong> the 13 IHQ-driven specialties,<br />
using criteria such as specialty-specific technology or facilities. <strong>Hospital</strong>s had to have a<br />
specified number <strong>of</strong> discharges across appropriate DRGs. <strong>Hospital</strong>s with insufficient<br />
volume (discharges) were considered eligible for ranking if they received any reputational<br />
nominations (a non-zero reputational score).<br />
Until 2002, the discharges threshold that determined eligibility included all discharges,<br />
regardless <strong>of</strong> the medical-surgical mix. 1 In 2002 and again this year, the mix in certain<br />
specialties was specified: For Cancer; Digestive Disorders; Ear, Nose, and Throat;<br />
Gynecology; Neurology and Neurosurgery; Orthopedics, and Urology, the median ratio <strong>of</strong><br />
surgical to total discharges for hospitals surpassing the all-discharges threshold was<br />
multiplied by total discharges to obtain a minimum for surgical discharges.<br />
For Heart and Heart Surgery, the minimum number <strong>of</strong> surgical discharges for eligibility was<br />
set at 500. To obtain a minimum threshold for all discharges, this number was multiplied<br />
by the median ratio <strong>of</strong> all discharges to surgical discharges for all hospitals surpassing the<br />
surgical discharges threshold. This resulted in a minimum <strong>of</strong> 1,285 total discharges–500<br />
surgical and 785 medical.<br />
We regularly examine the impact <strong>of</strong> hospital mergers on our rankings. Ranking hospitals<br />
responding as new corporate entities for the first time in the AHA database are treated as<br />
a single unit and listed in this report. For this release, one merger among hospitals<br />
previously ranked as independent entities appears on the lists. This hospital is now called<br />
St. Luke's-Cornwall <strong>Hospital</strong>, Newburgh, N.Y., and is made up <strong>of</strong> two previously separate<br />
hospitals: St. Luke's <strong>Hospital</strong>, Newburgh, N.Y., and Cornwall <strong>Hospital</strong>, Cornwall, N.Y.<br />
Figure 1 presents the eligibility criteria and the number <strong>of</strong> hospitals meeting the criteria<br />
from the 2001 AHA Annual Survey. Figure 2 illustrates the eligibility process.<br />
1 <strong>The</strong> exception until 2002 was Heart and Heart Surgery, in which surgical discharges alone<br />
determine the threshold for eligibility. Beginning in 2002, both medical and surgical discharges determine<br />
eligibility.<br />
5
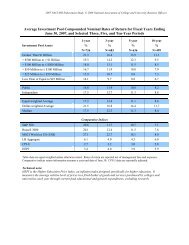
Figure 1. Universe Definition by Specialty<br />
Specialty Minimum<br />
Total<br />
Discharges<br />
6<br />
Minimum<br />
Surgical<br />
Discharges<br />
Number <strong>of</strong><br />
Eligible<br />
<strong>Hospital</strong>s<br />
Cancer 349 78 890<br />
Digestive Disorders 744 209 1,426<br />
Ear, Nose, and Throat 38 4 1,295<br />
Geriatrics* 5,967 -- 1,392<br />
Gynecology 49 46 1,493<br />
Heart and Heart Surgery** 1,285 500 770<br />
Hormonal Disorders 381 -- 1,040<br />
Kidney Disease 200 -- 1,527<br />
Neurology and Neurosurgery 455 80 1,245<br />
Orthopedics 387 345 1,511<br />
Respiratory disorders 873 -- 1,547<br />
Rheumatology 23 -- 1,536<br />
Urology 121 106 1,467<br />
* In addition to the discharge eligibility criteria, a hospital must have a score <strong>of</strong> 1 or more on the<br />
Geriatrics service index for inclusion in the Geriatrics universe. Discharges for Geriatrics are<br />
calculated on a hospital-wide basis and are not DRG-specific.<br />
** In addition to the discharge eligibility criteria, a hospital must have a cardiac catheterization lab,<br />
<strong>of</strong>fer open-heart surgery, or <strong>of</strong>fer angioplasty for inclusion in the Heart and Heart Surgery<br />
universe.
Figure 2. Analysis Procedure for “America’s Best <strong>Hospital</strong>s <strong>2003</strong>"<br />
Yes<br />
Final universe contains nominations<br />
data, mortality data and AHA data<br />
Test for sufficient discharges<br />
(per specialty):<br />
Range <strong>of</strong> discharges: 23-1,285<br />
(total) 4-500 (surgical)<br />
Yes<br />
13 files created (one for<br />
each IHQ-driven specialty)<br />
Rankings for the 13 IHQ-driven<br />
specialties are produced<br />
Top 50 hospitals are published<br />
Yes<br />
<strong>Hospital</strong>s in the FY2001 AHA database<br />
(n=6,003)<br />
Does hospital m eet eligibility criteria?<br />
1: COTH membership<br />
or<br />
2: Sufficient technology (score <strong>of</strong> 9 - 17)<br />
or<br />
3: Medical school affliliation<br />
or<br />
4: (For reputation-only specialties): received one or<br />
more nominations<br />
Yes<br />
<strong>Hospital</strong>s eligible for<br />
ranking<br />
(n=2,072)<br />
W as hospital a FY2001 AHA<br />
responder?<br />
Final universe file contains<br />
nominations data, mortality data and<br />
average <strong>of</strong> the FY2000 and FY1999<br />
AHA survey data<br />
Is specialty one <strong>of</strong> the 13 IHQdriven?<br />
Non-zero reputational score<br />
Eliminated from analysis<br />
7<br />
No<br />
W as hospital a FY2000 AND<br />
FY1999 AHA responder?<br />
Yes No<br />
Yes No<br />
No<br />
No<br />
Final universe file contains only<br />
nominations data and mortality data<br />
Rankings for reputation-only specialties<br />
are produced: (Eyes, Pediatrics,<br />
Psychiatry, Rehabilitation)<br />
Those at or above 3.0% are published<br />
No
B. Composite Measure <strong>of</strong> Structure<br />
<strong>The</strong> structural dimension defines the tools and environment available to care providers in<br />
treating patients. Health care research overwhelmingly supports the use <strong>of</strong> a measure<br />
<strong>of</strong> structure in assessing quality <strong>of</strong> care. However, no prior research has revealed a<br />
single indicator <strong>of</strong> quality that summarizes all others or that adequately represents the<br />
structure construct on its own. Thus, the structural component must be represented by a<br />
composite variable comprising different specialty-specific measures that are weighted<br />
relative to each other.<br />
For the <strong>2003</strong> index, most structural elements are derived from the 2001 AHA Annual<br />
Survey <strong>of</strong> <strong>Hospital</strong>s database and are described below. For the specific mapping <strong>of</strong><br />
variables to the AHA data elements, see Appendix A.<br />
1) Technology indices:<br />
For <strong>2003</strong>, technology elements for all specialties are unchanged. Since the 1996<br />
version <strong>of</strong> the index, our technology indices have reflected the real cost <strong>of</strong> hightechnology<br />
services. While providing a service inside the hospital is convenient<br />
for patients, the cost may be unacceptable to some hospitals. Many hospitals<br />
provide access to technology services through the hospital’s health system, a<br />
local community network, or a contractual arrangement or joint venture with<br />
another provider in the community. We take this into account by giving hospitals<br />
that provide a service such as ultrasound one full point if it is provided on-site;<br />
hospitals that provide the service locally through a formal arrangement receive a<br />
half-point. A hospital receives no more than one point for each element <strong>of</strong> the<br />
index. Figure 3 presents the complete list <strong>of</strong> technologies considered for each<br />
specialty.<br />
8
Figure 3. Technology Indices by Specialty<br />
Technology<br />
All <strong>Hospital</strong> <strong>Index</strong>*<br />
Cancer<br />
Digestive Disorders<br />
Ear, Nose, and Throat<br />
1) Angioplasty T T<br />
2) Cardiac Catheterization Lab T T T<br />
3) Cardiac Intensive Care Beds T T T<br />
4) Computed Tomography Scanner T T T T T T T T T T T T T T<br />
5) Diagnostic Radioisotope Facility T T T T T T T<br />
6) Diagnostic Mammography<br />
Services<br />
T T<br />
7) Extracorporeal Shock Wave<br />
Lithiotripter<br />
9<br />
Heart and Heart Surgery<br />
Hormonal Disorders<br />
Geriatrics<br />
T T T T<br />
8) Magnetic Resonance Imaging T T T T T T T T T T T T<br />
9) Medical/Surgical Intensive Care T<br />
10) Neonatal Intensive Care T T<br />
11) Oncology Services T<br />
12) Open Heart Surgery T T<br />
13) Pediatric Intensive Care Beds T T<br />
14) Positron Emission Tomography<br />
Scanner<br />
15) Reproductive Health<br />
16) Single Photon Emission<br />
Computed Tomography<br />
17) Transplant Services<br />
T T T T T T T T T T T T<br />
T<br />
T T T T T T T T T T T T<br />
18) Ultrasound T T T T T T T T T T T T<br />
19) X-ray Radiation <strong>The</strong>rapy T T T T T T T T T T<br />
TOTAL ELEMENTS 17 7 8 5 9 7 8 8 5 7 5 4 5 8<br />
* <strong>The</strong> All <strong>Hospital</strong> <strong>Index</strong> is used to define the universe <strong>of</strong> eligible hospitals.<br />
Gynecology<br />
Kidney Disease<br />
T<br />
Neurology and Neurosurgery<br />
Orthopedics<br />
Respiratory Disorders<br />
Rheumatology<br />
Urology
2) Volume:<br />
<strong>The</strong> volume measure reflects total medical and surgical discharges in the<br />
appropriate specialty-specific DRG groupings submitted for CMS reimbursement.<br />
<strong>The</strong> measure is incorporated into the structure score for all data-driven<br />
specialties other than Geriatrics and Rheumatology.<br />
In the Heart and Heart Surgery specialty, surgical discharges indicated volume<br />
until 2002, when the volume variable was changed to include both medical and<br />
surgical discharges. <strong>The</strong> methodology now matches the other specialties in this<br />
respect.<br />
Volumes at the extreme for particular hospitals and specialties were trimmed to<br />
eliminate the influence <strong>of</strong> very wide variation. Figure 4 shows the percentile at<br />
which each <strong>of</strong> the volume distributions was trimmed.<br />
3) RNs to beds:<br />
A hospital’s number <strong>of</strong> beds is defined by the AHA as beds set up and staffed at<br />
the end <strong>of</strong> the reporting period. Only nurses with RN degrees from approved<br />
schools <strong>of</strong> nursing and currently registered by their state are considered. Nurses<br />
must be full-time (35 hours/week or more), and on staff. Private-duty nurses,<br />
staff nurses whose salary is financed entirely by outside sources (e.g., an agency<br />
or a research grant), and LPNs are not counted. Registered nurses more<br />
appropriately classified in other occupational categories (e.g., supervisory<br />
nurses, facility administrators) are also not counted.<br />
As with volume, RNs to beds ratios were trimmed to eliminate the influence <strong>of</strong><br />
very wide variation. Figure 4 shows the percentiles at which each <strong>of</strong> the RNs to<br />
beds distributions was trimmed.<br />
10
Figure 4. Percentile Where Volume and RNs/Beds Distributions Were Trimmed<br />
Specialty Volume<br />
Percentile<br />
11<br />
RNs/Beds<br />
Percentile<br />
Cancer 90 95<br />
Digestive Disorders 90 95<br />
Ear, Nose, and Throat 95 95<br />
Geriatrics -- 90<br />
Gynecology 90 95<br />
Heart and Heart Surgery 90 95<br />
Hormonal Disorders no trimming 95<br />
Kidney Disease no trimming 95<br />
Neurology and Neurosurgery no trimming 95<br />
Orthopedics 90 90<br />
Respiratory Disorders 90 95<br />
Rheumatology -- 90<br />
Urology 95 90<br />
4) Trauma:<br />
A second round <strong>of</strong> standardization is performed after trimming extremes.<br />
Restandardization restores balance so that trimmed and untrimmed measures<br />
have the same influence on the final score.<br />
In 1992, a U.S. News survey <strong>of</strong> board-certified physicians ranked the presence <strong>of</strong><br />
an emergency room and a hospital’s trauma provider level high on a list <strong>of</strong><br />
hospital quality indicators. Physicians in nine specialties ranked trauma as one<br />
<strong>of</strong> the top five indicators <strong>of</strong> quality. <strong>The</strong> indications <strong>of</strong> these specialists and<br />
resultant high factor loadings supported the inclusion <strong>of</strong> these data for Digestive<br />
Disorders; Ear, Nose, and Throat; Gynecology; Heart and Heart Surgery;<br />
Hormonal Disorders; Kidney Disease; Neurology and Neurosurgery;<br />
Orthopedics; Respiratory Disorders, and Urology.
<strong>The</strong> trauma indicator is dichotomous and derived from two variables in the AHA<br />
database: whether the hospital has a certified trauma center in the hospital and<br />
the level <strong>of</strong> the trauma center. To receive credit for trauma services, hospitals<br />
must provide Level 1 or Level 2 trauma services in-hospital (as opposed to<br />
providing trauma services only as part <strong>of</strong> a health system, network, or joint<br />
venture). Level 1 trauma service is defined as “a regional resource trauma<br />
center, which is capable <strong>of</strong> providing total care for every aspect <strong>of</strong> injury and<br />
plays a leadership role in trauma research and education.” 4 Level 2 is defined by<br />
the AHA as “a community trauma center, which is capable <strong>of</strong> providing trauma<br />
care to all but the most severely injured patients who require highly specialized<br />
care.” 4 Certification is required.<br />
5) Discharge planning:<br />
<strong>The</strong> three elements <strong>of</strong> discharge planning are patient education services, case<br />
management services, and patient representative services. A service must be<br />
provided within the hospital to receive credit.<br />
6) Service mix:<br />
This indicator ranges from 0 to 9 points and comprises alcohol/drug abuse or<br />
dependency inpatient care, home health services, social work services,<br />
reproductive health services, psychiatric education services, women’s health<br />
center/services, and psychiatric consultation/liaison services. Services must be<br />
provided within the hospital. As <strong>of</strong> <strong>2003</strong>, hospice services were removed from<br />
this indicator since they are accounted for in the hospice/palliative care indicator<br />
and the maximum score for this indicator was therefore reduced from 10 points to<br />
9 points.<br />
7) Geriatric services:<br />
This indicator ranges from 0 to 7 points and comprises arthritis treatment centers,<br />
adult day care programs, patient representative services, geriatric services,<br />
meals on wheels, assisted living, and transportation to health facilities. Again, to<br />
receive credit for a service, it must be provided within the hospital.<br />
12
8) Gynecology services:<br />
This indicator was introduced in 1997. 5 It provides a means to better rate the<br />
quality <strong>of</strong> services a hospital provides for gynecological and obstetric patients.<br />
High factor loadings provide support for this variable’s inclusion. With a range <strong>of</strong><br />
0 to 4, the services included are obstetric care, reproductive health care, birthing<br />
rooms, and women’s health center. We do not award a half-point for items in this<br />
measure.<br />
9) Medical/surgical intensive care beds:<br />
This indicator is included as an important factor in the Kidney Disease specialty.<br />
<strong>The</strong> AHA database provides the number <strong>of</strong> medical and surgical intensive care<br />
beds per facility. To be counted, beds must be physically located within the<br />
hospital and set up and staffed at the end <strong>of</strong> the reporting period.<br />
10) National Cancer Institute (NCI) indicator<br />
This indicator was introduced in 2002. <strong>The</strong> NCI is the principal federal agency<br />
for cancer research and training. NCI-designated cancer centers are the<br />
principal deliverers <strong>of</strong> medical advances to patients and families, and the chief<br />
educators <strong>of</strong> health care pr<strong>of</strong>essionals and the public. 6<br />
<strong>The</strong>re are three classifications <strong>of</strong> NCI-designated cancer centers. Cancer Center<br />
is the first level, denoting a facility that conducts a high volume <strong>of</strong> advanced<br />
laboratory research with federal funding. Clinical Cancer Centers, the next level<br />
up, add clinical cancer research activities. <strong>The</strong> highest level is Comprehensive<br />
Cancer Center. <strong>The</strong>se institutions add prevention research, community outreach<br />
and service activities. 6<br />
We award one point to NCI-designated Clinical and Comprehensive Cancer<br />
Centers. All other hospitals receive zero points.<br />
13
11) Hospice/palliative care indicator:<br />
<strong>The</strong> hospice/palliative care indicator also was added in 2002. It addresses a<br />
hospital's ability in certain specialties to meet the needs <strong>of</strong> patients whose lives<br />
are ending or who are experiencing acute or chronic pain or other symptoms <strong>of</strong><br />
illness. A qualifying hospice program provides care (including pain relief) and<br />
supportive services for the terminally ill and their families. A qualifying palliative<br />
care program provides care by specially trained physicians and other clinicians<br />
for relief <strong>of</strong> acute or chronic pain or to control symptoms <strong>of</strong> illness; in addition,<br />
supportive services such as counseling on advance directives are provided for<br />
patients with advanced disease. In the specialties <strong>of</strong> Cancer, Geriatrics, Heart<br />
and Heart Surgery, and Respiratory Disorders, hospitals receive 1 point if they<br />
have a qualifying hospice or palliative care program and 2 points if they have<br />
both. In Rheumatology, hospitals receive 1 point if they have a qualifying<br />
palliative care program; hospice is not considered. <strong>Hospital</strong>s that provide either<br />
service locally through a formal arrangement receive a full point for each<br />
applicable component <strong>of</strong> the indicator (rather than a half-point as in several other<br />
components <strong>of</strong> the structural dimension).<br />
To combine these structural variables, we weight the elements to create a final<br />
composite measure. Using factor analysis, we force a one-factor solution and use the<br />
resultant loadings as “weight” values for each variable in the composite structural<br />
measure. <strong>The</strong> relative weight assigned to each element varies from specialty to<br />
specialty and from one release to the next within specialty. Figure 5 provides the factor<br />
weights assigned to each element for <strong>2003</strong>.<br />
14
Figure 5. Factor Loading by Specialty<br />
Specialty Technology<br />
Indices<br />
Volume RNs/<br />
Beds<br />
Trauma Discharge<br />
Planning<br />
15<br />
Service<br />
Mix<br />
Geriatric<br />
Services<br />
Gynecology<br />
Services<br />
Medical/<br />
Surgical<br />
Beds<br />
Cancer 65 69 60 71 50<br />
Digestive Disorders 63 65 54 67<br />
Ear, Nose, and Throat 67 64 49 67<br />
Geriatrics 60 34 59 70 65 52<br />
Gynecology 77 54 38 62 78<br />
Heart and Heart Surgery 69 64 43 57 58<br />
Hormonal Disorders 64 53 55 71<br />
Kidney Disease 73 60 43 54 65 79<br />
Neurology and Neurosurgery 62 65 50 68<br />
Orthopedics 57 66 54 69<br />
Respiratory disorders 81 30 20 49 79 67<br />
Rheumatology 85 25 84 60*<br />
Urology 62 69 57 64<br />
* Rheumatology includes palliative care, but not hospice.<br />
NCI<br />
Designation<br />
Hospice/<br />
Palliative<br />
Care
C. Process<br />
<strong>The</strong> process dimension <strong>of</strong> the quality equation is the net effect <strong>of</strong> physicians’ clinical<br />
decision-making. Clinical choices about the use <strong>of</strong> medication or diagnostic tests,<br />
admission to a hospital or one <strong>of</strong> its units, and length <strong>of</strong> stay account for a large<br />
proportion <strong>of</strong> the outcomes experienced by patients. However, national measurements<br />
<strong>of</strong> process are extremely difficult to obtain. We therefore rely on an alternative measure<br />
to act as a proxy. We contend that when a qualified expert identifies a hospital as one <strong>of</strong><br />
the “best,” he or she is, in essence, endorsing the process choices made at that hospital.<br />
Thus, we use the “nomination” <strong>of</strong> a hospital by a board-certified specialist as a measure<br />
<strong>of</strong> process. To collect these nominations, NORC conducts an annual survey <strong>of</strong> boardcertified<br />
physicians. As in the past, we have pooled nominations for the most recent<br />
three years (2001-<strong>2003</strong>) to arrive at the process measure.<br />
Survey sample<br />
<strong>The</strong> sample for the <strong>2003</strong> survey consists <strong>of</strong> 2,550 board-certified physicians<br />
selected from the American Medical Association (AMA) Physician Masterfile <strong>of</strong><br />
approximately 811,000 physicians. From within the Masterfile, we selected a<br />
target population <strong>of</strong> 220,245 board-certified physicians who met the eligibility<br />
requirements listed in Figure 6. Stratifying by region and by specialty within<br />
region, we selected a probability (random) sample <strong>of</strong> 150 physicians from each <strong>of</strong><br />
17 specialty areas, for a total <strong>of</strong> 2,550 (for 2002, 180 physicians were selected<br />
from each <strong>of</strong> the 17 specialty areas). <strong>The</strong> final sample includes non-federal and<br />
federal medical and osteopathic physicians residing in the 50 states and the<br />
District <strong>of</strong> Columbia. Figure 6 displays the list <strong>of</strong> specialties surveyed for <strong>2003</strong>.<br />
16
Eligibility requirements<br />
We defined a probability sample <strong>of</strong> physicians who could properly represent the<br />
17 specialty groupings. We used two rules <strong>of</strong> eligibility: one related to a mapping<br />
between the 17 specialties and the AMA’s list <strong>of</strong> 85 self-designated specialties,<br />
and the second to a mapping between these 85 specialties and the 23 member<br />
boards <strong>of</strong> the American Boards <strong>of</strong> Medical Specialties (ABMS).<br />
Under the first rule, we linked each <strong>of</strong> the 17 specialties to one or more relevant<br />
AMA specialties from the list <strong>of</strong> AMA self-designated practice specialty codes.<br />
Physicians who designated a primary specialty in one <strong>of</strong> the 17 specialties were<br />
preliminarily eligible for the survey. Under the second rule, the physicians must<br />
also be certified by the corresponding member board <strong>of</strong> the ABMS. Figure 6<br />
displays the correspondence between the specialty specified for U.S. News &<br />
World Report, AMA self-designated specialty, and the corresponding member<br />
board.<br />
17
Figure 6. Physician Sample Mapping<br />
“America’s Best<br />
<strong>Hospital</strong>s” Specialty<br />
Cancer<br />
AMA Key Code AMA Self-Designated<br />
Specialty<br />
HEM/22 Hematology<br />
ON/24 Oncology<br />
18<br />
American Board<br />
<strong>of</strong>:<br />
Internal Medicine<br />
Digestive Disorders GE/17 Gastroenterology Internal Medicine<br />
Ear, Nose, and Throat OTO/48 Otolaryngology Otolaryngology<br />
Eyes OPH/46 Ophthalmology Ophthalmology<br />
Geriatrics FPG/38, IMG/38 Geriatrics Internal Medicine<br />
Gynecology<br />
Heart and Heart<br />
Surgery<br />
Hormonal Disorders<br />
GYN/21 Gynecology Obstetrics &<br />
OBG/42 Obstetrics & Gynecology Gynecology<br />
CD/08 Cardiovascular Diseases Internal Medicine<br />
CDS/08 Cardiovascular Surgery Surgery<br />
END/14 Endocrinology<br />
DIA/12 Diabetes<br />
Internal Medicine<br />
Kidney Disease NEP Nephrology Internal Medicine<br />
Neurology and<br />
Neurosurgery<br />
N/36 Neurology Psychiatry &<br />
NS Neurological Surgery Neurology<br />
Orthopedics ORS/85 Orthopedic Surgery Orthopedic Surgery<br />
Pediatrics<br />
PD/55 Pediatrics<br />
ADL/01 Adolescent Medicine<br />
Pediatrics<br />
Psychiatry P/63 Psychiatry Psychiatry &<br />
Rehabilitation PM/62 Physical Medicine & Physical Medicine &<br />
Respiratory Disorders PUD Pulmonary Diseases Internal Medicine<br />
Rheumatology RHU/74 Rheumatology Internal Medicine<br />
Urology U/91 Urological Surgery Urology
Stratification<br />
To compensate for the widely varying number <strong>of</strong> eligible physicians across the<br />
targeted specialties, we used different probabilities <strong>of</strong> selection for each grouping<br />
and proportionate stratification across the four United States Census regions<br />
(Northeast, Midwest, South, and West). Within each <strong>of</strong> the 17 strata, we<br />
achieved a sample that was also geographically representative <strong>of</strong> the spread <strong>of</strong><br />
physicians across the country.<br />
<strong>2003</strong> physician survey<br />
For <strong>2003</strong>, 150 sampled physicians per specialty were mailed a one-page<br />
questionnaire (see Appendix C). In 2002, 150 sampled physicians per specialty<br />
were mailed a three-page questionnaire (see Appendix B) and an additional 30<br />
physicians per specialty were mailed a one-page questionnaire containing only<br />
the hospital nomination item. Since the response rate in 2002 was higher for<br />
physicians who received the short form questionnaire, it was utilized for all<br />
physicians in <strong>2003</strong>. In 2001, half <strong>of</strong> the questionnaires made explicit reference to<br />
the U.S. News & World Report publication and half simply indicated that the<br />
questionnaire was for an annual survey <strong>of</strong> physicians. In 2002 and <strong>2003</strong>, all<br />
questionnaires made reference to U.S. News & World Report.<br />
Along with the questionnaires, physicians were also sent a cover letter, a prepaid<br />
return envelope, and a token incentive in the form <strong>of</strong> a two-dollar bill. One week<br />
after the initial survey mailing, a reminder postcard was sent to the sampled<br />
physicians. Two weeks following the reminder mailing, we sent a United States<br />
Postal Service Priority mailing to non-respondents including the questionnaire, a<br />
cover letter and a business reply envelope. Three weeks after the second<br />
mailing, a third mailing was sent via Federal Express and included the<br />
questionnaire, a cover letter, and a business reply envelope.<br />
19
Response rate<br />
Of the 2,550 physicians sampled for this year’s report, 1,300 (51%) filled out and<br />
returned a questionnaire. In accordance with standard practice, any member <strong>of</strong><br />
the sample found to be ineligible was removed from the denominator <strong>of</strong> the<br />
response rate equation. Subtracting 24 ineligible physicians because they had<br />
retired or died resulted in an overall response rate <strong>of</strong> 51.5%. Figure 7 shows<br />
response rates by specialty for the three years used in the <strong>2003</strong> index.<br />
20
Figure 7. Response Rate by Year*<br />
Specialty 2001 2002 <strong>2003</strong> 3-year total<br />
n % n % n % n %<br />
Cancer 82 54.7 71 39.4 80 53.7 233 49.7<br />
Digestive Disorders 79 52.7 81 45.0 76 50.7 236 49.4<br />
Ear, Nose, and Throat 90 60.0 104 57.8 99 66.9 293 61.6<br />
Eyes 91 60.7 102 56.7 75 50.3 268 56.3<br />
Geriatrics 90 60.0 93 51.7 72 48.3 255 53.7<br />
Gynecology 77 51.3 80 44.4 71 48.0 228 47.9<br />
Heart and Heart Disease 81 54.0 74 41.1 75 50.7 230 48.8<br />
Hormonal Disorders 74 49.3 80 44.4 75 51.4 229 48.3<br />
Kidney Disease 72 48.0 73 40.6 66 44.0 211 44.2<br />
Neurology and Neurosurgery 79 52.7 92 51.1 84 56.4 255 53.3<br />
Orthopedics 72 48.0 92 51.1 73 49.3 237 49.6<br />
Pediatrics 80 53.3 95 52.8 87 58.0 262 54.7<br />
Psychiatry 86 57.3 84 46.7 65 44.2 235 49.9<br />
Rehabilitation 81 54.0 88 48.9 75 50.3 244 51.0<br />
Respiratory Disorders 74 49.3 89 49.4 74 49.7 237 49.5<br />
Rheumatology 86 57.3 103 57.2 74 49.7 263 55.1<br />
Urology 83 55.3 83 46.1 79 53.4 245 51.6<br />
TOTAL 1,377 54.0 1,484 48.5 1,300 51.0 4,161 51.1<br />
Overall Response Rate** 55.0 49.1 51.5 51.8<br />
* In 2001 and <strong>2003</strong>, 150 physicians were sampled for each specialty; in 2002, 180 were sampled per<br />
specialty.<br />
** <strong>The</strong> numerator <strong>of</strong> the overall response rate includes all physicians who returned a questionnaire with at<br />
least one item completed and subtracts ineligible cases from the denominator.<br />
21
Weighting<br />
Weighting was carried out in two steps. First, physicians were assigned weights<br />
that reflected the probabilities <strong>of</strong> selection within specialty groups and the overall<br />
rates <strong>of</strong> response within these groups. Second, the weights from the first step<br />
were post-stratified using the two-dimensional contingency table <strong>of</strong> specialty (17<br />
categories) by census region (Northeast, Midwest, South, and West). To check<br />
the weights, we confirmed that the sum across the sample <strong>of</strong> the weights in each<br />
cell <strong>of</strong> the classifications (specialty x region) equaled the population size.<br />
In 2002, weighting across the three years <strong>of</strong> survey data was modified. In<br />
previous rankings, weights were assigned to physicians for each year individually<br />
as described in the paragraph above, and these year-specific weights were<br />
applied to the nominations for the three years contributing to the reputation score<br />
(2001, 2002, and <strong>2003</strong>). According to this method, a nomination in region X and<br />
specialty Y could have a different weight from another nomination in the same<br />
region and specialty if it was made in a different year. Physicians now are<br />
pooled for all three years, and weights are then assigned as described in the<br />
paragraph above. Using this method, all nominations in region X and specialty Y<br />
have the same weight, regardless <strong>of</strong> the year in which the nomination was made.<br />
Post-stratification was carried out to the current contingency table <strong>of</strong> specialty by<br />
census region counts rather than the mean counts for the three years. This new<br />
method was implemented to reduce the range in weights across specialty and<br />
region and between years.<br />
22
D. Outcome<br />
Many healthcare pr<strong>of</strong>essionals have decried the use <strong>of</strong> mortality rates as an outcomes<br />
measure because <strong>of</strong> limitations in the methods used to adjust for risk. Nonetheless,<br />
research strongly suggests a positive correlation between a better-than-average riskadjusted<br />
mortality rate and overall quality <strong>of</strong> care. 7-16 Based on these findings, we used<br />
adjusted mortality rate as the outcome measure for our quality <strong>of</strong> care model. Predicted<br />
mortality rates were provided by MEDSTAT Group, Inc., <strong>of</strong> Franklin, Tenn., using the All<br />
Patient Refined Diagnosis Related Group (APR-DRG) method designed by 3M Health<br />
Information Systems. <strong>The</strong> APR-DRG adjusts expected deaths for severity <strong>of</strong> illness by<br />
means <strong>of</strong> principle diagnosis and categories <strong>of</strong> secondary diagnoses. A detailed<br />
description <strong>of</strong> the full APR-DRG methodology is provided in Appendix D. <strong>The</strong> method<br />
was applied to the pooled 1999, 2000, and 2001 MEDPARS data set <strong>of</strong> reimbursement<br />
claims made to CMS by hospitals. <strong>The</strong>se complete data sets were the most current<br />
available for analysis.<br />
<strong>2003</strong> DRG refinements<br />
We annually review the DRG groupings for every specialty. <strong>The</strong> groupings are<br />
important because they define the cases included in the mortality measures as<br />
well as the volume measure in the structural component. In <strong>2003</strong>, we conducted<br />
a thorough examination <strong>of</strong> the DRG groupings in Digestive Disorders,<br />
Orthopedics, and Gynecology. Several physicians independently conducted<br />
reviews <strong>of</strong> the DRG groupings (two for Digestive Disorders, two for Orthopedics,<br />
and one representative for Gynecology). Based on the review and<br />
recommendations, the changes in Figure 8 were made for <strong>2003</strong>.<br />
23
Figure 8. Changes to Specialty Definitions for Mortality<br />
Specialty DRGs Added DRGs Deleted<br />
Digestive<br />
Disorders<br />
Orthopedics (none)<br />
Gynecology<br />
172: DIGESTIVE MALIGNANCY W CC<br />
173: DIGESTIVE MALIGNANCY W/O CC<br />
203: MALIGNANCY OF HEPATOBILIARY<br />
SYSTEM OR PANCREAS<br />
354: UTERINE, ADNEXA PROC FOR NON-<br />
OVARIAN/ADNEXAL MALIG W CC<br />
355: UTERINE, ADNEXA PROC FOR NON-<br />
OVARIAN/ADNEXAL MALIG W/O CC<br />
357: UTERINE & ADNEXA PROC FOR<br />
OVARIAN OR ADNEXAL MALIGNANCY<br />
366: MALIGNANCY, FEMALE<br />
REPRODUCTIVE SYSTEM W CC<br />
367: MALIGNANCY, FEMALE<br />
REPRODUCTIVE SYSTEM W/O CC<br />
24<br />
(none)<br />
213: AMPUTATION FOR<br />
MUSCULOSKELETAL SYSTEM &<br />
216: BIOPSIES OF<br />
MUSCULOSKELETAL SYSTEM &<br />
217: WND DEBRID & SKN GRFT<br />
EXCEPT HAND,FOR MUSCSKELET &<br />
240: CONNECTIVE TISSUE<br />
DISORDERS W CC<br />
241: CONNECTIVE TISSUE<br />
DISORDERS W/O CC<br />
As in previous years, we used an “all-cases” mortality rate in four specialties<br />
(Ear, Nose, and Throat, Geriatrics, Gynecology and Rheumatology) rather than a<br />
specialty-specific rate, either because the number <strong>of</strong> hospitals with sufficient<br />
discharges in the particular DRG grouping was too low or because the DRG<br />
groupings proved to be less robust than was desired. Appendix E lists the DRGs<br />
for each specialty.<br />
Mortality scores<br />
Mortality scores are computed by subtracting each specialty-specific mortality<br />
ratio from 1. Using this “reverse scoring,” a mortality ratio <strong>of</strong> 0.25 produces a<br />
score <strong>of</strong> 0.75, a ratio <strong>of</strong> 0.05 produces a score <strong>of</strong> 0.95, and so on. This method<br />
maintains the magnitudes <strong>of</strong> the differences and avoids extreme values. To
dampen the effect <strong>of</strong> year-to-year fluctuations, mortality scores are averaged<br />
over three years.<br />
As with volume and RNs/beds ratios in the structural component, scores at the<br />
extreme in mortality were trimmed to eliminate the influence <strong>of</strong> very wide<br />
variation. Figure 9 shows the percentile at which each <strong>of</strong> the mortality<br />
distributions was trimmed.<br />
Figure 9. Percentile Where Mortality Distributions Were Trimmed<br />
Specialty Percentile<br />
Cancer 95<br />
Digestive Disorders 99<br />
Ear, Nose, and Throat 95<br />
Geriatrics 99<br />
Gynecology 99<br />
Heart and Heart Surgery 95<br />
Hormonal Disorders 95<br />
Kidney Disease 99<br />
Neurology and Neurosurgery 99<br />
Orthopedics 95<br />
Respiratory Disorders 99<br />
Rheumatology 99<br />
Urology 90<br />
As with volume and RNs/beds, restandardization is performed on the mortality<br />
scores after trimming extremes.<br />
25
E. Calculation <strong>of</strong> the <strong>Index</strong><br />
<strong>The</strong> calculation <strong>of</strong> the IHQ for each hospital (other than in specialties ranked solely on<br />
reputation) considers equally the three dimensions <strong>of</strong> quality <strong>of</strong> care: structure, process,<br />
and outcome. Although all three measures represent a specific aspect <strong>of</strong> quality, a<br />
single score provides an easier-to-use result and yields a more accurate portrayal <strong>of</strong><br />
overall quality than would the three aspects individually.<br />
<strong>The</strong>refore, in computing the final scores for a particular specialty, reputational score,<br />
mortality score, and the collective set <strong>of</strong> structural indicators receive arithmetically<br />
equivalent importance.<br />
<strong>The</strong> total formula for calculation <strong>of</strong> the specialty-specific IHQs is:<br />
where:<br />
IHQ i = {[(S 1 * F 1) + (S 2 * F 2) + (...S n * F n)] + [P i * 3F 1-n] + [ M * 3F 1-n]}<br />
IHQi = <strong>Index</strong> for <strong>Hospital</strong> <strong>Quality</strong> for specialty I<br />
S1-n = Structural indicators (STRUCTURE)<br />
F = Factor loading<br />
P = Nomination score (PROCESS)<br />
M = Standardized mortality score (OUTCOME)<br />
<strong>The</strong> general formula for deriving the index scores for tertiary-level hospitals is the same<br />
as when it began in 1993. For presentation purposes, we standardize raw scores, then<br />
equate the raw IHQ scores as computed above to a 100-point scale, where the top<br />
hospital in each specialty receives a score <strong>of</strong> 100.<br />
<strong>The</strong> mean and standard deviation <strong>of</strong> each <strong>of</strong> the 17 specialties are listed in Figure 10.<br />
For the four reputation-only rankings, mean and standard deviation <strong>of</strong> the reputation<br />
score are presented. <strong>The</strong>se data further illustrate that the spread <strong>of</strong> IHQ scores<br />
produces a very small number <strong>of</strong> hospitals two and three standard deviations above the<br />
mean. Horizontal lines in each <strong>of</strong> the 17 specialty lists in Appendices F and G indicate<br />
the cut<strong>of</strong>f points <strong>of</strong> two and three standard deviations above the mean.<br />
26
IHQ scores for the specialties <strong>of</strong> Eyes, Pediatrics, Psychiatry, and Rehabilitation cannot<br />
be calculated, because data for robust and meaningful structural and outcome measures<br />
are not available for these specialties. Thus, as shown in Appendix G, we rank hospitals<br />
in these specialties solely by reputation. Although the four reputation-only specialties<br />
are ranked without the <strong>Index</strong> <strong>of</strong> <strong>Hospital</strong> <strong>Quality</strong>, standard deviations <strong>of</strong> the reputation<br />
scores are still useful in identifying truly superior hospitals (in terms <strong>of</strong> statistically<br />
relevant nomination scores).<br />
27
Figure 10. Mean and Standard Deviations <strong>of</strong> IHQ and Reputation Scores<br />
IHQ Score<br />
Specialty Mean Standard<br />
deviation<br />
28<br />
1 SD above<br />
the mean<br />
2 SDs<br />
above<br />
the mean<br />
3 SDs<br />
above<br />
the mean<br />
Cancer 21.92 6.88 28.80 35.68 42.56<br />
Digestive Disorders 22.45 5.16 27.62 32.78 37.95<br />
Ear, Nose, and Throat 21.38 5.87 27.25 33.12 39.00<br />
Geriatrics 20.85 5.62 26.47 32.09 37.71<br />
Gynecology 21.85 6.20 28.05 34.25 40.45<br />
Heart and Heart Surgery 20.47 7.14 27.60 34.74 41.88<br />
Hormonal Disorders 20.37 6.24 26.61 32.84 39.08<br />
Kidney Disease 29.46 7.10 36.57 43.67 50.77<br />
Neurology and Neurosurgery 20.30 6.60 26.90 33.50 40.09<br />
Orthopedics 20.40 5.42 25.82 31.23 36.65<br />
Respiratory disorders 20.57 5.38 25.96 31.34 36.72<br />
Rheumatology 26.07 5.77 31.83 37.60 43.37<br />
Urology 23.29 4.86 28.15 33.01 37.87<br />
Reputational Score<br />
Specialty Mean Standard<br />
deviation<br />
1 SD above<br />
the mean<br />
2 SDs<br />
above<br />
the mean<br />
3 SDs<br />
above<br />
the mean<br />
Eyes 4.41 13.27 17.68 30.95 44.22<br />
Pediatrics 3.23 7.83 11.05 18.88 26.71<br />
Psychiatry 3.34 7.33 10.67 18.01 25.34<br />
Rehabilitation 3.50 8.90 12.40 21.30 30.20
F. Summary <strong>of</strong> Changes for <strong>2003</strong><br />
• <strong>The</strong> overall sample size <strong>of</strong> the physician survey returned to 2,550 from 3,060 by<br />
reducing the number <strong>of</strong> physicians surveyed to 150 from 180 per specialty (p. 2).<br />
• Hospice Care was removed from the Service Mix <strong>Index</strong>, which changed the<br />
maximum score for this indicator from 10 to 9. Hospice care is taken into<br />
account in the hospice/palliative care indicator which was added to the structural<br />
measures in several specialties in 2002 (p. 12).<br />
• <strong>The</strong> second additional postcard reminder (which was previously sent to all nonresponders<br />
one month after the third mailing) was not utilized in <strong>2003</strong> (p. 19).<br />
• All physicians received the short form <strong>of</strong> the questionnaire, which was introduced<br />
in 2002 (p. 19).<br />
• DRG groupings were updated in Digestive Disorders, Orthopedics, and<br />
Gynecology (p. 23).<br />
29
III Directions for Future Releases<br />
Since its inception, the U.S. News <strong>Index</strong> has used the most rigorous methodology available<br />
to define, measure, and combine the components <strong>of</strong> quality incorporated in its construction.<br />
We will continue to re-examine them. Continuing research will address the way in which<br />
reputational score is used to define process; transformations <strong>of</strong> the raw scores; measures<br />
<strong>of</strong> technology for the structural component, and refinement <strong>of</strong> the definitions <strong>of</strong> non-fatal<br />
outcomes.<br />
We will also continue to investigate the availability and quality <strong>of</strong> 30-day mortality rates as<br />
compared to death-at-discharge rates. <strong>The</strong> ability to measure the outcomes <strong>of</strong> procedures<br />
after a patient’s release from the hospital would enhance the quality <strong>of</strong> the rankings. Before<br />
implementing such a measure, however, we must assess the quality <strong>of</strong> the data available<br />
for input.<br />
As in years past, we welcome input from users <strong>of</strong> the index in charting new directions.<br />
Readers and users are encouraged to contact the authors with suggestions and questions.<br />
30
IV References<br />
1. Donabedian A. Evaluating the quality <strong>of</strong> medical care. <strong>The</strong> Milbank Memorial Fund<br />
Quarterly. 1966; 44:166-203.<br />
2. Donabedian A. Promoting quality through evaluating the process <strong>of</strong> patient care. Med<br />
Care.1968; 6:181.<br />
3. Hill, CA., Winfrey, KL., Rudolph, BA. “Best <strong>Hospital</strong>s”: A description <strong>of</strong> the methodology for<br />
the index <strong>of</strong> hospital quality. Inquiry. 1997; 34(1)80-90.<br />
4. American <strong>Hospital</strong> Association. 1996 Annual Survey <strong>of</strong> <strong>Hospital</strong>s Data Base Documentation<br />
Manual.<br />
5. Ehrlich, RH, Hill CA, Winfrey, KL. 1997 Survey <strong>of</strong> Best <strong>Hospital</strong>s. Chicago: NORC; 1997.<br />
6. <strong>The</strong> Cancer Centers Branch <strong>of</strong> the National Cancer Institute. Policies and guidelines relating<br />
to the cancer-center support grant. Washington, DC: National Cancer Institute; 2000.<br />
7 . United States Department <strong>of</strong> Health and Human Services. Medicare hospital mortality<br />
information. HCFA publication 01-002. Report prepared by Otis R. Bowen and William L.<br />
Roper. Washington, DC:USGPO; 1987.<br />
8. Blumberg MS. Comments on HCFA hospital death rate statistical outliers. HSR: Health<br />
Services Research. 1987; 21:715-40.<br />
9. Dubois RW, Brook RH, Rogers WH. Adjusted hospital death rates: a potential screen or<br />
the quality <strong>of</strong> medical care. AJPH. 1987; 77:1162-6.<br />
10. Gillis KD, Hixson JS. Efficacy <strong>of</strong> statistical outlier analysis for monitoring quality <strong>of</strong> care.<br />
Journal <strong>of</strong> Business and Economic Statistics. 1991; 9:241-52.<br />
11. Green J, Wintfield N, Sharkey P, Passman LJ. <strong>The</strong> importance <strong>of</strong> severity <strong>of</strong> illness in<br />
assessing hospital mortality. JAMA. 1990; 263:241-6.<br />
12. Green J, Passman LJ, Wintfield N. Analyzing hospital mortality: the consequences <strong>of</strong><br />
diversity in patient mix. JAMA. 1991; 265:1849-53.<br />
13. Greenfield S, Aronow HU, Elash<strong>of</strong>f RM, Watanabe D. Flaws in mortality data: the hazards<br />
<strong>of</strong> ignoring comorbid disease. JAMA. 1988; 260:2253-7.<br />
31
14. Rosen HM, Green BA. <strong>The</strong> HCFA excess mortality lists: a methodological critique.<br />
<strong>Hospital</strong> and Health Services Administration. 1987; 2:119-24.<br />
15. Flood AB, Scott WR. Conceptual and methodological issues in measuring the quality <strong>of</strong><br />
care in hospitals. In <strong>Hospital</strong> structure and performance. Baltimore: Johns Hopkins<br />
University Press; 1987.<br />
16. Iezzoni LI, Ash AS, C<strong>of</strong>fman GA, Moskowitz MA. Predicting in-hospital mortality: a<br />
comparison <strong>of</strong> severity measurement approaches. Med Care. 1992; 30:347-59.<br />
32
V Appendices
Appendix A<br />
Structural Variable Map
<strong>The</strong> following variables, used to construct structural elements <strong>of</strong> the <strong>2003</strong> IHQ, were taken from the<br />
2001 Annual Survey <strong>of</strong> <strong>Hospital</strong>s Data Base published by the American <strong>Hospital</strong> Association.<br />
All <strong>Hospital</strong> <strong>Index</strong> (used to define hospital eligibility)<br />
1 point if ANGIOHOS=1, half point if ANGIOSYS, ANGIONET, or ANGIOVEN=1<br />
1 point if CCLABHOS=1, half point if CCLABSYS, CCLABNET, or CCLABVEN=1<br />
1 point if CICBDHOS=1, half point if CICBDSYS, CICBDNET, or CICBDVEN=1<br />
1 point if CTSCNHOS=1, half point if CTSCNSYS, CTSCNNET, or CTSCNVEN=1<br />
1 point if DRADFHOS=1, half point if DRADFSYS, DRADFNET, or DRADFVEN=1<br />
1 point if ESWLHOS=1, half point if ESWLSYS, ESWLNET, or ESWLVEN=1<br />
1 point if MAMMSHOS=1, half point if MAMMSSYS, MAMMSNET, or MAMMSVEN=1<br />
1 point if MRIHOS=1, half point if MRISYS, MRINET, or MRIVEN=1<br />
1 point if MSICHOS=1, half point if MSICSYS, MSICNET, or MSICVEN=1<br />
1 point if NICBDHOS=1, half point if NICBDSYS, NICBDNET, or NICBDVEN=1<br />
1 point if OHSRGHOS=1, half point if OHSRGSYS, OHSRGNET, or OHSRGVEN=1<br />
1 point if PEDBDHOS=1, half point if PEDBDSYS, PEDBDNET, or PEDBDVEN=1<br />
1 point if PETHOS=1, half point if PETSYS, PETNET, or PETVEN=1<br />
1 point if RADTHHOS=1, half point if RADTHSYS, RADTHNET, or RADTHVEN=1<br />
1 point if REPROHOS=1, half point if REPROSYS, REPRONET, or REPROVEN=1<br />
1 point if SPECTHOS=1, half point if SPECTSYS, SPECTNET, or SPECTVEN=1<br />
1 point if ULTSNHOS=1, half point if ULTSNSYS, ULTSNNET, or ULTSNVEN=1<br />
Cancer Technology <strong>Index</strong><br />
1 point if CTSCNHOS=1, half point if CTSCNSYS, CTSCNNET, or CTSCNVEN=1<br />
1 point if MRIHOS=1, half point if MRISYS, MRINET, or MRIVEN=1<br />
1 point if ONCOLHOS=1, half point if ONCOLSYS, ONCOLNET, or ONCOLVEN=1<br />
1 point if PEDICHOS=1, half point if PEDICSYS, PEDICNET, or PEDICVEN=1<br />
1 point if PETHOS=1, half point if PETSYS, PETNET, or PETVEN=1<br />
1 point if RADTHHOS=1, half point if RADTHSYS, RADTHNET, or RADTHVEN=1<br />
1 point if SPECTHOS=1, half point if SPECTSYS, SPECTNET, or SPECTVEN=1
Digestive Disorders Technology <strong>Index</strong><br />
1 point if CTSCNHOS=1, half point if CTSCNSYS, CTSCNNET, or CTSCNVEN=1<br />
1 point if DRADFHOS=1, half point if DRADFSYS, DRADFNET, or DRADFVEN=1<br />
1 point if ESWLHOS=1, half point if ESWLSYS, ESWLNET, or ESWLVEN=1<br />
1 point if MRIHOS=1, half point if MRISYS, MRINET, or MRIVEN=1<br />
1 point if PETHOS=1, half point if PETSYS, PETNET, or PETVEN=1<br />
1 point if RADTHHOS=1, half point if RADTHSYS, RADTHNET, or RADTHVEN=1<br />
1 point if SPECTHOS=1, half point if SPECTSYS, SPECTNET, or SPECTVEN=1<br />
1 point if ULTSNHOS=1, half point if ULTSNSYS, ULTSNNET, or ULTSNVEN=1<br />
Ear, Nose, and Throat Technology <strong>Index</strong><br />
1 point if CTSCNHOS=1, half point if CTSCNSYS, CTSCNNET, or CTSCNVEN=1<br />
1 point if MRIHOS=1, half point if MRISYS, MRINET, or MRIVEN=1<br />
1 point if PETHOS=1, half point if PETSYS, PETNET, or PETVEN=1<br />
1 point if RADTHHOS=1, half point if RADTHSYS, RADTHNET, or RADTHVEN=1<br />
1 point if SPECTHOS=1, half point if SPECTSYS, SPECTNET, or SPECTVEN=1<br />
Heart and Heart Surgery Technology <strong>Index</strong><br />
1 point if ANGIOHOS=1, half point if ANGIOSYS, ANGIONET, or ANGIOVEN=1<br />
1 point if CCLABHOS=1, half point if CCLABSYS, CCLABNET, or CCLABVEN=1<br />
1 point if CICHOS=1, half point if CICSYS, CICNET, or CICVEN=1<br />
1 point if CTSCNHOS=1, half point if CTSCNSYS, CTSCNNET, or CTSCNVEN=1<br />
1 point if MRIHOS=1, half point if MRISYS, MRINET, or MRIVEN=1<br />
1 point if OHSRGHOS=1, half point if OHSRGSYS, OHSRGNET, or OHSRGVEN=1<br />
1 point if PETHOS=1, half point if PETSYS, PETNET, or PETVEN=1<br />
1 point if SPECTHOS=1, half point if SPECTSYS, SPECTNET, or SPECTVEN=1<br />
1 point if ULTSNHOS=1, half point if ULTSNSYS, ULTSNNET, or ULTSNVEN=1<br />
Hormonal Disorders Technology <strong>Index</strong><br />
1 point if CTSCNHOS=1, half point if CTSCNSYS, CTSCNNET, or CTSCNVEN=1<br />
1 point if DRADFHOS=1, half point if DRADFSYS, DRADFNET, or DRADFVEN=1<br />
1 point if MRIHOS=1, half point if MRISYS, MRINET, or MRIVEN=1<br />
1 point if PETHOS=1, half point if PETSYS, PETNET, or PETVEN=1<br />
1 point if RADTHHOS=1, half point if RADTHSYS, RADTHNET, or RADTHVEN=1<br />
1 point if SPECTHOS=1, half point if SPECTSYS, SPECTNET, or SPECTVEN=1<br />
1 point if ULTSNHOS=1, half point if ULTSNSYS, ULTSNNET, or ULTSNVEN=1
Geriatrics Technology <strong>Index</strong><br />
1 point if CCLABHOS=1, half point if CCLABSYS, CCLABNET, or CCLABVEN=1<br />
1 point if CICHOS=1, half point if CICSYS, CICNET, or CICVEN=1<br />
1 point if CTSCNHOS=1, half point if CTSCNSYS, CTSCNNET, or CTSCNVEN=1<br />
1 point if MRIHOS=1, half point if MRISYS, MRINET, or MRIVEN=1<br />
1 point if PETHOS=1, half point if PETSYS, PETNET, or PETVEN=1<br />
1 point if RADTHHOS=1, half point if RADTHSYS, RADTHNET, or RADTHVEN=1<br />
1 point if SPECTHOS=1, half point if SPECTSYS, SPECTNET, or SPECTVEN=1<br />
1 point if ULTSNHOS=1, half point if ULTSNSYS, ULTSNNET, or ULTSNVEN=1<br />
Gynecology Technology <strong>Index</strong><br />
1 point if CTSCNHOS=1, half point if CTSCNSYS, CTSCNNET, or CTSCNVEN=1<br />
1 point if MAMMSHOS=1, half point if MAMMSSYS, MAMMSNET, or MAMMSVEN=1<br />
1 point if MRIHOS=1, half point if MRISYS, MRINET, or MRIVEN=1<br />
1 point if NICHOS=1, half point if NICSYS, NICNET, or NICVEN=1<br />
1 point if PETHOS=1, half point if PETSYS, PETNET, or PETVEN=1<br />
1 point if RADTHHOS=1, half point if RADTHSYS, RADTHNET, or RADTHVEN=1<br />
1 point if SPECTHOS=1, half point if SPECTSYS, SPECTNET, or SPECTVEN=1<br />
1 point if ULTSNHOS=1, half point if ULTSNSYS, ULTSNNET, or ULTSNVEN=1<br />
Kidney Disease Technology <strong>Index</strong><br />
1 point if CTSCNHOS=1, half point if CTSCNSYS, CTSCNNET, or CTSCNVEN=1<br />
1 point if DRADFHOS=1, half point if DRADFSYS, DRADFNET, or DRADFVEN=1<br />
1 point if ESWLHOS=1, half point if ESWLSYS, ESWLNET, or ESWLVEN=1<br />
1 point if TPLNTHOS=1, half point if TPLNTSYS, TPLNTNET, or TPLNTVEN=1<br />
1 point if ULTSNHOS=1, half point if ULTSNSYS, ULTSNNET, or ULTSNVEN=1<br />
Neurology and Neurosurgery Technology <strong>Index</strong><br />
1 point if CTSCNHOS=1, half point if CTSCNSYS, CTSCNNET, or CTSCNVEN=1<br />
1 point if DRADFHOS=1, half point if DRADFSYS, DRADFNET, or DRADFVEN=1<br />
1 point if MRIHOS=1, half point if MRISYS, MRINET, or MRIVEN=1<br />
1 point if PETHOS=1, half point if PETSYS, PETNET, or PETVEN=1<br />
1 point if RADTHHOS=1, half point if RADTHSYS, RADTHNET, or RADTHVEN=1<br />
1 point if SPECTHOS=1, half point if SPECTSYS, SPECTNET, or SPECTVEN=1<br />
1 point if ULTSNHOS=1, half point if ULTSNSYS, ULTSNNET, or ULTSNVEN=1
Orthopedics Technology <strong>Index</strong><br />
1 point if CTSCNHOS=1, half point if CTSCNSYS, CTSCNNET, or CTSCNVEN=1<br />
1 point if MRIHOS=1, half point if MRISYS, MRINET, or MRIVEN=1<br />
1 point if PETHOS=1, half point if PETSYS, PETNET, or PETVEN=1<br />
1 point if SPECTHOS=1, half point if SPECTSYS, SPECTNET, or SPECTVEN=1<br />
1 point if ULTSNHOS=1, half point if ULTSNSYS, ULTSNNET, or ULTSNVEN=1<br />
Respiratory Disorders Technology <strong>Index</strong><br />
1 point if CTSCNHOS=1, half point if CTSCNSYS, CTSCNNET, or CTSCNVEN=1<br />
1 point if DRADFHOS=1, half point if DRADFSYS, DRADFNET, or DRADFVEN=1<br />
1 point if RADTHHOS=1, half point if RADTHSYS, RADTHNET, or RADTHVEN=1<br />
1 point if ULTSNHOS=1, half point if ULTSNSYS, ULTSNNET, or ULTSNVEN=1<br />
Rheumatology Technology <strong>Index</strong><br />
1 point if CTSCNHOS=1, half point if CTSCNSYS, CTSCNNET, or CTSCNVEN=1<br />
1 point if MRIHOS=1, half point if MRISYS, MRINET, or MRIVEN=1<br />
1 point if PETHOS=1, half point if PETSYS, PETNET, or PETVEN=1<br />
1 point if SPECTHOS=1, half point if SPECTSYS, SPECTNET, or SPECTVEN=1<br />
1 point if ULTSNHOS=1, half point if ULTSNSYS, ULTSNNET, or ULTSNVEN=1<br />
Urology Technology <strong>Index</strong><br />
1 point if CTSCNHOS=1, half point if CTSCNSYS, CTSCNNET, or CTSCNVEN=1<br />
1 point if DRADFHOS=1, half point if DRADFSYS, DRADFNET, or DRADFVEN=1<br />
1 point if ESWLHOS=1, half point if ESWLSYS, ESWLNET, or ESWLVEN=1<br />
1 point if MRIHOS=1, half point if MRISYS, MRINET, or MRIVEN=1<br />
1 point if PETHOS=1, half point if PETSYS, PETNET, or PETVEN=1<br />
1 point if RADTHHOS=1, half point if RADTHSYS, RADTHNET, or RADTHVEN=1<br />
1 point if SPECTHOS=1, half point if SPECTSYS, SPECTNET, or SPECTVEN=1<br />
1 point if ULTSNHOS=1, half point if ULTSNSYS, ULTSNNET, or ULTSNVEN=1<br />
Discharge Planning<br />
1 point if CMNGTHOS=1<br />
1 point if PATEDHOS=1<br />
1 point if PATRPHOS =1
Geriatric Services<br />
1 point if ADULTHOS=1<br />
1 point if ARTHCHOS=1<br />
1 point if ASSTLHOS=1<br />
1 point if GERSVHOS=1<br />
1 point if MEALSHOS=1<br />
1 point if PATRPHOS=1<br />
1 point if TPORTHOS=1<br />
Gynecology Services<br />
1 point if BROOMHOS=1<br />
1 point if OBLEV=2 or 3 and OBHOS=1<br />
1 point if REPROHOS=1<br />
1 point if WOMHCHOS=1<br />
Service Mix<br />
1 point if ALCHHOS=1<br />
1 point if COUTRHOS=1<br />
1 point if HOMEHHOS=1<br />
1 point if PSYEDHOS=1<br />
1 point if PSYLSHOS=1<br />
1 point if REPROHOS=1<br />
1 point if SOCWKHOS=1<br />
1 point if WOMHCHOS=1<br />
R.N.'s to Beds<br />
Full-time Registered Nurses (FTRNTF) divided by Total <strong>Hospital</strong> Beds (HOSPBD)<br />
Trauma<br />
"Yes" if TRAUML90=1 or 2 and TRAUMHOS=1<br />
NCI<br />
"Yes" if a National Cancer Institute designated Comprehensive or Clinical Cancer<br />
Center
Hospice/Palliative Care<br />
"H, P" if (HOSPCHOS=1 or HOSPCSYS=1 or HOSPCNET=1 or HOSPCVEN=1) and (PALHOS=1<br />
or PALSYS=1 or PALNET=1 or PALVEN=1)<br />
"H" if HOSPCHOS=1 or HOSPCSYS=1 or HOSPCNET=1 or HOSPCVEN=1<br />
"P" if PALHOS=1 or PALSYS=1 or PALNET=1 or PALVEN=1<br />
Palliative Care<br />
"Yes" if PALHOS=1 or PALSYS=1 or PALNET=1 or PALVEN=1
Appendix B<br />
2002 Sample Physician<br />
Questionnaire (Long Form)
Appendix C<br />
2002/<strong>2003</strong> Sample Physician<br />
Questionnaire (Short Form)
Appendix D<br />
Predicted Mortality: APR-DRG<br />
Methodology
Introduction to DRGs<br />
<strong>The</strong> All Patient Refined Diagnosis Related Groups (APR-DRGs) were developed by 3M<br />
Health Information Systems (3M-HIS) in conjunction with the National Association <strong>of</strong><br />
Children’s <strong>Hospital</strong>s and Related Institutions (NACHRI). APR-DRGs expand the basic<br />
diagnosis-related group (DRG) structure to address patient severity <strong>of</strong> illness, risk <strong>of</strong><br />
mortality, and resource intensity. <strong>The</strong> APR-DRG Version 15.0 uses the Health Care<br />
Financing Administration (HCFA) Version 14.0 DRG methodology. Because APR-DRGs are<br />
based on DRGs and All Patient DRGs (AP-DRGs), a brief explanation <strong>of</strong> both structures will<br />
be useful.<br />
Current HCFA DRG Structure<br />
Created from Adjacent Diagnosis Related Groups (ADGs) which combine patients<br />
into groups with common characteristics, DRGs were developed by Yale University<br />
in the 1970s to relate a hospital’s case mix index to the resource demands and<br />
associated costs experienced by the hospital.<br />
ADGs were created by subdividing an MDC 2 into two groups based on the presence<br />
or absence <strong>of</strong> an operating room procedure. Surgical patients, identified as those<br />
having an operating room procedure, were then classified by type <strong>of</strong> procedure to<br />
form surgical ADGs. Patients with multiple procedures were assigned to the highest<br />
surgical class. Medical patients were divided into smaller groups, based on their<br />
principal diagnosis, to form medical ADGs.<br />
DRGs use ADGs as a base and then further classify patients into selected disease<br />
and procedure categories based on whether or not they have substantial<br />
comorbidities or complications (CC). Approximately 3,000 diagnosis codes have<br />
been designated by HCFA as substantial CCs, (defined by a list <strong>of</strong> additional<br />
diagnosis codes that a panel <strong>of</strong> physicians felt would increase the length <strong>of</strong> stay by<br />
at least one day for 75 percent <strong>of</strong> the patients). This list covers a broad range <strong>of</strong><br />
disease conditions, and no differentiation in severity or complexity level was made<br />
among the additional diagnoses. <strong>The</strong> patient’s age and discharge status were<br />
sometimes used in the definition <strong>of</strong> DRGs.<br />
2 Major Diagnostic Categories (MDCs) are broad medical and surgical categories one step<br />
hierarchically higher than DRGs (several DRGs roll-up into an MDC). MDCs are divided by body<br />
systems such as nervous; ear, nose, and throat; and respiratory.
Current AP-DRG Structure<br />
In 1987, the New York State Department <strong>of</strong> Health entered into an agreement with<br />
3M-HIS to evaluate the applicability <strong>of</strong> DRGs to a non-Medicare population with a<br />
specific focus on neonates and patients with Human Immunodeficiency Virus (HIV)<br />
infections. <strong>The</strong> DRG definitions developed by this relationship are referred to as the<br />
AP-DRGs.<br />
<strong>The</strong> AP-DRGs are modeled after the HCFA DRGs and attempt to improve the DRGs<br />
in an effort to more accurately predict a hospital’s resource demands and associated<br />
costs for all acute care patients. In the creation <strong>of</strong> AP-DRGs, the modifications<br />
made to the DRG structure can be summarized as follows:<br />
C Except for neonates who die or are transferred within the first few days <strong>of</strong><br />
life, AP-DRGs define six ranges <strong>of</strong> birth weight that represent distinct<br />
demands on hospital resources. Within each birth weight range, neonates<br />
are then subdivided based on the presence <strong>of</strong> a significant operating room<br />
procedure, and then further subdivided based on presence <strong>of</strong> multiple major,<br />
minor, or other problems.<br />
C Assignment to neonatal MDC is based on age. Specifically, the AP-DRGs<br />
assign a patient to the neonatal MDC when the age <strong>of</strong> the patient is less<br />
than 29 days at admission regardless <strong>of</strong> the principal diagnosis.<br />
C MDC 25 was created to account for the highly specialized treatment <strong>of</strong><br />
multiple trauma patients. Patients assigned to MDC 25 have at least two<br />
significant trauma diagnoses from different body sites.<br />
C MDC 20 for alcohol and substance abuse was restructured to differentiate<br />
patients based on the substance being abused.<br />
C Across all MDCs, patient with a tracheostomy were put into either <strong>of</strong> two<br />
tracheostomy AP-DRGs: tracheostomy performed for therapeutic reasons<br />
and tracheostomy representing long-term ventilation.<br />
C All liver, bone marrow, heart, kidney, and lung transplant patients were<br />
assigned to an AP-DRG independent <strong>of</strong> the MDC <strong>of</strong> the principal diagnosis.
C For several MDCs, a single major comorbidity and complication (CC) AP-<br />
DRG was formed across all surgical patients within an MDC and a single<br />
major CC AP-DRG was formed across all medical patients within an MDC.<br />
<strong>The</strong> AP-DRGs introduced changes to the HCFA DRGs in an attempt to depart from<br />
using the principal diagnosis as the initial variable for assignment. <strong>The</strong> AP-DRGs<br />
were designed to more accurately group patients into like groups that provide an<br />
operational means <strong>of</strong> defining and measuring a hospital’s case mix complexity.
All Patient Refined DRGs<br />
APR-DRG Objectives<br />
<strong>The</strong> primary objective <strong>of</strong> the HCFA DRG and AP-DRG patient classification systems<br />
was to relate the type <strong>of</strong> patients treated to the hospital resources they consumed.<br />
This limited focus on resource intensity does not allow providers to classify patients<br />
into other groups for meaningful analysis. <strong>The</strong> APR-DRG patient classification<br />
system goes beyond traditional resource intensity measures and was designed with<br />
the ability to address the following needs:<br />
C Compare hospitals across a wide range <strong>of</strong> resource and outcome measures<br />
C Evaluate differences in inpatient mortality rates<br />
C Implement and support critical pathways<br />
C Identify continuous quality improvement initiatives<br />
C Support internal management and planning systems<br />
C Manage capitated payment arrangements.<br />
To meet these needs, the APR-DRG system classifies patients according to severity<br />
<strong>of</strong> illness, risk <strong>of</strong> mortality, and resource intensity. <strong>The</strong>refore, in the APR-DRG<br />
classification system a patient is assigned three distinct descriptors: base APR-<br />
DRG, severity <strong>of</strong> illness subclass, and risk <strong>of</strong> mortality subclass.<br />
Severity <strong>of</strong> illness can be defined as the extent <strong>of</strong> physiologic decompensation or<br />
organ system loss <strong>of</strong> function experienced by the patient. In contrast, risk <strong>of</strong><br />
mortality is defined as the patient’s likelihood <strong>of</strong> dying.<br />
For analyses such as evaluating resource intensity or patient care outcomes, the<br />
base APR-DRGs in conjunction with the severity <strong>of</strong> illness subclass is used. For<br />
evaluating patient mortality, the base APR-DRGs in conjunction with the risk <strong>of</strong><br />
mortality subclass is used.
Development <strong>of</strong> the APR-DRGs<br />
<strong>The</strong> AP-DRGs were used as the base DRGs in the development <strong>of</strong> the APR-DRGs<br />
because they were representative <strong>of</strong> the entire inpatient population and accounted<br />
for populations not included in DRGs at the time <strong>of</strong> development. Several<br />
consolidations, additions, and modifications were made to the AP-DRGs to form the<br />
list <strong>of</strong> APR-DRGs used in the severity <strong>of</strong> illness and risk <strong>of</strong> mortality subclass<br />
assignments.<br />
<strong>The</strong> following list summarizes the revisions made to the AP-DRGs in the creation<br />
<strong>of</strong> the APR-DRGs:<br />
C All age, CC, and major CC splits were consolidated.<br />
C Splits based on discharge status or death were consolidated.<br />
C Definitions based on the presence or absence <strong>of</strong> a complicated principal<br />
diagnosis were consolidated.<br />
C Additional APR-DRGs were created for pediatric patients.<br />
C APR-DRGs for newborns were completely restructured to create medical<br />
and surgical hierarchies within each birth weight range.<br />
C Low volume APR-DRGs were consolidated into other related APR-DRGs.<br />
C APR-DRGs that could be explained by the severity <strong>of</strong> illness subclasses<br />
were consolidated into one APR-DRG.<br />
C Due to risk <strong>of</strong> mortality subclasses, several APR-DRGs were split to account<br />
for significant differences in mortality between patient groups.<br />
APR-DRG Severity <strong>of</strong> Illness Subclass Assignment<br />
With the exception <strong>of</strong> neonatal patients, after a patient has been given an APR-DRG<br />
code, a Severity <strong>of</strong> Illness Subclass is assigned based on the level <strong>of</strong> the secondary<br />
diagnoses, presence <strong>of</strong> certain non-OR procedures, and the interaction among<br />
secondary diagnoses, age, APR-DRG and principal diagnosis. Neonatal patients
Phase I<br />
have their own hierarchical method for determining severity <strong>of</strong> illness and will be<br />
discussed later. <strong>The</strong> four severity <strong>of</strong> illness subclasses are:<br />
Subclass (PSC) Severity <strong>of</strong> Illness<br />
1 Minor (Includes non CC)<br />
2 Moderate<br />
3 Major<br />
4 Extreme<br />
<strong>The</strong> severity <strong>of</strong> illness subclass is used in conjunction with the patient’s base APR-<br />
DRG for analysis such as evaluating resource intensity or patient care outcomes.<br />
A patient’s severity <strong>of</strong> illness subclass should not be used with their DRG because<br />
several DRGs may form one APR-DRG. <strong>The</strong>refore, since severity <strong>of</strong> illness<br />
subclasses correspond to the APR-DRG number and not the DRG, it is important<br />
to use the APR-DRG number to accurately interpret data.<br />
<strong>The</strong> process for assigning a patient a severity <strong>of</strong> illness subclass is a three phase<br />
process and is summarized as follows:<br />
C Secondary diagnoses that are closely related to the principal diagnosis are<br />
eliminated from further analysis.<br />
C Remaining secondary diagnoses are assigned one <strong>of</strong> four distinct Standard Severity<br />
<strong>of</strong> Illness Levels. Figure 1 presents examples <strong>of</strong> secondary diagnoses in each<br />
severity <strong>of</strong> illness level.
Figure 1. Examples <strong>of</strong> Secondary Diagnoses by Severity <strong>of</strong> Illness Level<br />
Severity <strong>of</strong> Illness Level Examples <strong>of</strong> Secondary Diagnoses<br />
Minor Benign hypertension, acute bronchitis, lumbago<br />
Moderate Chronic renal failure, viral pneumonia, diverticulitis<br />
Major Diabetic ketoacidosis, chronic heart failure, acute cholecystitis<br />
Extreme<br />
Septicemia, acute myocardial infarction, cerebral vascular<br />
accident<br />
C <strong>The</strong> Standard Severity <strong>of</strong> Illness Level is modified for some secondary diagnoses<br />
based on age, APR-DRG, and presence <strong>of</strong> non-OR procedures. Figure 2 displays<br />
an example <strong>of</strong> modifications to the standard severity <strong>of</strong> illness level based on the<br />
APR-DRG.<br />
Figure 2. Examples <strong>of</strong> Standard Severity <strong>of</strong> Illness Modifications<br />
Secondary<br />
Standard Severity <strong>of</strong><br />
APR-DRG Modified Severity<br />
Diagnosis<br />
Illness Level<br />
<strong>of</strong> Illness Level<br />
Stridor Moderate Bronchitis and asthma Minor<br />
Chronic renal failure Moderate Diabetes Major<br />
Cardiomegaly Moderate Chronic heart failure Minor<br />
Uncomplicated<br />
diabetes<br />
Minor Vaginal delivery Moderate
Phase II<br />
C All secondary diagnoses that are closely related to other secondary diagnoses are<br />
eliminated from further analysis, and the secondary diagnosis with the highest<br />
Severity <strong>of</strong> Illness Level is retained. This prevents double counting clinically similar<br />
diagnoses.<br />
C <strong>The</strong> Base Severity <strong>of</strong> Illness Subclass <strong>of</strong> the patient is set to the highest Standard<br />
Severity <strong>of</strong> Illness Level <strong>of</strong> any <strong>of</strong> the secondary diagnoses.<br />
C Patients with a Base Severity <strong>of</strong> Illness Subclass <strong>of</strong> major (3) or extreme (4), will be<br />
reduced to the next lower subclass unless the patient has multiple secondary<br />
diagnoses with a high Standard Severity <strong>of</strong> Illness Level. Figure 3 displays the<br />
requirements for keeping a severity <strong>of</strong> illness subclass <strong>of</strong> major or extreme.<br />
Figure 3. Multiple Secondary Diagnoses Requirements<br />
Base Severity <strong>of</strong><br />
Multiple Secondary Diagnoses Requirements<br />
Illness Subclass to Prevent Reduction <strong>of</strong> Severity <strong>of</strong> Illness Subclass<br />
Major Two or more secondary diagnoses that are major or one secondary<br />
diagnosis that is major and at least two secondary diagnoses that are<br />
moderate<br />
Extreme Two or more secondary diagnoses that are extreme or one secondary<br />
diagnosis that is extreme and at least two secondary diagnoses that are<br />
major
Phase III<br />
C A minimum Severity <strong>of</strong> Illness Subclass is established based on the patient’s<br />
principal diagnosis. This accounts for patients assigned to codes that contain both<br />
the underlying disease and an associated manifestation <strong>of</strong> the disease (i.e. diabetes<br />
with hyperosmolar coma), but is only assigned to the APR-DRG that accounts for<br />
the underlying disease.<br />
C A minimum Severity <strong>of</strong> Illness Subclass is established based on combinations <strong>of</strong><br />
principal diagnosis and age for specific APR-DRGs.<br />
C A minimum Severity <strong>of</strong> Illness Subclass is established for some APR-DRGs with<br />
certain APR-DRG and non-OR procedure combinations as well as principal<br />
diagnosis and non-OR procedure combinations<br />
C A minimum Severity <strong>of</strong> Illness Subclass is established based on the presence <strong>of</strong><br />
certain combinations <strong>of</strong> secondary diagnoses. Figure 4 shows the combination <strong>of</strong><br />
secondary diagnoses necessary to increase the severity <strong>of</strong> illness subclass to a<br />
minimum severity <strong>of</strong> illness level. For example, a type 1 combination would be a<br />
major bacterial infection with pleural effusion. If a diagnosis from both <strong>of</strong> these<br />
categories is present plus at least one other secondary diagnosis that is at least a<br />
major severity <strong>of</strong> illness level, then the minimum patient severity <strong>of</strong> illness subclass<br />
will be extreme.
Figure 4. Minimum Severity <strong>of</strong> Illness Requirements<br />
Combination<br />
Type<br />
Combination <strong>of</strong><br />
Categories<br />
1 Specified combinations <strong>of</strong> two<br />
major categories<br />
2 Specified combinations <strong>of</strong> two<br />
moderate categories<br />
3 Specified combinations <strong>of</strong> a<br />
moderate and a minor category<br />
4 Specified combinations <strong>of</strong> two<br />
minor categories<br />
5 Specified combinations <strong>of</strong> two<br />
moderate categories<br />
Additional Secondary<br />
Diagnoses Required<br />
At least one additional<br />
major secondary diagnosis<br />
At least one additional<br />
moderate secondary diagnosis<br />
At least one additional<br />
moderate secondary diagnosis<br />
At least two additional minor<br />
secondary diagnoses<br />
Minimum<br />
Severity <strong>of</strong><br />
Illness<br />
Extreme<br />
Major<br />
Major<br />
Moderate<br />
None Major<br />
C <strong>The</strong> final patient Severity <strong>of</strong> Illness Subclass is selected based on the maximum <strong>of</strong><br />
the Phase II Base Patient Severity <strong>of</strong> Illness Subclass and the Phase III minimum<br />
Severity <strong>of</strong> Illness Subclass<br />
Both medical and surgical patients are assigned a severity <strong>of</strong> illness level <strong>of</strong> 1-4 based on<br />
the assignment process outlined previously.
APR-DRG Risk <strong>of</strong> Mortality Subclass Assignment<br />
Similar to the Severity <strong>of</strong> Illness Subclass assignment, the Risk <strong>of</strong> Mortality Subclass<br />
assignment is based on the level <strong>of</strong> the secondary diagnoses and the interaction among<br />
secondary diagnoses, age, APR-DRG, and principal diagnosis. In general, the patients<br />
Risk <strong>of</strong> Mortality Level and Subclass will be lower than the Severity <strong>of</strong> Illness Level and<br />
Subclass, respectively. Neonatal patients have their own hierarchical method for<br />
determining risk <strong>of</strong> mortality and will be discussed later. <strong>The</strong> four severity <strong>of</strong> illness<br />
subclasses are:<br />
Subclass (PSC2) Risk <strong>of</strong> Mortality<br />
1 Minor (includes non CC)<br />
2 Moderate<br />
3 Major<br />
4 Extreme<br />
<strong>The</strong> risk <strong>of</strong> mortality subclass is used in conjunction with the patient’s base APR-DRG for<br />
evaluating patient mortality. Like the severity <strong>of</strong> illness subclass, a patient’s risk <strong>of</strong> mortality<br />
subclass should not be used with their DRG because several DRGs may form one APR-<br />
DRG. <strong>The</strong>refore, since risk <strong>of</strong> mortality subclasses correspond to the APR-DRG number<br />
and not the DRG, it is important to use the APR-DRG number to accurately interpret data.<br />
<strong>The</strong> process for assigning a patient a risk <strong>of</strong> mortality subclass is a three phase process and<br />
is summarized as follows:<br />
Phase I<br />
C Secondary diagnoses that are closely related to the principal diagnosis are<br />
eliminated from further analysis.<br />
C Remaining secondary diagnoses are assigned one <strong>of</strong> four distinct Risk <strong>of</strong> Mortality<br />
Levels.<br />
C <strong>The</strong> Risk <strong>of</strong> Mortality Level is modified for some secondary diagnosis based on the<br />
patients age and APR-DRG.
Phase II<br />
C All secondary diagnoses that are closely related to other secondary diagnoses are<br />
eliminated from further analysis, and the secondary diagnosis with the highest Risk<br />
<strong>of</strong> Mortality Level is retained. This prevents double counting clinically-similar<br />
diagnoses.<br />
C <strong>The</strong> Base Risk <strong>of</strong> Mortality Subclass <strong>of</strong> the patient is set to the highest Risk <strong>of</strong><br />
Mortality Level <strong>of</strong> any <strong>of</strong> the secondary diagnoses.<br />
C Patients with a Base Risk <strong>of</strong> Mortality Subclass <strong>of</strong> major (3) or extreme (4), will be<br />
reduced to the next lower subclass unless the patient has multiple secondary<br />
diagnoses with a high Risk <strong>of</strong> Mortality Level.<br />
Phase III<br />
C A minimum Risk <strong>of</strong> Mortality Subclass is established based on the patients principal<br />
diagnosis. This accounts for specific APR-DRGs that have a principal diagnosis<br />
indicative <strong>of</strong> a higher risk <strong>of</strong> mortality relative to the other principal diagnoses in the<br />
APR-DRG.<br />
C A minimum Risk <strong>of</strong> Mortality Subclass is established based on the presence <strong>of</strong><br />
certain combinations <strong>of</strong> secondary diagnoses.<br />
C <strong>The</strong> final patient Risk <strong>of</strong> Mortality Subclass is selected based on the maximum <strong>of</strong> the<br />
Phase II Base Risk <strong>of</strong> Mortality Subclass and the Phase III minimum Risk <strong>of</strong><br />
Mortality Subclass.
Appendix E<br />
Diagnosis-Related Group<br />
(DRG) Groupings by Specialty
Cancer<br />
<strong>2003</strong> Diagnosis-Related Group (DRG) Groupings by Specialty<br />
#10 NERVOUS SYSTEM NEOPLASMS W CC<br />
#11 NERVOUS SYSTEM NEOPLASMS W/O CC<br />
#64 EAR, NOSE, MOUTH & THROAT MALIGNANCY<br />
#82 RESPIRATORY NEOPLASMS<br />
#172 DIGESTIVE MALIGNANCY W CC<br />
#173 DIGESTIVE MALIGNANCY W/O CC<br />
#199 HEPATOBILIARY DIAGNOSTIC PROCEDURE FOR MALIGNANCY<br />
#203 MALIGNANCY OF HEPATOBILIARY SYSTEM OR PANCREAS<br />
#239 PATHOLOGICAL FRACTURES & MUSCULOSKELETAL & CONN TISS MALIGNANCY<br />
#257 TOTAL MASTECTOMY FOR MALIGNANCY W CC<br />
#258 TOTAL MASTECTOMY FOR MALIGNANCY W/O CC<br />
#259 SUBTOTAL MASTECTOMY FOR MALIGNANCY W CC<br />
#260 SUBTOTAL MASTECTOMY FOR MALIGNANCY W/O CC<br />
#274 MALIGNANT BREAST DISORDERS W CC<br />
#275 MALIGNANT BREAST DISORDERS W/O CC<br />
#318 KIDNEY & URINARY TRACT NEOPLASMS W CC<br />
#319 KIDNEY & URINARY TRACT NEOPLASMS W/O CC<br />
#338 TESTES PROCEDURES, FOR MALIGNANCY<br />
#344 OTHER MALE REPRODUCTIVE SYSTEM O.R. PROCEDURES FOR MALIGNANCY<br />
#346 MALIGNANCY, MALE REPRODUCTIVE SYSTEM, W CC<br />
#347 MALIGNANCY, MALE REPRODUCTIVE SYSTEM, W/O CC<br />
#354 UTERINE, ADNEXA PROC FOR NON-OVARIAN/ADNEXAL MALIG W CC<br />
#355 UTERINE, ADNEXA PROC FOR NON-OVARIAN/ADNEXAL MALIG W/O CC<br />
#357 UTERINE & ADNEXA PROC FOR OVARIAN OR ADNEXAL MALIGNANCY<br />
#366 MALIGNANCY, FEMALE REPRODUCTIVE SYSTEM W CC<br />
#367 MALIGNANCY, FEMALE REPRODUCTIVE SYSTEM W/O CC<br />
#400 LYMPHOMA & LEUKEMIA W MAJOR O.R. PROCEDURE<br />
#401 LYMPHOMA & NON-ACUTE LEUKEMIA W OTHER O.R. PROC W CC<br />
#402 LYMPHOMA & NON-ACUTE LEUKEMIA W OTHER O.R. PROC W/O CC<br />
#403 LYMPHOMA & NON-ACUTE LEUKEMIA W CC<br />
#404 LYMPHOMA & NON-ACUTE LEUKEMIA W/O CC<br />
#405 ACUTE LEUKEMIA W/O MAJOR O.R. PROCEDURE AGE 0-17<br />
#409 RADIOTHERAPY<br />
#410 CHEMOTHERAPY W/O ACUTE LEUKEMIA AS SECONDARY DIAGNOSIS<br />
#411 HISTORY OF MALIGNANCY W/O ENDOSCOPY<br />
#412 HISTORY OF MALIGNANCY W ENDOSCOPY<br />
#413 OTHER MYELOPROLIF DIS OR POORLY DIFF NEOPL DIAG W CC<br />
#414 OTHER MYELOPROLIF DIS OR POORLY DIFF NEOPL DIAG W/O CC<br />
#473 ACUTE LEUKEMIA W/O MAJOR O.R. PROCEDURE AGE >17<br />
#492 CHEMOTHERAPY W ACUTE LEUKEMIA AS SECONDARY DIAGNOSIS
Digestive Disorders<br />
#146 RECTAL RESECTION W CC<br />
#147 RECTAL RESECTION W/O CC<br />
#148 MAJOR SMALL & LARGE BOWEL PROCEDURES W CC<br />
#149 MAJOR SMALL & LARGE BOWEL PROCEDURES W/O CC<br />
#150 PERITONEAL ADHESIOLYSIS W CC<br />
#151 PERITONEAL ADHESIOLYSIS W/O CC<br />
#152 MINOR SMALL & LARGE BOWEL PROCEDURES W CC<br />
#153 MINOR SMALL & LARGE BOWEL PROCEDURES W/O CC<br />
#154 STOMACH, ESOPHAGEAL & DUODENAL PROCEDURES AGE >17 W CC<br />
#155 STOMACH, ESOPHAGEAL & DUODENAL PROCEDURES AGE >17 W/O CC<br />
#156 STOMACH, ESOPHAGEAL & DUODENAL PROCEDURES AGE 0-17<br />
#170 OTHER DIGESTIVE SYSTEM O.R. PROCEDURES W CC<br />
#171 OTHER DIGESTIVE SYSTEM O.R. PROCEDURES W/O CC<br />
#172 DIGESTIVE MALIGNANCY W CC<br />
#173 DIGESTIVE MALIGNANCY W/O CC<br />
#174 G.I. HEMORRHAGE W CC<br />
#175 G.I. HEMORRHAGE W/O CC<br />
#176 COMPLICATED PEPTIC ULCER<br />
#177 UNCOMPLICATED PEPTIC ULCER W CC<br />
#178 UNCOMPLICATED PEPTIC ULCER W/O CC<br />
#179 INFLAMMATORY BOWEL DISEASE<br />
#180 G.I. OBSTRUCTION W CC<br />
#181 G.I. OBSTRUCTION W/O CC<br />
#182 ESOPHAGITIS, GASTROENT & MISC DIGEST DISORDERS AGE >17 W CC<br />
#183 ESOPHAGITIS, GASTROENT & MISC DIGEST DISORDERS AGE >17 W/O CC<br />
#184 ESOPHAGITIS, GASTROENT & MISC DIGEST DISORDERS AGE 0-17<br />
#188 OTHER DIGESTIVE SYSTEM DIAGNOSES AGE >17 W CC<br />
#189 OTHER DIGESTIVE SYSTEM DIAGNOSES AGE >17 W/O CC<br />
#190 OTHER DIGESTIVE SYSTEM DIAGNOSES AGE 0-17<br />
#191 PANCREAS, LIVER & SHUNT PROCEDURES W CC<br />
#192 PANCREAS, LIVER & SHUNT PROCEDURES W/O CC<br />
#193 BILIARY TRACT PROC EXCEPT ONLY CHOLECYST W OR W/O C.D.E. W CC<br />
#194 BILIARY TRACT PROC EXCEPT ONLY CHOLECYST W OR W/O C.D.E. W/O CC<br />
#195 CHOLECYSTECTOMY W C.D.E. W CC<br />
#196 CHOLECYSTECTOMY W C.D.E. W/O CC<br />
#197 CHOLECYSTECTOMY EXCEPT BY LAPAROSCOPE W/O C.D.E. W CC<br />
#198 CHOLECYSTECTOMY EXCEPT BY LAPAROSCOPE W/O C.D.E. W/O CC<br />
#200 HEPATOBILIARY DIAGNOSTIC PROCEDURE FOR NON-MALIGNANCY<br />
#201 OTHER HEPATOBILIARY OR PANCREAS O.R. PROCEDURES<br />
#202 CIRRHOSIS & ALCOHOLIC HEPATITIS<br />
#203 MALIGNANCY OF HEPATOBILIARY SYSTEM OR PANCREAS<br />
#204 DISORDERS OF PANCREAS EXCEPT MALIGNANCY<br />
#205 DISORDERS OF LIVER EXCEPT MALIG,CIRR,ALC HEPA W CC
#206 DISORDERS OF LIVER EXCEPT MALIG,CIRR,ALC HEPA W/O CC<br />
#207 DISORDERS OF THE BILIARY TRACT W CC<br />
#208 DISORDERS OF THE BILIARY TRACT W/O CC<br />
#493 LAPAROSCOPIC CHOLECYSTECTOMY W/O C.D.E. W CC<br />
#494 LAPAROSCOPIC CHOLECYSTECTOMY W/O C.D.E. W/O CC<br />
Ear, Nose, and Throat<br />
#49 MAJOR HEAD & NECK PROCEDURES<br />
#50 SIALOADENECTOMY<br />
#51 SALIVARY GLAND PROCEDURES EXCEPT SIALOADENECTOMY<br />
#55 MISCELLANEOUS EAR, NOSE, MOUTH & THROAT PROCEDURES<br />
#57 T&A PROC, EXCEPT TONSILLECTOMY &/OR ADENOIDECTOMY ONLY, AGE >17<br />
#58 T&A PROC, EXCEPT TONSILLECTOMY &/OR ADENOIDECTOMY ONLY, AGE 0-17<br />
#59 TONSILLECTOMY &/OR ADENOIDECTOMY ONLY, AGE >17<br />
#61 MYRINGOTOMY W TUBE INSERTION AGE >17<br />
#62 MYRINGOTOMY W TUBE INSERTION AGE 0-17<br />
#63 OTHER EAR, NOSE, MOUTH & THROAT O.R. PROCEDURES<br />
#65 DYSEQUILIBRIUM<br />
#66 EPISTAXIS<br />
#67 EPIGLOTTITIS<br />
#68 OTITIS MEDIA & URI AGE >17 W CC<br />
#69 OTITIS MEDIA & URI AGE >17 W/O CC<br />
#70 OTITIS MEDIA & URI AGE 0-17<br />
#71 LARYNGOTRACHEITIS<br />
#72 NASAL TRAUMA & DEFORMITY<br />
#73 OTHER EAR, NOSE, MOUTH & THROAT DIAGNOSES AGE >17<br />
#74 OTHER EAR, NOSE, MOUTH & THROAT DIAGNOSES AGE 0-17<br />
Geriatrics<br />
ALL CASES
Gynecology<br />
#353 PELVIC EVISCERATION, RADICAL HYSTERECTOMY & RADICAL VULVECTOMY<br />
#354 UTERINE, ADNEXA PROC FOR NON-OVARIAN/ADNEXAL MALIG W CC<br />
#355 UTERINE, ADNEXA PROC FOR NON-OVARIAN/ADNEXAL MALIG W/O CC<br />
#356 FEMALE REPRODUCTIVE SYSTEM RECONSTRUCTIVE PROCEDURES<br />
#357 UTERINE & ADNEXA PROC FOR OVARIAN OR ADNEXAL MALIGNANCY<br />
#358 UTERINE & ADNEXA PROC FOR NON-MALIGNANCY W CC<br />
#359 UTERINE & ADNEXA PROC FOR NON-MALIGNANCY W/O CC<br />
#360 VAGINA, CERVIX & VULVA PROCEDURES<br />
#361 LAPAROSCOPY & INCISIONAL TUBAL INTERRUPTION<br />
#362 ENDOSCOPIC TUBAL INTERRUPTION<br />
#363 D&C, CONIZATION & RADIO-IMPLANT, FOR MALIGNANCY<br />
#364 D&C, CONIZATION EXCEPT FOR MALIGNANCY<br />
#365 OTHER FEMALE REPRODUCTIVE SYSTEM O.R. PROCEDURES<br />
#366 MALIGNANCY, FEMALE REPRODUCTIVE SYSTEM W CC<br />
#367 MALIGNANCY, FEMALE REPRODUCTIVE SYSTEM W/O CC<br />
#368 INFECTIONS, FEMALE REPRODUCTIVE SYSTEM<br />
#369 MENSTRUAL & OTHER FEMALE REPRODUCTIVE SYSTEM DISORDERS
Heart and Heart Surgery<br />
#75 MAJOR CHEST PROCEDURES<br />
#104 CARDIAC VALVE & OTHER MAJOR CARDIOTHORACIC PX W CARDIAC CATH<br />
#105 CARDIAC VALVE & OTHER MAJOR CARDIOTHORACIC PX W/O CARDIAC CATH<br />
#106 CORONARY BYPASS WITH PTCA<br />
#107 CORONARY BYPASS WITH CARDIAC CATH<br />
#108 OTHER CARDIOTHORACIC PROCEDURES<br />
#110 MAJOR CARDIOVASCULAR PROCEDURES W CC<br />
#111 MAJOR CARDIOVASCULAR PROCEDURES W/O CC<br />
#115 PRM CARD PACEM IMPL W AMI,HRT FAIL OR SHK,OR AICD LEAD OR GNRTR<br />
PROC<br />
#116 OTHER PERMANENT CARDIAC PACEMAKER IMPLANTATION<br />
#117 CARDIAC PACEMAKER REVISION EXCEPT DEVICE REPLACEMENT<br />
#118 CARDIAC PACEMAKER DEVICE REPLACEMENT<br />
#121 CIRCULATORY DISORDERS W AMI & MAJOR COMP, DISCHARGED ALIVE<br />
#122 CIRCULATORY DISORDERS W AMI W/O MAJOR COMP, DISCHARGED ALIVE<br />
#123 CIRCULATORY DISORDERS W AMI, EXPIRED<br />
#126 ACUTE & SUBACUTE ENDOCARDITIS<br />
#127 HEART FAILURE & SHOCK<br />
#132 ATHEROSCLEROSIS W CC<br />
#133 ATHEROSCLEROSIS W/O CC<br />
#134 HYPERTENSION<br />
#135 CARDIAC CONGENITAL & VALVULAR DISORDERS AGE >17 W CC<br />
#136 CARDIAC CONGENITAL & VALVULAR DISORDERS AGE >17 W/O CC<br />
#137 CARDIAC CONGENITAL & VALVULAR DISORDERS AGE 0-17<br />
#138 CARDIAC ARRHYTHMIA & CONDUCTION DISORDERS W CC<br />
#139 CARDIAC ARRHYTHMIA & CONDUCTION DISORDERS W/O CC<br />
#140 ANGINA PECTORIS<br />
#143 CHEST PAIN<br />
#144 OTHER CIRCULATORY SYSTEM DIAGNOSES W CC<br />
#145 OTHER CIRCULATORY SYSTEM DIAGNOSES W/O CC<br />
#514 CARDIAC DEFIBRILLATOR IMPLANT W CARDIAC CATH<br />
#515 CARDIAC DEFIBRILLATOR IMPLANT W/O CARDIAC CATH<br />
#516 PERCUTANEOUS CARDIOVASCULAR PROC W AMI<br />
#517 PERC CARDIO PROC W CORONARY ARTERY STENT W/O AMI<br />
#518 PERC CARDIO PROC W/O CORONARY ARTERY STENT OR AMI
Hormonal Disorders<br />
#286 ADRENAL & PITUITARY PROCEDURES<br />
#287 SKIN GRAFTS & WOUND DEBRID FOR ENDOC, NUTRIT & METAB DISORDERS<br />
#288 O.R. PROCEDURES FOR OBESITY<br />
#289 PARATHYROID PROCEDURES<br />
#290 THYROID PROCEDURES<br />
#292 OTHER ENDOCRINE, NUTRIT & METAB O.R. PROC W CC<br />
#293 OTHER ENDOCRINE, NUTRIT & METAB O.R. PROC W/O CC<br />
#294 DIABETES AGE >35<br />
#295 DIABETES AGE 0-35<br />
#296 NUTRITIONAL & MISC METABOLIC DISORDERS AGE >17 W CC<br />
#297 NUTRITIONAL & MISC METABOLIC DISORDERS AGE >17 W/O CC<br />
#298 NUTRITIONAL & MISC METABOLIC DISORDERS AGE 0-17<br />
#299 INBORN ERRORS OF METABOLISM<br />
#300 ENDOCRINE DISORDERS W CC<br />
#301 ENDOCRINE DISORDERS W/O CC<br />
Kidney Disease<br />
#316 RENAL FAILURE<br />
#317 ADMIT FOR RENAL DIALYSIS<br />
#320 KIDNEY & URINARY TRACT INFECTIONS AGE >17 W CC<br />
#321 KIDNEY & URINARY TRACT INFECTIONS AGE >17 W/O CC<br />
#322 KIDNEY & URINARY TRACT INFECTIONS AGE 0-17<br />
#325 KIDNEY & URINARY TRACT SIGNS & SYMPTOMS AGE >17 W CC<br />
#326 KIDNEY & URINARY TRACT SIGNS & SYMPTOMS AGE >17 W/O CC<br />
#327 KIDNEY & URINARY TRACT SIGNS & SYMPTOMS AGE 0-17<br />
#331 OTHER KIDNEY & URINARY TRACT DIAGNOSES AGE >17 W CC<br />
#332 OTHER KIDNEY & URINARY TRACT DIAGNOSES AGE >17 W/O CC<br />
#333 OTHER KIDNEY & URINARY TRACT DIAGNOSES AGE 0-17
Neurology and Neurosurgery<br />
#1 CRANIOTOMY AGE >17 EXCEPT FOR TRAUMA<br />
#2 CRANIOTOMY FOR TRAUMA AGE >17<br />
#3 CRANIOTOMY AGE 0-17<br />
#4 SPINAL PROCEDURES<br />
#5 EXTRACRANIAL VASCULAR PROCEDURES<br />
#6 CARPAL TUNNEL RELEASE<br />
#7 PERIPH & CRANIAL NERVE & OTHER NERV SYST PROC W CC<br />
#8 PERIPH & CRANIAL NERVE & OTHER NERV SYST PROC W/O CC<br />
#9 SPINAL DISORDERS & INJURIES<br />
#12 DEGENERATIVE NERVOUS SYSTEM DISORDERS<br />
#13 MULTIPLE SCLEROSIS & CEREBELLAR ATAXIA<br />
#14 SPECIFIC CEREBROVASCULAR DISORDERS EXCEPT TIA<br />
#15 TRANSIENT ISCHEMIC ATTACK & PRECEREBRAL OCCLUSIONS<br />
#16 NONSPECIFIC CEREBROVASCULAR DISORDERS W CC<br />
#17 NONSPECIFIC CEREBROVASCULAR DISORDERS W/O CC<br />
#18 CRANIAL & PERIPHERAL NERVE DISORDERS W CC<br />
#19 CRANIAL & PERIPHERAL NERVE DISORDERS W/O CC<br />
#20 NERVOUS SYSTEM INFECTION EXCEPT VIRAL MENINGITIS<br />
#21 VIRAL MENINGITIS<br />
#22 HYPERTENSIVE ENCEPHALOPATHY<br />
#23 NONTRAUMATIC STUPOR & COMA<br />
#24 SEIZURE & HEADACHE AGE >17 W CC<br />
#25 SEIZURE & HEADACHE AGE >17 W/O CC<br />
#26 SEIZURE & HEADACHE AGE 0-17<br />
#27 TRAUMATIC STUPOR & COMA, COMA >1 HR<br />
#28 TRAUMATIC STUPOR & COMA, COMA 17 W CC<br />
#29 TRAUMATIC STUPOR & COMA, COMA 17 W/O CC<br />
#30 TRAUMATIC STUPOR & COMA, COMA 17 W CC<br />
#32 CONCUSSION AGE >17 W/O CC<br />
#33 CONCUSSION AGE 0-17<br />
#34 OTHER DISORDERS OF NERVOUS SYSTEM W CC<br />
#35 OTHER DISORDERS OF NERVOUS SYSTEM W/O CC
Orthopedics<br />
#209 MAJOR JOINT & LIMB REATTACHMENT PROCEDURES OF LOWER EXTREMITY<br />
#210 HIP & FEMUR PROCEDURES EXCEPT MAJOR JOINT AGE >17 W CC<br />
#211 HIP & FEMUR PROCEDURES EXCEPT MAJOR JOINT AGE >17 W/O CC<br />
#212 HIP & FEMUR PROCEDURES EXCEPT MAJOR JOINT AGE 0-17<br />
#218 LOWER EXTREM & HUMER PROC EXCEPT HIP,FOOT,FEMUR AGE >17 W CC<br />
#219 LOWER EXTREM & HUMER PROC EXCEPT HIP,FOOT,FEMUR AGE >17 W/O CC<br />
#220 LOWER EXTREM & HUMER PROC EXCEPT HIP,FOOT,FEMUR AGE 0-17<br />
#223 MAJOR SHOULDER/ELBOW PROC, OR OTHER UPPER EXTREMITY PROC W CC<br />
#224 SHOULDER,ELBOW OR FOREARM PROC,EXC MAJOR JOINT PROC, W/O CC<br />
#225 FOOT PROCEDURES<br />
#226 SOFT TISSUE PROCEDURES W CC<br />
#227 SOFT TISSUE PROCEDURES W/O CC<br />
#228 MAJOR THUMB OR JOINT PROC,OR OTH HAND OR WRIST PROC W CC<br />
#229 HAND OR WRIST PROC, EXCEPT MAJOR JOINT PROC, W/O CC<br />
#230 LOCAL EXCISION & REMOVAL OF INT FIX DEVICES OF HIP & FEMUR<br />
#231 LOCAL EXCISION & REMOVAL OF INT FIX DEVICES EXCEPT HIP & FEMUR<br />
#232 ARTHROSCOPY<br />
#233 OTHER MUSCULOSKELET SYS & CONN TISS O.R. PROC W CC<br />
#234 OTHER MUSCULOSKELET SYS & CONN TISS O.R. PROC W/O CC<br />
#235 FRACTURES OF FEMUR<br />
#236 FRACTURES OF HIP & PELVIS<br />
#237 SPRAINS, STRAINS, & DISLOCATIONS OF HIP, PELVIS & THIGH<br />
#238 OSTEOMYELITIS<br />
#248 TENDONITIS, MYOSITIS & BURSITIS<br />
#250 FX, SPRN, STRN & DISL OF FOREARM, HAND, FOOT AGE >17 W CC<br />
#251 FX, SPRN, STRN & DISL OF FOREARM, HAND, FOOT AGE >17 W/O CC<br />
#252 FX, SPRN, STRN & DISL OF FOREARM, HAND, FOOT AGE 0-17<br />
#253 FX, SPRN, STRN & DISL OF UPARM,LOWLEG EX FOOT AGE >17 W CC<br />
#254 FX, SPRN, STRN & DISL OF UPARM,LOWLEG EX FOOT AGE >17 W/O CC<br />
#255 FX, SPRN, STRN & DISL OF UPARM, LOWLEG EX FOOT AGE 0-17<br />
#471 BILATERAL OR MULTIPLE MAJOR JOINT PROCS OF LOWER EXTREMITY<br />
#485 LIMB REATTACHMENT, HIP AND FEMUR PROC FOR MULTIPLE SIGNIFICANT TRAUM<br />
#491 MAJOR JOINT & LIMB REATTACHMENT PROCEDURES OF UPPER EXTREMITY<br />
#496 COMBINED ANTERIOR/POSTERIOR SPINAL FUSION<br />
#497 SPINAL FUSION EXCEPT CERVICAL W CC<br />
#498 SPINAL FUSION EXCEPT CERVICAL W/O CC<br />
#501 KNEE PROCEDURES W PDX OF INFECTION W CC<br />
#502 KNEE PROCEDURES W PDX OF INFECTION W/O CC<br />
#503 KNEE PROCEDURES W/O PDX OF INFECTION
Respiratory Disorders<br />
#76 OTHER RESP SYSTEM O.R. PROCEDURES W CC<br />
#77 OTHER RESP SYSTEM O.R. PROCEDURES W/O CC<br />
#78 PULMONARY EMBOLISM<br />
#79 RESPIRATORY INFECTIONS & INFLAMMATIONS AGE >17 W CC<br />
#80 RESPIRATORY INFECTIONS & INFLAMMATIONS AGE >17 W/O CC<br />
#81 RESPIRATORY INFECTIONS & INFLAMMATIONS AGE 0-17<br />
#85 PLEURAL EFFUSION W CC<br />
#86 PLEURAL EFFUSION W/O CC<br />
#87 PULMONARY EDEMA & RESPIRATORY FAILURE<br />
#88 CHRONIC OBSTRUCTIVE PULMONARY DISEASE<br />
#89 SIMPLE PNEUMONIA & PLEURISY AGE >17 W CC<br />
#90 SIMPLE PNEUMONIA & PLEURISY AGE >17 W/O CC<br />
#91 SIMPLE PNEUMONIA & PLEURISY AGE 0-17<br />
#92 INTERSTITIAL LUNG DISEASE W CC<br />
#93 INTERSTITIAL LUNG DISEASE W/O CC<br />
#94 PNEUMOTHORAX W CC<br />
#95 PNEUMOTHORAX W/O CC<br />
#96 BRONCHITIS & ASTHMA AGE >17 W CC<br />
#97 BRONCHITIS & ASTHMA AGE >17 W/O CC<br />
#98 BRONCHITIS & ASTHMA AGE 0-17<br />
#99 RESPIRATORY SIGNS & SYMPTOMS W CC<br />
#100 RESPIRATORY SIGNS & SYMPTOMS W/O CC<br />
#101 OTHER RESPIRATORY SYSTEM DIAGNOSES W CC<br />
#102 OTHER RESPIRATORY SYSTEM DIAGNOSES W/O CC<br />
#128 DEEP VEIN THROMBOPHLEBITIS<br />
#475 RESPIRATORY SYSTEM DIAGNOSIS WITH VENTILATOR SUPPORT<br />
Rheumatology<br />
#242 SEPTIC ARTHRITIS<br />
#244 BONE DISEASES & SPECIFIC ARTHROPATHIES W CC<br />
#245 BONE DISEASES & SPECIFIC ARTHROPATHIES W/O CC<br />
#246 NON-SPECIFIC ARTHROPATHIES<br />
#247 SIGNS & SYMPTOMS OF MUSCULOSKELETAL SYSTEM & CONN TISSUE<br />
#256 OTHER MUSCULOSKELETAL SYSTEM & CONNECTIVE TISSUE DIAGNOSES
Urology<br />
#302 KIDNEY TRANSPLANT<br />
#303 KIDNEY,URETER & MAJOR BLADDER PROCEDURES FOR NEOPLASM<br />
#304 KIDNEY,URETER & MAJOR BLADDER PROC FOR NON-NEOPL W CC<br />
#305 KIDNEY,URETER & MAJOR BLADDER PROC FOR NON-NEOPL W/O CC<br />
#306 PROSTATECTOMY W CC<br />
#307 PROSTATECTOMY W/O CC<br />
#308 MINOR BLADDER PROCEDURES W CC<br />
#309 MINOR BLADDER PROCEDURES W/O CC<br />
#310 TRANSURETHRAL PROCEDURES W CC<br />
#311 TRANSURETHRAL PROCEDURES W/O CC<br />
#312 URETHRAL PROCEDURES, AGE >17 W CC<br />
#313 URETHRAL PROCEDURES, AGE >17 W/O CC<br />
#314 URETHRAL PROCEDURES, AGE 0-17<br />
#315 OTHER KIDNEY & URINARY TRACT O.R. PROCEDURES<br />
#323 URINARY STONES W CC, &/OR ESW LITHOTRIPSY<br />
#324 URINARY STONES W/O CC<br />
#328 URETHRAL STRICTURE AGE >17 W CC<br />
#329 URETHRAL STRICTURE AGE >17 W/O CC<br />
#330 URETHRAL STRICTURE AGE 0-17<br />
#334 MAJOR MALE PELVIC PROCEDURES W CC<br />
#335 MAJOR MALE PELVIC PROCEDURES W/O CC<br />
#336 TRANSURETHRAL PROSTATECTOMY W CC<br />
#337 TRANSURETHRAL PROSTATECTOMY W/O CC<br />
#339 TESTES PROCEDURES, NON-MALIGNANCY AGE >17<br />
#340 TESTES PROCEDURES, NON-MALIGNANCY AGE 0-17<br />
#341 PENIS PROCEDURES<br />
#342 CIRCUMCISION AGE >17<br />
#343 CIRCUMCISION AGE 0-17<br />
#348 BENIGN PROSTATIC HYPERTROPHY W CC<br />
#349 BENIGN PROSTATIC HYPERTROPHY W/O CC<br />
#350 INFLAMMATION OF THE MALE REPRODUCTIVE SYSTEM<br />
#351 STERILIZATION, MALE<br />
#352 OTHER MALE REPRODUCTIVE SYSTEM DIAGNOSES
Appendix F<br />
<strong>Index</strong> <strong>of</strong> <strong>Hospital</strong> <strong>Quality</strong> (IHQ)<br />
Scores by Specialty
<strong>2003</strong> Cancer Best <strong>Hospital</strong> List<br />
Technology NCI Hospice,<br />
U.S. News Reputational Mortality R.N.'s score cancer palliative<br />
Rank <strong>Hospital</strong> <strong>Index</strong> score rate Discharges to beds (<strong>of</strong> 7) center care<br />
1 University <strong>of</strong> Texas, M. D. Anderson Cancer Center, Houston 100.0 74.6 0.77 4924 2.97 6.0 Yes P<br />
2 Memorial Sloan-Kettering Cancer Center, New York 97.2 71.9 0.73 5275 2.32 6.0 Yes<br />
3 Johns Hopkins <strong>Hospital</strong>, Baltimore 70.9 38.6 0.52 1712 1.76 7.0 Yes H, P<br />
4 Dana-Farber Cancer Institute, Boston 68.6 45.4 0.89 237 3.07 6.0 Yes P<br />
5 Mayo Clinic, Rochester, Minn. 62.6 30.5 0.58 4308 1.51 7.0 Yes H, P<br />
6 University <strong>of</strong> Chicago <strong>Hospital</strong>s 43.0 9.9 0.69 1686 1.86 7.0 Yes H, P (+3 SD)<br />
7 Duke University Medical Center, Durham, N.C. 42.4 10.9 0.81 3082 2.55 7.0 Yes H, P<br />
8 UCLA Medical Center, Los Angeles 41.6 8.6 0.69 1245 1.94 7.0 Yes H, P<br />
9 University <strong>of</strong> Michigan Medical Center, Ann Arbor 41.0 6.6 0.48 1578 1.87 7.0 Yes P<br />
10 Vanderbilt University Medical Center, Nashville 38.2 6.8 0.71 1004 2.24 7.0 Yes P<br />
11 H. Lee M<strong>of</strong>fitt Cancer Center & Research Institute, Tampa 37.8 3.2 0.57 1456 2.52 6.0 Yes H, P<br />
12 University <strong>of</strong> Pittsburgh Medical Center 37.4 2.8 0.50 1890 1.52 6.5 Yes H, P<br />
13 Fox Chase Cancer Center, Philadelphia 37.2 7.0 0.77 924 2.01 5.0 Yes H, P<br />
14 University <strong>Hospital</strong>s <strong>of</strong> Cleveland 37.1 1.4 0.53 1623 1.84 7.0 Yes H, P<br />
15 University <strong>of</strong> Washington Medical Center, Seattle 36.5 8.8 0.54 886 1.38 6.0 No H<br />
16 <strong>Hospital</strong> <strong>of</strong> the University <strong>of</strong> Pennsylvania, Philadelphia 36.4 7.0 0.90 1614 1.79 6.0 Yes H<br />
17 University <strong>of</strong> California, San Francisco Medical Center 36.3 6.5 0.79 746 2.02 7.0 Yes P (+2 SD)<br />
18 Stanford <strong>Hospital</strong> and Clinics, Stanford, Calif. 35.5 13.1 0.90 938 1.56 4.0 No H<br />
19 Clarian Health Partners (IU and Methodist <strong>Hospital</strong>s), Indianapolis 35.5 5.4 0.82 2139 0.94 7.0 Yes H, P<br />
20 University <strong>of</strong> Wisconsin <strong>Hospital</strong> and Clinics, Madison 35.4 3.4 0.58 1106 1.05 7.0 Yes H<br />
21 North Carolina Baptist <strong>Hospital</strong>, Winston-Salem 35.2 2.5 0.74 1831 1.68 7.0 Yes H, P<br />
22 Barnes-Jewish <strong>Hospital</strong>, St. Louis 35.0 2.3 0.70 2566 1.46 6.5 Yes H, P<br />
23 University <strong>of</strong> Virginia Medical Center, Charlottesville 34.8 0.0 0.61 1297 2.25 7.0 Yes H, P<br />
24 University <strong>of</strong> North Carolina <strong>Hospital</strong>s, Chapel Hill 34.6 0.6 0.64 1370 1.64 7.0 Yes H, P<br />
25 Arthur G. James Cancer <strong>Hospital</strong>, Columbus, Ohio 34.3 0.6 0.57 2180 1.53 6.5 Yes P<br />
26 Massachusetts General <strong>Hospital</strong>, Boston 33.8 8.9 1.04 2090 1.82 7.0 No H, P<br />
27 Fairview-University Medical Center, Minneapolis 33.6 2.0 0.63 1226 0.50 7.0 Yes H, P<br />
28 University <strong>of</strong> Alabama <strong>Hospital</strong> at Birmingham 33.4 1.0 0.75 1640 1.45 7.0 Yes H, P<br />
29 Yale-New Haven <strong>Hospital</strong>, New Haven, Conn. 33.2 0.0 0.59 1191 1.43 7.0 Yes H<br />
30 Dartmouth-Hitchcock Medical Center, Lebanon, N.H. 33.2 0.4 0.70 1189 1.88 6.0 Yes H, P<br />
31 New York-Presbyterian <strong>Hospital</strong> 32.9 6.1 1.16 3774 1.41 7.0 Yes H, P<br />
32 Northwestern Memorial <strong>Hospital</strong>, Chicago 32.8 3.1 0.97 2228 1.87 6.0 Yes H, P<br />
33 Roswell Park Cancer Institute, Buffalo 32.7 4.6 1.04 1188 2.34 5.5 Yes H, P<br />
34 Thomas Jefferson University <strong>Hospital</strong>, Philadelphia 32.5 1.2 0.80 1847 1.62 5.5 Yes H, P<br />
35 University <strong>of</strong> Colorado <strong>Hospital</strong>, Denver 32.4 0.4 0.45 487 2.25 6.0 Yes P<br />
36 University <strong>of</strong> Iowa <strong>Hospital</strong>s and Clinics, Iowa City 32.2 1.0 0.80 1222 1.35 7.0 Yes H, P<br />
37 Harper University <strong>Hospital</strong>, Detroit 32.2 0.0 0.64 1563 0.89 6.0 Yes H, P<br />
38 Nebraska Health System, Omaha 32.0 2.6 0.89 900 1.56 7.0 Yes H, P<br />
39 Oregon Health & Science University <strong>Hospital</strong>, Portland 31.5 0.5 0.75 668 2.14 6.5 Yes H, P<br />
40 University <strong>of</strong> California, Davis Medical Center, Sacramento 31.3 0.5 0.82 798 2.97 7.0 Yes H, P<br />
41 UCSD Medical Center, San Diego 31.2 0.0 0.58 572 1.73 5.0 Yes H<br />
42 City <strong>of</strong> Hope National Medical Center, Duarte, Calif. 31.1 2.5 0.88 897 1.37 6.0 Yes H, P<br />
43 University <strong>of</strong> Utah <strong>Hospital</strong>s and Clinics, Salt Lake City 31.1 0.0 0.54 714 1.41 6.0 Yes<br />
44 Summa Health System, Akron, Ohio 31.0 0.0 0.53 1114 2.21 6.5 No H, P<br />
45 Shands at the University <strong>of</strong> Florida, Gainesville 30.9 1.0 0.62 1496 1.62 6.0 No H, P<br />
46 Cleveland Clinic 30.8 2.7 0.83 2279 2.12 7.0 No H, P<br />
47 Georgetown University <strong>Hospital</strong>, Washington, D.C. 30.8 0.6 0.77 580 1.51 7.0 Yes H, P<br />
48 Henry Ford <strong>Hospital</strong>, Detroit 30.5 0.5 0.66 1455 1.79 6.5 No H, P<br />
49 University Medical Center, Tucson, Ariz. 30.5 1.2 0.69 452 1.78 6.0 Yes<br />
50 Baylor University Medical Center, Dallas 30.4 2.5 0.77 1901 1.62 6.0 No H, P
<strong>2003</strong> Digestive Disorders Best <strong>Hospital</strong> List<br />
Technology<br />
U.S. News Reputational Mortality R.N.'s score Trauma<br />
Rank <strong>Hospital</strong> <strong>Index</strong> score rate Discharges to beds (<strong>of</strong> 8) Center<br />
1 Mayo Clinic, Rochester, Minn. 100.0 61.6 0.75 8381 1.51 8.0 No<br />
2 Cleveland Clinic 73.4 38.1 0.72 4760 2.12 8.0 No<br />
3 Johns Hopkins <strong>Hospital</strong>, Baltimore 72.2 35.9 0.73 3638 1.76 7.5 Yes<br />
4 Massachusetts General <strong>Hospital</strong>, Boston 62.1 28.6 0.87 4722 1.82 8.0 Yes<br />
5 Mount Sinai Medical Center, New York 51.9 22.1 1.09 6508 1.68 8.0 Yes<br />
6 University <strong>of</strong> Chicago <strong>Hospital</strong>s 49.7 18.6 0.86 2241 1.86 8.0 Yes<br />
7 UCLA Medical Center, Los Angeles 45.1 15.7 0.99 2496 1.94 8.0 Yes<br />
8 Duke University Medical Center, Durham, N.C. 44.8 14.2 0.92 4234 2.55 8.0 Yes<br />
9 University <strong>of</strong> California, San Francisco Medical Center 44.5 14.9 0.75 1875 2.02 8.0 No<br />
10 Brigham and Women's <strong>Hospital</strong>, Boston 38.2 7.7 0.77 2773 1.64 7.5 Yes (+3 SD)<br />
11 Barnes-Jewish <strong>Hospital</strong>, St. Louis 37.5 7.3 0.81 6106 1.46 8.0 Yes<br />
12 <strong>Hospital</strong> <strong>of</strong> the University <strong>of</strong> Pennsylvania, Philadelphia 36.6 10.7 1.20 2245 1.79 8.0 Yes<br />
13 University <strong>of</strong> Michigan Medical Center, Ann Arbor 36.0 4.9 0.74 3128 1.87 8.0 Yes<br />
14 Medical University <strong>of</strong> South Carolina, Charleston 35.9 9.8 1.15 2838 1.84 6.0 Yes<br />
15 Beth Israel Deaconess Medical Center, Boston 34.8 4.1 0.72 4108 2.23 7.0 Yes<br />
16 University <strong>of</strong> Pittsburgh Medical Center 34.7 5.0 0.83 4318 1.52 8.0 Yes<br />
17 Shands at the University <strong>of</strong> Florida, Gainesville 34.2 4.7 0.82 3662 1.62 7.0 Yes<br />
18 University <strong>of</strong> North Carolina <strong>Hospital</strong>s, Chapel Hill 34.1 3.9 0.78 3115 1.64 7.5 Yes<br />
19 Clarian Health Partners (IU and Methodist <strong>Hospital</strong>s), Indianapolis 33.5 8.0 1.01 5902 0.94 8.0 No (+2 SD)<br />
20 Yale-New Haven <strong>Hospital</strong>, New Haven, Conn. 32.5 2.9 0.74 2543 1.43 8.0 Yes<br />
21 University <strong>of</strong> Washington Medical Center, Seattle 32.3 5.1 0.72 1478 1.38 8.0 No<br />
22 Baylor University Medical Center, Dallas 32.3 2.8 0.83 4949 1.62 8.0 Yes<br />
23 Northwestern Memorial <strong>Hospital</strong>, Chicago 31.8 3.8 0.99 3483 1.87 8.0 Yes<br />
24 Summa Health System, Akron, Ohio 31.7 0.0 0.62 3995 2.21 8.0 Yes<br />
25 Cedars-Sinai Medical Center, Los Angeles 31.5 3.3 0.94 4983 1.54 8.0 Yes<br />
26 University <strong>of</strong> Wisconsin <strong>Hospital</strong> and Clinics, Madison 31.5 1.0 0.55 2299 1.05 8.0 Yes<br />
27 St. Louis University <strong>Hospital</strong> 31.3 2.0 0.67 1937 1.41 7.5 Yes<br />
28 F.G. McGaw <strong>Hospital</strong> at Loyola University, Maywood, Ill. 31.0 1.9 0.84 2799 1.72 8.0 Yes<br />
29 University <strong>of</strong> Virginia Medical Center, Charlottesville 31.0 1.4 0.81 3078 2.25 8.0 Yes<br />
30 William Beaumont <strong>Hospital</strong>, Royal Oak, Mich. 31.0 0.9 0.77 6260 1.75 8.0 Yes<br />
31 Memorial Sloan-Kettering Cancer Center, New York 30.9 1.7 0.68 3409 2.32 7.0 No<br />
32 University <strong>of</strong> Miami, Jackson Memorial <strong>Hospital</strong> 30.8 4.2 0.82 1849 1.53 8.0 No<br />
33 University <strong>Hospital</strong>s <strong>of</strong> Cleveland 30.7 0.5 0.75 3214 1.84 8.0 Yes<br />
34 Advocate Lutheran General <strong>Hospital</strong>, Park Ridge, Ill. 30.5 0.0 0.49 3429 0.94 6.5 Yes<br />
35 New York-Presbyterian <strong>Hospital</strong> 30.5 6.8 1.36 6339 1.41 8.0 Yes<br />
36 Parkland Memorial <strong>Hospital</strong>, Dallas 30.5 4.0 0.93 1010 1.72 8.0 Yes<br />
37 Lahey Clinic, Burlington, Mass. 30.3 0.9 0.72 2819 1.46 7.0 Yes<br />
38 Thomas Jefferson University <strong>Hospital</strong>, Philadelphia 30.3 0.4 0.73 3524 1.62 7.0 Yes<br />
39 Good Samaritan Regional Medical Center, Phoenix 30.2 0.0 0.54 2145 1.14 7.5 Yes<br />
40 Henry Ford <strong>Hospital</strong>, Detroit 30.1 0.5 0.79 3663 1.79 7.5 Yes<br />
41 St. Joseph's <strong>Hospital</strong>, Tampa 30.0 0.0 0.65 3019 1.31 7.0 Yes<br />
42 Tufts-New England Medical Center, Boston 29.8 2.0 0.77 1257 2.44 7.0 Yes<br />
43 Mayo Clinic, Jacksonville, Fla. 29.7 1.9 0.72 2287 1.75 7.0 No<br />
44 Allegheny General <strong>Hospital</strong>, Pittsburgh 29.5 0.4 0.77 2476 2.00 7.5 Yes<br />
45 Abbott Northwestern <strong>Hospital</strong>, Minneapolis 29.4 0.0 0.74 3924 1.24 8.0 Yes<br />
46 Meridia Hillcrest <strong>Hospital</strong>, Cleveland 29.4 0.0 0.68 2582 1.26 7.5 Yes<br />
47 Temple University <strong>Hospital</strong>, Philadelphia 29.3 1.3 0.82 1689 1.73 8.0 Yes<br />
48 Florida <strong>Hospital</strong>, Orlando 29.3 0.0 0.66 7255 1.65 8.0 No<br />
49 Memorial <strong>Hospital</strong> West, Pembroke Pines, Fla. 29.3 0.0 0.55 850 1.97 6.5 Yes<br />
50 Christ <strong>Hospital</strong>, Cincinnati 29.3 0.0 0.60 2199 1.07 7.0 Yes
<strong>2003</strong> Ear, Nose, and Throat Best <strong>Hospital</strong> List<br />
<strong>Hospital</strong>wide Technology<br />
U.S. News Reputational mortality R.N.'s score Trauma<br />
Rank <strong>Hospital</strong> <strong>Index</strong> score rate Discharges to beds (<strong>of</strong> 5) Center<br />
1 Johns Hopkins <strong>Hospital</strong>, Baltimore 100.0 52.1 0.74 285 1.76 5.0 Yes<br />
2 Massachusetts Eye and Ear Infirmary, Boston 72.8 32.1 0.12 309 2.02 3.0 Yes<br />
3 University <strong>of</strong> Iowa <strong>Hospital</strong>s and Clinics, Iowa City 70.0 31.3 0.85 247 1.35 5.0 Yes<br />
4 Mayo Clinic, Rochester, Minn. 60.6 24.6 0.79 668 1.51 5.0 No<br />
5 University <strong>of</strong> Michigan Medical Center, Ann Arbor 55.7 18.5 0.74 297 1.87 5.0 Yes<br />
6 UCLA Medical Center, Los Angeles 50.8 16.6 0.89 349 1.94 5.0 Yes<br />
7 University <strong>of</strong> Pittsburgh Medical Center 50.4 16.7 0.88 343 1.52 5.0 Yes<br />
8 <strong>Hospital</strong> <strong>of</strong> the University <strong>of</strong> Pennsylvania, Philadelphia 47.5 15.6 1.01 281 1.79 5.0 Yes<br />
9 Cleveland Clinic 47.3 13.3 0.67 232 2.12 5.0 No<br />
10 University <strong>of</strong> Texas, M. D. Anderson Cancer Center, Houston 47.0 19.1 1.11 128 2.97 5.0 No<br />
11 Barnes-Jewish <strong>Hospital</strong>, St. Louis 43.8 11.3 0.84 421 1.46 5.0 Yes<br />
12 Vanderbilt University Medical Center, Nashville 43.0 11.5 0.95 279 2.24 5.0 Yes<br />
13 Stanford <strong>Hospital</strong> and Clinics, Stanford, Calif. 42.7 14.3 0.89 162 1.56 3.0 No<br />
14 University <strong>of</strong> Washington Medical Center, Seattle 41.5 11.1 0.72 120 1.38 5.0 No<br />
15 University <strong>of</strong> California, San Francisco Medical Center 40.8 10.9 0.83 157 2.02 5.0 No (+3 SD)<br />
16 Mount Sinai Medical Center, New York 37.5 9.6 1.13 458 1.68 5.0 Yes<br />
17 University <strong>of</strong> Virginia Medical Center, Charlottesville 35.9 5.9 0.88 198 2.25 5.0 Yes<br />
18 Memorial Sloan-Kettering Cancer Center, New York 35.7 6.1 0.84 283 2.32 5.0 No<br />
19 Shands at the University <strong>of</strong> Florida, Gainesville 34.9 4.2 0.79 255 1.62 4.0 Yes<br />
20 University <strong>Hospital</strong>, Cincinnati 34.8 5.2 0.80 172 1.16 5.0 Yes<br />
21 Duke University Medical Center, Durham, N.C. 33.8 5.2 0.92 161 2.55 5.0 Yes<br />
22 Methodist <strong>Hospital</strong>, Houston 33.7 6.0 0.88 215 1.33 5.0 No (+2 SD)<br />
23 Northwestern Memorial <strong>Hospital</strong>, Chicago 32.9 3.5 0.92 262 1.87 5.0 Yes<br />
24 University <strong>of</strong> California, Davis Medical Center, Sacramento 32.7 3.6 0.85 157 2.97 5.0 Yes<br />
25 University <strong>of</strong> Wisconsin <strong>Hospital</strong> and Clinics, Madison 32.4 2.0 0.68 207 1.05 5.0 Yes<br />
26 Parkland Memorial <strong>Hospital</strong>, Dallas 32.1 4.5 0.87 59 1.72 5.0 Yes<br />
27 Ohio State University Medical Center, Columbus 32.0 4.3 0.74 102 0.98 3.5 Yes<br />
28 F.G. McGaw <strong>Hospital</strong> at Loyola University, Maywood, Ill. 32.0 1.7 0.79 217 1.72 5.0 Yes<br />
29 Fairview-University Medical Center, Minneapolis 31.9 3.3 0.68 376 0.50 5.0 No<br />
30 University <strong>of</strong> Miami, Jackson Memorial <strong>Hospital</strong> 31.8 3.4 0.82 226 1.53 5.0 No<br />
31 University <strong>of</strong> Chicago <strong>Hospital</strong>s 31.7 2.7 0.80 111 1.86 5.0 Yes<br />
32 Summa Health System, Akron, Ohio 31.7 0.0 0.62 239 2.21 5.0 Yes<br />
33 North Carolina Baptist <strong>Hospital</strong>, Winston-Salem 31.5 3.6 0.95 191 1.68 5.0 Yes<br />
34 University <strong>Hospital</strong>s <strong>of</strong> Cleveland 31.4 0.6 0.67 171 1.84 5.0 Yes<br />
35 Henry Ford <strong>Hospital</strong>, Detroit 31.4 0.3 0.71 230 1.79 4.5 Yes<br />
36 Thomas Jefferson University <strong>Hospital</strong>, Philadelphia 31.3 2.3 0.85 258 1.62 4.0 Yes<br />
37 University <strong>of</strong> North Carolina <strong>Hospital</strong>s, Chapel Hill 31.2 2.9 0.90 183 1.64 5.0 Yes<br />
38 University <strong>of</strong> Alabama <strong>Hospital</strong> at Birmingham 30.9 3.0 0.97 314 1.45 5.0 Yes<br />
39 Abbott Northwestern <strong>Hospital</strong>, Minneapolis 30.7 0.0 0.66 374 1.24 5.0 Yes<br />
40 Yale-New Haven <strong>Hospital</strong>, New Haven, Conn. 30.4 1.1 0.83 262 1.43 5.0 Yes<br />
41 William Beaumont <strong>Hospital</strong>, Royal Oak, Mich. 30.4 0.0 0.77 292 1.75 5.0 Yes<br />
42 Lahey Clinic, Burlington, Mass. 30.2 1.1 0.58 142 1.46 4.0 Yes<br />
43 University <strong>of</strong> Illinois Medical Center at Chicago 29.9 3.3 0.83 112 1.72 2.5 Yes<br />
44 Akron General Medical Center, Akron, Ohio 29.8 0.0 0.73 199 1.34 5.0 Yes<br />
45 New York Eye and Ear Infirmary, New York 29.5 1.6 0.00 44 2.47 3.5 Yes<br />
46 University <strong>of</strong> Colorado <strong>Hospital</strong>, Denver 29.5 0.4 0.65 68 2.25 5.0 Yes<br />
47 Advocate Lutheran General <strong>Hospital</strong>, Park Ridge, Ill. 29.4 0.0 0.62 242 0.94 4.0 Yes<br />
48 Rush-Presbyterian-St. Luke's Medical Center, Chicago 29.3 1.4 0.67 161 1.18 5.0 No<br />
49 <strong>Hospital</strong> <strong>of</strong> St. Raphael, New Haven, Conn. 29.3 0.0 0.72 250 0.88 4.5 Yes<br />
50 Beth Israel Deaconess Medical Center, Boston 29.3 0.3 0.80 210 2.23 4.0 Yes
<strong>2003</strong> Geriatrics Best <strong>Hospital</strong> List<br />
<strong>Hospital</strong>wide Technology Discharge Service Geriatric Hospice,<br />
U.S. News Reputational mortality R.N.'s score planning mix services palliative<br />
Rank <strong>Hospital</strong> <strong>Index</strong> score rate to beds (<strong>of</strong> 8) (<strong>of</strong> 3) (<strong>of</strong> 9) (<strong>of</strong> 7) care<br />
1 UCLA Medical Center, Los Angeles 100.0 51.4 0.89 1.94 8.0 3 5 3 H, P<br />
2 Johns Hopkins <strong>Hospital</strong>, Baltimore 87.9 40.7 0.74 1.76 8.0 3 7 4 H, P<br />
3 Mount Sinai Medical Center, New York 71.7 34.1 1.13 1.68 8.0 3 8 2 H, P<br />
4 Massachusetts General <strong>Hospital</strong>, Boston 57.7 21.2 0.88 1.82 8.0 3 8 4 H, P<br />
5 Duke University Medical Center, Durham, N.C. 54.5 20.1 0.92 2.55 8.0 3 7 3 H, P<br />
6 Mayo Clinic, Rochester, Minn. 47.6 12.7 0.79 1.51 8.0 3 9 5 H, P<br />
7 Yale-New Haven <strong>Hospital</strong>, New Haven, Conn. 47.0 14.5 0.83 1.43 8.0 3 7 3 H<br />
8 University <strong>of</strong> Michigan Medical Center, Ann Arbor 41.1 8.8 0.74 1.87 8.0 3 8 4 P<br />
9 St. Louis University <strong>Hospital</strong> 39.6 8.6 0.73 1.41 8.0 3 6 3 H<br />
10 Cleveland Clinic 39.4 6.9 0.67 2.12 8.0 3 8 3 H, P (+3 SD)<br />
11 University <strong>of</strong> Washington Medical Center, Seattle 37.5 7.8 0.72 1.38 8.0 2 6 3 H<br />
12 University <strong>of</strong> Chicago <strong>Hospital</strong>s 37.1 5.8 0.80 1.86 8.0 3 8 5 H, P<br />
13 Barnes-Jewish <strong>Hospital</strong>, St. Louis 36.9 7.3 0.84 1.46 8.0 3 5 4 H, P<br />
14 University <strong>Hospital</strong>s <strong>of</strong> Cleveland 34.9 3.0 0.67 1.84 8.0 3 8 5 H, P<br />
15 University <strong>of</strong> California, San Francisco Medical Center 34.2 5.6 0.83 2.02 8.0 3 6 4 P<br />
16 New York-Presbyterian <strong>Hospital</strong> 33.7 7.6 1.17 1.41 8.0 3 9 4 H, P<br />
17 Rush-Presbyterian-St. Luke's Medical Center, Chicago 33.6 2.7 0.67 1.18 8.0 3 8 5 H<br />
18 <strong>Hospital</strong> <strong>of</strong> the University <strong>of</strong> Pennsylvania, Philadelphia 33.5 6.8 1.01 1.79 8.0 3 8 3 H<br />
19 Beth Israel Deaconess Medical Center, Boston 33.3 4.6 0.80 2.23 7.0 3 7 3 H, P<br />
20 University <strong>of</strong> Pittsburgh Medical Center 32.5 3.0 0.88 1.52 8.0 3 7 7 H, P<br />
21 NYU Medical Center, New York 32.5 6.6 1.01 1.18 7.5 3 7 2 H, P (+2 SD)<br />
22 Summa Health System, Akron, Ohio 32.0 1.0 0.62 2.21 8.0 3 9 3 H, P<br />
23 University <strong>of</strong> Wisconsin <strong>Hospital</strong> and Clinics, Madison 31.5 1.9 0.68 1.05 8.0 3 8 4 H<br />
24 North Carolina Baptist <strong>Hospital</strong>, Winston-Salem 30.6 3.3 0.95 1.68 8.0 3 8 4 H, P<br />
25 University <strong>of</strong> Miami, Jackson Memorial <strong>Hospital</strong> 30.3 1.5 0.82 1.53 8.0 3 9 4 H, P<br />
26 Brigham and Women's <strong>Hospital</strong>, Boston 30.2 1.5 0.76 1.64 7.5 3 7 4 H, P<br />
27 University <strong>of</strong> Colorado <strong>Hospital</strong>, Denver 30.1 1.9 0.65 2.25 7.0 3 5 3 P<br />
28 Stanford <strong>Hospital</strong> and Clinics, Stanford, Calif. 30.1 4.8 0.89 1.56 6.0 3 6 2 H<br />
29 University <strong>of</strong> Alabama <strong>Hospital</strong> at Birmingham 30.1 2.9 0.97 1.45 8.0 3 9 4 H, P<br />
30 Fairview-University Medical Center, Minneapolis 29.9 0.5 0.68 0.50 7.0 3 9 5 H, P<br />
31 Northwestern Memorial <strong>Hospital</strong>, Chicago 29.8 2.5 0.92 1.87 8.0 3 8 4 H, P<br />
32 Thomas Jefferson University <strong>Hospital</strong>, Philadelphia 29.6 2.0 0.85 1.62 7.0 3 8 4 H, P<br />
33 Christ <strong>Hospital</strong>, Cincinnati 29.4 0.0 0.52 1.07 7.5 3 6 3 H, P<br />
34 Scripps Mercy <strong>Hospital</strong>, San Diego 29.3 0.0 0.68 0.88 7.0 3 8 5 H, P<br />
35 Methodist <strong>Hospital</strong>, Houston 29.2 1.9 0.88 1.33 8.0 3 9 3 H, P<br />
36 University <strong>Hospital</strong> <strong>of</strong> Arkansas, Little Rock 29.1 4.0 0.88 2.55 7.0 3 5 3<br />
37 Boston Medical Center 29.1 3.7 0.97 1.30 6.0 3 7 5 P<br />
38 F.G. McGaw <strong>Hospital</strong> at Loyola University, Maywood, Ill. 29.1 1.4 0.79 1.72 8.0 3 8 3 H<br />
39 Advocate Lutheran General <strong>Hospital</strong>, Park Ridge, Ill. 29.1 0.0 0.62 0.94 7.0 3 8 3 H, P<br />
40 Lahey Clinic, Burlington, Mass. 29.0 0.0 0.58 1.46 7.0 3 7 4<br />
41 Emory University <strong>Hospital</strong>, Atlanta 29.0 4.0 0.91 1.43 8.0 3 6 1 P<br />
42 Strong Memorial <strong>Hospital</strong>-University <strong>of</strong> Rochester, N.Y. 29.0 2.9 1.02 2.01 7.5 3 9 4 H, P<br />
43 Ingalls <strong>Hospital</strong>, Harvey, Ill. 28.9 0.0 0.64 0.67 8.0 3 9 2 H, P<br />
44 Miami Valley <strong>Hospital</strong>, Dayton, Ohio 28.8 0.5 0.69 1.02 8.0 3 7 4 P<br />
45 Shands at the University <strong>of</strong> Florida, Gainesville 28.8 1.5 0.79 1.62 7.0 3 8 2 H, P<br />
46 William Beaumont <strong>Hospital</strong>, Royal Oak, Mich. 28.8 0.5 0.77 1.75 8.0 3 7 4 H, P<br />
47 Pennsylvania <strong>Hospital</strong>, Philadelphia 28.5 0.5 0.72 0.98 7.0 3 7 4 H, P<br />
48 University <strong>of</strong> North Carolina <strong>Hospital</strong>s, Chapel Hill 28.5 1.5 0.90 1.64 8.0 3 9 3 H, P<br />
49 Akron General Medical Center, Akron, Ohio 28.4 0.0 0.73 1.34 8.0 3 8 3 H, P<br />
50 Henry Ford <strong>Hospital</strong>, Detroit 28.4 0.0 0.71 1.79 7.5 3 6 4 H, P
<strong>2003</strong> Gynecology Best <strong>Hospital</strong> List<br />
<strong>Hospital</strong>wide Technology Gynecology<br />
U.S. News Reputational mortality R.N.'s score Trauma services<br />
Rank <strong>Hospital</strong> <strong>Index</strong> score rate Discharges to beds (<strong>of</strong> 8) Center (<strong>of</strong> 4)<br />
1 Johns Hopkins <strong>Hospital</strong>, Baltimore 100.0 34.3 0.74 336 1.76 8.0 Yes 4<br />
2 Mayo Clinic, Rochester, Minn. 87.5 29.7 0.79 1480 1.51 8.0 No 3<br />
3 Brigham and Women's <strong>Hospital</strong>, Boston 68.4 19.0 0.76 577 1.64 7.5 Yes 4<br />
4 University <strong>of</strong> Texas, M. D. Anderson Cancer Center, Houston 66.9 23.7 1.11 240 2.97 7.0 No 0<br />
5 Duke University Medical Center, Durham, N.C. 61.6 16.7 0.92 568 2.55 8.0 Yes 4<br />
6 Massachusetts General <strong>Hospital</strong>, Boston 60.3 15.7 0.88 460 1.82 8.0 Yes 4<br />
7 UCLA Medical Center, Los Angeles 55.6 13.4 0.89 329 1.94 8.0 Yes 4<br />
8 Parkland Memorial <strong>Hospital</strong>, Dallas 46.8 9.6 0.87 125 1.72 8.0 Yes 4<br />
9 <strong>Hospital</strong> <strong>of</strong> the University <strong>of</strong> Pennsylvania, Philadelphia 46.8 10.3 1.01 259 1.79 8.0 Yes 4<br />
10 University <strong>of</strong> California, San Francisco Medical Center 46.3 9.8 0.83 131 2.02 8.0 No 4<br />
11 Memorial Sloan-Kettering Cancer Center, New York 45.9 10.4 0.84 309 2.32 7.0 No 1<br />
12 Cleveland Clinic 45.3 7.3 0.67 655 2.12 8.0 No 4<br />
13 New York-Presbyterian <strong>Hospital</strong> 44.5 10.3 1.17 749 1.41 8.0 Yes 4<br />
14 Yale-New Haven <strong>Hospital</strong>, New Haven, Conn. 41.5 6.1 0.83 407 1.43 8.0 Yes 4<br />
15 University <strong>of</strong> Michigan Medical Center, Ann Arbor 40.6 4.7 0.74 410 1.87 8.0 Yes 4 (+3 SD)<br />
16 Stanford <strong>Hospital</strong> and Clinics, Stanford, Calif. 39.6 8.0 0.89 288 1.56 5.0 No 2<br />
17 Northwestern Memorial <strong>Hospital</strong>, Chicago 39.3 5.6 0.92 331 1.87 8.0 Yes 4<br />
18 Methodist <strong>Hospital</strong>, Houston 38.3 5.9 0.88 518 1.33 7.0 No 4<br />
19 University <strong>of</strong> Chicago <strong>Hospital</strong>s 38.1 3.9 0.80 338 1.86 8.0 Yes 4<br />
20 University <strong>of</strong> Colorado <strong>Hospital</strong>, Denver 37.2 3.1 0.65 113 2.25 8.0 Yes 4<br />
21 University <strong>of</strong> North Carolina <strong>Hospital</strong>s, Chapel Hill 36.5 4.0 0.90 375 1.64 8.0 Yes 4<br />
22 Barnes-Jewish <strong>Hospital</strong>, St. Louis 36.0 3.6 0.84 625 1.46 7.5 Yes 4<br />
23 Cedars-Sinai Medical Center, Los Angeles 35.7 4.1 0.95 610 1.54 8.0 Yes 4<br />
24 University <strong>of</strong> Virginia Medical Center, Charlottesville 35.2 3.1 0.88 404 2.25 8.0 Yes 4<br />
25 William Beaumont <strong>Hospital</strong>, Royal Oak, Mich. 35.1 2.3 0.77 673 1.75 8.0 Yes 4<br />
26 Christ <strong>Hospital</strong>, Cincinnati 35.0 0.9 0.52 340 1.07 7.0 Yes 4<br />
27 University <strong>of</strong> Washington Medical Center, Seattle 34.9 2.9 0.72 288 1.38 8.0 No 4<br />
28 Vanderbilt University Medical Center, Nashville 34.9 4.0 0.95 388 2.24 8.0 Yes 3<br />
29 Magee-Womens <strong>Hospital</strong>, Pittsburgh 34.8 1.6 0.32 508 1.32 6.0 No 4<br />
30 Mount Sinai Medical Center, New York 34.5 4.8 1.13 355 1.68 8.0 Yes 4 (+2 SD)<br />
31 Thomas Jefferson University <strong>Hospital</strong>, Philadelphia 34.2 2.8 0.85 438 1.62 7.0 Yes 4<br />
32 Harper University <strong>Hospital</strong>, Detroit 33.9 2.7 0.73 225 0.89 7.5 Yes 3<br />
33 University <strong>of</strong> Alabama <strong>Hospital</strong> at Birmingham 33.9 3.4 0.97 653 1.45 8.0 Yes 4<br />
34 Exempla St. Joseph <strong>Hospital</strong>, Denver 33.4 1.4 0.52 248 1.15 7.0 No 3<br />
35 University <strong>of</strong> California, Irvine Medical Center, Orange 33.2 4.5 0.82 90 1.19 6.0 Yes 1<br />
36 Georgetown University <strong>Hospital</strong>, Washington, D.C. 33.0 1.6 0.73 169 1.51 8.0 Yes 4<br />
37 USC University <strong>Hospital</strong>, Los Angeles 32.8 4.1 0.59 51 1.11 5.0 No 0<br />
38 Summa Health System, Akron, Ohio 32.7 0.0 0.62 325 2.21 7.5 Yes 4<br />
39 Emory University <strong>Hospital</strong>, Atlanta 32.6 4.5 0.91 265 1.43 7.5 No 1<br />
40 University <strong>of</strong> Utah <strong>Hospital</strong>s and Clinics, Salt Lake City 32.6 2.7 0.77 208 1.41 8.0 No 3<br />
41 NYU Medical Center, New York 32.2 3.1 1.01 502 1.18 7.5 Yes 4<br />
42 University <strong>Hospital</strong>s <strong>of</strong> Cleveland 32.2 0.0 0.67 401 1.84 8.0 Yes 4<br />
43 Beth Israel Deaconess Medical Center, Boston 32.2 1.4 0.80 286 2.23 7.0 Yes 4<br />
44 Miami Valley <strong>Hospital</strong>, Dayton, Ohio 31.9 0.4 0.69 469 1.02 8.0 Yes 4<br />
45 Akron General Medical Center, Akron, Ohio 31.8 0.6 0.73 350 1.34 7.5 Yes 4<br />
46 Baylor University Medical Center, Dallas 31.8 1.8 0.91 550 1.62 8.0 Yes 4<br />
47 Shands at the University <strong>of</strong> Florida, Gainesville 31.7 1.0 0.79 337 1.62 7.0 Yes 4<br />
48 Rush-Presbyterian-St. Luke's Medical Center, Chicago 31.6 1.4 0.67 247 1.18 8.0 No 3<br />
49 University <strong>of</strong> Wisconsin <strong>Hospital</strong> and Clinics, Madison 31.5 1.4 0.68 258 1.05 7.0 Yes 2<br />
50 University <strong>of</strong> Iowa <strong>Hospital</strong>s and Clinics, Iowa City 31.4 1.3 0.85 407 1.35 8.0 Yes 4
<strong>2003</strong> Heart and Heart Surgery Best <strong>Hospital</strong> List<br />
Technology Hospice,<br />
U.S. News Reputational Mortality R.N.'s score Trauma palliative<br />
Rank <strong>Hospital</strong> <strong>Index</strong> score rate Discharges to beds (<strong>of</strong> 9) Center care<br />
1 Cleveland Clinic 100.0 73.2 0.58 13824 2.12 9.0 No H, P<br />
2 Mayo Clinic, Rochester, Minn. 82.0 58.2 0.84 15729 1.51 9.0 No H, P<br />
3 Brigham and Women's <strong>Hospital</strong>, Boston 61.7 32.4 0.61 7504 1.64 8.5 Yes H, P<br />
4 Duke University Medical Center, Durham, N.C. 61.6 34.6 0.84 10635 2.55 9.0 Yes H, P<br />
5 Massachusetts General <strong>Hospital</strong>, Boston 60.2 31.3 0.76 10568 1.82 9.0 Yes H, P<br />
6 Johns Hopkins <strong>Hospital</strong>, Baltimore 58.6 31.4 0.79 6153 1.76 9.0 Yes H, P<br />
7 Emory University <strong>Hospital</strong>, Atlanta 42.0 18.1 0.85 7392 1.43 9.0 No P (+3 SD)<br />
8 Texas Heart Institute at St. Luke's Episcopal <strong>Hospital</strong>, Houston 40.2 13.7 0.80 10425 1.39 9.0 No H, P<br />
9 Stanford <strong>Hospital</strong> and Clinics, Stanford, Calif. 37.9 18.3 0.91 4517 1.56 7.0 No H<br />
10 Barnes-Jewish <strong>Hospital</strong>, St. Louis 37.2 8.9 0.81 11177 1.46 9.0 Yes H, P<br />
11 New York-Presbyterian <strong>Hospital</strong> 36.2 11.8 1.00 13765 1.41 9.0 Yes H, P<br />
12 UCLA Medical Center, Los Angeles 35.0 8.1 0.82 4045 1.94 9.0 Yes H, P<br />
13 Washington <strong>Hospital</strong> Center, Washington, D.C. 35.0 6.0 0.73 13400 1.43 8.0 Yes H, P (+2 SD)<br />
14 William Beaumont <strong>Hospital</strong>, Royal Oak, Mich. 33.3 2.7 0.74 18141 1.75 9.0 Yes H, P<br />
15 Methodist <strong>Hospital</strong>, Houston 32.5 8.5 0.94 10920 1.33 9.0 No H, P<br />
16 Cedars-Sinai Medical Center, Los Angeles 31.9 4.9 0.90 9244 1.54 9.0 Yes H, P<br />
17 Summa Health System, Akron, Ohio 31.8 0.5 0.68 6886 2.21 9.0 Yes H, P<br />
18 University <strong>of</strong> California, San Francisco Medical Center 31.4 6.8 0.78 2711 2.02 9.0 No P<br />
19 Abbott Northwestern <strong>Hospital</strong>, Minneapolis 31.2 1.1 0.67 10379 1.24 9.0 Yes P<br />
20 University <strong>Hospital</strong>s <strong>of</strong> Cleveland 31.0 0.0 0.66 5614 1.84 9.0 Yes H, P<br />
21 Sentara Norfolk General <strong>Hospital</strong>, Norfolk, Va. 30.8 0.0 0.58 8466 1.32 8.5 Yes H, P<br />
22 University <strong>of</strong> Michigan Medical Center, Ann Arbor 30.7 3.1 0.78 5403 1.87 9.0 Yes P<br />
23 Beth Israel Deaconess Medical Center, Boston 30.7 4.1 0.89 8911 2.23 8.0 Yes H, P<br />
24 Parkland Memorial <strong>Hospital</strong>, Dallas 30.5 2.6 0.61 1541 1.72 9.0 Yes P<br />
25 University <strong>of</strong> Alabama <strong>Hospital</strong> at Birmingham 30.4 7.1 1.03 7116 1.45 9.0 Yes H, P<br />
26 St. Luke's <strong>Hospital</strong>, Bethlehem, Pa. 30.3 0.0 0.64 8310 0.73 9.0 Yes H, P<br />
27 Henry Ford <strong>Hospital</strong>, Detroit 30.3 0.0 0.73 7880 1.79 8.5 Yes H, P<br />
28 F.G. McGaw <strong>Hospital</strong> at Loyola University, Maywood, Ill. 30.2 1.6 0.71 4897 1.72 9.0 Yes H<br />
29 St. Francis <strong>Hospital</strong>, Roslyn, N.Y. 30.0 1.2 0.77 15199 1.31 8.5 Yes H, P<br />
30 University <strong>of</strong> Chicago <strong>Hospital</strong>s 30.0 1.6 0.75 3481 1.86 9.0 Yes H, P<br />
31 University <strong>of</strong> Pittsburgh Medical Center 30.0 2.1 0.82 6960 1.52 9.0 Yes H, P<br />
32 <strong>Hospital</strong> <strong>of</strong> the University <strong>of</strong> Pennsylvania, Philadelphia 29.8 5.9 0.94 4904 1.79 9.0 Yes H<br />
33 Christ <strong>Hospital</strong>, Cincinnati 29.8 0.0 0.47 6903 1.07 8.5 Yes H, P<br />
34 Lenox Hill <strong>Hospital</strong>, New York 29.7 6.3 0.97 6894 1.65 9.0 No H, P<br />
35 St. Vincent's Medical Center, Jacksonville, Fla. 29.7 0.0 0.71 7286 1.12 9.0 Yes H, P<br />
36 Florida <strong>Hospital</strong>, Orlando 29.7 0.4 0.67 21337 1.65 9.0 No P<br />
37 North Carolina Baptist <strong>Hospital</strong>, Winston-Salem 29.4 1.5 0.85 7474 1.68 9.0 Yes H, P<br />
38 Scripps Memorial <strong>Hospital</strong> La Jolla, Calif. 29.3 1.6 0.70 3347 0.79 9.0 Yes H, P<br />
39 Hackensack University Medical Center, Hackensack, N.J. 29.3 0.0 0.82 10588 2.07 9.0 Yes H, P<br />
40 Delray Medical Center, Delray Beach, Fla. 29.1 0.0 0.72 9046 0.90 8.5 Yes H, P<br />
41 Hamot Medical Center, Erie, Pa. 29.0 0.0 0.70 5519 1.63 8.0 Yes H, P<br />
42 Mission St. Joseph's Health, Asheville, N.C. 28.8 0.5 0.45 86 1.64 9.0 Yes H, P<br />
43 Northwestern Memorial <strong>Hospital</strong>, Chicago 28.8 0.5 0.79 5013 1.87 9.0 Yes H, P<br />
44 Pitt County Memorial <strong>Hospital</strong>, Greenville, N.C. 28.7 0.5 0.82 9878 1.20 9.0 Yes H, P<br />
45 Riverside Methodist <strong>Hospital</strong>s, Columbus, Ohio 28.7 1.0 0.84 15621 1.14 9.0 Yes H, P<br />
46 Lankenau <strong>Hospital</strong>, Wynnewood, Pa. 28.6 0.5 0.63 6236 1.22 8.5 No H, P<br />
47 St. Vincent <strong>Hospital</strong> and Health Center, Indianapolis 28.6 2.0 0.85 12904 1.24 8.0 Yes H, P<br />
48 Lehigh Valley <strong>Hospital</strong>, Allentown, Pa. 28.6 0.0 0.77 9202 1.19 8.5 Yes H, P<br />
49 Sinai <strong>Hospital</strong> <strong>of</strong> Baltimore 28.6 0.5 0.72 5512 0.71 9.0 Yes H, P<br />
50 Mercy Medical Center, Canton, Ohio 28.5 0.5 0.71 4940 1.21 9.0 Yes H
<strong>2003</strong> Hormonal Disorders Best <strong>Hospital</strong> List<br />
Technology<br />
U.S. News Reputational Mortality R.N.'s score Trauma<br />
Rank <strong>Hospital</strong> <strong>Index</strong> score rate Discharges to beds (<strong>of</strong> 7) Center<br />
1 Mayo Clinic, Rochester, Minn. 100.0 69.8 0.81 1695 1.51 7.0 No<br />
2 Massachusetts General <strong>Hospital</strong>, Boston 91.9 59.3 0.68 1372 1.82 7.0 Yes<br />
3 Johns Hopkins <strong>Hospital</strong>, Baltimore 67.3 37.3 0.66 846 1.76 7.0 Yes<br />
4 University <strong>of</strong> California, San Francisco Medical Center 46.0 18.4 0.40 512 2.02 7.0 No<br />
5 University <strong>of</strong> Virginia Medical Center, Charlottesville 44.6 14.8 0.60 1055 2.25 7.0 Yes<br />
6 Barnes-Jewish <strong>Hospital</strong>, St. Louis 44.5 14.5 0.73 1866 1.46 7.0 Yes<br />
7 Brigham and Women's <strong>Hospital</strong>, Boston 43.4 14.5 0.53 721 1.64 6.5 Yes<br />
8 UCLA Medical Center, Los Angeles 43.3 13.9 0.56 790 1.94 7.0 Yes<br />
9 Beth Israel Deaconess Medical Center, Boston 42.1 12.2 0.48 952 2.23 6.0 Yes<br />
10 New York-Presbyterian <strong>Hospital</strong> 41.6 17.7 1.46 2159 1.41 7.0 Yes<br />
11 University <strong>of</strong> Washington Medical Center, Seattle 39.5 13.6 0.49 378 1.38 7.0 No (+3 SD)<br />
12 Cleveland Clinic 38.3 11.0 0.64 1209 2.12 7.0 No<br />
13 University <strong>of</strong> Michigan Medical Center, Ann Arbor 37.0 7.6 0.56 927 1.87 7.0 Yes<br />
14 Northwestern Memorial <strong>Hospital</strong>, Chicago 36.3 7.8 0.69 1064 1.87 7.0 Yes<br />
15 University <strong>of</strong> Chicago <strong>Hospital</strong>s 35.4 9.1 0.82 690 1.86 7.0 Yes<br />
16 Duke University Medical Center, Durham, N.C. 35.3 6.2 0.57 934 2.55 7.0 Yes<br />
17 Parkland Memorial <strong>Hospital</strong>, Dallas 34.4 7.0 0.61 431 1.72 7.0 Yes<br />
18 Vanderbilt University Medical Center, Nashville 33.3 5.2 0.67 894 2.24 7.0 Yes (+2 SD)<br />
19 Henry Ford <strong>Hospital</strong>, Detroit 32.1 1.5 0.66 1979 1.79 6.5 Yes<br />
20 Oregon Health & Science University <strong>Hospital</strong>, Portland 31.5 3.1 0.44 460 2.14 6.5 Yes<br />
21 Florida <strong>Hospital</strong>, Orlando 30.3 0.0 0.40 2017 1.65 7.0 No<br />
22 University <strong>of</strong> Colorado <strong>Hospital</strong>, Denver 30.3 3.3 0.61 354 2.25 7.0 Yes<br />
23 University <strong>Hospital</strong>s <strong>of</strong> Cleveland 30.0 0.5 0.55 1136 1.84 7.0 Yes<br />
24 William Beaumont <strong>Hospital</strong>, Royal Oak, Mich. 30.0 0.0 0.63 1592 1.75 7.0 Yes<br />
25 Washington <strong>Hospital</strong> Center, Washington, D.C. 29.7 0.5 0.66 1898 1.43 6.0 Yes<br />
26 University <strong>of</strong> Alabama <strong>Hospital</strong> at Birmingham 29.6 1.9 0.69 1134 1.45 7.0 Yes<br />
27 Inova Fairfax <strong>Hospital</strong>, Falls Church, Va. 29.4 0.5 0.43 828 1.94 6.0 Yes<br />
28 St. Louis University <strong>Hospital</strong> 29.4 1.0 0.34 720 1.41 7.0 Yes<br />
29 University <strong>of</strong> Iowa <strong>Hospital</strong>s and Clinics, Iowa City 29.3 1.8 0.55 666 1.35 7.0 Yes<br />
30 St. Joseph Mercy <strong>Hospital</strong>, Ann Arbor 29.2 0.0 0.50 1023 1.85 6.0 Yes<br />
31 Yale-New Haven <strong>Hospital</strong>, New Haven, Conn. 29.1 2.6 0.71 800 1.43 7.0 Yes<br />
32 Strong Memorial <strong>Hospital</strong>-University <strong>of</strong> Rochester, N.Y. 29.0 1.0 0.59 810 2.01 6.5 Yes<br />
33 Evanston Northwestern Healthcare, Evanston, Ill. 29.0 0.0 0.54 1254 1.31 7.0 Yes<br />
34 University <strong>of</strong> Miami, Jackson Memorial <strong>Hospital</strong> 29.0 2.8 0.51 683 1.53 7.0 No<br />
35 Ohio State University Medical Center, Columbus 29.0 2.4 0.30 713 0.98 5.5 Yes<br />
36 University <strong>of</strong> Pittsburgh Medical Center 28.9 1.9 0.81 1312 1.52 7.0 Yes<br />
37 University <strong>of</strong> North Carolina <strong>Hospital</strong>s, Chapel Hill 28.8 1.0 0.60 774 1.64 7.0 Yes<br />
38 University <strong>of</strong> California, Davis Medical Center, Sacramento 28.8 0.0 0.29 582 2.97 7.0 Yes<br />
39 Abbott Northwestern <strong>Hospital</strong>, Minneapolis 28.5 0.0 0.41 908 1.24 7.0 Yes<br />
40 <strong>Hospital</strong> <strong>of</strong> the University <strong>of</strong> Pennsylvania, Philadelphia 28.4 4.8 1.10 806 1.79 7.0 Yes<br />
41 Los Angeles County-Harbor-UCLA Medical Center 28.3 2.0 0.26 189 1.88 4.5 Yes<br />
42 F.G. McGaw <strong>Hospital</strong> at Loyola University, Maywood, Ill. 28.3 1.0 0.66 736 1.72 7.0 Yes<br />
43 Good Samaritan Regional Medical Center, Phoenix 28.2 0.9 0.38 548 1.14 7.0 Yes<br />
44 Lahey Clinic, Burlington, Mass. 28.2 0.4 0.48 720 1.46 6.0 Yes<br />
45 University <strong>Hospital</strong>, Cincinnati 28.0 0.4 0.49 709 1.16 7.0 Yes<br />
46 Froedtert Memorial Lutheran <strong>Hospital</strong>, Milwaukee 27.9 0.5 0.57 909 1.46 6.0 Yes<br />
47 Deaconess <strong>Hospital</strong>, Evansville, Ind. 27.8 0.0 0.50 934 1.06 7.0 Yes<br />
48 St. Vincent Medical Center, Toledo, Ohio 27.8 0.0 0.56 800 1.56 6.5 Yes<br />
49 Mount Sinai Medical Center, New York 27.8 5.4 1.57 2049 1.68 7.0 Yes<br />
50 Poudre Valley <strong>Hospital</strong>, Fort Collins, Colo. 27.7 0.0 0.50 495 2.22 6.0 Yes
<strong>2003</strong> Kidney Disease Best <strong>Hospital</strong> List<br />
Technology Discharge Medical/<br />
U.S. News Reputational Mortality R.N.'s score Trauma planning Surgical<br />
Rank <strong>Hospital</strong> <strong>Index</strong> score rate Discharges to beds (<strong>of</strong> 5) Center (<strong>of</strong> 3) Beds<br />
1 Massachusetts General <strong>Hospital</strong>, Boston 100.0 31.3 0.75 1151 1.82 5.0 Yes 3 66<br />
2 Brigham and Women's <strong>Hospital</strong>, Boston 94.9 29.4 0.65 795 1.64 5.0 Yes 3 38<br />
3 Mayo Clinic, Rochester, Minn. 88.2 25.2 0.83 1408 1.51 5.0 No 3 96<br />
4 Johns Hopkins <strong>Hospital</strong>, Baltimore 86.3 25.1 0.73 912 1.76 4.5 Yes 3 49<br />
5 New York-Presbyterian <strong>Hospital</strong> 85.4 24.0 1.22 2259 1.41 5.0 Yes 3 107<br />
6 Cleveland Clinic 81.6 23.1 0.74 1103 2.12 5.0 No 3 44<br />
7 UCLA Medical Center, Los Angeles 75.8 18.5 0.63 1057 1.94 5.0 Yes 3 58<br />
8 Duke University Medical Center, Durham, N.C. 67.4 16.0 0.85 1181 2.55 5.0 Yes 3 34<br />
9 Barnes-Jewish <strong>Hospital</strong>, St. Louis 64.8 12.0 0.77 1981 1.46 5.0 Yes 3 80<br />
10 <strong>Hospital</strong> <strong>of</strong> the University <strong>of</strong> Pennsylvania, Philadelphia 63.1 12.4 0.55 791 1.79 5.0 Yes 3 41<br />
11 Vanderbilt University Medical Center, Nashville 62.5 13.7 0.77 909 2.24 4.5 Yes 3 28<br />
12 University <strong>of</strong> California, San Francisco Medical Center 59.4 12.6 0.78 705 2.02 5.0 No 3 36<br />
13 University <strong>of</strong> Colorado <strong>Hospital</strong>, Denver 59.1 11.3 0.50 449 2.25 4.0 Yes 3 24<br />
14 University <strong>of</strong> Michigan Medical Center, Ann Arbor 58.3 9.7 0.56 1008 1.87 5.0 Yes 3 40<br />
15 Parkland Memorial <strong>Hospital</strong>, Dallas 57.6 9.4 0.49 701 1.72 5.0 Yes 3 37<br />
16 University <strong>of</strong> Washington Medical Center, Seattle 56.1 11.2 0.58 469 1.38 5.0 No 2 19<br />
17 University <strong>of</strong> Pittsburgh Medical Center 54.4 7.0 0.90 1162 1.52 5.0 Yes 3 123<br />
18 Stanford <strong>Hospital</strong> and Clinics, Stanford, Calif. 52.4 10.2 0.89 523 1.56 4.5 No 3 33<br />
19 University <strong>of</strong> Chicago <strong>Hospital</strong>s 51.8 6.1 0.44 803 1.86 5.0 Yes 3 33 (+3 SD)<br />
20 University <strong>of</strong> Alabama <strong>Hospital</strong> at Birmingham 50.1 7.6 1.05 1412 1.45 4.0 Yes 3 61<br />
21 University <strong>of</strong> Miami, Jackson Memorial <strong>Hospital</strong> 49.7 3.1 0.41 752 1.53 5.0 No 3 120<br />
22 Rush-Presbyterian-St. Luke's Medical Center, Chicago 48.9 5.2 0.56 1260 1.18 5.0 No 3 51<br />
23 Shands at the University <strong>of</strong> Florida, Gainesville 48.2 4.5 0.52 1149 1.62 5.0 Yes 3 30<br />
24 University <strong>of</strong> Maryland Medical System, Baltimore 48.1 3.7 0.47 1207 1.37 5.0 No 3 69<br />
25 Fairview-University Medical Center, Minneapolis 47.2 5.4 0.50 754 0.50 5.0 No 3 39<br />
26 Tufts-New England Medical Center, Boston 46.4 6.5 0.91 423 2.44 5.0 Yes 3 30<br />
27 Henry Ford <strong>Hospital</strong>, Detroit 46.4 1.0 0.47 1780 1.79 5.0 Yes 3 78<br />
28 Emory University <strong>Hospital</strong>, Atlanta 46.1 5.3 0.73 830 1.43 4.5 No 3 48<br />
29 University <strong>of</strong> Wisconsin <strong>Hospital</strong> and Clinics, Madison 45.2 4.4 0.61 801 1.05 5.0 Yes 3 24<br />
30 Beth Israel Deaconess Medical Center, Boston 44.5 3.9 0.81 1030 2.23 5.0 Yes 3 40<br />
31 Florida <strong>Hospital</strong>, Orlando 44.1 0.0 0.56 1994 1.65 5.0 No 3 102<br />
32 Yale-New Haven <strong>Hospital</strong>, New Haven, Conn. 43.8 4.5 1.00 986 1.43 5.0 Yes 3 52 (+2 SD)<br />
33 Hennepin County Medical Center, Minneapolis 43.5 2.1 0.37 752 0.58 5.0 Yes 3 40<br />
34 William Beaumont <strong>Hospital</strong>, Royal Oak, Mich. 43.4 1.0 0.69 1943 1.75 5.0 Yes 3 60<br />
35 Froedtert Memorial Lutheran <strong>Hospital</strong>, Milwaukee 43.4 1.2 0.31 931 1.46 5.0 Yes 3 31<br />
36 University <strong>of</strong> North Carolina <strong>Hospital</strong>s, Chapel Hill 43.3 3.5 0.68 1082 1.64 4.5 Yes 3 16<br />
37 Northwestern Memorial <strong>Hospital</strong>, Chicago 42.6 1.5 0.65 1059 1.87 5.0 Yes 3 58<br />
38 Methodist <strong>Hospital</strong>, Houston 42.1 4.3 0.90 970 1.33 4.5 No 3 43<br />
39 Ohio State University Medical Center, Columbus 41.7 1.7 0.60 1099 0.98 4.0 Yes 3 57<br />
40 University <strong>of</strong> Virginia Medical Center, Charlottesville 41.6 1.5 0.68 1053 2.25 5.0 Yes 3 45<br />
41 Denver Health and <strong>Hospital</strong>s 41.4 0.0 0.09 226 2.00 4.0 Yes 3 31<br />
42 Memorial Hermann <strong>Hospital</strong>, Houston 41.3 1.1 0.57 734 1.23 5.0 Yes 3 60<br />
43 University Health System, San Antonio 41.2 0.5 0.29 447 1.48 4.5 Yes 3 37<br />
44 St. Louis University <strong>Hospital</strong> 41.1 0.6 0.40 745 1.41 4.5 Yes 3 43<br />
45 Tampa General <strong>Hospital</strong> 40.8 0.0 0.36 718 0.92 5.0 Yes 3 57<br />
46 University <strong>Hospital</strong>s <strong>of</strong> Cleveland 40.7 1.6 0.73 1214 1.84 5.0 Yes 3 30<br />
47 University <strong>of</strong> Missouri <strong>Hospital</strong>s and Clinics, Columbia 40.4 2.0 0.64 374 1.82 3.0 Yes 3 54<br />
48 Baptist St. Anthony's Health System, Amarillo, Texas 40.2 0.0 0.23 725 1.47 5.0 No 3 31<br />
49 Summa Health System, Akron, Ohio 40.2 0.0 0.57 1513 2.21 5.0 Yes 3 35<br />
50 Temple University <strong>Hospital</strong>, Philadelphia 40.2 0.5 0.64 820 1.73 5.0 Yes 3 56
<strong>2003</strong> Neurology and Neurosurgery Best <strong>Hospital</strong> List<br />
Technology<br />
U.S. News Reputational Mortality R.N.'s score Trauma<br />
Rank <strong>Hospital</strong> <strong>Index</strong> score rate Discharges to beds (<strong>of</strong> 7) Center<br />
1 Mayo Clinic, Rochester, Minn. 100.0 58.5 0.95 5092 1.51 7.0 No<br />
2 Massachusetts General <strong>Hospital</strong>, Boston 91.6 52.8 1.09 3590 1.82 7.0 Yes<br />
3 Johns Hopkins <strong>Hospital</strong>, Baltimore 89.0 47.0 0.70 2555 1.76 7.0 Yes<br />
4 New York-Presbyterian <strong>Hospital</strong> 84.2 45.9 1.09 5104 1.41 7.0 Yes<br />
5 University <strong>of</strong> California, San Francisco Medical Center 62.8 33.3 1.07 1779 2.02 7.0 No<br />
6 Cleveland Clinic 60.8 24.3 0.62 3377 2.12 7.0 No<br />
7 Barnes-Jewish <strong>Hospital</strong>, St. Louis 45.9 13.5 0.93 4687 1.46 7.0 Yes<br />
8 UCLA Medical Center, Los Angeles 42.6 13.0 0.93 2142 1.94 7.0 Yes<br />
9 <strong>Hospital</strong> <strong>of</strong> the University <strong>of</strong> Pennsylvania, Philadelphia 41.9 15.2 1.14 2113 1.79 7.0 Yes (+3 SD)<br />
10 St. Joseph's <strong>Hospital</strong> and Medical Center, Phoenix 38.8 13.4 1.06 3075 0.91 5.0 Yes<br />
11 Methodist <strong>Hospital</strong>, Houston 36.7 7.4 0.78 3784 1.33 7.0 No<br />
12 NYU Medical Center, New York 34.6 3.8 0.68 3189 1.18 6.5 Yes<br />
13 Duke University Medical Center, Durham, N.C. 34.3 7.3 1.06 2851 2.55 7.0 Yes (+2 SD)<br />
14 William Beaumont <strong>Hospital</strong>, Royal Oak, Mich. 33.4 0.0 0.75 5270 1.75 7.0 Yes<br />
15 University <strong>of</strong> Chicago <strong>Hospital</strong>s 33.2 3.8 0.71 1298 1.86 7.0 Yes<br />
16 Brigham and Women's <strong>Hospital</strong>, Boston 32.2 7.5 1.09 1908 1.64 6.5 Yes<br />
17 Henry Ford <strong>Hospital</strong>, Detroit 32.2 1.8 0.77 3230 1.79 6.5 Yes<br />
18 Harper University <strong>Hospital</strong>, Detroit 32.1 0.4 0.41 1931 0.89 6.5 Yes<br />
19 Summa Health System, Akron, Ohio 31.9 0.0 0.64 2975 2.21 7.0 Yes<br />
20 University <strong>of</strong> Illinois Medical Center at Chicago 31.8 1.7 0.48 814 1.72 4.5 Yes<br />
21 Shands at the University <strong>of</strong> Florida, Gainesville 31.7 3.7 0.84 2421 1.62 6.0 Yes<br />
22 University <strong>Hospital</strong>s <strong>of</strong> Cleveland 31.6 1.3 0.72 2478 1.84 7.0 Yes<br />
23 Mount Sinai Medical Center, New York 31.6 3.2 0.90 2916 1.68 7.0 Yes<br />
24 Florida <strong>Hospital</strong>, Orlando 31.4 0.5 0.82 6106 1.65 7.0 No<br />
25 Stanford <strong>Hospital</strong> and Clinics, Stanford, Calif. 31.2 8.0 0.95 1731 1.56 5.0 No<br />
26 Denver Health and <strong>Hospital</strong>s 31.2 0.4 0.03 355 2.00 5.5 Yes<br />
27 Fairview-University Medical Center, Minneapolis 31.1 2.6 0.45 1673 0.50 7.0 No<br />
28 Ingalls <strong>Hospital</strong>, Harvey, Ill. 30.9 0.0 0.42 1553 0.67 7.0 Yes<br />
29 Evanston Northwestern Healthcare, Evanston, Ill. 30.9 0.9 0.71 2950 1.31 7.0 Yes<br />
30 University <strong>of</strong> Michigan Medical Center, Ann Arbor 30.8 5.5 1.04 1737 1.87 7.0 Yes<br />
31 Rush-Presbyterian-St. Luke's Medical Center, Chicago 30.7 1.6 0.51 1781 1.18 7.0 No<br />
32 St. Vincent <strong>Hospital</strong> and Health Center, Indianapolis 30.6 0.0 0.64 3437 1.24 6.0 Yes<br />
33 Abbott Northwestern <strong>Hospital</strong>, Minneapolis 30.6 0.5 0.71 3263 1.24 7.0 Yes<br />
34 University <strong>of</strong> Virginia Medical Center, Charlottesville 30.4 3.4 1.04 3252 2.25 7.0 Yes<br />
35 Beth Israel Deaconess Medical Center, Boston 30.3 1.8 0.82 2608 2.23 6.0 Yes<br />
36 University <strong>of</strong> Pittsburgh Medical Center 30.2 3.9 1.10 3756 1.52 7.0 Yes<br />
37 St. Elizabeth Medical Center-North, Covington, Ky. 30.1 0.0 0.48 1750 1.35 4.5 Yes<br />
38 Georgetown University <strong>Hospital</strong>, Washington, D.C. 29.7 1.0 0.65 1036 1.51 7.0 Yes<br />
39 University <strong>of</strong> Washington Medical Center, Seattle 29.4 3.5 0.68 750 1.38 7.0 No<br />
40 William Beaumont <strong>Hospital</strong>-Troy, Troy, Mich. 29.4 0.0 0.65 1540 1.91 6.5 Yes<br />
41 University <strong>of</strong> Colorado <strong>Hospital</strong>, Denver 29.4 0.8 0.67 746 2.25 7.0 Yes<br />
42 <strong>Hospital</strong> <strong>of</strong> St. Raphael, New Haven, Conn. 29.3 0.0 0.56 1925 0.88 6.5 Yes<br />
43 Baptist St. Anthony's Health System, Amarillo, Texas 29.3 0.0 0.48 2400 1.47 5.0 No<br />
44 Advocate Lutheran General <strong>Hospital</strong>, Park Ridge, Ill. 29.0 0.0 0.60 2376 0.94 6.0 Yes<br />
45 Northwestern Memorial <strong>Hospital</strong>, Chicago 29.0 1.7 0.91 2364 1.87 7.0 Yes<br />
46 Christ <strong>Hospital</strong>, Cincinnati 29.0 0.0 0.58 1604 1.07 6.5 Yes<br />
47 Memorial Sloan-Kettering Cancer Center, New York 29.0 1.4 0.57 527 2.32 7.0 No<br />
48 Mercy Medical Center, Mason City, Iowa 28.9 0.0 0.53 1402 1.26 5.0 Yes<br />
49 Akron General Medical Center, Akron, Ohio 28.8 0.0 0.71 2256 1.34 7.0 Yes<br />
50 Thomas Jefferson University <strong>Hospital</strong>, Philadelphia 28.8 1.7 0.91 2966 1.62 6.0 Yes
<strong>2003</strong> Orthopedics Best <strong>Hospital</strong> List<br />
Technology<br />
U.S. News Reputational Mortality R.N.'s score Trauma<br />
Rank <strong>Hospital</strong> <strong>Index</strong> score rate Discharges to beds (<strong>of</strong> 5) Center<br />
1 Mayo Clinic, Rochester, Minn. 100.0 56.1 0.69 8147 1.51 5.0 No<br />
2 <strong>Hospital</strong> for Special Surgery, New York 84.2 41.5 0.08 7692 1.72 5.0 Yes<br />
3 Massachusetts General <strong>Hospital</strong>, Boston 77.6 38.6 0.83 3490 1.82 5.0 Yes<br />
4 Johns Hopkins <strong>Hospital</strong>, Baltimore 58.8 24.2 0.70 1649 1.76 5.0 Yes<br />
5 Cleveland Clinic 53.1 19.4 0.47 3441 2.12 5.0 No<br />
6 Duke University Medical Center, Durham, N.C. 43.9 13.7 0.93 2714 2.55 5.0 Yes<br />
7 UCLA Medical Center, Los Angeles 41.1 14.6 1.34 1687 1.94 5.0 Yes<br />
8 University <strong>of</strong> Iowa <strong>Hospital</strong>s and Clinics, Iowa City 39.6 10.3 0.76 1627 1.35 5.0 Yes<br />
9 Harborview Medical Center, Seattle 37.8 9.1 0.66 1007 2.18 4.5 Yes<br />
10 University <strong>of</strong> Washington Medical Center, Seattle 37.0 9.4 0.60 1042 1.38 5.0 No (+3 SD)<br />
11 Rush-Presbyterian-St. Luke's Medical Center, Chicago 35.6 6.7 0.41 2498 1.18 5.0 No<br />
12 Stanford <strong>Hospital</strong> and Clinics, Stanford, Calif. 35.0 7.8 0.65 2063 1.56 3.0 No<br />
13 University <strong>of</strong> Pittsburgh Medical Center 34.9 7.2 0.97 2052 1.52 5.0 Yes<br />
14 Brigham and Women's <strong>Hospital</strong>, Boston 34.3 5.1 0.66 2509 1.64 4.5 Yes<br />
15 Barnes-Jewish <strong>Hospital</strong>, St. Louis 33.2 7.1 1.18 2819 1.46 5.0 Yes<br />
16 Parkland Memorial <strong>Hospital</strong>, Dallas 32.8 6.3 0.80 596 1.72 5.0 Yes<br />
17 University <strong>of</strong> California, San Francisco Medical Center 32.7 7.7 0.90 1068 2.02 5.0 No<br />
18 New York-Presbyterian <strong>Hospital</strong> 32.6 7.3 1.26 3167 1.41 5.0 Yes<br />
19 Thomas Jefferson University <strong>Hospital</strong>, Philadelphia 32.5 4.0 0.66 3983 1.62 4.0 Yes<br />
20 Northwestern Memorial <strong>Hospital</strong>, Chicago 32.3 4.5 0.86 2423 1.87 5.0 Yes<br />
21 University <strong>Hospital</strong>s <strong>of</strong> Cleveland 32.2 2.4 0.52 2369 1.84 5.0 Yes<br />
22 University <strong>of</strong> Michigan Medical Center, Ann Arbor 31.6 4.0 0.69 1305 1.87 5.0 Yes (+2 SD)<br />
23 University <strong>of</strong> Chicago <strong>Hospital</strong>s 31.0 3.6 0.69 1245 1.86 5.0 Yes<br />
24 <strong>Hospital</strong> for Joint Diseases Orthopedic Institute, New York 30.8 4.0 0.18 2022 1.04 4.0 No<br />
25 Shands at the University <strong>of</strong> Florida, Gainesville 30.4 2.8 0.73 2448 1.62 4.0 Yes<br />
26 New England Baptist <strong>Hospital</strong>, Boston 30.3 3.6 0.65 3044 1.24 5.0 No<br />
27 Vanderbilt University Medical Center, Nashville 30.2 1.6 0.50 1467 2.24 5.0 Yes<br />
28 University <strong>of</strong> Virginia Medical Center, Charlottesville 29.9 1.2 0.59 2061 2.25 5.0 Yes<br />
29 Baylor University Medical Center, Dallas 29.4 1.2 0.68 3676 1.62 5.0 Yes<br />
30 Summa Health System, Akron, Ohio 29.2 0.0 0.40 3563 2.21 5.0 Yes<br />
31 University <strong>of</strong> Wisconsin <strong>Hospital</strong> and Clinics, Madison 29.2 1.8 0.54 1370 1.05 5.0 Yes<br />
32 University <strong>of</strong> California, Davis Medical Center, Sacramento 29.1 1.6 0.58 1171 2.97 5.0 Yes<br />
33 Methodist <strong>Hospital</strong>, Houston 29.0 4.4 0.99 3192 1.33 5.0 No<br />
34 Fairview-University Medical Center, Minneapolis 28.9 3.2 0.53 1968 0.50 5.0 No<br />
35 Grant Medical Center, Columbus, Ohio 28.8 0.0 0.50 2927 1.31 5.0 Yes<br />
36 Georgetown University <strong>Hospital</strong>, Washington, D.C. 28.7 1.0 0.49 930 1.51 5.0 Yes<br />
37 William Beaumont <strong>Hospital</strong>, Royal Oak, Mich. 28.4 0.4 0.66 5427 1.75 5.0 Yes<br />
38 University <strong>of</strong> Miami, Jackson Memorial <strong>Hospital</strong> 28.3 2.8 0.57 766 1.53 5.0 No<br />
39 F.G. McGaw <strong>Hospital</strong> at Loyola University, Maywood, Ill. 28.2 1.4 0.70 1378 1.72 5.0 Yes<br />
40 University Health System, San Antonio 28.1 1.6 0.53 633 1.48 4.0 Yes<br />
41 Poudre Valley <strong>Hospital</strong>, Fort Collins, Colo. 28.1 0.0 0.62 2029 2.22 5.0 Yes<br />
42 University <strong>of</strong> Alabama <strong>Hospital</strong> at Birmingham 28.0 2.0 0.93 1895 1.45 5.0 Yes<br />
43 Evanston Northwestern Healthcare, Evanston, Ill. 28.0 0.0 0.60 3355 1.31 5.0 Yes<br />
44 Advocate Lutheran General <strong>Hospital</strong>, Park Ridge, Ill. 27.9 0.4 0.40 2381 0.94 4.0 Yes<br />
45 Yale-New Haven <strong>Hospital</strong>, New Haven, Conn. 27.9 1.2 0.68 1310 1.43 5.0 Yes<br />
46 St. Joseph's <strong>Hospital</strong>, Tampa 27.9 0.6 0.59 1687 1.31 4.5 Yes<br />
47 Clarian Health Partners (IU and Methodist <strong>Hospital</strong>s), Indianapolis 27.7 2.4 0.70 4216 0.94 5.0 No<br />
48 University <strong>of</strong> Tennessee Medical Center, Memphis 27.7 5.8 0.86 105 1.04 4.5 No<br />
49 Union Memorial <strong>Hospital</strong>, Baltimore 27.6 0.0 0.45 1462 1.38 4.5 Yes<br />
50 North Carolina Baptist <strong>Hospital</strong>, Winston-Salem 27.6 1.4 0.93 2133 1.68 5.0 Yes
<strong>2003</strong> Respiratory Disorders Best <strong>Hospital</strong> List<br />
Technology Discharge Hospice,<br />
U.S. News Reputational Mortality R.N.'s score Trauma planning palliative<br />
Rank <strong>Hospital</strong> <strong>Index</strong> score rate Discharges to beds (<strong>of</strong> 4) Center (<strong>of</strong> 3) care<br />
1 National Jewish Medical and Research Center, Denver 100.0 53.0 0.00 97 2.14 2.5 No 3<br />
2 Mayo Clinic, Rochester, Minn. 84.2 43.0 0.92 4644 1.51 4.0 No 3 H, P<br />
3 Johns Hopkins <strong>Hospital</strong>, Baltimore 72.2 33.0 0.82 1599 1.76 4.0 Yes 3 H, P<br />
4 Barnes-Jewish <strong>Hospital</strong>, St. Louis 52.2 19.1 0.88 4944 1.46 4.0 Yes 3 H, P<br />
5 Massachusetts General <strong>Hospital</strong>, Boston 52.1 18.9 0.88 3460 1.82 4.0 Yes 3 H, P<br />
6 University <strong>of</strong> California, San Francisco Medical Center 49.8 17.6 0.73 1317 2.02 4.0 No 3 P<br />
7 University <strong>of</strong> Colorado <strong>Hospital</strong>, Denver 47.4 13.9 0.60 1057 2.25 4.0 Yes 3 P<br />
8 UCSD Medical Center, San Diego 43.5 13.2 0.81 1366 1.73 4.0 Yes 3 H<br />
9 Duke University Medical Center, Durham, N.C. 43.0 13.8 1.01 3049 2.55 4.0 Yes 3 H, P<br />
10 University <strong>of</strong> Michigan Medical Center, Ann Arbor 42.2 11.4 0.75 2130 1.87 4.0 Yes 3 P<br />
11 Cleveland Clinic 40.8 11.1 0.82 2773 2.12 4.0 No 3 H, P (+3 SD)<br />
12 <strong>Hospital</strong> <strong>of</strong> the University <strong>of</strong> Pennsylvania, Philadelphia 36.1 9.8 0.99 1356 1.79 4.0 Yes 3 H<br />
13 University <strong>of</strong> Washington Medical Center, Seattle 35.0 11.3 1.05 873 1.38 4.0 No 2 H<br />
14 UCLA Medical Center, Los Angeles 34.3 6.1 0.82 1714 1.94 4.0 Yes 3 H, P<br />
15 Brigham and Women's <strong>Hospital</strong>, Boston 32.7 5.8 0.92 2343 1.64 4.0 Yes 3 H, P (+2 SD)<br />
16 Yale-New Haven <strong>Hospital</strong>, New Haven, Conn. 31.2 4.9 0.88 2437 1.43 4.0 Yes 3 H<br />
17 University <strong>of</strong> Pittsburgh Medical Center 31.2 5.3 0.98 2489 1.52 4.0 Yes 3 H, P<br />
18 University <strong>of</strong> Alabama <strong>Hospital</strong> at Birmingham 31.1 5.0 0.94 2096 1.45 4.0 Yes 3 H, P<br />
19 University <strong>of</strong> Chicago <strong>Hospital</strong>s 30.9 3.7 0.82 1449 1.86 4.0 Yes 3 H, P<br />
20 University <strong>Hospital</strong>s <strong>of</strong> Cleveland 30.8 1.1 0.62 2824 1.84 4.0 Yes 3 H, P<br />
21 Stanford <strong>Hospital</strong> and Clinics, Stanford, Calif. 30.3 6.7 1.02 1551 1.56 4.0 No 3 H<br />
22 New York-Presbyterian <strong>Hospital</strong> 30.2 6.8 1.21 5365 1.41 4.0 Yes 3 H, P<br />
23 Vanderbilt University Medical Center, Nashville 30.1 5.2 0.98 2143 2.24 4.0 Yes 3 P<br />
24 Henry Ford <strong>Hospital</strong>, Detroit 30.0 1.5 0.72 3818 1.79 4.0 Yes 3 H, P<br />
25 University <strong>of</strong> Iowa <strong>Hospital</strong>s and Clinics, Iowa City 29.9 2.8 0.77 1319 1.35 4.0 Yes 3 H, P<br />
26 Christ <strong>Hospital</strong>, Cincinnati 29.9 0.0 0.53 2456 1.07 4.0 Yes 3 H, P<br />
27 Denver Health and <strong>Hospital</strong>s 29.6 0.4 0.04 655 2.00 3.5 Yes 3 H, P<br />
28 University <strong>of</strong> Virginia Medical Center, Charlottesville 29.3 1.9 0.78 2446 2.25 4.0 Yes 3 H, P<br />
29 University Health System, San Antonio 28.9 0.6 0.56 674 1.48 4.0 Yes 3 P<br />
30 Southwest General Health Center, Middleburg Heights, Ohio 28.7 0.4 0.58 2568 0.62 4.0 Yes 3 H<br />
31 Miami Valley <strong>Hospital</strong>, Dayton, Ohio 28.7 0.4 0.61 3515 1.02 4.0 Yes 3 P<br />
32 Lahey Clinic, Burlington, Mass. 28.5 0.9 0.61 2013 1.46 4.0 Yes 3<br />
33 Summa Health System, Akron, Ohio 28.3 0.0 0.68 5244 2.21 4.0 Yes 3 H, P<br />
34 Grandview <strong>Hospital</strong> and Medical Center, Dayton, Ohio 28.2 0.0 0.53 1558 1.24 3.5 No 3 H, P<br />
35 University <strong>of</strong> Wisconsin <strong>Hospital</strong> and Clinics, Madison 28.1 0.8 0.64 1409 1.05 4.0 Yes 3 H<br />
36 CHP <strong>Hospital</strong> and Surgical Center, Lorain, Ohio 28.1 0.0 0.64 2437 0.74 4.0 Yes 3 H, P<br />
37 Parkland Memorial <strong>Hospital</strong>, Dallas 28.1 1.9 0.76 868 1.72 4.0 Yes 3 P<br />
38 LDS <strong>Hospital</strong>, Salt Lake City 28.0 1.1 0.74 1552 1.01 4.0 Yes 3 H, P<br />
39 Akron General Medical Center, Akron, Ohio 28.0 0.0 0.69 3721 1.34 4.0 Yes 3 H, P<br />
40 Meridia Hillcrest <strong>Hospital</strong>, Cleveland 28.0 0.0 0.68 2700 1.26 4.0 Yes 3 H, P<br />
41 Swedish Medical Center, Englewood, Colo. 27.9 0.4 0.63 1498 1.45 4.0 Yes 2 H, P<br />
42 University <strong>of</strong> North Carolina <strong>Hospital</strong>s, Chapel Hill 27.9 2.5 0.94 2621 1.64 4.0 Yes 3 H, P<br />
43 Boulder Community <strong>Hospital</strong>, Boulder, Colo. 27.8 0.0 0.57 1090 1.39 4.0 No 3 H, P<br />
44 Martin Memorial Medical Center, Stuart, Fla. 27.8 0.0 0.57 2928 1.25 4.0 No 3 H<br />
45 Mercy <strong>Hospital</strong>, Coon Rapids, Minn. 27.8 0.0 0.53 1240 0.65 3.5 Yes 2 H, P<br />
46 Regions <strong>Hospital</strong>, Saint Paul, Minn. 27.8 0.0 0.61 1911 0.39 3.5 Yes 3 H, P<br />
47 University <strong>Hospital</strong>, Cincinnati 27.8 0.0 0.66 1676 1.16 4.0 Yes 3 H, P<br />
48 Providence Holy Cross Medical Center, Mission Hills, Calif. 27.8 0.0 0.63 1129 0.82 4.0 Yes 3 H, P<br />
49 MetroHealth Medical Center, Cleveland 27.8 0.4 0.68 1733 0.66 4.0 Yes 3 H, P<br />
50 Fairview <strong>Hospital</strong>, Cleveland 27.7 0.0 0.66 2061 0.95 4.0 Yes 3 H, P
<strong>2003</strong> Rheumatology Best <strong>Hospital</strong> List<br />
<strong>Hospital</strong>wide Technology Discharge<br />
U.S. News Reputational mortality R.N.'s score planning Palliative<br />
Rank <strong>Hospital</strong> <strong>Index</strong> score rate to beds (<strong>of</strong> 5) (<strong>of</strong> 3) care<br />
1 Mayo Clinic, Rochester, Minn. 100.0 51.2 0.79 1.51 5.0 3 Yes<br />
2 Johns Hopkins <strong>Hospital</strong>, Baltimore 99.5 50.4 0.74 1.76 5.0 3 Yes<br />
3 <strong>Hospital</strong> for Special Surgery, New York 74.3 25.3 0.06 1.72 5.0 3 Yes<br />
4 Cleveland Clinic 71.3 28.4 0.67 2.12 5.0 3 Yes<br />
5 UCLA Medical Center, Los Angeles 66.7 27.0 0.89 1.94 5.0 3 Yes<br />
6 University <strong>of</strong> Alabama <strong>Hospital</strong> at Birmingham 62.7 24.8 0.97 1.45 5.0 3 Yes<br />
7 Massachusetts General <strong>Hospital</strong>, Boston 61.0 22.7 0.88 1.82 5.0 3 Yes<br />
8 Brigham and Women's <strong>Hospital</strong>, Boston 57.2 19.0 0.76 1.64 4.5 3 Yes<br />
9 Duke University Medical Center, Durham, N.C. 49.3 14.3 0.92 2.55 5.0 3 Yes<br />
10 University <strong>of</strong> California, San Francisco Medical Center 46.7 11.4 0.83 2.02 5.0 3 Yes<br />
11 <strong>Hospital</strong> for Joint Diseases Orthopedic Institute, New York 45.2 6.1 0.31 1.04 4.0 3 Yes (+3 SD)<br />
12 Stanford <strong>Hospital</strong> and Clinics, Stanford, Calif. 42.4 11.3 0.89 1.56 3.0 3 No<br />
13 University <strong>of</strong> Pittsburgh Medical Center 42.0 8.3 0.88 1.52 5.0 3 Yes<br />
14 Barnes-Jewish <strong>Hospital</strong>, St. Louis 40.9 7.2 0.84 1.46 5.0 3 Yes<br />
15 University <strong>of</strong> Michigan Medical Center, Ann Arbor 40.7 5.9 0.74 1.87 5.0 3 Yes<br />
16 Denver Health and <strong>Hospital</strong>s 39.9 0.0 0.06 2.00 4.0 3 Yes<br />
17 University <strong>of</strong> Chicago <strong>Hospital</strong>s 39.0 5.2 0.80 1.86 5.0 3 Yes<br />
18 Benedictine <strong>Hospital</strong>, Kingston, N.Y. 38.5 0.0 0.02 0.54 3.5 3 Yes<br />
19 NYU Medical Center, New York 38.1 7.2 1.01 1.18 4.5 3 Yes<br />
20 University <strong>of</strong> Colorado <strong>Hospital</strong>, Denver 38.0 3.0 0.65 2.25 5.0 3 Yes<br />
21 University <strong>of</strong> Washington Medical Center, Seattle 37.6 5.7 0.72 1.38 5.0 2 No (+2 SD)<br />
22 University <strong>Hospital</strong>s <strong>of</strong> Cleveland 36.7 2.2 0.67 1.84 5.0 3 Yes<br />
23 St. Luke's-Cornwall <strong>Hospital</strong>, Newburgh, N.Y. 36.6 0.0 0.11 0.75 3.0 3 No<br />
24 Hughston Sports Medicine <strong>Hospital</strong>, Columbus, Ga. 36.5 0.0 0.14 0.80 3.0 3 No<br />
25 Rehabilitation Institute <strong>of</strong> Michigan, Detroit 36.4 0.0 0.09 0.65 2.5 2 Yes<br />
26 Northwestern Memorial <strong>Hospital</strong>, Chicago 36.2 4.3 0.92 1.87 5.0 3 Yes<br />
27 Parkland Memorial <strong>Hospital</strong>, Dallas 36.2 3.8 0.87 1.72 5.0 3 Yes<br />
28 New York-Presbyterian <strong>Hospital</strong> 35.5 6.4 1.17 1.41 5.0 3 Yes<br />
29 National Rehabilitation <strong>Hospital</strong>, Washington, D.C. 35.4 0.0 0.13 0.51 2.0 3 No<br />
30 Methodist Rehabilitation Center, Jackson, Miss. 35.1 0.0 0.16 0.48 2.0 3 No<br />
31 Christ <strong>Hospital</strong>, Cincinnati 34.9 0.0 0.52 1.07 4.5 3 Yes<br />
32 <strong>Hospital</strong> <strong>of</strong> the University <strong>of</strong> Pennsylvania, Philadelphia 34.7 5.3 1.01 1.79 5.0 3 No<br />
33 Rehabilitation Institute <strong>of</strong> Chicago 34.5 0.0 0.09 0.38 2.5 2 No<br />
34 Summa Health System, Akron, Ohio 34.4 0.0 0.62 2.21 5.0 3 Yes<br />
35 Grandview <strong>Hospital</strong> and Medical Center, Dayton, Ohio 34.4 0.0 0.57 1.24 4.5 3 Yes<br />
36 Baptist Health Rehabilitation Institute, Little Rock, Ark. 34.3 0.0 0.08 0.18 2.5 2 No<br />
37 University <strong>of</strong> Miami, Jackson Memorial <strong>Hospital</strong> 34.3 1.8 0.82 1.53 5.0 3 Yes<br />
38 Beth Israel Deaconess Medical Center, Boston 34.2 2.3 0.80 2.23 4.0 3 Yes<br />
39 Georgetown University <strong>Hospital</strong>, Washington, D.C. 33.9 0.7 0.73 1.51 5.0 3 Yes<br />
40 West Jefferson Medical Center, Marrero, La. 33.9 0.0 0.43 0.97 4.0 3 No<br />
41 Abbott Northwestern <strong>Hospital</strong>, Minneapolis 33.6 0.0 0.66 1.24 5.0 3 Yes<br />
42 Fairview-University Medical Center, Minneapolis 33.6 0.7 0.68 0.50 5.0 3 Yes<br />
43 Vanderbilt University Medical Center, Nashville 33.6 2.7 0.95 2.24 5.0 3 Yes<br />
44 Rusk Rehabilitation Center, Columbia, Mo. 33.5 0.0 0.02 0.32 1.5 2 No<br />
45 Sheltering Arms Rehabilitation <strong>Hospital</strong>, Richmond, Va. 33.5 0.0 0.13 0.28 1.5 2 No<br />
46 Advocate Lutheran General <strong>Hospital</strong>, Park Ridge, Ill. 33.4 0.4 0.62 0.94 4.0 3 Yes<br />
47 Ingalls <strong>Hospital</strong>, Harvey, Ill. 33.4 0.0 0.64 0.67 5.0 3 Yes<br />
48 University <strong>of</strong> Iowa <strong>Hospital</strong>s and Clinics, Iowa City 33.3 1.6 0.85 1.35 5.0 3 Yes<br />
49 Scripps Mercy <strong>Hospital</strong>, San Diego 33.3 0.8 0.68 0.88 4.0 3 Yes<br />
50 Marianjoy Rehabilitation <strong>Hospital</strong> and Clinics, Wheaton, Ill. 33.3 0.0 0.03 0.20 0.0 3 No
<strong>2003</strong> Urology Best <strong>Hospital</strong> List<br />
Technology<br />
U.S. News Reputational Mortality R.N.'s score Trauma<br />
Rank <strong>Hospital</strong> <strong>Index</strong> score rate Discharges to beds (<strong>of</strong> 8) Center<br />
1 Johns Hopkins <strong>Hospital</strong>, Baltimore 100.0 75.7 0.75 1321 1.76 7.5 Yes<br />
2 Cleveland Clinic 80.3 55.0 0.50 1790 2.12 8.0 No<br />
3 Mayo Clinic, Rochester, Minn. 65.1 39.9 0.76 3871 1.51 8.0 No<br />
4 UCLA Medical Center, Los Angeles 53.3 28.2 1.30 1313 1.94 8.0 Yes<br />
5 Barnes-Jewish <strong>Hospital</strong>, St. Louis 49.1 21.7 0.84 1648 1.46 8.0 Yes<br />
6 Massachusetts General <strong>Hospital</strong>, Boston 46.4 17.7 0.58 1274 1.82 8.0 Yes<br />
7 Memorial Sloan-Kettering Cancer Center, New York 46.2 18.7 0.40 1096 2.32 7.0 No<br />
8 Duke University Medical Center, Durham, N.C. 45.2 17.4 0.82 1654 2.55 8.0 Yes<br />
9 Methodist <strong>Hospital</strong>, Houston 40.7 14.3 0.71 1406 1.33 7.5 No<br />
10 New York-Presbyterian <strong>Hospital</strong> 40.3 14.9 1.37 3438 1.41 8.0 Yes<br />
11 University <strong>of</strong> California, San Francisco Medical Center 39.7 14.5 0.98 798 2.02 8.0 No (+3 SD)<br />
12 University <strong>of</strong> Michigan Medical Center, Ann Arbor 37.5 8.4 0.64 1275 1.87 8.0 Yes<br />
13 University <strong>of</strong> Texas, M. D. Anderson Cancer Center, Houston 36.8 10.6 0.78 880 2.97 7.0 No<br />
14 Stanford <strong>Hospital</strong> and Clinics, Stanford, Calif. 35.6 12.4 1.16 672 1.56 5.5 No<br />
15 University <strong>of</strong> Virginia Medical Center, Charlottesville 35.3 5.1 0.10 677 2.25 8.0 Yes<br />
16 Lahey Clinic, Burlington, Mass. 34.7 4.2 0.10 905 1.46 7.0 Yes<br />
17 Northwestern Memorial <strong>Hospital</strong>, Chicago 34.2 4.2 0.46 1269 1.87 8.0 Yes<br />
18 Clarian Health Partners (IU and Methodist <strong>Hospital</strong>s), Indianapolis 33.7 7.2 0.64 1643 0.94 8.0 No<br />
19 <strong>Hospital</strong> <strong>of</strong> the University <strong>of</strong> Pennsylvania, Philadelphia 33.5 6.2 1.12 1032 1.79 8.0 Yes<br />
20 Vanderbilt University Medical Center, Nashville 33.4 4.4 0.67 953 2.24 7.5 Yes (+2 SD)<br />
21 University <strong>of</strong> Iowa <strong>Hospital</strong>s and Clinics, Iowa City 32.4 4.4 0.68 695 1.35 8.0 Yes<br />
22 Yale-New Haven <strong>Hospital</strong>, New Haven, Conn. 31.2 0.8 0.29 838 1.43 8.0 Yes<br />
23 Shands at the University <strong>of</strong> Florida, Gainesville 31.0 2.4 0.76 1017 1.62 7.0 Yes<br />
24 Georgetown University <strong>Hospital</strong>, Washington, D.C. 30.6 1.4 0.00 351 1.51 8.0 Yes<br />
25 Thomas Jefferson University <strong>Hospital</strong>, Philadelphia 30.6 1.7 0.69 951 1.62 7.0 Yes<br />
26 North Carolina Baptist <strong>Hospital</strong>, Winston-Salem 30.5 2.1 0.87 895 1.68 8.0 Yes<br />
27 Henry Ford <strong>Hospital</strong>, Detroit 30.3 0.4 0.51 969 1.79 7.5 Yes<br />
28 St. Joseph Mercy <strong>Hospital</strong>, Ann Arbor 30.2 0.0 0.27 803 1.85 7.0 Yes<br />
29 Brigham and Women's <strong>Hospital</strong>, Boston 30.0 4.2 1.21 671 1.64 7.5 Yes<br />
30 William Beaumont <strong>Hospital</strong>, Royal Oak, Mich. 29.9 0.4 0.66 1916 1.75 8.0 Yes<br />
31 NYU Medical Center, New York 29.7 4.1 1.33 1493 1.18 7.5 Yes<br />
32 Emory University <strong>Hospital</strong>, Atlanta 29.7 2.8 0.81 1101 1.43 7.5 No<br />
33 University <strong>of</strong> Wisconsin <strong>Hospital</strong> and Clinics, Madison 29.6 0.4 0.51 1142 1.05 8.0 Yes<br />
34 Abbott Northwestern <strong>Hospital</strong>, Minneapolis 29.4 0.0 0.52 903 1.24 8.0 Yes<br />
35 University <strong>Hospital</strong>s <strong>of</strong> Cleveland 29.4 0.8 0.68 735 1.84 8.0 Yes<br />
36 University <strong>of</strong> Miami, Jackson Memorial <strong>Hospital</strong> 29.3 2.3 0.62 663 1.53 8.0 No<br />
37 Washington <strong>Hospital</strong> Center, Washington, D.C. 29.3 0.6 0.61 935 1.43 6.0 Yes<br />
38 Cox Health Systems, Springfield, Mo. 29.2 0.0 0.63 1148 1.30 8.0 Yes<br />
39 St. John's Regional Health Center, Springfield, Mo. 29.2 0.0 0.39 959 0.87 7.5 Yes<br />
40 Carolinas Medical Center, Charlotte, N.C. 29.0 0.0 0.73 1062 1.60 7.5 Yes<br />
41 Sentara Norfolk General <strong>Hospital</strong>, Norfolk, Va. 29.0 0.0 0.61 908 1.32 7.5 Yes<br />
42 Wesley Medical Center, Wichita, Kan. 29.0 0.0 0.43 801 1.23 7.0 Yes<br />
43 Good Samaritan Regional Medical Center, Phoenix 29.0 0.0 0.29 610 1.14 7.5 Yes<br />
44 University <strong>of</strong> Pittsburgh Medical Center 28.9 0.3 0.84 910 1.52 8.0 Yes<br />
45 Pitt County Memorial <strong>Hospital</strong>, Greenville, N.C. 28.9 0.0 0.53 798 1.20 8.0 Yes<br />
46 Froedtert Memorial Lutheran <strong>Hospital</strong>, Milwaukee 28.9 0.4 0.57 698 1.46 7.0 Yes<br />
47 Baylor University Medical Center, Dallas 28.9 1.2 1.08 1222 1.62 8.0 Yes<br />
48 Florida <strong>Hospital</strong>, Orlando 28.9 0.6 0.58 1975 1.65 8.0 No<br />
49 Memorial Regional <strong>Hospital</strong>, Hollywood, Fla. 28.8 0.0 0.19 298 1.34 8.0 Yes<br />
50 Danbury <strong>Hospital</strong>, Danbury, Conn. 28.8 0.0 0.26 320 1.42 8.0 Yes
Appendix G<br />
Reputation Rankings for<br />
Special-Service <strong>Hospital</strong>s
<strong>2003</strong> Ophthalmology Reputational Score<br />
Reputational<br />
Rank <strong>Hospital</strong> Score<br />
1 Wilmer Eye Institute, Johns Hopkins <strong>Hospital</strong>, Baltimore 79.4<br />
2 Bascom Palmer Eye Institute, Miami 76.6<br />
3 Wills Eye <strong>Hospital</strong>, Philadelphia 61.7 (+3 SD)<br />
4 Massachusetts Eye and Ear Infirmary, Boston 43.1<br />
5 Jules Stein Eye Institute, UCLA Medical Center, Los Angeles 37.3 (+2 SD)<br />
6 University <strong>of</strong> Iowa <strong>Hospital</strong>s and Clinics, Iowa City 22.9<br />
7 Doheny Eye Institute, USC University <strong>Hospital</strong>, Los Angeles 13.1<br />
8 Duke University Medical Center, Durham, N.C. 11.2<br />
9 Barnes-Jewish <strong>Hospital</strong>, St. Louis 10.6<br />
10 Mayo Clinic, Rochester, Minn. 8.8<br />
11 Cleveland Clinic 8.2<br />
12 University <strong>of</strong> California, San Francisco Medical Center 6.8<br />
13 Cullen Eye Institute, Methodist <strong>Hospital</strong>, Houston 6.1<br />
14 University <strong>of</strong> Michigan Medical Center, Ann Arbor 5.2<br />
15 Emory University <strong>Hospital</strong>, Atlanta 5.2<br />
16 New York Eye and Ear Infirmary, New York 5.0<br />
17 Manhattan Eye, Ear and Throat <strong>Hospital</strong>, New York 3.7<br />
18 New York-Presbyterian <strong>Hospital</strong> 3.6<br />
19 University <strong>of</strong> Illinois Medical Center at Chicago 3.6<br />
20 <strong>Hospital</strong> <strong>of</strong> the University <strong>of</strong> Pennsylvania, Philadelphia 3.1
<strong>2003</strong> Pediatrics Reputational Score<br />
Reputational<br />
Rank <strong>Hospital</strong> Score<br />
1 Children's <strong>Hospital</strong> <strong>of</strong> Philadelphia 58.0<br />
2 Children's <strong>Hospital</strong> Boston 55.4<br />
3 Johns Hopkins <strong>Hospital</strong>, Baltimore 35.4 (+3 SD)<br />
(+2 SD)<br />
4 Children's <strong>Hospital</strong> <strong>of</strong> New York-Presbyterian 18.0<br />
5 Texas Children's <strong>Hospital</strong>, Houston 13.9<br />
6 Rainbow Babies & Children's <strong>Hospital</strong>, Cleveland 13.9<br />
7 Children's <strong>Hospital</strong> <strong>of</strong> Pittsburgh 12.9<br />
8 Children's <strong>Hospital</strong> Medical Center, Cincinnati 12.9<br />
9 Children's <strong>Hospital</strong>, Denver 11.3<br />
10 University <strong>of</strong> California, San Francisco Medical Center 10.5<br />
11 Children's Memorial <strong>Hospital</strong>, Chicago 9.8<br />
12 Childrens <strong>Hospital</strong> Los Angeles 9.6<br />
13 Mattel Children's <strong>Hospital</strong> at UCLA, Los Angeles 8.8<br />
14 Children's National Medical Center, Washington, D.C. 8.6<br />
15 Children's <strong>Hospital</strong> and Medical Center, Seattle 7.8<br />
16 Massachusetts General <strong>Hospital</strong>, Boston 7.6<br />
17 Mayo Clinic, Rochester, Minn. 7.5<br />
18 Lucile Packard Children's <strong>Hospital</strong> at Stanford, Palo Alto, Calif. 7.4<br />
19 Duke University Medical Center, Durham, N.C. 5.9<br />
20 St. Jude Children's Research <strong>Hospital</strong>, Memphis 5.1<br />
21 St. Louis Children's <strong>Hospital</strong> 4.4<br />
22 St. Christopher's <strong>Hospital</strong> for Children, Philadelphia 4.1<br />
23 Barnes-Jewish <strong>Hospital</strong>, St. Louis 3.9<br />
24 Miami Children's <strong>Hospital</strong> 3.5<br />
25 NYU Medical Center, New York 3.3<br />
26 Yale-New Haven <strong>Hospital</strong>, New Haven, Conn. 3.2<br />
27 Strong Memorial <strong>Hospital</strong>-University <strong>of</strong> Rochester, N.Y. 3.0<br />
28 Cleveland Clinic 3.0
<strong>2003</strong> Psychiatry Reputational Score<br />
Reputational<br />
Rank <strong>Hospital</strong> Score<br />
1 Massachusetts General <strong>Hospital</strong>, Boston 51.4<br />
2 New York-Presbyterian <strong>Hospital</strong> 40.5<br />
3 Johns Hopkins <strong>Hospital</strong>, Baltimore 34.8<br />
4 McLean <strong>Hospital</strong>, Belmont, Mass. 26.4 (+3 SD)<br />
5 <strong>The</strong> Menninger Clinic, Houston 23.5<br />
6 UCLA Neuropsychiatric <strong>Hospital</strong>, Los Angeles 22.6 (+2 SD)<br />
7 Yale-New Haven <strong>Hospital</strong>, New Haven, Conn. 15.5<br />
8 Mayo Clinic, Rochester, Minn. 14.3<br />
9 Stanford <strong>Hospital</strong> and Clinics, Stanford, Calif. 12.5<br />
10 Duke University Medical Center, Durham, N.C. 12.3<br />
11 Sheppard and Enoch Pratt <strong>Hospital</strong>, Baltimore 11.5<br />
12 University <strong>of</strong> Pittsburgh Medical Center 9.0<br />
13 Austen Riggs Center, Stockbridge, Mass. 7.6<br />
14 University <strong>of</strong> Iowa <strong>Hospital</strong>s and Clinics, Iowa City 7.2<br />
15 Barnes-Jewish <strong>Hospital</strong>, St. Louis 6.9<br />
16 University <strong>of</strong> California, San Francisco Medical Center 6.8<br />
17 Emory University <strong>Hospital</strong>, Atlanta 6.8<br />
18 NYU Medical Center, New York 6.3<br />
19 <strong>Hospital</strong> <strong>of</strong> the University <strong>of</strong> Pennsylvania, Philadelphia 5.9<br />
20 University <strong>of</strong> Michigan Medical Center, Ann Arbor 5.8<br />
21 Methodist <strong>Hospital</strong>, Houston 4.3<br />
22 Cleveland Clinic 4.0<br />
23 Montefiore Medical Center, Bronx, N.Y. 3.9<br />
24 Parkland Memorial <strong>Hospital</strong>, Dallas 3.9<br />
25 Medical University <strong>of</strong> South Carolina, Charleston 3.8<br />
26 Butler <strong>Hospital</strong>, Providence, R.I. 3.5<br />
27 University <strong>of</strong> Washington Medical Center, Seattle 3.5<br />
28 Ohio State University Medical Center, Columbus 3.3<br />
29 Mount Sinai Medical Center, New York 3.0<br />
30 University <strong>of</strong> Maryland Medical System, Baltimore 3.0
<strong>2003</strong> Rehabilitation Reputational Score<br />
Reputational<br />
Rank <strong>Hospital</strong> Score<br />
1 Rehabilitation Institute <strong>of</strong> Chicago 72.2<br />
2 TIRR-<strong>The</strong> Institute for Rehabilitation and Research, Houston 42.3<br />
3 University <strong>of</strong> Washington Medical Center, Seattle 37.7<br />
4 Mayo Clinic, Rochester, Minn. 30.7 (+3 SD)<br />
5 Craig <strong>Hospital</strong>, Englewood, Colo. 26.7<br />
6 Kessler Institute for Rehabilitation, West Orange, N.J. 26.1 (+2 SD)<br />
7 Rusk Institute, NYU Medical Center, New York 15.1<br />
8 Thomas Jefferson University <strong>Hospital</strong>, Philadelphia 15.0<br />
9 Spaulding Rehabilitation <strong>Hospital</strong>, Boston 14.7<br />
10 Ohio State University Medical Center, Columbus 14.2<br />
11 Rancho Los Amigos National Rehabilitation Center, Downey, Calif. 13.5<br />
12 Johns Hopkins <strong>Hospital</strong>, Baltimore 12.7<br />
13 National Rehabilitation <strong>Hospital</strong>, Washington, D.C. 11.2<br />
14 University <strong>of</strong> Michigan Medical Center, Ann Arbor 9.5<br />
15 Moss Rehabilitation <strong>Hospital</strong>, Albert Einstein Medical Center, Philadelphia 8.1<br />
16 Shepherd Center, Atlanta 6.6<br />
17 Mount Sinai Medical Center, New York 5.3<br />
18 Stanford <strong>Hospital</strong> and Clinics, Stanford, Calif. 4.4<br />
19 Temple University <strong>Hospital</strong>, Philadelphia 4.0<br />
20 UCLA Medical Center, Los Angeles 3.8<br />
21 New York-Presbyterian <strong>Hospital</strong> 3.8<br />
22 Cleveland Clinic 3.7<br />
23 University <strong>of</strong> Alabama <strong>Hospital</strong> at Birmingham 3.3
Appendix H<br />
<strong>The</strong> <strong>2003</strong> “Honor Roll”
<strong>The</strong> Honor Roll<br />
To lend additional perspective, we have constructed a measure called the Honor Roll to<br />
indicate excellence across a broad range <strong>of</strong> specialties.<br />
To be listed on the Honor Roll, a hospital must rank at least two standard deviations (SDs)<br />
above the mean in at least six <strong>of</strong> the 17 specialties. A hospital’s ranking in the Honor Roll<br />
is based on points, assigned as follows:<br />
C If a hospital ranks between two and three SDs above the mean in a<br />
specialty, it receives one point.<br />
C If a hospital ranks at least three SDs above the mean, it receives two points.<br />
Using standard deviations above the mean as the criteria for inclusion in the Honor Roll sets<br />
a threshold for overall excellence. <strong>The</strong> Honor Roll also gives an indication <strong>of</strong> the relative<br />
distances between the best hospitals which is not possible to determine solely from the<br />
rankings.
<strong>The</strong> <strong>2003</strong> Honor Roll<br />
Rank <strong>Hospital</strong> Points 3 SDs<br />
over<br />
the<br />
mean<br />
1 Johns Hopkins <strong>Hospital</strong>, Baltimore 32 16 0<br />
2 Mayo Clinic, Rochester, Minn. 28 14 0<br />
3 UCLA Medical Center, Los Angeles 24 10 4<br />
4 Massachusetts General <strong>Hospital</strong>, Boston 24 12 0<br />
5 Cleveland Clinic 23 11 1<br />
6 Duke University Medical Center, Durham, N.C. 22 9 4<br />
7 University <strong>of</strong> California, San Francisco Medical Center 21 9 3<br />
8 Barnes-Jewish <strong>Hospital</strong>, St. Louis 18 6 6<br />
9 University <strong>of</strong> Michigan Medical Center, Ann Arbor 16 5 6<br />
10 University <strong>of</strong> Washington Medical Center, Seattle 15 5 5<br />
11 New York-Presbyterian <strong>Hospital</strong> 15 6 3<br />
12 Brigham and Women’s <strong>Hospital</strong>, Boston 14 6 2<br />
13 <strong>Hospital</strong> <strong>of</strong> the University <strong>of</strong> Pennsylvania, Philadelphia 13 4 5<br />
14 University <strong>of</strong> Chicago <strong>Hospital</strong>s 10 3 4<br />
15 Stanford <strong>Hospital</strong> and Clinics, Stanford, Calif. 9 2 5<br />
15 University <strong>of</strong> Pittsburgh Medical Center 9 2 5<br />
17 Vanderbilt University Medical Center, Nashville 8 2 4<br />
2 SDs<br />
over<br />
the<br />
mean
Contact Information<br />
This document can be viewed or downloaded online in its entirety and is available at the<br />
NORC website at the following address: http://norc.uchicago.edu<br />
Specific questions or comments about the contents <strong>of</strong> this report can be sent via e-mail to<br />
Best<strong>Hospital</strong>s@norcmail.uchicago.edu