Making Sense of Big Data - Cloudera Blog
Making Sense of Big Data - Cloudera Blog
Making Sense of Big Data - Cloudera Blog

Create successful ePaper yourself
Turn your PDF publications into a flip-book with our unique Google optimized e-Paper software.
Technologyforecast<br />
<strong>Making</strong> sense<br />
<strong>of</strong> <strong>Big</strong> <strong>Data</strong><br />
A quarterly journal<br />
2010, Issue 3<br />
In this issue<br />
04<br />
Tapping into the<br />
power <strong>of</strong> <strong>Big</strong> <strong>Data</strong><br />
22<br />
Building a bridge<br />
to the rest <strong>of</strong> your data<br />
36<br />
Revising the CIO’s<br />
data playbook
Contents<br />
Features<br />
04 Tapping into the power <strong>of</strong> <strong>Big</strong> <strong>Data</strong><br />
Treating it differently from your core enterprise data is essential.<br />
22 Building a bridge to the rest <strong>of</strong> your data<br />
How companies are using open-source cluster-computing<br />
techniques to analyze their data.<br />
36 Revising the CIO’s data playbook<br />
Start by adopting a fresh mind-set, grooming the right talent,<br />
and piloting new tools to ride a the next wave <strong>of</strong> innovation.
Interviews<br />
14 The data scalability challenge<br />
John Parkinson <strong>of</strong> TransUnion describes the data handling issues<br />
more companies will face in three to five years.<br />
18 Creating a cost-effective <strong>Big</strong> <strong>Data</strong> strategy<br />
Disney’s Bud Albers, Scott Thompson, and Matt Estes outline an<br />
agile approach that leverages open-source and cloud technologies.<br />
34 Hadoop’s foray into the enterprise<br />
<strong>Cloudera</strong>’s Amr Awadallah discusses how and why diverse<br />
companies are trying this novel approach.<br />
48 New approaches to customer data analysis<br />
Razorfish’s Mark Taylor and Ray Velez discuss how new techniques<br />
enable them to better analyze petabytes <strong>of</strong> Web data.<br />
Departments<br />
02 Message from the editor<br />
50 Acknowledgments<br />
54 Subtext
Message from<br />
the editor<br />
Bill James has loved baseball statistics ever since he was a kid in Mayetta,<br />
Kansas, cutting baseball cards out <strong>of</strong> the backs <strong>of</strong> cereal boxes in the early<br />
1960s. James, who compiled The Bill James Baseball Abstract for years, is<br />
a renowned “sabermetrician” (a term he coined himself). He now is a senior<br />
advisor on baseball operations for the Boston Red Sox, and he previously<br />
worked in a similar capacity for other Major League Baseball teams.<br />
James has done more to change the world <strong>of</strong> baseball statistics than<br />
anyone in recent memory. As broadcaster Bob Costas says, James<br />
“doesn’t just understand information. He has shown people a different<br />
way <strong>of</strong> interpreting that information.” Before Bill James, Major League<br />
Baseball teams all relied on long-held assumptions about how games are<br />
won. They assumed batting average, for example, had more importance<br />
than it actually does.<br />
James challenged these assumptions. He asked critical questions that<br />
didn’t have good answers at the time, and he did the research and analysis<br />
necessary to find better answers. For instance, how many days’ rest does<br />
a reliever need? James’s answer is that some relievers can pitch well for<br />
two or more consecutive days, while others do better with a day or two <strong>of</strong><br />
rest in between. It depends on the individual. Why can’t a closer work more<br />
than just the ninth inning? A closer is frequently the best reliever on the<br />
team. James observes that managers <strong>of</strong>ten don’t use the best relievers<br />
to their maximum potential.<br />
The lesson learned from the Bill James example is that the best statistics<br />
come from striving to ask the best questions and trying to get answers to<br />
those questions. But what are the best questions? James takes an iterative<br />
approach, analyzing the data he has, or can gather, asking some questions<br />
based on that analysis, and then looking for the answers. He doesn’t stop<br />
with just one set <strong>of</strong> statistics. The first set suggests some questions, to<br />
which a second set suggests some answers, which then give rise to yet<br />
another set <strong>of</strong> questions. It’s a continual process <strong>of</strong> investigation, one that’s<br />
focused on surfacing the best questions rather than assuming those<br />
questions have already been asked.<br />
Enterprises can take advantage <strong>of</strong> a similarly iterative, investigative<br />
approach to data. Enterprises are being overwhelmed with data; many<br />
enterprises each generate petabytes <strong>of</strong> information they aren’t making best<br />
use <strong>of</strong>. And not all <strong>of</strong> the data is the same. Some <strong>of</strong> it has value, and some,<br />
not so much.<br />
The problem with this data has been tw<strong>of</strong>old: (1) it’s difficult to analyze,<br />
and (2) processing it using conventional systems takes too long and is<br />
too expensive.<br />
02 PricewaterhouseCoopers Technology Forecast
Addressing these problems effectively doesn’t require<br />
radically new technology. Better architectural design<br />
choices and s<strong>of</strong>tware that allows a different approach<br />
to the problems are enough. Search engine companies<br />
such as Google and Yahoo provide a pragmatic way<br />
forward in this respect. They’ve demonstrated that<br />
efficient, cost-effective, system-level design can lead<br />
to an architecture that allows any company to treat<br />
different data differently.<br />
Enterprises shouldn’t treat voluminous, mostly<br />
unstructured information (for example, Web server<br />
log files) the same way they treat the data in core<br />
transactional systems. Instead, they can use commodity<br />
computer clusters, open-source s<strong>of</strong>tware, and Tier 3<br />
storage, and they can process in an exploratory way<br />
the less-structured kinds <strong>of</strong> data they’re generating.<br />
With this approach, they can do what Bill James does<br />
and find better questions to ask.<br />
In this issue <strong>of</strong> the Technology Forecast, we review the<br />
techniques behind low-cost distributed computing that<br />
have led companies to explore more <strong>of</strong> their data in new<br />
ways. In the article, “Tapping into the power <strong>of</strong> <strong>Big</strong><br />
<strong>Data</strong>,” on page 04, we begin with a consideration <strong>of</strong><br />
exploratory analytics—methods that are separate from<br />
traditional business intelligence (BI). These techniques<br />
make it feasible to look for more haystacks, rather than<br />
just the needle in one haystack.<br />
The article, “Building a bridge to the rest <strong>of</strong> your data,”<br />
on page 22 highlights the growing interest in and<br />
adoption <strong>of</strong> Hadoop clusters. Hadoop provides highvolume,<br />
low-cost computing with the help <strong>of</strong> opensource<br />
s<strong>of</strong>tware and hundreds or thousands <strong>of</strong><br />
commodity servers. It also <strong>of</strong>fers a simplified approach<br />
to processing more complex data in parallel. The<br />
methods, cost advantages, and scalability <strong>of</strong> Hadoopstyle<br />
cluster computing clear a path for enterprises to<br />
analyze lots <strong>of</strong> data they didn’t have the means to<br />
analyze before, as well as enable innovative ways to<br />
analyze it.<br />
The buzz around <strong>Big</strong> <strong>Data</strong> and “cloud storage” (a term<br />
some vendors use to describe less-expensive cluster-<br />
computing techniques) is considerable, but the article,<br />
“Revising the CIO’s data playbook,” on page 36<br />
emphasizes that CIOs have time to pick and choose the<br />
most suitable approach. The most promising<br />
opportunity is in the area <strong>of</strong> “gray data,” or data that<br />
comes from a variety <strong>of</strong> sources. This data is <strong>of</strong>ten raw<br />
and unvalidated, arrives in huge quantities, and doesn’t<br />
yet have established value. Gray data analysis requires<br />
a different skill set—people who are more exploratory<br />
by nature.<br />
As always, in this issue we’ve included interviews with<br />
knowledgeable executives who have insights on the<br />
overall topic <strong>of</strong> interest:<br />
• John Parkinson <strong>of</strong> TransUnion describes the data<br />
challenges that more and more companies will face<br />
during the next three to five years.<br />
• Bud Albers, Scott Thompson, and Matt Estes <strong>of</strong> Disney<br />
outline an agile, open-source cloud data vision.<br />
• Amr Awadallah <strong>of</strong> <strong>Cloudera</strong> explores the reasons<br />
behind Apache Hadoop’s adoption at search engine,<br />
social media, and financial services companies.<br />
• Mark Taylor and Ray Velez <strong>of</strong> Razorfish contrast<br />
newer, more scalable techniques <strong>of</strong> studying<br />
customer data with the old methods.<br />
Please visit pwc.com/techforecast to find these articles<br />
and other issues <strong>of</strong> the Technology Forecast online.<br />
If you would like to receive future issues <strong>of</strong> the<br />
Technology Forecast as a PDF attachment, you<br />
can sign up at pwc.com/techforecast/subscribe.<br />
We welcome your feedback and your ideas for future<br />
research and analysis topics to cover.<br />
Tom DeGarmo<br />
Principal<br />
Technology Leader<br />
thomas.p.degarmo@us.pwc.com<br />
Message from the editor 03
Tapping into the<br />
power <strong>of</strong> <strong>Big</strong> <strong>Data</strong><br />
Treating it differently from your core enterprise data is essential.<br />
By Galen Gruman<br />
04 PricewaterhouseCoopers Technology Forecast
Like most corporations, the Walt Disney Co. is<br />
swimming in a rising sea <strong>of</strong> <strong>Big</strong> <strong>Data</strong>: information<br />
collected from business operations, customers,<br />
transactions, and the like; unstructured information<br />
created by social media and other Web repositories,<br />
including the Disney home page itself and sites for<br />
its theme parks, movies, books, and music; plus the<br />
sites <strong>of</strong> its many big business units, including ESPN<br />
and ABC.<br />
“In any given year, we probably generate more data<br />
than the Walt Disney Co. did in its first 80 years <strong>of</strong><br />
existence,” observes Bud Albers, executive vice<br />
president and CTO <strong>of</strong> the Disney Technology Shared<br />
Services Group. “The challenge becomes what do<br />
you do with it all?”<br />
Albers and his team are in the early stages <strong>of</strong><br />
answering their own question with an economical<br />
cluster-computing architecture based on a set <strong>of</strong><br />
cost-effective and scalable technologies anchored<br />
by Apache Hadoop, an open-source, Java-based<br />
distributed file system based on Google File System<br />
and developed by Apache S<strong>of</strong>tware Foundation.<br />
These still-emerging technologies allow Disney analysts<br />
to explore multiple terabytes <strong>of</strong> information without the<br />
lengthy time requirements or high cost <strong>of</strong> traditional<br />
business intelligence (BI) systems.<br />
This issue <strong>of</strong> the Technology Forecast examines how<br />
Apache Hadoop and these related technologies can<br />
derive business value from <strong>Big</strong> <strong>Data</strong> by supporting a<br />
new kind <strong>of</strong> exploratory analytics unlike traditional BI.<br />
These s<strong>of</strong>tware technologies and their hardware cluster<br />
platform make it feasible not only to look for the needle<br />
in the haystack, but also to look for new haystacks.<br />
This kind <strong>of</strong> analysis demands an attitude <strong>of</strong><br />
exploration—and the ability to generate value from<br />
data that hasn’t been scrubbed or fully modeled into<br />
relational tables.<br />
Using Disney and other examples, this first article<br />
introduces the idea <strong>of</strong> exploratory BI for <strong>Big</strong> <strong>Data</strong>.<br />
The second article examines Hadoop clusters and<br />
technologies that support them (page 22), and the<br />
third article looks at steps CIOs can take now to exploit<br />
the future benefits (page 36). We begin with a closer<br />
look at Disney’s still-nascent but illustrative effort.<br />
“In any given year, we probably<br />
generate more data than the<br />
Walt Disney Co. did in its first<br />
80 years <strong>of</strong> existence.”<br />
— Bud Albers <strong>of</strong> Disney<br />
Tapping into the power <strong>of</strong> <strong>Big</strong> <strong>Data</strong> 05
Bringing <strong>Big</strong> <strong>Data</strong> under control<br />
<strong>Big</strong> <strong>Data</strong> is not a precise term; rather, it is a<br />
characterization <strong>of</strong> the never-ending accumulation <strong>of</strong><br />
all kinds <strong>of</strong> data, most <strong>of</strong> it unstructured. It describes<br />
data sets that are growing exponentially and that are<br />
too large, too raw, or too unstructured for analysis<br />
using relational database techniques. Whether<br />
terabytes or petabytes, the precise amount is less the<br />
issue than where the data ends up and how it is used.<br />
Like everyone else, Disney’s <strong>Big</strong> <strong>Data</strong> is huge, more<br />
unstructured than structured, and growing much<br />
faster than transactional data.<br />
The Disney Technology Shared Services Group, which<br />
is responsible for Disney’s core Web and analysis<br />
technologies, recently began its <strong>Big</strong> <strong>Data</strong> efforts but<br />
already sees high potential. The group is testing the<br />
technology and working with analysts in Disney<br />
business units. Disney’s data comes from varied<br />
sources, but much <strong>of</strong> it is collected for departmental<br />
business purposes and not yet widely shared. Disney’s<br />
<strong>Big</strong> <strong>Data</strong> approach will allow it to look at diverse data<br />
sets for unplanned purposes and to uncover patterns<br />
across customer activities. For example, insights from<br />
Disney Store activities could be useful in call centers<br />
for theme park booking or to better understand the<br />
audience segments <strong>of</strong> one <strong>of</strong> its cable networks.<br />
The Technology Shared Services Group is even using<br />
<strong>Big</strong> <strong>Data</strong> approaches to explore its own IT questions<br />
to understand what data is being stored, how it is<br />
used, and thus what type <strong>of</strong> storage hardware and<br />
management the group needs.<br />
Albers assumes that <strong>Big</strong> <strong>Data</strong> analysis is destined to<br />
become essential. “The speed <strong>of</strong> business these days<br />
and the amount <strong>of</strong> data that we are now swimming in<br />
mean that we need to have new ways and new<br />
techniques <strong>of</strong> getting at the data, finding out what’s in<br />
there, and figuring out how we deal with it,” he says.<br />
The team stumbled upon an inexpensive way to<br />
improve the business while pursuing more IT costeffectiveness<br />
through the use <strong>of</strong> private-cloud<br />
technologies. (See the Technology Forecast, Summer<br />
2009, for more on the topic <strong>of</strong> cloud computing.) When<br />
Albers launched the effort to change the division’s cost<br />
curve so IT expenses would rise more slowly than the<br />
business usage <strong>of</strong> IT—the opposite had been true—he<br />
turned to an approach that many companies use to<br />
make data centers more efficient: virtualization.<br />
Virtualization <strong>of</strong>fers several benefits, including higher<br />
utilization <strong>of</strong> existing servers and the ability to move<br />
workloads to prevent resource bottlenecks. An<br />
organization can also move workloads to external cloud<br />
providers, using them as a backup resource when<br />
needed, an approach called cloud bursting. By using<br />
such approaches, the Disney Technology Shared<br />
Services Group lowered its IT expense growth rate from<br />
27 percent to –3 percent, while increasing its annual<br />
processing growth from 17 percent to 45 percent.<br />
While achieving this efficiency, the team realized that<br />
the ability to move resources and tap external ones<br />
could apply to more than just data center efficiency. At<br />
first, they explored using external clouds to analyze big<br />
sets <strong>of</strong> data, such as Web traffic to Disney’s many sites,<br />
and to handle big processing jobs more cost-effectively<br />
and more quickly than with internal systems.<br />
During that exploration, the team discovered Hadoop,<br />
MapReduce, and other open-source technologies that<br />
distribute data-analysis workloads across many<br />
computers, breaking the analysis into many parallel<br />
workloads that produce results faster. Faster results<br />
mean that more questions can be asked, and the low<br />
cost <strong>of</strong> the technologies means the team can afford<br />
to ask those questions.<br />
Disney assembled a Hadoop cluster and set up a<br />
central logging service to mine data that the<br />
organization hadn’t been able to before. It will begin<br />
to provide internal group access to the cluster in<br />
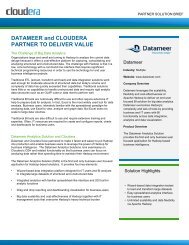
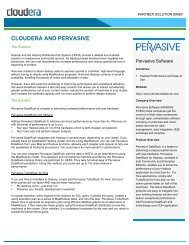
October 2010. Figure 1 shows how the Hadoop<br />
cluster will benefit internal groups, business partners,<br />
and customers.<br />
“The speed <strong>of</strong> business these days and the amount <strong>of</strong> data that we<br />
are now swimming in mean that we need to have new ways and new<br />
techniques <strong>of</strong> getting at the data, finding out what’s in there, and figuring<br />
out how we deal with it.” — Bud Albers <strong>of</strong> Disney<br />
06 PricewaterhouseCoopers Technology Forecast
Improved<br />
experience<br />
4<br />
Site<br />
visitors<br />
Internal<br />
business<br />
partners<br />
Affiliated<br />
businesses<br />
1<br />
Interface to cluster<br />
(MapReduce/Hive/Pig)<br />
Usage<br />
data<br />
Core IT and<br />
business unit<br />
systems<br />
2 Central 3<br />
logging<br />
service<br />
D-Cloud data cluster<br />
Hadoop<br />
Metadata<br />
repository<br />
Figure 1: Disney’s Hadoop cluster and central logging service<br />
Disney’s new D-Cloud data cluster can scale to handle (1) less-structured usage data through the establishment <strong>of</strong> (2) central logging<br />
service, (3) a cost-effective Hadoop data analysis engine, and a commodity computer cluster. The result is (4) a more responsive and<br />
personalized user experience.<br />
Source: Disney, 2010<br />
Tapping into the power <strong>of</strong> <strong>Big</strong> <strong>Data</strong> 07
Simply put, the low cost <strong>of</strong> a Hadoop cluster means<br />
freedom to experiment. Disney uses a couple <strong>of</strong> dozen<br />
servers that were scheduled to be retired, and the<br />
organization operates its cluster with a handful <strong>of</strong><br />
existing staff. Matt Estes, principal data architect<br />
for the Disney Technology Shared Services Group,<br />
estimates the cost <strong>of</strong> the project at $300,000<br />
to $500,000.<br />
“Before, I would have needed to figure on spending $3<br />
million to $5 million for such an initiative,” Albers says.<br />
“Now I can do this without charging to the bottom line.”<br />
Unlike the reusable canned queries in typical BI systems,<br />
<strong>Big</strong> <strong>Data</strong> analysis does require more effort to write the<br />
queries and the data-parsing code for what are <strong>of</strong>ten<br />
unique inquiries <strong>of</strong> data sources. But Albers notes that<br />
“the risk is lower due to all the other costs being lower.”<br />
Failure is inexpensive, so analysts are more willing to<br />
explore questions they would otherwise avoid.<br />
Even in this early stage, Albers is confident that the<br />
ability to ask more questions will lead to more insights<br />
that translate to both the bottom line and the top line.<br />
For example, Disney already is seeking to boost<br />
customer engagement and spending by making<br />
recommendations to customers based on pattern<br />
analysis <strong>of</strong> their online behavior.<br />
How <strong>Big</strong> <strong>Data</strong> analysis is different<br />
What should other enterprises anticipate from Hadoopstyle<br />
analytics? It is a type <strong>of</strong> exploratory BI they haven’t<br />
done much before. This is business intelligence that<br />
provides indications, not absolute conclusions. It requires<br />
a different mind-set, one that begins with exploration, the<br />
results <strong>of</strong> which create hypotheses, which are tested<br />
before moving on to validation and consolidation.<br />
These methods could be used to answer questions<br />
such as, “What indicators might there be that predate a<br />
surge in Web traffic?” or “What fabrics and colors are<br />
gaining popularity among influencers, and what<br />
sources might be able to provide the materials to us?”<br />
or “What’s the value <strong>of</strong> an influencer on Web traffic<br />
through his or her social network?” See the sidebar<br />
“Opportunities for <strong>Big</strong> <strong>Data</strong> insights” for more examples<br />
<strong>of</strong> the kinds <strong>of</strong> questions that can be asked <strong>of</strong> <strong>Big</strong> <strong>Data</strong>.<br />
Opportunities for <strong>Big</strong> <strong>Data</strong> insights<br />
Here are other examples <strong>of</strong> the kinds <strong>of</strong> insights<br />
that may be gleaned from analysis <strong>of</strong> <strong>Big</strong> <strong>Data</strong><br />
information flows:<br />
• Customer churn, based on analysis <strong>of</strong> call center,<br />
help desk, and Web site traffic patterns<br />
• Changes in corporate reputation and the potential<br />
for regulatory action, based on the monitoring <strong>of</strong><br />
social networks as well as Web news sites<br />
• Real-time demand forecasting, based on<br />
disparate inputs such as weather forecasts,<br />
travel reservations, automotive traffic, and<br />
retail point-<strong>of</strong>-sale data<br />
• Supply chain optimization, based on analysis <strong>of</strong><br />
weather patterns, potential disaster scenarios,<br />
and political turmoil<br />
Disney and others explore their data without a lot <strong>of</strong><br />
preconceptions. They know the results won’t be as<br />
specific as a pr<strong>of</strong>it-margin calculation or a drug-efficacy<br />
determination. But they still expect demonstrable value,<br />
and they expect to get it without a lot <strong>of</strong> extra expense.<br />
Typical BI uses data from transactional and other<br />
relational database management systems (RDBMSs)<br />
that an enterprise collects—such as sales and<br />
purchasing records, product development costs, and<br />
new employee hire records—diligently scrubs the data<br />
for accuracy and consistency, and then puts it into a<br />
form the BI system is programmed to run queries<br />
against. Such systems are vital for accurate analyses<br />
<strong>of</strong> transactional information, especially information<br />
subject to compliance requirements, but they don’t<br />
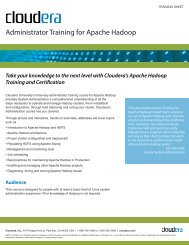
work well for messy questions, they’ve been too<br />
expensive for questions you’re not sure there’s any<br />
value in asking, and they haven’t been able to scale to<br />
analyze large data sets efficiently. (See Figure 2.)<br />
08 PricewaterhouseCoopers Technology Forecast
Large<br />
data sets<br />
Small<br />
data sets<br />
<strong>Big</strong> <strong>Data</strong> (via<br />
Hadoop/MapReduce)<br />
Little analytical value<br />
Non-relational data<br />
Figure 2: Where <strong>Big</strong> <strong>Data</strong> fits in<br />
Source: PricewaterhouseCoopers, 2010<br />
Less scalability<br />
Traditional BI<br />
Relational data<br />
Other companies have also tapped into the excitement<br />
brewing over <strong>Big</strong> <strong>Data</strong> technologies. Several Weboriented<br />
companies that have always dealt with huge<br />
amounts <strong>of</strong> data—such as Yahoo, Twitter, and<br />
Google—were early adopters. Now, more traditional<br />
companies—such as Disney and TransUnion, a credit<br />
rating service—are exploring <strong>Big</strong> <strong>Data</strong> concepts,<br />
having seen the cost and scalability benefits the Web<br />
companies have realized.<br />
Specifically, enterprises are also motivated by the<br />
inability to scale their existing approach for working<br />
on traditional analytics tasks, such as querying<br />
across terabytes <strong>of</strong> relational data. They are learning<br />
that the tools associated with Hadoop are uniquely<br />
positioned to explore data that has been sitting on<br />
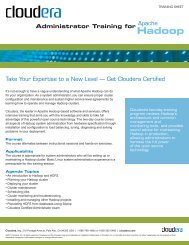
the side, unanalyzed. Figure 3 illustrates how the data<br />
architecture landscape appears in 2010. Enterprises<br />
with high processing power requirements and<br />
centralized architectures are facing scaling issues.<br />
In contrast, <strong>Big</strong> <strong>Data</strong> techniques allow you to sift through<br />
data to look for patterns at a much lower cost and in<br />
much less time than traditional BI systems. Should the<br />
data end up being so valuable that it requires the<br />
ongoing, compliance-oriented analysis <strong>of</strong> regular BI<br />
systems, only then do you make that investment.<br />
<strong>Big</strong> <strong>Data</strong> approaches let you ask more questions <strong>of</strong><br />
more information, opening a wide range <strong>of</strong> potential<br />
insights you couldn’t afford to consider in the past.<br />
“Part <strong>of</strong> the analytics role is to challenge assumptions,”<br />
Estes says. BI systems aren’t designed to do that;<br />
instead, they’re designed to dig deeper into known<br />
questions and look for variations that may indicate<br />
deviations from expected outcomes.<br />
Furthermore, <strong>Big</strong> <strong>Data</strong> analysis is usually iterative: you<br />
ask one question or examine one data set, then think <strong>of</strong><br />
more questions or decide to look at more data. That’s<br />
different from the “single source <strong>of</strong> truth” approach to<br />
standard BI and data warehousing. The Disney team<br />
started with making sure they could expose and<br />
access the data, then moved to iterative refinement in<br />
working with the data. “We aggressively got in to find<br />
the direction and the base. Then we began to iterate<br />
rather than try to do a <strong>Big</strong> Bang,” Albers says.<br />
High<br />
processing<br />
power<br />
Low<br />
processing<br />
power<br />
Enterprises facing<br />
scaling and<br />
capacity/cost<br />
problems<br />
Most enterprises<br />
Centralized<br />
compute<br />
architecture<br />
Google, Amazon,<br />
Facebook, Twitter,<br />
etc. (all use nonrelational<br />
data stores<br />
for reasons <strong>of</strong> scale)<br />
Cloud users with<br />
low compute<br />
requirements<br />
Distributed<br />
compute<br />
architecture<br />
Figure 3: The data architecture landscape in 2010<br />
Source: PricewaterhouseCoopers, 2010<br />
Wolfram Research and IBM have begun to extend<br />
their analytics applications to run on such large-scale<br />
data pools, and startups are presenting approaches<br />
they promise will allow data exploration in ways that<br />
technologies couldn’t have enabled in the past,<br />
including support for tools that let knowledge workers<br />
examine traditional databases using <strong>Big</strong> <strong>Data</strong>–style<br />
exploratory tools.<br />
Tapping into the power <strong>of</strong> <strong>Big</strong> <strong>Data</strong> 09
The ways different enterprises approach <strong>Big</strong> <strong>Data</strong><br />
It should come as no surprise that organizations<br />
dealing with lots <strong>of</strong> data are already investigating <strong>Big</strong><br />
<strong>Data</strong> technologies, or that they have mixed opinions<br />
about these tools.<br />
“At TransUnion, we spend a lot <strong>of</strong> our time trawling<br />
through tens or hundreds <strong>of</strong> billions <strong>of</strong> rows <strong>of</strong> data,<br />
looking for things that match a pattern approximately,”<br />
says John Parkinson, TransUnion’s acting CTO. “We<br />
want to do accurate but approximate matching and<br />
categorization in very large low-structure data sets.”<br />
Parkinson has explored <strong>Big</strong> <strong>Data</strong> technologies such<br />
as MapReduce that appear to have a more efficient<br />
filtering model than some <strong>of</strong> the pattern-matching<br />
algorithms TransUnion has tried in the past. “It also, at<br />
least in its theoretical formulation, is very amenable to<br />
highly parallelized execution,” which lets the users tap<br />
into farms <strong>of</strong> commodity hardware for fast, inexpensive<br />
processing, he notes.<br />
However, Parkinson thinks Hadoop and MapReduce<br />
are too immature. “MapReduce really hasn’t evolved<br />
yet to the point where your average enterprise<br />
technologist can easily make productive use <strong>of</strong> it. As<br />
for Hadoop, they have done a good job, but it’s like a<br />
lot <strong>of</strong> open-source s<strong>of</strong>tware—80 percent done. There<br />
were limits in the code that broke the stack well before<br />
what we thought was a good theoretical limit.”<br />
Parkinson echoes many IT executives who are<br />
skeptical <strong>of</strong> open-source s<strong>of</strong>tware in general. “If I have<br />
a bunch <strong>of</strong> engineers, I don’t want them spending their<br />
day being the technology support environment for what<br />
should be a product in our architecture,” he says.<br />
That’s a legitimate point <strong>of</strong> view, especially considering<br />
the data volumes TransUnion manages—8 petabytes<br />
from 83,000 sources in 4,000 formats and growing—<br />
and its focus on mission-critical capabilities for this<br />
data. Credit scoring must run successfully and deliver<br />
top-notch credit scores several times a day. It’s an<br />
operational system that many depend on for critical<br />
business decisions that happen millions <strong>of</strong> times a<br />
day. (For more on TransUnion, see the interview with<br />
Parkinson on page 14.)<br />
Disney’s system is purely intended for exploratory<br />
efforts or at most for reporting that eventually may feed<br />
up to product strategy or Web site design decisions. If<br />
it breaks or needs a little retooling, there’s no crisis.<br />
But Albers disagrees about the readiness <strong>of</strong> the tools,<br />
noting that the Disney Technology Shared Services<br />
Group also handles quite a bit <strong>of</strong> data. He figures<br />
Hadoop and MapReduce aren’t any worse than a lot <strong>of</strong><br />
proprietary s<strong>of</strong>tware. “I fully expect we will run on things<br />
that break,” he says, adding facetiously, “Not that any<br />
commercial product I’ve ever had has ever broken.”<br />
<strong>Data</strong> architect Estes also sees responsiveness in<br />
open-source development that’s laudable. “In our<br />
testing, we uncovered stuff, and you get somebody<br />
on the other end. This is their baby, right? I mean,<br />
they want it fixed.”<br />
Albers emphasizes the total cost-effectiveness <strong>of</strong><br />
Hadoop and MapReduce. “My s<strong>of</strong>tware cost is zero.<br />
You still have the implementation, but that’s a constant<br />
at some level, no matter what. Now you probably need<br />
to have a little higher skill level at this stage <strong>of</strong> the<br />
game, so you’re probably paying a little more, but<br />
certainly, you’re not going out and approving a Teradata<br />
cluster. You’re talking about Tier 3 storage. You’re<br />
talking about a very low level <strong>of</strong> cost for the storage.”<br />
Albers’ points are also valid. PricewaterhouseCoopers<br />
predicts these open-source tools will be solid sooner<br />
rather than later, and are already worthy <strong>of</strong> use in<br />
non-mission-critical environments and applications.<br />
Hence, in the CIO article on page 36, we argue in favor<br />
<strong>of</strong> taking cautious but exploratory steps.<br />
Asking new business questions<br />
Saving money is certainly a big reward, but<br />
PricewaterhouseCoopers contends the biggest<br />
pay<strong>of</strong>f from Hadoop-style analysis <strong>of</strong> <strong>Big</strong> <strong>Data</strong> is the<br />
potential to improve organizations’ top line. “There’s<br />
a lot <strong>of</strong> potential value in the unstructured data in<br />
organizations, and people are starting to look at it<br />
more seriously,” says Tom Urquhart, chief architect<br />
at PricewaterhouseCoopers. Think <strong>of</strong> it as a “Google<br />
in a box, which allows you to do intelligent search<br />
regardless <strong>of</strong> whether the underlying content is<br />
structured or unstructured,” he says.<br />
10 PricewaterhouseCoopers Technology Forecast
The Google-style techniques in Hadoop, MapReduce,<br />
and related technologies work in a fundamentally<br />
different way from traditional BI systems, which use<br />
strictly formatted data cubes pulling information from<br />
data warehouses. <strong>Big</strong> <strong>Data</strong> tools let you work with data<br />
that hasn’t been formally modeled by data architects,<br />
so you can analyze and compare data <strong>of</strong> different types<br />
and <strong>of</strong> different levels <strong>of</strong> rigor. Because these tools<br />
typically don’t discard or change the source data<br />
before the analysis begins, the original context remains<br />
available for drill-down by analysts.<br />
These tools provide technology assistance to a very<br />
human form <strong>of</strong> analysis: looking at the world as it is<br />
and finding patterns <strong>of</strong> similarity and difference, then<br />
going deeper into the areas <strong>of</strong> interest judged valuable.<br />
In contrast, BI systems know what questions should be<br />
asked and what answers to expect; their goal is to look<br />
for deviations from the norm or changes in standard<br />
patterns deemed important to track (such as changes<br />
in baseline quality or in sales rates in specific<br />
geographies). Such an approach, absent an exploratory<br />
phase, results in a lot <strong>of</strong> information loss during data<br />
consolidation. (See Figure 4.)<br />
Pattern analysis mashup services<br />
There’s another use <strong>of</strong> <strong>Big</strong> <strong>Data</strong> that combines<br />
efficiency and exploratory benefits: on-the-fly pattern<br />
analysis from disparate sources to return real-time<br />
results. Amazon.com pioneered <strong>Big</strong> <strong>Data</strong>–based<br />
product recommendations by analyzing customer data,<br />
including purchase histories, product ratings, and<br />
comments. Albers is looking for similar value that<br />
would come from making live recommendations to<br />
customers when they go to a Disney site, store, or<br />
reservations phone line—based on their previous online<br />
and <strong>of</strong>fline behavior with Disney.<br />
O’Reilly Media, a publisher best known for technical<br />
books and Web sites, is working with the White House<br />
to develop mashup applications that look at data from<br />
various sources to identify patterns that might help<br />
lobbyists and policymakers. For example, by mashing<br />
together US Census data and labor statistics, they can<br />
see which counties have the most international and<br />
domestic immigration, then correlate those attributes<br />
with government spending changes, says Roger<br />
Magoulas, O’Reilly’s research director.<br />
Pre-consolidated data (never collected)<br />
Exploration<br />
Information<br />
loss<br />
Consolidation<br />
All collected data<br />
Summary<br />
departmental<br />
data<br />
Summary<br />
enterprise<br />
data<br />
Information<br />
loss<br />
Information<br />
loss<br />
Consolidation<br />
All collected data<br />
Summary<br />
departmental<br />
data<br />
Summary<br />
enterprise<br />
data<br />
Less information loss<br />
Insight<br />
Greater insight<br />
Figure 4: Information loss in the data consolidation process<br />
Source: PricewaterhouseCoopers, 2010<br />
Tapping into the power <strong>of</strong> <strong>Big</strong> <strong>Data</strong> 11
Mashups like this can also result in customer-facing<br />
services. FlightCaster for iPhone and BlackBerry uses<br />
<strong>Big</strong> <strong>Data</strong> approaches to analyze flight-delay records<br />
and current conditions to issue flight-delay predictions<br />
to travelers.<br />
Exploiting the power <strong>of</strong> human analysis<br />
<strong>Big</strong> <strong>Data</strong> approaches can lower processing and storage<br />
costs, but we believe its main value is to perform the<br />
analysis that BI systems weren’t designed for, acting as<br />
an enabler and an amplifier <strong>of</strong> human analysis.<br />
Ad hoc exploration at a bargain<br />
<strong>Big</strong> <strong>Data</strong> lets you inexpensively explore questions<br />
and peruse data for patterns that may indicate<br />
opportunities or issues. In this arena, failure is cheap,<br />
so analysts are more willing to explore questions they<br />
would otherwise avoid. And that should lead to insights<br />
that help the business operate better.<br />
Medical data is an example <strong>of</strong> the potential for ad hoc<br />
analysis. “A number <strong>of</strong> such discoveries are made on<br />
the weekends when the people looking at the data are<br />
doing it from the point <strong>of</strong> view <strong>of</strong> just playing around,”<br />
says Doug Lenat, founder and CEO <strong>of</strong> Cycorp and a<br />
former pr<strong>of</strong>essor at Stanford and Carnegie Mellon<br />
universities.<br />
Right now the technical knowledge required to use<br />
these tools is nontrivial. Imagine the value <strong>of</strong> extending<br />
the exploratory capability more broadly. Cycorp is one<br />
<strong>of</strong> many startups trying to make <strong>Big</strong> <strong>Data</strong> analytic<br />
capabilities usable by more knowledge workers so<br />
they can perform such exploration.<br />
Analyzing data that wasn’t designed for BI<br />
<strong>Big</strong> <strong>Data</strong> also lets you work with “gray data,” or data<br />
from multiple sources that isn’t formatted or vetted for<br />
your specific needs, and that varies significantly in its<br />
level <strong>of</strong> detail and accuracy—and thus cannot be<br />
examined by BI systems.<br />
One analogy is Wikipedia. Everyone knows its<br />
information is not rigorously managed or necessarily<br />
accurate; nonetheless, Wikipedia is a good first place<br />
to look for indicators <strong>of</strong> what may be true and useful.<br />
From there, you do further research using a mix <strong>of</strong><br />
information resources whose accuracy and<br />
completeness may be more established.<br />
People use their knowledge and experience to<br />
appropriately weigh and correlate what they find across<br />
gray data to come up with improved strategies to aid<br />
the business. Figure 5 compares gray data and more<br />
normalized black data.<br />
Gray data<br />
Raw<br />
<strong>Data</strong> and context co-mingled<br />
Noisy<br />
Hypothetical<br />
e.g., Wikipedia<br />
Unchecked<br />
Indicative<br />
Less trustworthy<br />
Managed by business unit<br />
Figure 5: Gray versus black data<br />
Source: PricewaterhouseCoopers, 2010<br />
Black data<br />
Classified<br />
Provenanced<br />
Cleaned<br />
Actual<br />
e.g., Financial system data<br />
Reviewed<br />
Confirming<br />
More trustworthy<br />
Managed by IT<br />
Web analytics and financial risk analysis are two<br />
examples <strong>of</strong> how <strong>Big</strong> <strong>Data</strong> approaches augment human<br />
analysts. These techniques comb huge data sets <strong>of</strong><br />
information collected for specific purposes (such as<br />
monitoring individual financial records), looking for<br />
patterns that might identify good prospects for loans<br />
and flag problem borrowers. Increasingly, they comb<br />
external data not collected by a credit reporting<br />
agency—for example, trends in a neighborhood’s<br />
housing values or in local merchants’ sales patterns—<br />
to provide insights into where sales opportunities could<br />
be found or where higher concentrations <strong>of</strong> problem<br />
customers are located.<br />
The same approaches can help identify shifts in<br />
consumer tastes, such as for apparel and furniture.<br />
And, by analyzing gray data related to costs <strong>of</strong><br />
resources and changes in transportation schedules,<br />
these approaches can help anticipate stresses on<br />
suppliers and help identify where additional suppliers<br />
might be found.<br />
All <strong>of</strong> these activities require human intelligence,<br />
experience, and insight to make sense <strong>of</strong> the data,<br />
figure out the questions to ask, decide what<br />
information should be correlated, and generally<br />
conduct the analysis.<br />
12 PricewaterhouseCoopers Technology Forecast
Why the time is ripe for <strong>Big</strong> <strong>Data</strong><br />
The human analysis previously described is old hat<br />
for many business analysts, whether they work in<br />
manufacturing, fashion, finance, or real estate. What’s<br />
changing is scale. As noted, many types <strong>of</strong> information<br />
are now available that never existed or were not<br />
accessible. What could once only be suggested<br />
through surveys, focus groups, and the like can now<br />
be examined directly, because more <strong>of</strong> the granular<br />
thinking and behaviors are captured. Businesses have<br />
the potential to discover more through larger samples<br />
and more granular details, without relying on people<br />
to recall behaviors and motivations accurately.<br />
This potential can be realized only if you pull together<br />
and analyze all that data. Right now, there’s simply<br />
too much information for individual analysts to<br />
manage, increasing the chances <strong>of</strong> missing potential<br />
opportunities or risks. Businesses that augment their<br />
human experts with <strong>Big</strong> <strong>Data</strong> technologies could have<br />
significant competitive advantages by heading <strong>of</strong>f<br />
problems sooner, identifying opportunities earlier,<br />
and performing mass customization at a larger scale.<br />
Fortunately, the emerging <strong>Big</strong> <strong>Data</strong> tools should let<br />
businesspeople apply individual judgments to vaster<br />
pools <strong>of</strong> information, enabling low-cost, ad hoc<br />
analysis never before feasible. Plus, as patterns<br />
are discovered, the detection <strong>of</strong> some can be<br />
automated, letting the human analysts concentrate<br />
on the art <strong>of</strong> analysis and interpretation that algorithms<br />
can’t accomplish.<br />
Even better, emerging <strong>Big</strong> <strong>Data</strong> technologies promise<br />
to extend the reach <strong>of</strong> analysis beyond the cadre <strong>of</strong><br />
researchers and business analysts. Several startups<br />
<strong>of</strong>fer new tools that use familiar data-analysis tools—<br />
similar to those for SQL databases and Excel<br />
spreadsheets—to explore <strong>Big</strong> <strong>Data</strong> sources, thus<br />
broadening the ability to explore to a wider set <strong>of</strong><br />
knowledge workers.<br />
Finally, <strong>Big</strong> <strong>Data</strong> approaches can be used to power<br />
analytics-based services that improve the business<br />
itself, such as in-context recommendations to<br />
customers, more accurate predictions <strong>of</strong> service<br />
delivery, and more accurate failure predictions<br />
(such as for the manufacturing, energy, medical,<br />
and chemical industries).<br />
Conclusion<br />
PricewaterhouseCoopers believes that <strong>Big</strong> <strong>Data</strong><br />
approaches will become a key value creator for<br />
businesses, letting them tap into the wild, woolly<br />
world <strong>of</strong> information heret<strong>of</strong>ore out <strong>of</strong> reach. These<br />
new data management and storage technologies can<br />
also provide economies <strong>of</strong> scale in more traditional<br />
data analysis. Don’t limit yourself to the efficiencies<br />
<strong>of</strong> <strong>Big</strong> <strong>Data</strong> and miss out on the potential for gaining<br />
insights through its advantages in handling the gray<br />
data prevalent today.<br />
The <strong>Big</strong> <strong>Data</strong> analysis supplements, not replaces, the<br />
BI systems, data warehouses, and database systems<br />
essential to financial reporting, sales management,<br />
production management, and compliance systems.<br />
The difference is that these information systems deal<br />
with the knowns that must meet high standards for<br />
rigor, accuracy, and compliance—while the emerging<br />
<strong>Big</strong> <strong>Data</strong> analytics tools help you deal with the<br />
unknowns that could affect business strategy<br />
or its execution.<br />
As the amount and interconnectedness <strong>of</strong> data vastly<br />
increases, the value <strong>of</strong> the <strong>Big</strong> <strong>Data</strong> approach will only<br />
grow. If the amount and variety <strong>of</strong> today’s information is<br />
daunting, think what the world will be like in 5 or 10<br />
years. People will become mobile sensors—collecting,<br />
creating, and transmitting all sorts <strong>of</strong> information, from<br />
locations to body status to environmental information.<br />
We already see this happening as smartphones<br />
equipped with cameras, microphones, geolocation,<br />
and compasses proliferate. Wearable medical sensors,<br />
small temperature tags for use on packages, and other<br />
radio-equipped sensors are a reality. They’ll be the<br />
Twitter and Facebook feeds <strong>of</strong> tomorrow, adding vast<br />
quantities <strong>of</strong> new information that could provide<br />
context on behavior and environment never before<br />
possible—and a lot <strong>of</strong> “noise” certain to mask<br />
what’s important.<br />
Insight-oriented analytics in this sea <strong>of</strong> information—<br />
where interactions cause untold ripples and eddies in<br />
the flow and delivery <strong>of</strong> business value—will become<br />
a critical competitive requirement. <strong>Big</strong> <strong>Data</strong> technology<br />
is the likeliest path to gaining such insights.<br />
Tapping into the power <strong>of</strong> <strong>Big</strong> <strong>Data</strong> 13
The data scalability<br />
challenge<br />
John Parkinson <strong>of</strong> TransUnion describes the<br />
data handling issues more companies will face<br />
in three to five years.<br />
Interview conducted by Vinod Baya and Alan Morrison<br />
John Parkinson is the acting CTO <strong>of</strong> TransUnion, the chairman and owner <strong>of</strong> Parkwood<br />
Advisors, and a former CTO at Capgemini. In this interview, Parkinson outlines<br />
TransUnion’s considerable requirements for less-structured data analysis, shedding<br />
light on the many data-related technology challenges TransUnion faces today—challenges<br />
he says that more companies will face in the near future.<br />
PwC: In your role at TransUnion, you’ve<br />
evaluated many large-scale data processing<br />
technologies. What do you think <strong>of</strong> Hadoop<br />
and MapReduce?<br />
JP: MapReduce is a very computationally attractive<br />
answer for a certain class <strong>of</strong> problem. If you have that<br />
class <strong>of</strong> problem, then MapReduce is something you<br />
should look at. The challenge today, however, is that the<br />
number <strong>of</strong> people who really get the formalism behind<br />
MapReduce is a lot smaller than the group <strong>of</strong> people<br />
trying to understand what to do with it. It really hasn’t<br />
evolved yet to the point where your average enterprise<br />
technologist can easily make productive use <strong>of</strong> it.<br />
PwC: What class <strong>of</strong> problem would that be?<br />
JP: MapReduce works best in situations where you<br />
want to do high-volume, accurate but approximate<br />
matching and categorization in very large, lowstructured<br />
data sets. At TransUnion, we spend a lot <strong>of</strong><br />
our time trawling through tens or hundreds <strong>of</strong> billions<br />
<strong>of</strong> rows <strong>of</strong> data looking for things that match a pattern<br />
approximately. MapReduce is a more efficient filter for<br />
some <strong>of</strong> the pattern-matching algorithms that we have<br />
tried to use. At least in its theoretical formulation, it’s<br />
very amenable to highly parallelized execution, which<br />
many <strong>of</strong> the other filtering algorithms we’ve used aren’t.<br />
The open-source stack is attractive for experimenting,<br />
but the problem we find is that Hadoop isn’t what<br />
Google runs in production—it’s an attempt by a bunch<br />
<strong>of</strong> pretty smart guys to reproduce what Google runs in<br />
production. They’ve done a good job, but it’s like a lot<br />
<strong>of</strong> open-source s<strong>of</strong>tware—80 percent done. The<br />
20 percent that isn’t done—those are the hard parts.<br />
From an experimentation point <strong>of</strong> view, we have had a<br />
lot <strong>of</strong> success in proving that the computing formalism<br />
behind MapReduce works, but the s<strong>of</strong>tware that we<br />
can acquire today is very fragile. It’s difficult to manage.<br />
It has some bugs in it, and it doesn’t behave very well<br />
in an enterprise environment. It also has some<br />
interesting limitations when you try to push the<br />
scale and the performance.<br />
14 PricewaterhouseCoopers Technology Forecast
We found a number <strong>of</strong> representational problems<br />
when we used the HDFS/Hadoop/HBase stack to do<br />
something that, according to the documentation<br />
available, should have worked. However, in practice,<br />
limits in the code broke the stack well before what we<br />
thought was a good theoretical limit that we needed<br />
to achieve to make it worthwhile.<br />
Now, the good news <strong>of</strong> course is that you get source<br />
code. But that’s also the bad news. You need to get the<br />
source code, and that’s not something that we want to<br />
do as part <strong>of</strong> routine production. I have a bunch <strong>of</strong><br />
smart engineers, but I don’t want them spending their<br />
day being the technology support environment for what<br />
should be a product in our architecture. Yes, there’s a<br />
pony there, but it’s going to be awhile before it stabilizes<br />
to the point that I want to bet revenue on it.<br />
PwC: <strong>Data</strong> warehousing appliance prices have<br />
dropped pretty dramatically over the past couple<br />
<strong>of</strong> years. When it comes to data that’s not<br />
necessarily on the critical path, how does an<br />
enterprise make sure that it is not spending more<br />
than it has to?<br />
JP: We are probably not a good representational<br />
example <strong>of</strong> that because our business is analyzing the<br />
data. There is almost no price we won’t pay to get a<br />
better answer faster, because we can price that into<br />
the products we produce. The challenge we face is<br />
that the tools don’t always work properly at the edge<br />
<strong>of</strong> the envelope. This is a problem for hardware as<br />
well as s<strong>of</strong>tware. A lot <strong>of</strong> the vendors stop testing<br />
their applications at about 80 percent or 85 percent<br />
<strong>of</strong> their theoretical capability. We routinely run them at<br />
110 percent <strong>of</strong> their theoretical capability, and they<br />
break. I don’t mind making tactical justifications for<br />
technologies that I expect to replace quickly. I do that<br />
all the time. But having done that, I want the damn<br />
thing to work. Too <strong>of</strong>ten, we’ve discovered that it<br />
doesn’t work.<br />
PwC: Are you forced to use technologies that<br />
have matured because <strong>of</strong> a wariness <strong>of</strong> things<br />
on the absolute edge?<br />
JP: My dilemma is that things that are known to work<br />
usually don’t scale to what we need—for speed or full<br />
capacity. I must spend some time, energy, and dollars<br />
betting on things that aren’t mature yet, but that can be<br />
sufficiently generalized architecturally. If the one I pick<br />
doesn’t work, or goes away, I can fit something else into<br />
its place relatively easily. That’s why we like appliances.<br />
As long as they are well behaved at the network layer<br />
and have a relatively generalized or standards-based<br />
business semantic interface, it doesn’t matter if I have<br />
to unplug one in 18 months or two years because<br />
something better came along. I can’t do that for<br />
everything, but I can usually afford to do it in the areas<br />
where I have no established commercial alternative.<br />
“I have a bunch <strong>of</strong> smart engineers, but I don’t want them spending their<br />
day being the technology support environment for what should be a<br />
product in our architecture.” —John Parkinson <strong>of</strong> TransUnion<br />
The data scalability challenge 15
PwC: What are you using in place <strong>of</strong> something<br />
like Hadoop?<br />
JP: Essentially, we use brute force. We use Ab Initio,<br />
which is a very smart brute-force parallelization scheme.<br />
I depend on certain capabilities in Ab Initio to parallelize<br />
the ETL [extract, transform, and load] in such a way that<br />
I can throw more cores at the problem.<br />
PwC: Much <strong>of</strong> the data you see is transactional. Is<br />
it all structured data, or are you also mining text?<br />
JP: We get essentially three kinds <strong>of</strong> data. We get<br />
accounts receivable data from credit loan issuers. That’s<br />
the record <strong>of</strong> what people actually spend. We get public<br />
record data, such as bankruptcy records, court records,<br />
and liens, which are semi-structured text. And we get<br />
other data, which is whatever shows up, and it’s<br />
generally hooked together around a well-understood set<br />
<strong>of</strong> identifiers. But the cost <strong>of</strong> this data is essentially<br />
free—we don’t pay for it. It’s also very noisy. So we<br />
have to spend computational time figuring out whether<br />
the data we have is right, because we must find a place<br />
to put it in the working data sets that we build.<br />
At TransUnion, we suck in 100 million updates a day<br />
for the credit files. We update a big data warehouse<br />
that contains all the credit and related data. And then<br />
every day we generate somewhere between 1 and 20<br />
operational data stores, which is what we actually run<br />
the business on. Our products are joined between what<br />
we call indicative data, the information that identifies<br />
you as an individual; structured data, which is derived<br />
from transactional records; and unstructured data that<br />
is attached to the indicative. We build those products on<br />
the fly because the data may change every day,<br />
sometimes several times a day.<br />
One challenge is how to accurately find the right place<br />
to put the record. For example, we get a Joe Smith at<br />
13 Main Street and a Joe Smith at 31 Main Street.<br />
Are those two different Joe Smiths, or is that a typing<br />
error? We have to figure that out 100 million times a<br />
day using a bunch <strong>of</strong> custom pattern-matching and<br />
probabilistic algorithms.<br />
PwC: Of the three kinds <strong>of</strong> data, which is the<br />
most challenging?<br />
JP: We have two kinds <strong>of</strong> challenges. The first is driven<br />
purely by the scale at which we operate. We add<br />
roughly half a terabyte <strong>of</strong> data per month to the credit<br />
file. Everything we do has challenges related to scale,<br />
updates, speed, or database performance. The vendors<br />
both love us and hate us. But we are where the industry<br />
is going—where everybody is going to be in two to five<br />
years. We are a good leading indicator, but we break<br />
their stuff all the time. A second challenge is the<br />
unstructured part <strong>of</strong> the data, which is increasing.<br />
PwC: It’s more <strong>of</strong> a challenge to deal with the<br />
unstructured stuff because it comes in various<br />
formats and from various sources, correct?<br />
JP: Yes. We have 83,000 data sources. Not everyone<br />
provides us with data every day. It comes in about<br />
4,000 formats, despite our data interchange standards.<br />
And, to be able to process it fast enough, we must<br />
convert all data into a single interchange format that is<br />
the representation <strong>of</strong> what we use internally. Complex<br />
computer science problems are associated with all<br />
<strong>of</strong> that.<br />
PwC: Are these the kinds <strong>of</strong> data problems that<br />
businesses in other industries will face in three<br />
to five years?<br />
JP: Yes, I believe so.<br />
PwC: What are some <strong>of</strong> the other problems you<br />
think will become more widespread?<br />
JP: Here are some simple practical examples. We have<br />
8.5 petabytes <strong>of</strong> data in the total managed environment.<br />
Once you go seriously above 100 terabytes, you must<br />
replace the storage fabric every four or five years.<br />
Moving 100 terabytes <strong>of</strong> data becomes a huge material<br />
issue and takes a long time. You do get some help from<br />
improved interconnect speed, but the arrays go as fast<br />
16 PricewaterhouseCoopers Technology Forecast
as they go for reads and writes and you can’t go faster<br />
than that. And businesses down the food chain are not<br />
accustomed to thinking about refresh cycles that take<br />
months to complete. Now, a refresh cycle <strong>of</strong> PCs might<br />
take months to complete, but any one piece <strong>of</strong> it takes<br />
only a couple <strong>of</strong> hours. When I move data from one<br />
array to another, I’m not done until I’m done.<br />
Additionally, I have some bugs and new vulnerabilities<br />
to deal with.<br />
Today, we don’t have a backup problem at TransUnion<br />
because we do incremental forever backup. However,<br />
we do have a restore problem. To restore a material<br />
amount <strong>of</strong> data, which we very occasionally need to do,<br />
takes days in some instances because the physics <strong>of</strong><br />
the technology we use won’t go faster than that. The<br />
average IT department doesn’t worry about these<br />
problems. But take the amount <strong>of</strong> data an average IT<br />
department has under management, multiply it by a<br />
single decimal order <strong>of</strong> magnitude, and it starts to<br />
become a material issue.<br />
We would like to see computationally more-efficient<br />
compression algorithms, because my two big cost<br />
pools are Store It and Move It. For now, I don’t have<br />
a computational problem, but if I can’t shift the trend<br />
line on Store It and Move It, I will have a computational<br />
problem within a few years. To perform the<br />
computations in useful time, I must parallelize how I<br />
compute. Above a certain point, the parallelization<br />
breaks because I can’t move the data further.<br />
PwC: <strong>Cloudera</strong> [a vendor <strong>of</strong>fering a Hadoop<br />
distribution] would say bring the computation to<br />
the data.<br />
JP: That works only for certain kinds <strong>of</strong> data. We already<br />
do all <strong>of</strong> that large-scale computation on a file system<br />
basis, not on a database basis. And we spend compute<br />
cycles to compress the data so there are fewer bits to<br />
move, then decompress the data for computation, and<br />
recompress it so we have fewer bits to store.<br />
What we have discovered—because I run the fourth<br />
largest commercial GPFS [general parallel file system,<br />
a distributed computing file system developed by IBM]<br />
cluster in the world—is that once you go beyond a<br />
certain size, the parallelization management tools break.<br />
That’s why I keep telling people that Hadoop is not what<br />
Google runs in production. Maybe the Google guys<br />
have solved this, but if they have, they aren’t telling<br />
me how. •<br />
“We would like to see<br />
computationally more-efficient<br />
compression algorithms,<br />
because my two big cost<br />
pools are Store It and Move It.”<br />
—John Parkinson <strong>of</strong> TransUnion<br />
The data scalability challenge 17
Creating a cost-effective<br />
<strong>Big</strong> <strong>Data</strong> strategy<br />
Disney’s Bud Albers, Scott Thompson,<br />
and Matt Estes (respectively) outline<br />
an agile approach that leverages<br />
open-source and cloud technologies.<br />
Interview conducted by Galen Gruman<br />
and Alan Morrison<br />
Bud Albers joined what is now the Disney Technology Shared<br />
Services Group two years ago as executive vice president and CTO. His management<br />
team includes Scott Thompson, vice president <strong>of</strong> architecture, and Matt Estes, principal<br />
data architect. The Technology Shared Services Group, located in Seattle, has a heritage<br />
dating back to the late 1990s, when Disney acquired Starwave and Infoseek.<br />
The group supports all the Disney businesses ($38 billion in annual revenue), managing<br />
the company’s portfolio <strong>of</strong> Web properties. These include properties for the studio, store,<br />
and park; ESPN; ABC; and a number <strong>of</strong> local television stations in major cities.<br />
In this interview, Albers, Thompson, and Estes discuss how they’re expanding Disney’s<br />
Web data analysis footprint without incurring additional cost by implementing a Hadoop<br />
cluster. Albers and team freed up budget for this cluster by virtualizing servers and<br />
eliminating other redundancies.<br />
PwC: Disney is such a diverse company, and yet<br />
there clearly is lots <strong>of</strong> potential for synergies and<br />
cross-fertilization. How do you approach these<br />
opportunities from a data perspective?<br />
BA: We try and understand the best way to work with<br />
and to provide services to the consumer in the long<br />
term. We have some businesses that are very data<br />
intensive, and then we have some that are less so<br />
because <strong>of</strong> their consumer audience. One <strong>of</strong> the<br />
challenges always is how to serve both kinds <strong>of</strong><br />
businesses and do so in ways that make sense. The<br />
sell-to relationships extend from the studio out to the<br />
distribution groups and the theater chains. If you’re<br />
selling to millions, you’re trying to understand the<br />
different audiences and how they connect.<br />
One <strong>of</strong> the things I’ve been telling my folks from a data<br />
perspective is that you don’t send terabytes one way to<br />
be mated with a spreadsheet on the other side, right?<br />
We’re thinking through those kinds <strong>of</strong> pieces and trying<br />
to figure out how we move down a path. The net is that<br />
working with all these businesses gives us a diverse set<br />
<strong>of</strong> requirements, as you might imagine. We’re trying to<br />
stay ahead <strong>of</strong> where all the businesses are.<br />
In that respect, the questions I’m asking are, how do we<br />
get more agile, and how do we do it in a way that<br />
handles all the data we have? We must consider all <strong>of</strong><br />
the new form factors being developed, all <strong>of</strong> which will<br />
generate lots <strong>of</strong> data. A big question is, how do we<br />
handle this data in a way that makes cost sense for the<br />
business and provides us an increased level <strong>of</strong> agility?<br />
18 PricewaterhouseCoopers Technology Forecast
We hope to do in other areas what we’ve done with<br />
content distribution networks [CDNs]. We’ve had a<br />
tremendous amount <strong>of</strong> success with the CDN<br />
marketplace by standardizing, by staying in the middle<br />
<strong>of</strong> the road and not going to Akamai proprietary<br />
extensions, and by creating a dynamic marketplace.<br />
If we get a new episode <strong>of</strong> LOST, we can start<br />
streaming it, and I can be streaming 80 percent on<br />
Akamai and 20 percent on Level 3. Then we can<br />
decide we’re going to turn it back, and I’m going to<br />
give 80 percent to Limelight and 20 percent to Level 3.<br />
We can do that dynamically.<br />
PwC: What are the other main strengths <strong>of</strong> the<br />
Technology Shared Services Group at Disney?<br />
BA: When I came here a couple <strong>of</strong> years ago, we had<br />
some very good core central services. If you look at the<br />
true definition <strong>of</strong> a cloud, we had the very early makings<br />
<strong>of</strong> one—shared central services around registration,<br />
for example. On Disney, on ABC, or on ESPN, if you<br />
have an ID, it works on all the Disney properties. If you<br />
have an ESPN ID, you can sign in to KGO in San<br />
Francisco, and it will work. It’s all a shared registration<br />
system. The advertising system we built is shared. The<br />
marketing systems we built are shared—all the analytics<br />
collection, all those things are centralized. Those things<br />
that are common are shared among all the sites.<br />
Those things that are brand specific are built by the<br />
brands, and the user interface is controlled by the<br />
brands, so each <strong>of</strong> the various divisions has a head<br />
<strong>of</strong> engineering on the Web site who reports to me.<br />
Our CIO worries about it from the firewall back;<br />
I worry about it from the firewall to the living room<br />
and the mobile device. That’s the way we split up<br />
the world, if that makes sense.<br />
PwC: How do you link the data requirements <strong>of</strong><br />
the central core with those that are unique to the<br />
various parts <strong>of</strong> the business?<br />
BA: It’s more art than science. The business units<br />
must generate revenue, and we must provide the core<br />
services. How do you strike that balance? Ownership<br />
is a lot more negotiated on some things today. We<br />
typically pull down most <strong>of</strong> the analytics and add things<br />
in, and it’s a constant struggle to answer the question,<br />
“Do we have everything?” We’re headed toward this<br />
notion <strong>of</strong> one data element at a time, aggregate, and<br />
queue up the aggregate. It can get a little bit crazy<br />
because you wind up needing to pull the data in and<br />
run it through that whole food chain, and it may or<br />
may not have lasting value.<br />
It may have only a temporal level <strong>of</strong> importance, and so<br />
we’re trying to figure out how to better handle that. An<br />
awful lot <strong>of</strong> what we do in the data collection is pull it in,<br />
lay it out so it can be reported on, and/or push it back<br />
into the businesses, because the Web is evolving<br />
rapidly from a standalone thing to an integral part<br />
<strong>of</strong> how you do business.<br />
“It’s more art than science. The business units must generate revenue,<br />
and we must provide the core services. How do you strike that balance?<br />
Ownership is a lot more negotiated on some things today.”<br />
—Bud Albers<br />
Creating a cost-effective <strong>Big</strong> <strong>Data</strong> strategy 19
PwC: Hadoop seems to suggest a feasible way<br />
to analyze data that has only temporal<br />
importance. How did you get to the point where<br />
you could try something like a Hadoop cluster?<br />
BA: Guys like me never get called when it’s all pretty<br />
and shiny. The Disney unit I joined obviously has many<br />
strengths, but when I was brought on, there was a cost<br />
growth situation. The volume <strong>of</strong> the aggregate activity<br />
growth was 17 percent. Our server growth at the time<br />
was 30 percent. So we were filling up data centers, but<br />
we were filling them with CPUs that weren’t being used.<br />
My question was, how can you go to the CFO and ask<br />
for a lot <strong>of</strong> money to fill a data center with capital assets<br />
that you’re going to use only 5 percent <strong>of</strong>?<br />
CPU utilization isn’t the only measure, but it’s the most<br />
prominent one. To study and understand what was<br />
happening, we put monitors and measures on our<br />
servers and reported peak CPU utilization on fiveminute<br />
intervals across our server farm. We found that<br />
on roughly 80 percent <strong>of</strong> our servers, we never got<br />
above 10 percent utilization in a monthly period.<br />
Our first step to address that problem was virtualization.<br />
At this point, about 49 percent <strong>of</strong> our data center is<br />
virtual. Our virtualization effort had a sizable impact on<br />
cost. Dollars fell out because we quit building data<br />
centers and doing all kinds <strong>of</strong> redundant shuffling. We<br />
didn’t have to lay <strong>of</strong>f people. We changed some <strong>of</strong> our<br />
processes, and we were able to shift our growth curve<br />
from plus 27 to minus 3 on the shared service.<br />
We call this our D-Cloud effort. Another step in this<br />
effort was moving to a REST [REpresentational State<br />
Transfer] and JSON [Javascript Object Notation] data<br />
exchange standard, because we knew we had to hit all<br />
these different devices and create some common APIs<br />
[application programming interfaces] in the framework.<br />
One <strong>of</strong> the very first things we put in place was a central<br />
logging service for all the events. These event logs can<br />
be streamed into one very large data set. We can then<br />
use the Hadoop and MapReduce paradigm to go after<br />
that data.<br />
PwC: How does the central logging service fit<br />
into your overall strategy?<br />
ST: As we looked at it, we said, it’s not just about<br />
virtualization. To be able to burst and do these other<br />
things, you need to build a bunch <strong>of</strong> core services. The<br />
initiative we’re working on now is to build some <strong>of</strong> those<br />
core services around managing configuration. This<br />
project takes the foundation we laid with virtualization<br />
and a REST and JSON data exchange standard, and<br />
adds those core services that enable us to respond to<br />
the marketplace as it develops. Piping that data back to<br />
a central repository helps you to analyze it, understand<br />
what’s going on, and make better decisions on the<br />
basis <strong>of</strong> what you learned.<br />
PwC: How do you evolve so that the data<br />
strategy is really served well, so that it’s more<br />
<strong>of</strong> a data-driven approach in some ways?<br />
ME: On one side, you have a very transactional OLTP<br />
[online transactional processing] kind <strong>of</strong> world, RDBMSs<br />
[relational database management systems], and major<br />
vendors that we’re using there. On the other side <strong>of</strong> it,<br />
you have traditional analytical warehousing. And where<br />
we’ve slotted this [Hadoop-style data] is in the middle<br />
with the other operational data. Some <strong>of</strong> it is derived<br />
from transactional data, and some has been crafted<br />
out <strong>of</strong> analytical data. There’s a freedom that’s derived<br />
from blending these two kinds <strong>of</strong> data.<br />
Our centralized logging service is an example.<br />
As we look at continuing to drive down costs to<br />
drive up efficiency, we can begin to log a large<br />
amount <strong>of</strong> this data at a price point that we have<br />
not been able to achieve by scaling up RDBMSs<br />
or using warehousing appliances.<br />
Then the key will be putting an expert system in place.<br />
That will give us the ability to really understand what’s<br />
going on in the actual operational environment.<br />
We’re starting to move again toward lower utilization<br />
trajectories. We need to scale the infrastructure back<br />
and get that utilization level up to the threshold.<br />
20 PricewaterhouseCoopers Technology Forecast
PwC: This kind <strong>of</strong> information doesn’t go in a<br />
cube. Not that data cubes are going away,<br />
but cubes are fairly well known now. The value<br />
you can create is exactly what you said,<br />
understanding the thinking behind it and the<br />
exploratory steps.<br />
ST: We think storing the unstructured data in its raw<br />
format is what’s coming. In a Hadoop environment,<br />
instead <strong>of</strong> bringing the data back to your warehouse,<br />
you figure out what question you want to answer. Then<br />
you MapReduce the input, and you may send that <strong>of</strong>f<br />
to a data cube and a thing that someone can dig around<br />
in, but you keep the data in its raw format and pull out<br />
only what you need.<br />
BA: The wonderful thing about where we’re headed<br />
right now is that data analysis used to be this giant,<br />
massive bet that you had to place up front, right?<br />
No longer. Now, I pull Hadoop <strong>of</strong>f <strong>of</strong> the Internet,<br />
first making sure that we’re compliant from a legal<br />
perspective with licensing and so forth. After that’s<br />
taken care <strong>of</strong>, you begin to prototype. You begin to<br />
work with it against common hardware. You begin<br />
to work with it against stuff you otherwise might<br />
throw out. Rather than, I’m going to go spend how<br />
much for Teradata?<br />
We’re using the basic premise <strong>of</strong> the cloud, and we’re<br />
using those techniques <strong>of</strong> standardizing the interface<br />
to virtualize and drive cost out. I’m taking that cost<br />
savings and returning some <strong>of</strong> it to the business, but<br />
then reinvesting some in new capabilities while the<br />
cost curve is stabilizing.<br />
ME: Refining some <strong>of</strong> this reinvestment in new<br />
capabilities doesn’t have to be put in the category <strong>of</strong><br />
traditional “$5 million projects” companies used to think<br />
about. You can make significant improvements with<br />
reinvestments <strong>of</strong> $200,000 or even $50,000.<br />
BA: It’s then a matter <strong>of</strong> how you’re redeploying an<br />
investment in resources that you’ve already made as<br />
a corporation. It’s a matter <strong>of</strong> now prioritizing your<br />
work and not changing the bottom-line trajectory in a<br />
negative fashion with a bet that may not pay <strong>of</strong>f. I can<br />
try it, and I don’t have to get great big governancebased<br />
permission to do it, because it’s not a bet <strong>of</strong> half<br />
the staff and all <strong>of</strong> this stuff. It’s, OK, let’s get something<br />
on the ground, let’s work with the business unit, let’s<br />
pilot it, let’s go somewhere where we know we have a<br />
need, let’s validate it against this need, and let’s make<br />
sure that it’s working. It’s not something that must go<br />
through an RFP [request for proposal] and standard<br />
procurement. I can move very fast. •<br />
“We think storing the unstructured data in its raw format is what’s<br />
coming. In a Hadoop environment, instead <strong>of</strong> bringing the data back to<br />
your warehouse, you figure out what question you want to answer.”<br />
—Scott Thompson<br />
Creating a cost-effective <strong>Big</strong> <strong>Data</strong> strategy 21
Building a bridge to<br />
the rest <strong>of</strong> your data<br />
How companies are using open-source cluster-computing techniques<br />
to analyze their data.<br />
By Alan Morrison<br />
22 PricewaterhouseCoopers Technology Forecast
As recently as two years ago, the International<br />
Supercomputing Conference (ISC) agenda included<br />
nothing about distributed computing for <strong>Big</strong> <strong>Data</strong>—<br />
as if projects such as Google Cluster Architecture, a<br />
low-cost, distributed computing design that enables<br />
efficient processing <strong>of</strong> large volumes <strong>of</strong> less-structured<br />
data, didn’t exist. In a May 2008 blog, Brough Turner<br />
noted the omission, pointing out that Google had<br />
harnessed as much as 100 petaflops 1 <strong>of</strong> computing<br />
power, compared to a mere 1 petaflop in the new IBM<br />
Roadrunner, a supercomputer pr<strong>of</strong>iled in EE Times<br />
that month. “Have the supercomputer folks been<br />
bypassed and don’t even know it?” Turner wondered. 2<br />
Turner, co-founder and CTO <strong>of</strong> Ashtonbrooke.com, a<br />
startup in stealth mode, had been reading Google’s<br />
research papers and remarking on them in his blog for<br />
years. Although the broader business community had<br />
taken little notice, some companies were following in<br />
Google’s wake. Many <strong>of</strong> them were Web companies<br />
that had data processing scalability challenges similar<br />
to Google’s.<br />
Yahoo, for example, abandoned its own data<br />
architecture and began to adopt one along the lines<br />
pioneered by Google. It moved to Apache Hadoop,<br />
an open-source, Java-based distributed file system<br />
based on Google File System and developed by<br />
the Apache S<strong>of</strong>tware Foundation; it also adopted<br />
MapReduce, Google’s parallel programming framework.<br />
Yahoo used these and other open-source tools it helped<br />
develop to crawl and index the Web. After implementing<br />
the architecture, it found other uses for the technology<br />
and has now scaled its Hadoop cluster to 4,000 nodes.<br />
By early 2010, Hadoop, MapReduce, and related<br />
open-source techniques had become the driving forces<br />
behind what O’Reilly Media, The Economist, and others<br />
in the press call <strong>Big</strong> <strong>Data</strong> and what vendors call cloud<br />
storage. <strong>Big</strong> <strong>Data</strong> refers to data sets that are growing<br />
exponentially and that are too large, too raw, or too<br />
unstructured for analysis by traditional means. Many<br />
who are familiar with these new methods are convinced<br />
that Hadoop clusters will enable cost-effective analysis<br />
<strong>of</strong> <strong>Big</strong> <strong>Data</strong>, and these methods are now spreading<br />
beyond companies that mine the public Web as part<br />
<strong>of</strong> their business.<br />
By early 2010, Hadoop, MapReduce, and related open-source<br />
techniques had become the driving forces behind what O’Reilly Media,<br />
The Economist, and others in the press call <strong>Big</strong> <strong>Data</strong> and what<br />
vendors call cloud storage.<br />
Building a bridge to the rest <strong>of</strong> your data 23
“Hadoop will process the data set and output a new data set,<br />
as opposed to changing the data set in place.” —Amr Awadallah<br />
<strong>of</strong> <strong>Cloudera</strong><br />
What are these methods and how do they work? This<br />
article looks at the architecture and tools surrounding<br />
Hadoop clusters with an eye toward what about them<br />
will be useful to mainstream enterprises during the<br />
next three to five years. We focus on their utility for<br />
less-structured data.<br />
Hadoop clusters<br />
Although cluster computing has been around for<br />
decades, commodity clusters are more recent, starting<br />
with UNIX- and Linux-based Beowulf clusters in the<br />
mid-1990s. These banks <strong>of</strong> inexpensive servers<br />
networked together were pitted against expensive<br />
supercomputers from companies such as Cray and<br />
others—the kind <strong>of</strong> computers that government<br />
agencies, such as the National Aeronautics and Space<br />
Administration (NASA), bought. It was no accident<br />
that NASA pioneered the development <strong>of</strong> Beowulf. 3<br />
Hadoop extends the value <strong>of</strong> commodity clusters,<br />
making it possible to assemble a high-end computing<br />
cluster at a low-end price. A central assumption<br />
underlying this architecture is that some nodes are<br />
bound to fail when computing jobs are distributed<br />
across hundreds or thousands <strong>of</strong> nodes. Therefore,<br />
one key to success is to design the architecture to<br />
anticipate and recover from individual node failures. 4<br />
Other goals <strong>of</strong> the Google Cluster Architecture and<br />
its expression in open-source Hadoop include:<br />
• Price/performance over peak performance—The<br />
emphasis is on optimizing aggregate throughput; for<br />
example, sorting functions to rank the occurrence <strong>of</strong><br />
keywords in Web pages. Overall sorting throughput<br />
is high. In each <strong>of</strong> the past three years, Yahoo’s<br />
Hadoop clusters have won Gray’s terabyte sort<br />
benchmarking test. 5<br />
• S<strong>of</strong>tware tolerance for hardware failures—When a<br />
failure occurs, the system responds by transferring<br />
the processing to another node, a critical capability<br />
for large distributed systems. As Roger Magoulas,<br />
research director for O’Reilly Media, says, “If you are<br />
going to have 40 or 100 machines, you don’t expect<br />
your machines to break. If you are running something<br />
with 1,000 nodes, stuff is going<br />
to break all the time.”<br />
• High compute power per query—The ability to<br />
scale up to thousands <strong>of</strong> nodes implies the ability to<br />
throw more compute power at each query. That<br />
ability, in turn, makes it possible to bring more data<br />
to bear on each problem.<br />
• Modularity and extensibility—Hadoop clusters<br />
scale horizontally with the help <strong>of</strong> a uniform, highly<br />
modular architecture.<br />
Hadoop isn’t intended for all kinds <strong>of</strong> workloads,<br />
especially not those with many writes. It works best for<br />
read-intensive workloads. These clusters complement,<br />
rather than replace, high-performance computing (HPC)<br />
and other relational data systems. They don’t work well<br />
with transactional data or records that require frequent<br />
updating. “Hadoop will process the data set and output<br />
a new data set, as opposed to changing the data set in<br />
place,” says Amr Awadallah, vice president <strong>of</strong><br />
engineering and CTO <strong>of</strong> <strong>Cloudera</strong>, which develops a<br />
version <strong>of</strong> Hadoop.<br />
A data architecture and a s<strong>of</strong>tware design that are<br />
frugal with network and disk resources are responsible<br />
for the price/performance ratio <strong>of</strong> Hadoop clusters.<br />
In Awadallah’s words, “You move your processing to<br />
where your data lives.” Each node has its own<br />
processing and storage, and the data is divided and<br />
processed locally in blocks sized for the purpose.<br />
This concept <strong>of</strong> localization makes it possible to use<br />
inexpensive serial advanced technology attachment<br />
(SATA) hard disks—the kind used in most PCs and<br />
servers—and Gigabit Ethernet for most network<br />
interconnections. (See Figure 1.)<br />
24 PricewaterhouseCoopers Technology Forecast
Client<br />
Switch<br />
1000Mbps<br />
Switch<br />
100Mbps<br />
Switch<br />
100Mbps<br />
Typical node setup<br />
2 quad-core Intel Nehalem<br />
Task tracker/<br />
<strong>Data</strong>Node<br />
JobTracker<br />
24GB <strong>of</strong> RAM<br />
12 1TB SATA disks (non-RAID)<br />
Task tracker/<br />
<strong>Data</strong>Node<br />
Task tracker/<br />
<strong>Data</strong>Node<br />
NameNode<br />
Task tracker/<br />
<strong>Data</strong>Node<br />
1Gigabit Ethernet card<br />
Cost per node: $5,000<br />
Effective file space per node: 20TB<br />
Task tracker/<br />
<strong>Data</strong>Node<br />
Task tracker/<br />
<strong>Data</strong>Node<br />
Task tracker/<br />
<strong>Data</strong>Node<br />
Task tracker/<br />
<strong>Data</strong>Node<br />
Task tracker/<br />
<strong>Data</strong>Node<br />
Task tracker/<br />
<strong>Data</strong>Node<br />
Claimed benefits<br />
Linear scaling at $250 per user TB<br />
(versus $5,000–$100,000 for alternatives)<br />
Compute placed near the data and<br />
fewer writes limit networking<br />
and storage costs<br />
Rack<br />
Rack<br />
Modularity and extensibility<br />
Figure 1: Hadoop cluster layout and characteristics<br />
Source: IBM, 2008, and <strong>Cloudera</strong>, 2010<br />
Building a bridge to the rest <strong>of</strong> your data 25
“Amazon supports Hadoop directly through its Elastic MapReduce<br />
application programming interfaces.” —Chris Wensel <strong>of</strong> Concurrent<br />
The result is less-expensive large-scale distributed<br />
computing and parallel processing, which make<br />
possible an analysis that is different from what most<br />
enterprises have previously attempted. As author Tom<br />
White points out, “The ability to run an ad hoc query<br />
against your whole data set and get the results in a<br />
reasonable time is transformative.” 6<br />
The cost <strong>of</strong> this capability is low enough that companies<br />
can fund a Hadoop cluster from existing IT budgets.<br />
When it decided to try Hadoop, the Walt Disney Co.’s<br />
Technology Shared Services Group took advantage <strong>of</strong><br />
the increased server utilization it had already achieved<br />
from virtualization. As <strong>of</strong> March 2010, with nearly<br />
50 percent <strong>of</strong> its servers virtualized, Disney had<br />
30 percent server image growth annually but 30 percent<br />
less growth in physical servers. It was then able to set<br />
up a multi-terabyte cluster with Hadoop and other free<br />
open-source tools, using servers it had planned to<br />
retire. The group estimates it spent less than $500,000<br />
on the entire project. (See the article, “Tapping into the<br />
power <strong>of</strong> <strong>Big</strong> <strong>Data</strong>,” on page 04.)<br />
These clusters are also transformative because cloud<br />
providers can <strong>of</strong>fer them on demand. Instead <strong>of</strong> using<br />
their own infrastructures, companies can subscribe to<br />
a service such as Amazon’s or <strong>Cloudera</strong>’s distribution<br />
on the Amazon Elastic Compute Cloud (EC2) platform.<br />
The EC2 platform was crucial in a well-known use <strong>of</strong><br />
cloud computing on a <strong>Big</strong> <strong>Data</strong> project that also<br />
depended on Hadoop and other open-source tools.<br />
In 2007, The New York Times needed to quickly<br />
assemble the PDFs <strong>of</strong> 11 million articles from 4<br />
terabytes <strong>of</strong> scanned images. Amazon’s EC2 service<br />
completed the job in 24 hours after setup, a feat<br />
that received widespread attention in blogs and the<br />
trade press.<br />
Mostly overlooked in all that attention was the use <strong>of</strong><br />
the Hadoop Distributed File System (HDFS) and the<br />
MapReduce framework. Using these open-source tools,<br />
after studying how-to blog posts from others, Times<br />
senior s<strong>of</strong>tware architect Derek Gottfrid developed and<br />
ran code in parallel across multiple Amazon machines. 7<br />
“Amazon supports Hadoop directly through its Elastic<br />
MapReduce application programming interfaces [APIs],”<br />
says Chris Wensel, founder <strong>of</strong> Concurrent, which<br />
developed Cascading. (See the discussion <strong>of</strong><br />
Cascading later in this article.) “I regularly work with<br />
customers to boot up 200-node clusters and process<br />
3 terabytes <strong>of</strong> data in five or six hours, and then shut<br />
the whole thing down. That’s extraordinarily powerful.”<br />
The Hadoop Distributed File System<br />
The Hadoop Distributed File System (HDFS) and the<br />
MapReduce parallel programming framework are at<br />
the core <strong>of</strong> Apache Hadoop. Comparing HDFS and<br />
MapReduce to Linux, Awadallah says that together<br />
they’re a “data operating system.” This description may<br />
be overstated, but there are similarities to any operating<br />
system. Operating systems schedule tasks, allocate<br />
resources, and manage files and data flows to fulfill the<br />
tasks. HDFS does a distributed computing version <strong>of</strong><br />
this. “It takes care <strong>of</strong> linking all the nodes together to<br />
look like one big file and job scheduling system for the<br />
applications running on top <strong>of</strong> it,” Awadallah says.<br />
HDFS, like all Hadoop tools, is Java based. An HDFS<br />
contains two kinds <strong>of</strong> nodes:<br />
• A single NameNode that logs and maintains the<br />
necessary metadata in memory for distributed jobs<br />
• Multiple <strong>Data</strong>Nodes that create, manage, and<br />
process the 64MB blocks that contain pieces <strong>of</strong><br />
Hadoop jobs, according to the instructions from<br />
the NameNode<br />
26 PricewaterhouseCoopers Technology Forecast
HDFS uses multi-gigabyte file sizes to reduce the<br />
management complexity <strong>of</strong> lots <strong>of</strong> files in large data<br />
volumes. It typically writes each copy <strong>of</strong> the data once,<br />
adding to files sequentially. This approach simplifies<br />
the task <strong>of</strong> synchronizing data and reduces disk and<br />
bandwidth usage.<br />
Equally important are fault tolerance within the same<br />
disk and bandwidth usage limits. To accomplish fault<br />
tolerance, HDFS creates three copies <strong>of</strong> each data<br />
block, typically storing two copies in the same rack.<br />
The system goes to another rack only if it needs the<br />
third copy. Figure 2 shows a simplified depiction <strong>of</strong><br />
HDFS and its data block copying method.<br />
<strong>Data</strong>Node<br />
<strong>Data</strong>Node<br />
Client<br />
<strong>Data</strong>Node<br />
NameNode<br />
(metadata)<br />
Files Blocks<br />
File A 1, 2, 4<br />
File A 3, 5<br />
<strong>Data</strong>Node<br />
HDFS does not perform tasks such as changing<br />
specific numbers in a list or other changes on parts<br />
<strong>of</strong> a database. This limitation leads some to assume<br />
that HDFS is not suitable for structured data. “HDFS<br />
was never designed for structured data and therefore<br />
it’s not optimal to perform queries on structured data,”<br />
says Daniel Abadi, assistant pr<strong>of</strong>essor <strong>of</strong> computer<br />
science at Yale University. Abadi and others at Yale<br />
have done performance testing on the subject, and they<br />
have created a relational database alternative to HDFS<br />
called HadoopDB to address the performance issues<br />
they identified. 8<br />
Some developers are structuring data in ways that are<br />
suitable for HDFS; they’re just doing it differently from<br />
the way relational data would be structured. Nathan<br />
Marz, a developer at BackType, a company that <strong>of</strong>fers a<br />
search engine for social media buzz, uses schemas to<br />
ensure consistency and avoid data corruption. “A lot<br />
<strong>of</strong> people think that Hadoop is meant for unstructured<br />
data, like log files,” Marz says. “While Hadoop is<br />
great for log files, it’s also fantastic for strongly typed,<br />
structured data.” For this purpose, Marz uses Thrift,<br />
which was developed by Facebook for data translation<br />
and serialization purposes. 9 (See the discussion <strong>of</strong><br />
Thrift later in this article.) Figure 3 illustrates a typical<br />
Hadoop data processing flow that includes Thrift<br />
and MapReduce.<br />
1 2 4<br />
5 2 3<br />
4 3 1<br />
5 2 5<br />
Figure 2: The Hadoop Distributed File System, or HDFS<br />
Source: Apache S<strong>of</strong>tware Foundation, IBM, and PricewaterhouseCoopers, 2008<br />
Input<br />
data<br />
Input<br />
applications<br />
Core Hadoop data processing<br />
Output<br />
applications<br />
Less-structured<br />
information<br />
such as:<br />
log files<br />
messages<br />
images<br />
Cascading<br />
Thrift<br />
Zookeeper<br />
Pig<br />
Figure 3: Hadoop ecosystem overview<br />
Source: PricewaterhouseCoopers, derived from Apache S<strong>of</strong>tware Foundation and Dion Hinchcliffe, 2010<br />
Jobs<br />
1<br />
2<br />
3<br />
1<br />
M<br />
M<br />
2<br />
M<br />
3<br />
1<br />
2<br />
3<br />
R<br />
Results<br />
Mashups<br />
RDBMS apps<br />
BI systems<br />
M<br />
R<br />
Map<br />
Reduce<br />
64MB blocks<br />
Building a bridge to the rest <strong>of</strong> your data 27
MapReduce<br />
MapReduce is the base programming framework for<br />
Hadoop. It <strong>of</strong>ten acts as a bridge between HDFS and<br />
tools that are more accessible to most programmers.<br />
According to those at Google who developed the tool,<br />
“it hides the details <strong>of</strong> parallelization” and the other<br />
nuts and bolts <strong>of</strong> HDFS. 10<br />
MapReduce is a layer <strong>of</strong> abstraction, a way <strong>of</strong> managing<br />
a sea <strong>of</strong> details by creating a layer that captures and<br />
summarizes their essence. That doesn’t mean it is easy<br />
to use. Many developers choose to work with another<br />
tool, yet another layer <strong>of</strong> abstraction on top <strong>of</strong> it. “I<br />
avoid using MapReduce directly at all cost,” Marz says.<br />
“I actually do almost all my MapReduce work with a<br />
library called Cascading.”<br />
The terms “map” and “reduce” refer to steps the<br />
tool takes to distribute, or map, the input for parallel<br />
processing, and then reduce, or aggregate, the<br />
processed data into output files. (See Figure 4.)<br />
MapReduce works with key-value pairs. Frequently<br />
with Web data, the keys consist <strong>of</strong> URLs and the<br />
values consist <strong>of</strong> Web page content, such as HTML.<br />
MapReduce’s main value is as a platform with a set<br />
<strong>of</strong> APIs. Before MapReduce, fewer programmers could<br />
take advantage <strong>of</strong> distributed computing. Now that<br />
user-accessible tools have been designed, simpler<br />
programming is possible on massively parallel systems<br />
without the need to adapt the programs as much.<br />
The following sections examine some <strong>of</strong> these tools.<br />
Map<br />
<strong>Data</strong><br />
store 1<br />
Input key-value pairs<br />
Map<br />
<strong>Data</strong><br />
store n<br />
Input key-value pairs<br />
key 1<br />
values<br />
key 2 values key 3 values key 1 values key 2 values key 3 values<br />
Barrier ...<br />
Aggregates intermediate values by output key ... Barrier<br />
key 1 intermediate values key 2 intermediate values key 3 intermediate values<br />
Reduce Reduce Reduce<br />
final key 1 values final key 2 values final key 3 values<br />
Figure 4: MapReduce phases<br />
Source: Google, 2004, and <strong>Cloudera</strong>, 2009<br />
28 PricewaterhouseCoopers Technology Forecast
“You can code in whatever JVM-based language you want, and then<br />
shove that into the cluster.” —Chris Wensel <strong>of</strong> Concurrent<br />
Cascading<br />
Wensel, who created Cascading, calls it an alternative<br />
API to MapReduce, a single library <strong>of</strong> operations<br />
developers can tap. It’s another layer <strong>of</strong> abstraction<br />
that helps bring what programmers ordinarily do in<br />
non-distributed environments to distributed computing.<br />
With it, he says, “you can code in whatever JVM-based<br />
[Java Virtual Machine] language you want, and then<br />
shove that into the cluster.”<br />
Wensel wanted to obviate the need for “thinking in<br />
MapReduce.” When using Cascading, developers don’t<br />
think in key-value pair terms—they think in terms <strong>of</strong><br />
fields and lists <strong>of</strong> values called “tuples.” A Cascading<br />
tuple is simpler than a database record but acts like<br />
one. Each tuple flows through “pipe” assemblies, which<br />
are comparable to Java classes. The data flow begins<br />
at the source, an input file, and ends with a sink, an<br />
output directory. (See Figure 5.)<br />
Rather than approach map and reduce phases large-file<br />
by large-file, developers assemble flows <strong>of</strong> operations<br />
using functions, filters, aggregators, and buffers.<br />
Those flows make up the pipe assemblies, which, in<br />
Marz’s terms, “compile to MapReduce.” In this way,<br />
Cascading smoothes the bumpy MapReduce terrain so<br />
more developers—including those who work mainly in<br />
scripting<br />
Client<br />
languages—can build flows. (See Figure 6.)<br />
Assembly<br />
A<br />
A<br />
A<br />
A<br />
Cluster<br />
Job<br />
A<br />
A<br />
A<br />
A<br />
Flow<br />
MR<br />
MR<br />
Job<br />
MR<br />
MR<br />
Map Reduce Map Reduce<br />
[f1, f2, ...] [f1, f2, ...] [f1, f2, ...] [f1, f2, ...] [f1, f2, ...]<br />
P P P P P P<br />
[f1, f2, ...] [f1, f2, ...]<br />
So<br />
Si<br />
A<br />
MR<br />
Pipe assembly<br />
Hadoop MR (translation to MapReduce)<br />
MapReduce jobs<br />
[f1, f2, ...] Tuples with field names<br />
So Source<br />
Si Sink<br />
P Pipe<br />
Figure 6: Cascading assembly and flow<br />
Source: Concurrent, 2010<br />
Figure 5: A Cascading assembly<br />
Source: Concurrent, 2010<br />
Building a bridge to the rest <strong>of</strong> your data 29
Some useful tools for MapReduce-style<br />
analytics programming<br />
Open-source tools that work via MapReduce on<br />
Hadoop clusters are proliferating. Users and developers<br />
don’t seem concerned that Google received a patent for<br />
MapReduce in January 2010. In fact, Google, IBM, and<br />
others have encouraged the development and use <strong>of</strong><br />
open-source versions <strong>of</strong> these tools at various research<br />
universities. 11 A few <strong>of</strong> the more prominent tools<br />
relevant to analytics, and used by developers we’ve<br />
interviewed, are listed in the sections that follow.<br />
Clojure<br />
Clojure creator Rich Hickey wanted to combine aspects<br />
<strong>of</strong> C or C#, LISP (for list processing, a language<br />
associated with artificial intelligence that’s rich in<br />
mathematical functions), and Java. The letters C, L, and<br />
J led him to name the language, which is pronounced<br />
“closure.” Clojure combines a LISP library with Java<br />
libraries. Clojure’s mathematical and natural language<br />
processing (NLP) capabilities and the fact that it is JVM<br />
based make it useful for statistical analysis on Hadoop<br />
clusters. FlightCaster, a commercial-airline-delayprediction<br />
service, uses Clojure on top <strong>of</strong> Cascading,<br />
on top <strong>of</strong> MapReduce and Hadoop, for “getting the<br />
right view into unstructured data from heterogeneous<br />
sources,” says Bradford Cross, FlightCaster co-founder.<br />
LISP has attributes that lend themselves to NLP, making<br />
Clojure especially useful in NLP applications. Mark<br />
Watson, an artificial intelligence consultant and author,<br />
says most LISP programming he’s done is for NLP. He<br />
considers LISP to be four times as productive for<br />
programming as C++ and twice as productive as Java.<br />
His NLP code “uses a huge amount <strong>of</strong> memory-resident<br />
data,” such as lists <strong>of</strong> proper nouns, text categories,<br />
common last names, and nationalities.<br />
“Getting the right view into<br />
unstructured data from<br />
heterogeneous sources.”<br />
— Bradford Cross <strong>of</strong> FlightCaster<br />
With LISP, Watson says, he can load the data once and<br />
test multiple times. In C++, he would need to use a<br />
relational database and reload each time for a program<br />
test. Using LISP makes it possible to create and test<br />
small bits <strong>of</strong> code in an iterative fashion, a major reason<br />
for the productivity gains.<br />
This iterative, LISP-like program-programmer<br />
interaction with Clojure leads to what Hickey calls<br />
“dynamic development.” Any code entered in the<br />
console interface, he points out, is automatically<br />
compiled on the fly.<br />
Thrift<br />
Thrift, initially created at Facebook in 2007 and then<br />
released to open source, helps developers create<br />
services that communicate across languages, including<br />
C++, C#, Java, Perl, Python, PHP, Erlang, and Ruby.<br />
With Thrift, according to Facebook, users can “define<br />
all the necessary data structures and interfaces for a<br />
complex service in a single short file.”<br />
A more important aspect <strong>of</strong> Thrift, according to<br />
BackType’s Marz, is its ability to create strongly typed<br />
data and flexible schemas. Countering the emphasis <strong>of</strong><br />
the so-called noSQL community on schema-less data,<br />
Marz asserts there are effective ways to lightly structure<br />
the data in Hadoop—style analysis.<br />
Marz uses Thrift’s serialization features, which turn<br />
objects into a sequence <strong>of</strong> bits that can be stored as<br />
files, to create schemas between types (for instance,<br />
differentiating between text strings and long, 64-bit<br />
integers) and schemas between relationships (for<br />
instance, linking Twitter accounts that share a<br />
common interest). Structuring the data in this way<br />
helps BackType avoid inconsistencies in the data<br />
or the need to manually filter for some attributes.<br />
BackType can use required and optional fields to<br />
structure the Twitter messages it crawls and analyzes.<br />
The required fields can help enforce data type. The<br />
optional fields, meanwhile, allow changes to the<br />
schema as well as the use <strong>of</strong> old objects that were<br />
created using the old schema.<br />
30 PricewaterhouseCoopers Technology Forecast
Marz’s use <strong>of</strong> Thrift to model social graphs like the one<br />
in Figure 7 demonstrates the flexibility <strong>of</strong> the schema<br />
for Hadoop-style computing. Thrift essentially enables<br />
modularity in the social graph described in the schema.<br />
For example, to select a single age for each person,<br />
BackType can take into account all the raw age data.<br />
It can do this by a computation on the entire data set<br />
or a selective computation on only the people in the<br />
data set who have new data.<br />
Alice<br />
Gender female<br />
Age 25<br />
Bob<br />
Apache<br />
Thrift<br />
Gender male<br />
Age 39<br />
Charlie<br />
Gender male<br />
Age 22<br />
Language: C++<br />
Figure 7: An example <strong>of</strong> a social graph modeled using<br />
Thrift schema<br />
Source: Nathan Marz, 2010<br />
BackType doesn’t just work with raw data. It runs a<br />
series <strong>of</strong> jobs that constantly normalize and analyze<br />
new data coming in, and then other jobs that write the<br />
analyzed data to a scalable random-access database<br />
such as HBase or Cassandra. 12<br />
Open-source, non-relational data stores<br />
Non-relational data stores have become much more<br />
numerous since the Apache Hadoop project began in<br />
2007. Many are open source. Developers <strong>of</strong> these data<br />
stores have optimized each for a different kind <strong>of</strong> data.<br />
When contrasted with relational databases, these data<br />
stores lack many design features that can be essential<br />
for enterprise transactional data. However, they are<br />
<strong>of</strong>ten well tailored to specific, intended purposes,<br />
and they <strong>of</strong>fer the added benefit <strong>of</strong> simplicity. Primary<br />
non-relational data store types include the following:<br />
• Multidimensional map store—Each record<br />
maps a row name, a column name, and a time<br />
stamp to a value. Map stores have their heritage<br />
in Google’s <strong>Big</strong>table.<br />
• Key-value store—Each record consists <strong>of</strong> a key,<br />
or unique identifier, mapped to one or more values.<br />
• Graph store—Each record consists <strong>of</strong> elements that<br />
together form a graph. Graphs depict relationships.<br />
For example, social graphs describe relationships<br />
between people. Other graphs describe relationships<br />
between objects, between links, or both.<br />
• Document store—Each record consists <strong>of</strong> a<br />
document. Extensible Markup Language (XML)<br />
databases, for example, store XML documents.<br />
Because <strong>of</strong> their simplicity, map and key-value stores<br />
can have scalability advantages over most types <strong>of</strong><br />
relational databases. (HadoopDB, a hybrid approach<br />
developed at Yale University, is designed to overcome<br />
the scalability problems associated with relational<br />
databases.) Table 1 provides a few examples <strong>of</strong> the<br />
open-source, non-relational data stores that<br />
are available.<br />
Map Key-value Document Graph<br />
HBase Tokyo Cabinet/Tyrant MongoDB Resource Description Framework (RDF)<br />
Hypertable Project Voldemort CouchDB Neo4j<br />
Cassandra Redis Xindice InfoGrid<br />
Table 1: Example open-source, non-relational data stores<br />
Source: PricewaterhouseCoopers, Daniel Abadi <strong>of</strong> Yale University, and organization Web sites, 2010<br />
Building a bridge to the rest <strong>of</strong> your data 31
“We established that Hadoop does horizontally scale. This is what’s really<br />
exciting, because I’m an RDBMS guy, right? I’ve done that for years, and<br />
you don’t get that kind <strong>of</strong> constant scalability no matter what you do.”<br />
— Scott Thompson <strong>of</strong> Disney<br />
Other related technologies and vendors<br />
A comprehsensive review <strong>of</strong> the various tools created<br />
for the Hadoop ecosystem is beyond the scope <strong>of</strong> this<br />
article, but a few <strong>of</strong> the tools merit brief description here<br />
because they’ve been mentioned elsewhere in this issue:<br />
• Pig—A scripting language called Pig Latin, which is<br />
a primary feature <strong>of</strong> Apache Pig, allows more concise<br />
querying <strong>of</strong> data sets “directly from the console” than<br />
is possible using MapReduce, according to author<br />
Tom White.<br />
• Hive—Hive is designed as “mainly an ETL [extract,<br />
transform, and load] system” for use at Facebook,<br />
according to Chris Wensel.<br />
• Zookeeper—Zookeeper provides an interface<br />
for creating distributed applications, according<br />
to Apache.<br />
<strong>Big</strong> <strong>Data</strong> covers many vendor niches, and some<br />
vendors’ products take advantage <strong>of</strong> the Hadoop stack<br />
or add to its capabilities. (See the sidebar “Selected <strong>Big</strong><br />
<strong>Data</strong> tool vendors.”)<br />
Conclusion<br />
Interest in and adoption <strong>of</strong> Hadoop clusters are<br />
growing rapidly. Reasons for Hadoop’s<br />
popularity include:<br />
• Open, dynamic development—The Hadoop/<br />
MapReduce environment <strong>of</strong>fers cost-effective<br />
distributed computing to a community <strong>of</strong> opensource<br />
programmers who’ve grown up on Linux<br />
and Java, and scripting languages such as<br />
Perl and Python. Some are taking advantage <strong>of</strong><br />
functional programming language dialects such<br />
as Clojure. The openness and interaction can<br />
lead to faster development cycles.<br />
• Cost-effective scalability—Horizontal scaling from<br />
a low-cost base implies a feasible long-term cost<br />
structure for more kinds <strong>of</strong> data. Scott Thompson,<br />
vice president for infrastructure at the Disney<br />
Technology Shared Services Group, says, “We<br />
established that Hadoop does horizontally scale.<br />
This is what’s really exciting, because I’m an<br />
RDBMS guy, right? I’ve done that for years, and<br />
you don’t get that kind <strong>of</strong> constant scalability no<br />
matter what you do.”<br />
• Fault tolerance—Associated with scalability is<br />
the assumption that some nodes will fail. Hadoop<br />
and MapReduce are fault tolerant, another reason<br />
commodity hardware can be used.<br />
• Suitability for less-structured data—Perhaps<br />
most importantly, the methods that Google<br />
pioneered, and that Yahoo and others expanded,<br />
focus on what <strong>Cloudera</strong>’s Awadallah calls<br />
“complex” data. Although developers such as Marz<br />
understand the value <strong>of</strong> structuring data, most<br />
Hadoop/MapReduce developers don’t have a<br />
DBMS mentality. They have an NLP mentality, and<br />
they’re focused on techniques optimized for large<br />
amounts <strong>of</strong> less-structured information, such as the<br />
vast amount <strong>of</strong> information on the Web.<br />
The methods, cost advantages, and scalability <strong>of</strong><br />
Hadoop-style cluster computing clear a path for<br />
enterprises to analyze the <strong>Big</strong> <strong>Data</strong> they didn’t have<br />
the means to analyze before. This set <strong>of</strong> methods is<br />
separate from, yet complements, data warehousing.<br />
Understanding what Hadoop clusters do and how<br />
they do it is fundamental to deciding when and where<br />
enterprises should consider making use <strong>of</strong> them.<br />
32 PricewaterhouseCoopers Technology Forecast
Selected <strong>Big</strong> <strong>Data</strong> tool vendors<br />
Amazon<br />
Amazon provides a Hadoop framework on its<br />
Elastic Compute Cloud (EC2) and S3 storage<br />
service it calls Elastic MapReduce.<br />
Appistry<br />
Appistry’s CloudIQ Storage platform <strong>of</strong>fers a<br />
substitute for HDFS, one designed to eliminate the<br />
single point <strong>of</strong> failure <strong>of</strong> the NameNode.<br />
<strong>Cloudera</strong><br />
<strong>Cloudera</strong> takes a Red Hat approach to Hadoop,<br />
<strong>of</strong>fering its own distribution on EC2/S3 with<br />
management tools, training, support, and<br />
pr<strong>of</strong>essional services.<br />
Cloudscale<br />
Cloudscale’s first product, Cloudcel, marries an<br />
Excel-style front end to a back end that’s a modified<br />
HDFS. The product is designed to process stored,<br />
historical, or streamed data.<br />
Concurrent<br />
Concurrent developed Cascading, for which it<br />
<strong>of</strong>fers licensing, training, and support.<br />
Drawn to Scale<br />
Drawn to Scale <strong>of</strong>fers an HBase/HDFS storage<br />
platform and Hadoop ecosystem consulting<br />
and training.<br />
IBM<br />
IBM’s jStart team <strong>of</strong>fers briefings and workshops<br />
on Hadoop pilots. IBM <strong>Big</strong>Sheets acts as an<br />
aggregation, analysis, and visualization point for<br />
large amounts <strong>of</strong> Web data.<br />
Micros<strong>of</strong>t<br />
Micros<strong>of</strong>t Pivot uses the company’s Deep Zoom<br />
technology to provide visual data browsing<br />
capabilities for XML files. Azure Table services is<br />
in some ways comparable to <strong>Big</strong>table or HBase.<br />
(See the interview with Mark Taylor and Ray Velez<br />
<strong>of</strong> Razorfish on page 46.)<br />
ParaScale<br />
ParaScale <strong>of</strong>fers s<strong>of</strong>tware for enterprises to<br />
set up their own public or private cloud storage<br />
environments with parallel processing and<br />
large-scale data handling capability.<br />
1 FLOPS stands for “floating point operations per second.” Floating point<br />
processors use more bits to store each value, allowing more precision<br />
and ease <strong>of</strong> programming than fixed point processors. One petaflop is<br />
upwards <strong>of</strong> one quadrillion floating point operations per second.<br />
2 Brough Turner, “Google Surpasses Supercomputer Community,<br />
Unnoticed?” May 20, 2008, http://blogs.broughturner.com/<br />
communications/2008/05/google-surpasses-supercomputercommunity-unnoticed.html<br />
(accessed April 8, 2010).<br />
3 See, for example, Tim Kientzle, “Beowulf: Linux clustering,”<br />
Dr. Dobb’s Journal, November 1, 1998, Factiva Document<br />
dobb000020010916dub100045 (accessed April 9, 2010).<br />
4 Luis Barroso, Jeffrey Dean, and Urs Hoelzle, “Web Search for a<br />
Planet: The Google Cluster Architecture,” Google Research<br />
Publications, http://research.google.com/archive/googlecluster.html<br />
(accessed April 10, 2010).<br />
5 See http://sortbenchmark.org/ and http://developer.yahoo.net/blog/<br />
(accessed April 9, 2010).<br />
6 Tom White, Hadoop: The Definitive Guide (Sebastopol, CA: O’Reilly<br />
Media, 2009), 4.<br />
7 See Derek Gottfrid, “Self-service, Prorated Super Computing Fun!”<br />
The New York Times Open <strong>Blog</strong>, November 1, 2007, http://open.<br />
blogs.nytimes.com/2007/11/01/self-service-prorated-supercomputing-fun/<br />
(accessed March 23, 2010) and {Alan: Check this<br />
one. I ran a Google search and the author, article title, and date don’t<br />
match. Bill Snyder wrote another article on March 5, 2008. http://<br />
www.cio.com/article/192701/Cloud_Computing_Tales_from_the_<br />
Front } Bill Snyder, “Cloud Computing: Not Just Pie in the Sky,” CIO,<br />
March 5, 2008, Factiva Document CIO0000020080402e4350000<br />
(accessed March 28, 2010).<br />
8 See “HadoopDB” at http://db.cs.yale.edu/hadoopdb/hadoopdb.html<br />
(accessed April 11, 2010).<br />
9 Nathan Marz, “Thrift + Graphs = Strong, flexible schemas on<br />
Hadoop,” http://nathanmarz.com/blog/schemas-on-hadoop/<br />
(accessed April 11, 2010).<br />
10 Jeffrey Dean and Sanjay Ghemawat, “MapReduce: Simplified <strong>Data</strong><br />
Processing on Large Clusters,” Google Research Publications,<br />
December 2004, http://labs.google.com/papers/mapreduce.html<br />
(accessed April 22, 2010).<br />
11 See Dean, et al., US Patent No. 7,650,331, January 19, 2010, at http://<br />
www.uspto.gov. For an example <strong>of</strong> the participation by Google and<br />
IBM in Hadoop’s development, see “Google and IBM Announce<br />
University Initiative to Address Internet-Scale Computing Challenges,”<br />
Google press release, October 8, 2007, http://www.google.com/intl/en/<br />
press/pressrel/20071008_ibm_univ.html (accessed March 28, 2010).<br />
12 See the Apache site at http://apache.org/ for descriptions <strong>of</strong> many<br />
tools that take advantage <strong>of</strong> MapReduce and/or HDFS that are not<br />
pr<strong>of</strong>iled in this article.<br />
Building a bridge to the rest <strong>of</strong> your data 33
Hadoop’s foray<br />
into the enterprise<br />
<strong>Cloudera</strong>’s Amr Awadallah discusses how and why<br />
diverse companies are trying this novel approach.<br />
Interview conducted by Alan Morrison, Bo Parker, and Vinod Baya<br />
Amr Awadallah is vice president, engineering and chief technology <strong>of</strong>ficer at <strong>Cloudera</strong>,<br />
a company that <strong>of</strong>fers products and services around Hadoop, an open-source<br />
technology that allows efficient mining <strong>of</strong> large, complex data sets. In this interview,<br />
Awadallah provides an overview <strong>of</strong> Hadoop’s capabilities and how <strong>Cloudera</strong> customers<br />
are using them.<br />
PwC: Were you at Yahoo before coming<br />
to <strong>Cloudera</strong>?<br />
AA: Yes. I was with Yahoo from mid-2000 until mid-<br />
2008, starting with the Yahoo Shopping team after<br />
selling my company VivaSmart to Yahoo. Beginning in<br />
2003, my career shifted toward business intelligence<br />
and analytics at consumer-facing properties such as<br />
Yahoo News, Mail, Finance, Messenger, and Search.<br />
I had the daunting task <strong>of</strong> building a very large data<br />
warehouse infrastructure that covered all these diverse<br />
products and figuring out how to bring them together.<br />
That is when I first experienced Hadoop. Its model <strong>of</strong><br />
“mine first, govern later” fits in with the well-governed<br />
infrastructure <strong>of</strong> a data mart, so it complements these<br />
systems very well. Governance standards are important<br />
for maintaining a common language across the<br />
organization. However, they do inhibit agility, so it’s best<br />
to complement a well-governed data mart with a more<br />
agile complex data processing system like Hadoop.<br />
PwC: How did Yahoo start using Hadoop?<br />
AA: In 2005, Yahoo was faced with a business<br />
challenge. The cost <strong>of</strong> creating the Web search index<br />
was approaching the revenues being made from the<br />
keyword advertising on the search pages. Yahoo Search<br />
adopted Hadoop as an economically scalable solution,<br />
and worked on it in conjunction with the open-source<br />
Apache Hadoop community. Yahoo played a very big<br />
role in the evolution <strong>of</strong> Hadoop to where it is today.<br />
Soon after the Yahoo Search team started using<br />
Hadoop, other parts <strong>of</strong> the company began to see<br />
the power and flexibility that this system <strong>of</strong>fers.<br />
Today Yahoo uses Hadoop for data warehousing,<br />
mail spam detection, news feed processing, and<br />
content/ad targeting.<br />
PwC: What are some <strong>of</strong> the advantages <strong>of</strong><br />
Hadoop when you compare it with RDBMSs<br />
[relational database management systems]?<br />
AA: With Oracle, Teradata, and other RDBMSs, you<br />
must create the table and schema first. You say, this is<br />
what I’m going to be loading in, these are the types <strong>of</strong><br />
columns I’m going to load in, and then you load your<br />
data. That process can inhibit how fast you can evolve<br />
your data model and schemas, and it can limit what you<br />
log and track.<br />
With Hadoop, it’s the other way around. You load all <strong>of</strong><br />
your data, such as XML [Extensible Markup Language],<br />
tab delimited flat files, Apache log files, JSON<br />
[Javascript Object Notation], etc. Then in Hive or Pig<br />
[both <strong>of</strong> which are Hadoop <strong>Data</strong> Query Tools], you point<br />
your metadata toward the file and parse the data on<br />
34 PricewaterhouseCoopers Technology Forecast
“We are not talking about a replacement technology for datawarehouses—<br />
let’s be clear on this. No customers are using Hadoop in that fashion.”<br />
the fly when reading it out. This approach lets you<br />
extract the columns that map to the data structure<br />
you’re interested in.<br />
Creating the structure on the read path like this can<br />
have its disadvantages; however, it gives you the agility<br />
and the flexibility to evolve your schema much quicker<br />
without normalizing your data first. In general, relational<br />
systems are not well suited for quickly evolving complex<br />
data types.<br />
Another benefit is retroactive schemas. For example,<br />
an engineer launching a new product feature can add<br />
the logging for it, and that new data will start flowing<br />
directly into Hadoop. Weeks or months later, a data<br />
analyst can update their read schema on how to parse<br />
this new data. Then they will immediately be able to<br />
query the history <strong>of</strong> this metric since it started flowing<br />
in [as opposed to waiting for the RDBMS schema to be<br />
updated and the ETL processes to reload the full history<br />
<strong>of</strong> that metric].<br />
PwC: What about the cost advantages?<br />
AA: The cost basis is 10 to 100 times cheaper than<br />
other solutions. But it’s not just about cost. Relational<br />
databases are really good at what they were designed<br />
for, which is running interactive SQL queries against<br />
well-structured data. We are not talking about a<br />
replacement technology for data warehouses—let’s be<br />
clear on this.<br />
No customers are using Hadoop in that fashion. They<br />
recognize that the nature <strong>of</strong> data is changing. Where is<br />
the data growing? It’s growing around complex data<br />
types. Is a relational container the best and most<br />
interesting place to ask questions <strong>of</strong> complex plus<br />
relational data? Probably not, although organizations<br />
still need to use, collect, and present relational data<br />
for questions that are routine and require, in some<br />
cases, a real-time response.<br />
PwC: How have companies benefited<br />
from querying across both structured and<br />
complex data?<br />
AA: When you query against complex data types, such<br />
as Web log files and customer support forums, as well<br />
as against the structured data you have already been<br />
collecting, such as customer records, sales history, and<br />
transactions, you get a much more accurate answer to<br />
the question you’re asking. For example, a large credit<br />
card company we’ve worked with can identify which<br />
transactions are most likely fraudulent and can prioritize<br />
which accounts need to be addressed.<br />
PwC: Are the companies you work with aware<br />
that this is a totally different paradigm?<br />
AA: Yes and no. The main use case we see is in<br />
companies that have a mix <strong>of</strong> complex data and<br />
structured data that they want to query across. Some<br />
large financial institutions that we talk to have 10, 20,<br />
or even hundreds <strong>of</strong> Oracle systems—it’s amazing.<br />
They have all <strong>of</strong> these file servers storing XML files or<br />
log files, and they want to consolidate all these tables<br />
and files onto one platform that can handle both data<br />
types so they can run comprehensive queries. This is<br />
where Hadoop really shines; it allows companies to<br />
run jobs across both data types. •<br />
Hadoop’s foray into the enterprise 35
Revising the CIO’s<br />
data playbook<br />
Start by adopting a fresh mind-set, grooming the right talent,<br />
and piloting new tools to ride the next wave <strong>of</strong> innovation.<br />
By Jimmy Guterman<br />
36 PricewaterhouseCoopers Technology Forecast
Like pioneers exploring a new territory, a few<br />
enterprises are making discoveries by exploring <strong>Big</strong><br />
<strong>Data</strong>. The terrain is complex and far less structured<br />
than the data CIOs are accustomed to. And it is<br />
growing by exabytes each year. But it is also getting<br />
easier and less expensive to explore and analyze, in<br />
part because s<strong>of</strong>tware tools built to take advantage<br />
<strong>of</strong> cloud computing infrastructures are now available.<br />
Our advice to CIOs: You don’t need to rush, but do<br />
begin to acquire the necessary mind-set, skill set,<br />
and tool kit.<br />
These are still the early days. The prime directive<br />
for any CIO is to deliver value to the business through<br />
technology. One way to do that is to integrate new<br />
technologies in moderation, with a focus on the<br />
long-term opportunities they may yield. Leading<br />
CIOs pride themselves on waiting until a technology<br />
has proven value before they adopt it. Fair enough.<br />
However, CIOs who ignore the <strong>Big</strong> <strong>Data</strong> trends<br />
described in the first two articles risk being<br />
marginalized in the C-suite. As they did with earlier<br />
technologies, including traditional business<br />
intelligence, business unit executives are ready to<br />
seize the <strong>Big</strong> <strong>Data</strong> opportunity and make it their own.<br />
This will be good for their units and their careers,<br />
but it would be better for the organization as a whole<br />
if someone—the CIO is the natural person—drove a<br />
single, central, cross-enterprise <strong>Big</strong> <strong>Data</strong> initiative.<br />
With this in mind, PricewaterhouseCoopers<br />
encourages CIOs to take these steps:<br />
• Start to add the discipline and skill set for <strong>Big</strong> <strong>Data</strong><br />
to your organizations; the people for this may or<br />
may not come from existing staff.<br />
• Set up sandboxes (which you can rent or buy) to<br />
experiment with <strong>Big</strong> <strong>Data</strong> technologies.<br />
• Understand the open-source nature <strong>of</strong> the tools<br />
and how to manage risk.<br />
Enterprises have the opportunity to analyze more<br />
kinds <strong>of</strong> data more cheaply than ever before. It is<br />
also important to remember that <strong>Big</strong> <strong>Data</strong> tools did<br />
snot originate with vendors that were simply trying to<br />
create new markets. The tools sprung from a real<br />
need among the enterprises that first confronted<br />
the scalability and cost challenges <strong>of</strong> <strong>Big</strong> <strong>Data</strong>—<br />
challenges that are now felt more broadly. These<br />
pioneers also discovered the need for a wider variety<br />
<strong>of</strong> talent than IT has typically recruited.<br />
Enterprises have the opportunity to analyze more kinds <strong>of</strong> data<br />
more cheaply than ever before. It is also important to remember<br />
that <strong>Big</strong> <strong>Data</strong> tools did not originate with vendors that were simply<br />
trying to create new markets.<br />
Revising the CIO’s data playbook 37
<strong>Big</strong> <strong>Data</strong> lessons from Web companies<br />
Today’s CIO literature is full <strong>of</strong> lessons you can learn<br />
from companies such as Google. Some <strong>of</strong> the<br />
comparisons are superficial because most companies<br />
do not have a Web company’s data complexities and<br />
will never attain the original singleness <strong>of</strong> purpose<br />
that drove Google, for example, to develop <strong>Big</strong> <strong>Data</strong><br />
innovations. But there is no niche where the<br />
development <strong>of</strong> <strong>Big</strong> <strong>Data</strong> tools, techniques, mind-set,<br />
and usage is greater than in companies such as<br />
Google, Yahoo, Facebook, Twitter, and LinkedIn.<br />
And there is plenty that CIOs can learn from these<br />
companies. Every major service these companies<br />
create is built on the idea <strong>of</strong> extracting more and more<br />
value from more and more data.<br />
For example, the 1-800-GOOG-411 service, which<br />
individuals can call to get telephone numbers and<br />
addresses <strong>of</strong> local businesses, does not merely take<br />
an ax to the high-margin directory assistance services<br />
run by incumbent carriers (although it does that).<br />
That is just a by-product. More important, the<br />
800-number service has let Google compile what has<br />
been described as the world’s largest database <strong>of</strong><br />
spoken language. Google is using that database to<br />
improve the quality <strong>of</strong> voice recognition in Google<br />
Voice, in its sundry mobile-phone applications, and in<br />
other services under development. Some <strong>of</strong> the ways<br />
companies such as Google capture data and convert<br />
it into services are listed in Table 1.<br />
Service<br />
Self-serve advertising<br />
Analytics<br />
Social networking<br />
Browser<br />
E-mail<br />
Search engine<br />
RSS feeds<br />
Extra browser functionality<br />
View videos<br />
Free directory assistance<br />
<strong>Data</strong> that Web companies capture<br />
Ad-clicking and -picking behavior<br />
Aggregated Web site usage tracking<br />
Sundry online<br />
Limited browser behaviors<br />
Words used in e-mails<br />
Searches and clicking information<br />
Detailed reading habits<br />
All browser behavior<br />
All site behavior<br />
<strong>Data</strong>base <strong>of</strong> spoken words<br />
Table 1: Web portal <strong>Big</strong> <strong>Data</strong> strategy<br />
Source: PricewaterhouseCoopers, 2010<br />
38 PricewaterhouseCoopers Technology Forecast
“I see inspiration from the Google model ...just having lots <strong>of</strong><br />
cheap stuff that you can use to crunch vast quantities <strong>of</strong> data.”<br />
— Phil Buckle, CIO, UK NPIA<br />
Many Web companies are finding opportunity in “gray<br />
data.” Gray data is the raw and unvalidated data that<br />
arrives from various sources, in huge quantities, and not<br />
in the most usable form. Yet gray data can deliver value<br />
to the business even if the generators <strong>of</strong> that content<br />
(for example, people calling directory assistance) are<br />
contributing that data for a reason far different from<br />
improving voice-recognition algorithms. They just want<br />
the right phone number; the data they leave is a gift to<br />
the company providing the service.<br />
The new technologies and services described in the<br />
article, “Building a bridge to the rest <strong>of</strong> your data,” on<br />
page 22 are making it possible to search for enterprise<br />
value in gray data in agile ways at low cost. Much <strong>of</strong><br />
this value is likely to be in the area <strong>of</strong> knowing your<br />
customers, a sure path for CIOs looking for ways to<br />
contribute to company growth and deepen their<br />
relationships with the rest <strong>of</strong> the C-suite.<br />
What Web enterprise use <strong>of</strong> <strong>Big</strong> <strong>Data</strong> shows<br />
CIOs, most <strong>of</strong> all, is that there is a way to think and<br />
manage differently when you conclude that standard<br />
transactional data analysis systems are not and<br />
should not be the only models. New models are<br />
emerging. CIOs who recognize these new models<br />
without throwing away the legacy systems that still<br />
serve them well will see that having more than one<br />
tool set, one skill set, and one set <strong>of</strong> controls makes<br />
their organizations more sophisticated, more agile,<br />
less expensive to maintain, and more valuable to<br />
the business.<br />
The business case<br />
Besides Google, Yahoo, and other Web-based<br />
enterprises that have complex data sets, there are<br />
stories <strong>of</strong> brick and mortar organizations that will be<br />
making more use <strong>of</strong> <strong>Big</strong> <strong>Data</strong>. For example, Rollin Ford,<br />
Wal-Mart’s CIO, told The Economist earlier this year,<br />
“Every day I wake up and ask, ‘How can I flow data<br />
better, manage data better, analyze data better?’”<br />
The answer to that question today implies a budget<br />
reallocation, with less-expensive hardware and s<strong>of</strong>tware<br />
carrying more <strong>of</strong> the load. “I see inspiration from the<br />
Google model and the notion <strong>of</strong> moving into<br />
commodity-based computing—just having lots <strong>of</strong><br />
cheap stuff that you can use to crunch vast quantities<br />
<strong>of</strong> data. I think that really contrasts quite heavily with<br />
the historic model <strong>of</strong> paying lots <strong>of</strong> money for really<br />
specialist stuff,” says Phil Buckle, CIO <strong>of</strong> the UK’s<br />
National Policing Improvement Agency, which oversees<br />
law enforcement infrastructure nationwide. That’s a new<br />
mind-set for the CIO, who ordinarily focuses on keeping<br />
the plumbing and the data it carries safe, secure,<br />
in-house, and functional.<br />
Seizing the <strong>Big</strong> <strong>Data</strong> initiative would give CIOs in<br />
particular and IT in general more clout in the executive<br />
suite. But are CIOs up to the task? “It would be a<br />
positive if IT could harness unstructured data<br />
effectively,” former Gartner analyst Howard Dresner,<br />
CEO <strong>of</strong> Dresner Advisory Services, observes. “However,<br />
they haven’t always done a great job with structured<br />
data, and unstructured is far more complex and exists<br />
predominately outside the firewall and beyond<br />
their control.”<br />
Tools are not the issue. Many evolving tools, as noted<br />
in the previous article, come from the open-source<br />
community; they can be downloaded and experimented<br />
with for low cost and are certainly up to supporting<br />
any pilot project. More important is the aforementioned<br />
mind-set and a new kind <strong>of</strong> talent IT will need.<br />
Revising the CIO’s data playbook 39
“The talent demand isn’t so much for Java developers or statisticians<br />
per se as it is for people who know how to work with denormalized<br />
data.” — Ray Velez <strong>of</strong> Razorfish<br />
To whom does the future <strong>of</strong> IT belong?<br />
The ascendance <strong>of</strong> <strong>Big</strong> <strong>Data</strong> means that CIOs need a<br />
more data-centric approach. But what kind <strong>of</strong> talent<br />
can help a CIO succeed in a more data-centric business<br />
environment, and what specific skills do the CIO’s<br />
teams focused on the area need to develop<br />
and balance?<br />
Hal Varian, a University <strong>of</strong> California, Berkeley, pr<strong>of</strong>essor<br />
and Google’s chief economist, says, “The sexy job in<br />
the next 10 years will be statisticians.” He and others,<br />
such as IT and management pr<strong>of</strong>essor Erik Brynjolfsson<br />
at the Massachusetts Institute <strong>of</strong> Technology (MIT),<br />
contend this demand will happen because the amount<br />
<strong>of</strong> data to be analyzed is out <strong>of</strong> control. Those who<br />
can make sense <strong>of</strong> the flood will reap the greatest<br />
rewards. They have a point, but the need is not just<br />
for statisticians—it’s for a wide range <strong>of</strong> analytically<br />
minded people.<br />
Today, larger companies still need staff with expertise<br />
in package implementations and customizations,<br />
systems integration, and business process<br />
reengineering, as well as traditional data management<br />
and business intelligence that’s focused on<br />
transactional data. But there is a growing role for<br />
people with flexible minds to analyze data and suggest<br />
solutions to problems or identify opportunities from<br />
that data.<br />
In Silicon Valley and elsewhere, where businesses such<br />
as Google, Facebook, and Twitter are built on the<br />
rigorous and speedy analysis <strong>of</strong> data, programming<br />
frameworks such as MapReduce (which works with<br />
Hadoop) and NoSQL (a database approach for nonrelational<br />
data stores) are becoming more popular.<br />
Chris Wensel, who created Cascading (an alternative<br />
application programming interface [API] to MapReduce)<br />
and straddles the worlds <strong>of</strong> startups and entrenched<br />
companies, says, “When I talk to CIOs, I tell them:<br />
‘You know those people you have who know about<br />
data. You probably don’t use those people as much<br />
as you should. But once you take advantage <strong>of</strong> that<br />
expertise and reallocate that talent, you can take<br />
advantage <strong>of</strong> these new techniques.’”<br />
The increased emphasis on data analysis does not<br />
mean that traditional programmers will be replaced by<br />
quantitative analysts or data warehouse specialists.<br />
“The talent demand isn’t so much for Java developers<br />
or statisticians per se as it is for people who know how<br />
to work with denormalized data,” says Ray Velez, CTO<br />
at Razorfish, an interactive marketing and technology<br />
consulting firm involved in many <strong>Big</strong> <strong>Data</strong> initiatives.<br />
“It’s about understanding how to map data into a format<br />
that most people are not familiar with. Most people<br />
understand SQL and the relational format, so the real<br />
skill set evolution doesn’t have quite as much to do with<br />
whether it’s Java or Python or other technologies.”<br />
Velez points to Bill James as a useful case. James, a<br />
baseball writer and statistician, challenged conventional<br />
wisdom by taking an exploratory mind-set to baseball<br />
statistics. He literally changed how baseball<br />
management makes talent decisions, and even how<br />
they manage on the field. In fact, James became senior<br />
adviser for baseball operations in the Boston Red Sox’s<br />
front <strong>of</strong>fice.<br />
40 PricewaterhouseCoopers Technology Forecast
For example, James showed that batting average is<br />
less an indicator <strong>of</strong> a player’s future success than<br />
how <strong>of</strong>ten he’s involved in scoring runs—getting on<br />
base, advancing runners, or driving them in. In this<br />
example and many others, James used his knowledge<br />
<strong>of</strong> the topic, explored the data, asked questions no<br />
one had asked, and then formulated, tested, and<br />
refined hypotheses.<br />
Says Velez: “Our analytics team within Razorfish has<br />
the James types <strong>of</strong> folks who can help drive different<br />
thinking and envision possibilities with the data. We<br />
need to find a lot more <strong>of</strong> those people. They’re not<br />
very easy to find. There is an aspect <strong>of</strong> James that<br />
just has to do with boldness and courage, a willingness<br />
to challenge those who are in the habit <strong>of</strong> using<br />
metrics they’ve been using for years.”<br />
The CIO will need people throughout the organization<br />
who have all sorts <strong>of</strong> relevant analysis and coding skills,<br />
who understand the value <strong>of</strong> data, and who are not<br />
afraid to explore. This does not mean the end <strong>of</strong> the<br />
technology- or application-centric organizational chart<br />
<strong>of</strong> the typical IT organization. Rather, it means the<br />
addition <strong>of</strong> a data-exploration dimension that is more<br />
than one or two people. These people will be using a<br />
blend <strong>of</strong> tools that differ depending on requirements,<br />
as Table 2 illustrates. More <strong>of</strong> the tools will be open<br />
source than in the past.<br />
Skills Tools (a sampler) Comments<br />
Natural language processing<br />
and text mining<br />
Clojure, Redis, Scala, Crane, other<br />
Java functional language libraries,<br />
Python Natural Language ToolKit<br />
To some extent, each <strong>of</strong> these serves as<br />
a layer <strong>of</strong> abstraction on top <strong>of</strong> Hadoop.<br />
Those familiar keep adding layers on top <strong>of</strong><br />
layers. FlightCaster, for example, uses a<br />
stack consisting <strong>of</strong> Amazon S3 -> Amazon<br />
EC2 -> <strong>Cloudera</strong> -> HDFS -> Hadoop -><br />
Cascading -> Clojure 1<br />
<strong>Data</strong> mining R, Mathlab R is more suited to finance and statistics,<br />
whereas Mathlab is more engineering<br />
oriented. 2<br />
Scripting and NoSQL<br />
database programming skills<br />
Python and related frameworks,<br />
HBase, Cassandra, CouchDB,<br />
Tokyo Cabinet<br />
These lend themselves to or are based on<br />
the functional languages mentioned above.<br />
CouchDB, for example, is written in Erlang 3<br />
“Erlang, another functional programming<br />
language comparable to LISP (see<br />
discussion <strong>of</strong> Clojure and LISP on page 30).<br />
Table 2: New skills and tools for the IT department<br />
Source: Cited online postings and PricewaterhouseCoopers, 2008–2010<br />
1<br />
Pete Skomoroch, “How FlightCaster Squeezes Predictions from Flight <strong>Data</strong>,” <strong>Data</strong> Wrangling blog, August 24, 2009,<br />
http://www.datawrangling.com/how-flightcaster-squeezes-predictions-from-flight-data (accessed May 14, 2010).<br />
2<br />
Brendan O’Connor, “Comparison <strong>of</strong> data analysis packages,” AI and Social Science blog, February 23, 2009,<br />
http://anyall.org/blog/2009/02/comparison-<strong>of</strong>-data-analysis-packages-r-matlab-scipy-excel-sas-spss-stata/,<br />
accessed May 25, 2010.<br />
3<br />
Scripting languages such as Python run more slowly than Java, but developers sometimes make the trade<strong>of</strong>f<br />
to increase their own productivity. Some companies have created their own frameworks and released these<br />
to open source. See Klaas Bosteels, “ Python + Hadoop = Flying Circus Elephant,” Last.HQ Last.fm blog,<br />
May 29, 2008, http://blog.last.fm/2008/05/29/python-hadoop-flying-circus-elephant (accessed May 14, 2010).<br />
Revising the CIO’s data playbook 41
“Every technology department has a skunkworks, no matter how<br />
informal—a sandbox where they can test and prove technologies.<br />
That’s how open source entered our organization. A small Hadoop<br />
installation might be a gateway that leads you to more open source.<br />
But it might turn out to be a neat little open-source project that<br />
sits by itself and doesn’t bother anything else.” —CIO at a small<br />
Massachusetts company<br />
Where do CIOs find such talent? Start with your own<br />
enterprise. For example, business analysts managing<br />
the marketing department’s lead-generation systems<br />
could be promoted onto an IT data staff charged with<br />
exploring the data flow. Most large consumer-oriented<br />
companies already have people in their business units<br />
who can analyze data and suggest solutions to<br />
problems or identify opportunities. These people need<br />
to be groomed and promoted, and more <strong>of</strong> them hired<br />
for IT, to enable the entire organization, not just the<br />
marketing department, to reap the riches.<br />
Set up a sandbox<br />
Although the business case CIOs can make for <strong>Big</strong> <strong>Data</strong><br />
is inarguable, even inarguable business cases carry<br />
some risk. Many CIOs will look at the risks associated<br />
with <strong>Big</strong> <strong>Data</strong> and find a familiar canard. Many <strong>Big</strong> <strong>Data</strong><br />
technologies—Hadoop in particular—are open source,<br />
and open source is <strong>of</strong>ten criticized for carrying too<br />
much risk.<br />
The open-source versus proprietary technology<br />
argument is nothing new. CIOs who have tried to<br />
implement open-source programs, from the Apache<br />
Web server to the Drupal content-management system,<br />
have faced the usual arguments against code being<br />
available to all comers. Some <strong>of</strong> those arguments,<br />
especially concerns revolving around security and<br />
reliability, verge on the specious. Google built its internal<br />
Web servers atop Apache. And it would be difficult to<br />
find a <strong>Big</strong> <strong>Data</strong> site as reliable as Google’s.<br />
Clearly, one challenge CIOs face has nothing to do<br />
with data or skill sets. Open-source projects become<br />
available earlier in their evolution than do proprietary<br />
alternatives. In this respect, <strong>Big</strong> <strong>Data</strong> tools are less<br />
stable and complete than are Apache or Linux<br />
open-source tools kits.<br />
Introducing an open-source technology such as<br />
Hadoop into a mostly proprietary environment does<br />
not necessarily mean turning the organization upside<br />
down. A CIO at a small Massachusetts company says,<br />
“Every technology department has a skunkworks, no<br />
matter how informal—a sandbox where they can test<br />
and prove technologies. That’s how open source<br />
entered our organization. A small Hadoop installation<br />
might be a gateway that leads you to more open<br />
source. But it might turn out to be a neat little opensource<br />
project that sits by itself and doesn’t bother<br />
anything else. Either can be OK, depending on the<br />
needs <strong>of</strong> your company.”<br />
Bud Albers, executive vice president and CTO <strong>of</strong><br />
Disney Technology Shared Services Group, concurs.<br />
“It depends on your organizational mind-set,” he says.<br />
“It depends on your organizational capability. There<br />
is a certain ‘don’t try this at home’ kind <strong>of</strong> warning<br />
that goes with technologies like Hadoop. You have to<br />
be willing at this stage <strong>of</strong> its maturity to maybe have<br />
a little higher level <strong>of</strong> capability to go in.”<br />
42 PricewaterhouseCoopers Technology Forecast
PricewaterhouseCoopers agrees with those sentiments<br />
and strongly urges large enterprises to establish a<br />
sandbox dedicated to <strong>Big</strong> <strong>Data</strong> and Hadoop/<br />
MapReduce. This move should be standard operating<br />
procedure for large companies in 2010, as should a<br />
small, dedicated staff <strong>of</strong> data explorers and modest<br />
budget for the efforts. For more information on what<br />
should be in your sandbox, refer to the article, “Building<br />
a bridge to the rest <strong>of</strong> your data,” on page 22.<br />
And for some ideas on how the sandbox could fit in<br />
your org chart, see Figure 1.<br />
VP <strong>of</strong> IT<br />
Director <strong>of</strong> application development<br />
Director <strong>of</strong> data analysis<br />
<strong>Data</strong> analysis<br />
team<br />
<strong>Data</strong><br />
exploration<br />
team<br />
Marketing<br />
manager<br />
Web site<br />
manager<br />
Sales<br />
manager<br />
Operations<br />
manager<br />
Finance<br />
manager<br />
Figure 1: Where a data exploration team might fit in an<br />
organization chart<br />
Source: PricewaterhouseCoopers, 2010<br />
Different companies will want to experiment with<br />
Hadoop in different ways, or segregate it from the rest<br />
<strong>of</strong> the IT infrastructure with stronger or weaker walls.<br />
The CIO must determine how to encourage this kind<br />
<strong>of</strong> experimentation.<br />
Understand and manage the risks<br />
Some <strong>of</strong> the risks associated with <strong>Big</strong> <strong>Data</strong> are<br />
legitimate, and CIOs must address them. In the case <strong>of</strong><br />
Hadoop clusters, security is a pressing question: it was<br />
a feature added as the project developed, not cooked<br />
in from the beginning. It’s still far from perfect. Many<br />
open-source projects start as cool projects intended to<br />
prove a concept or solve a particular problem. Some,<br />
such as Linux or Mozilla, become massive successes,<br />
but they rarely start with the sort <strong>of</strong> requirements a CIO<br />
faces when introducing systems to corporate settings.<br />
Beyond open source, regardless <strong>of</strong> which tools are<br />
used to manipulate data, there are always risks<br />
associated with making decisions based on the analysis<br />
<strong>of</strong> <strong>Big</strong> <strong>Data</strong>. To give one dramatic example, the recent<br />
financial crisis was caused in part by banks and rating<br />
agencies whose models for understanding value at risk<br />
and the potential for securities based on subprime<br />
mortgages to fail were flat-out wrong. Just as there is<br />
risk in data that is not sufficiently clean, there is risk<br />
in data manipulation techniques that have not been<br />
sufficiently vetted. Many times, the only way to<br />
understand big, complicated data is through the use<br />
<strong>of</strong> big, complicated algorithms, which leaves a door<br />
open to big, catastrophic mistakes in analysis. Table 3<br />
includes a list <strong>of</strong> the risks associated with <strong>Big</strong> <strong>Data</strong><br />
analysis and ways to mitigate them.<br />
Revising the CIO’s data playbook 43
Risk<br />
Over-reliance on insights gleaned from<br />
data analysis leads to loss<br />
Inaccurate or obsolete data<br />
Analysis leads to paralysis<br />
Security<br />
Buggy code and other glitches<br />
Rejection by other parts <strong>of</strong><br />
the organization<br />
Mitigation tactic<br />
Testing<br />
Maintains strong metadata management; unverified information must be flagged<br />
Keep the sandbox related to the business problem or opportunity<br />
Keep the Hadoop clusters away from the firewall, be vigilant, ask chief security<br />
<strong>of</strong>ficer for help<br />
Make sure the team keeps track <strong>of</strong> modifications and other implementation<br />
history, since documentation isn’t plentiful<br />
Do change management to help improve the odds <strong>of</strong> acceptance,<br />
along with quick successes<br />
Table 3: How to mitigate the risks <strong>of</strong> <strong>Big</strong> <strong>Data</strong> analysis<br />
Source: PricewaterhouseCoopers, 2010<br />
By nature and by work experiences, most CIOs are<br />
risk averse. Blue-chip CIOs hold <strong>of</strong>f installing new versions <strong>of</strong> s<strong>of</strong>tware until they have been proven beyond a<br />
doubt, and these CIOs don’t standardize<br />
on new platforms until the risk for change appears to<br />
be less than the risk <strong>of</strong> stasis.<br />
“The fundamental issue is whether IT is willing to<br />
depart from the status quo, such as an RDBMS<br />
[relational database management system], in favor<br />
<strong>of</strong> more powerful technologies,” Dresner says.<br />
“This means massive change, and IT doesn’t<br />
always embrace change.” More forward-thinking IT<br />
organizations constantly review their s<strong>of</strong>tware<br />
portfolio and adjust accordingly.<br />
In this case, the need to manipulate larger and larger<br />
amounts <strong>of</strong> data that companies are collecting is<br />
pressing. Even risk-averse CIOs are exploring the<br />
possibilities <strong>of</strong> <strong>Big</strong> <strong>Data</strong> for their businesses. Bernard<br />
(Bud) Mathaisel, CIO <strong>of</strong> the outsourcing vendor<br />
Achievo, divides the risks <strong>of</strong> <strong>Big</strong> <strong>Data</strong> and their<br />
solutions into three areas:<br />
• Accessibility—data repository used for data<br />
analysis should be access managed<br />
• Classification—Gray data should be identified<br />
as such<br />
• Governance—Who’s doing what with this?<br />
Yes, <strong>Big</strong> <strong>Data</strong> is new. But accessibility, classification,<br />
and governance are matters CIOs have had to deal<br />
with for many years in many guises.<br />
44 PricewaterhouseCoopers Technology Forecast
Conclusion<br />
At many companies, <strong>Big</strong> <strong>Data</strong> is both an opportunity<br />
(what useful needles can we find in a terabyte-sized<br />
haystack?) and a source <strong>of</strong> stress (<strong>Big</strong> <strong>Data</strong> is<br />
overwhelming our current tools and methods; they<br />
don’t scale up to meet the challenge). The prefix<br />
“tera” in “terabyte,” after all, comes from the Greek<br />
word for “monster.” CIOs aiming to use <strong>Big</strong> <strong>Data</strong> to<br />
add value to their businesses are monster slayers.<br />
CIOs don’t just manage hardware and s<strong>of</strong>tware now;<br />
they’re expected to manage the data stored in that<br />
hardware and used by that s<strong>of</strong>tware—and provide a<br />
framework for delivering insights from the data.<br />
From Amazon.com to the Boston Red Sox, diverse<br />
companies compete based on what data they collect<br />
and what they learn from it. CIOs must deliver easy,<br />
reliable, secure access to that data and develop<br />
consistent, trustworthy ways to explore and wrench<br />
wisdom from that data. CIOs do not need to rush, but<br />
they do need to be prepared for the changes that <strong>Big</strong><br />
<strong>Data</strong> is likely to require.<br />
Perhaps the most productive way for CIOs to frame the<br />
issue is to acknowledge that <strong>Big</strong> <strong>Data</strong> isn’t merely a<br />
new model; it’s a new way to think about all data<br />
models. <strong>Big</strong> <strong>Data</strong> isn’t merely more data; it is different<br />
data that requires different tools. As more and more<br />
internal and external sources cast <strong>of</strong>f more and more<br />
data, basic notions about the size and attributes <strong>of</strong> data<br />
sets are likely to change. With those changes, CIOs will<br />
be expected to capture more data and deliver it to the<br />
executive team in a manner that reveals the business—<br />
and how to grow it—in new ways.<br />
Web companies have set the bar high already. John<br />
Avery, a partner at Sungard Consulting, points to the<br />
YouTube example: “YouTube’s ability to index a data<br />
store <strong>of</strong> such immense size and then accrete additional<br />
analysis on top <strong>of</strong> that, as an ongoing process with no<br />
foresight into what those analyses would look like when<br />
the data was originally stored, is very, very impressive.<br />
That is something that has challenged folks in financial<br />
technology for years.”<br />
As companies with a history <strong>of</strong> cautious data policies<br />
begin to test and embrace Hadoop, MapReduce, and<br />
the like, forward-looking CIOs will turn to the issues that<br />
will become more important as <strong>Big</strong> <strong>Data</strong> becomes the<br />
norm. The communities arising around Hadoop (and the<br />
inevitable open-source and proprietary competitors that<br />
follow) will grow and become influential, inspiring more<br />
CIOs to become more data-centric. The pr<strong>of</strong>usion <strong>of</strong><br />
new data sources will lead to dramatic growth in the<br />
use and diversity <strong>of</strong> metadata. As the data grows, so<br />
will our vocabulary for understanding it.<br />
Whether learning from Google’s approach to <strong>Big</strong> <strong>Data</strong>,<br />
hiring a staff primed to maximize its value, or managing<br />
the new risks, forward-looking CIOs will, as always,<br />
be looking to enable new business opportunities<br />
through technology.<br />
As companies with a history <strong>of</strong><br />
cautious data policies begin to<br />
test and embrace Hadoop,<br />
MapReduce, and the like, forwardlooking<br />
CIOs will turn to the issues<br />
that will become more important<br />
as <strong>Big</strong> <strong>Data</strong> becomes the norm.<br />
The communities arising around<br />
Hadoop (and the inevitable opensource<br />
and proprietary competitors<br />
that follow) will grow and become<br />
influential, inspiring more CIOs to<br />
become more data-centric.<br />
Revising the CIO’s data playbook 45
New approaches to<br />
customer data analysis<br />
Razorfish’s Mark Taylor and Ray Velez discuss how new<br />
techniques enable them to better analyze petabytes <strong>of</strong><br />
Web data.<br />
Interview conducted by Alan Morrison and Bo Parker<br />
Mark Taylor is global solutions director and Ray Velez is CTO <strong>of</strong> Razorfish, an interactive<br />
marketing and technology consulting firm that is now a part <strong>of</strong> Publicis Groupe. In this<br />
interview, Roberts and Velez discuss how they use Amazon’s Elastic Compute Cloud<br />
(EC2) and Elastic MapReduce services, as well as Micros<strong>of</strong>t Azure Table services, for<br />
large-scale customer segmentation and other data mining functions.<br />
PwC: What business problem were you trying to<br />
solve with the Amazon services?<br />
MT: We needed to join together large volumes <strong>of</strong><br />
disparate data sets that both we and a particular client<br />
can access. Historically, those data sets have not been<br />
able to be joined at the capacity level that we were able<br />
to achieve using the cloud.<br />
In our traditional data environment, we were limited<br />
to the scope <strong>of</strong> real clickstream data that we could<br />
actually access for processing and leveraging<br />
bandwidth, because we procured a fixed size <strong>of</strong> data.<br />
We managed and worked with a third party to serve<br />
that data center.<br />
This approach worked very well until we wanted to tie<br />
together and use SQL servers with online analytical<br />
processing cubes, all in a fixed infrastructure. With the<br />
cloud, we were able to throw billions <strong>of</strong> rows <strong>of</strong> data<br />
together to really start categorizing that information<br />
so that we could segment non-personally identifiable<br />
data from browsing sessions and from specific ways<br />
in which we think about segmenting the behavior<br />
<strong>of</strong> customers.<br />
That capability gives us a much smarter way to apply<br />
rules to our clients’ merchandising approaches, so that<br />
we can achieve far more contextual focus for the use <strong>of</strong><br />
the data. Rather than using the data for reporting only,<br />
we can actually leverage it for targeting and think about<br />
how we can add value to the insight.<br />
RV: It was slightly different from a traditional database<br />
approach. The traditional approach just isn’t going to<br />
work when dealing with the amounts <strong>of</strong> data that a tool<br />
like the Atlas ad server [a Razorfish ad engine that is<br />
now owned by Micros<strong>of</strong>t and <strong>of</strong>fered through Micros<strong>of</strong>t<br />
Advertising] has to deal with.<br />
PwC: The scalability aspect <strong>of</strong> it seems clear.<br />
But is the nature <strong>of</strong> the data you’re collecting<br />
such that it may not be served well by a<br />
relational approach?<br />
RV: It’s not the nature <strong>of</strong> the data itself, but what we<br />
end up needing to deal with when it comes to relational<br />
data. Relational data has lots <strong>of</strong> flexibility because <strong>of</strong><br />
the normalized format, and then you can slice and dice<br />
and look at the data in lots <strong>of</strong> different ways. Until you<br />
46 PricewaterhouseCoopers Technology Forecast
“Rather than using the data for reporting only, we can actually leverage it<br />
for targeting and think about how we can add value to the insight.”<br />
— Ray Velez<br />
put it into a data warehouse format or a denormalized<br />
EMR [Elastic MapReduce] or <strong>Big</strong>table type <strong>of</strong> format,<br />
you really don’t get the performance that you need<br />
when dealing with larger data sets.<br />
So it’s really that classic trade<strong>of</strong>f; the data doesn’t<br />
necessarily lend itself perfectly to either approach.<br />
When you’re looking at performance and the amount<br />
<strong>of</strong> data, even a data warehouse can’t deal with the<br />
amount <strong>of</strong> data that we would get from a lot <strong>of</strong> our<br />
data sources.<br />
PwC: What motivated you to look at this new<br />
technology to solve that old problem?<br />
RV: Here’s a similar example where we used a slightly<br />
different technology. We were working with a large<br />
financial services institution, and we were dealing with<br />
massive amounts <strong>of</strong> spending-pattern and anonymous<br />
data. We knew we had to scale to Internet volumes,<br />
and we were talking about columnar databases. We<br />
wondered, can we use a relational structure with<br />
enough indexes to make it perform well? We<br />
experimented with a relational structure and it<br />
just didn’t work.<br />
So early on we jumped into what Micros<strong>of</strong>t Azure<br />
technology allowed us to do, and we put it into a<br />
<strong>Big</strong>table format, or a Hadoop-style format, using Azure<br />
Table services. The real custom element was designing<br />
the partitioning structure <strong>of</strong> this data to denormalize<br />
what would usually be five or six tables into one huge<br />
table with lots <strong>of</strong> columns, to the point where we started<br />
to bump up against the maximum number <strong>of</strong> columns<br />
they had.<br />
We were able to build something that we never would<br />
have thought <strong>of</strong> exposing to the world because it never<br />
would have performed well. It actually spurred a whole<br />
new business idea for us. We were able to take what<br />
would typically be a BusinessObjects or a Cognos<br />
application, which would not scale to Internet volumes.<br />
We did some sizing to determine how big the data<br />
footprint would be. Obviously, when you do that, you<br />
tend to have a ton more space than you require,<br />
because you’re duplicating lots and lots <strong>of</strong> data that,<br />
with a relational database table, would be lookup data<br />
or other things like that. But it turned out that when I<br />
laid the indexes on top <strong>of</strong> the traditionally relational<br />
data, the resulting data set actually had even greater<br />
storage requirements than performing the duplication<br />
and putting the data set into a large denormalized<br />
format. That was a bit <strong>of</strong> a surprise to us. The size <strong>of</strong><br />
the indexes got so large.<br />
When you think about it, maybe that’s just how an index<br />
works anyway—it puts things into this denormalized<br />
format. An index file is just some closed concept in<br />
your database or memory space. The point is, we would<br />
have never tried to expose that to consumers, but we<br />
were able to expose it to consumers because <strong>of</strong> this<br />
new format.<br />
MT: The first commercial benefits were the ability to<br />
aggregate large and disparate data into one place and<br />
extra processing power. But the next phase <strong>of</strong> benefits<br />
really derives from the ability to identify true<br />
relationships across that data.<br />
Managing petabyte-scale customer data analysis 47
“The stat section on [the MLB] site was always the most difficult part <strong>of</strong><br />
the site, but the business insisted it needed it.” — Ray Velez<br />
Tiny percentages <strong>of</strong> these data sets have the most<br />
significant impact on our customer interactions. We are<br />
already developing new data measurement and KPI<br />
strategies as we’re starting to ask ourselves, “Do our<br />
clients really need all <strong>of</strong> the data and measurement<br />
points to solve their business goals?”<br />
PwC: Given these new techniques, is the skill<br />
set that’s most beneficial to have at Razorfish<br />
changing?<br />
RV: It’s about understanding how to map data into a<br />
format that most people are not familiar with. Most<br />
people understand SQL and relational format, so I think<br />
the real skill set evolution doesn’t have quite as much<br />
to do with whether the tool <strong>of</strong> choice is Java or Python<br />
or other technologies; it’s more about do I understand<br />
normalized versus denormalized structures.<br />
MT: From a more commercial viewpoint, there’s a shift<br />
away from product type and skill set, which is based<br />
around constraints and managing known parameters,<br />
and very much more toward what else can we do.<br />
It changes the impact—not just in the technology<br />
organization, but in the other disciplines as well.<br />
I’ve already seen a pr<strong>of</strong>ound effect on the old ways <strong>of</strong><br />
doing things. Rather than thinking <strong>of</strong> doing the same<br />
things better, it really comes down to having the people<br />
and skills to meet your intended business goals.<br />
Using the Elastic MapReduce service can have a ripple<br />
effect on all <strong>of</strong> the non-technical business processes<br />
and engagements across teams. For example,<br />
conventional marketing segmentation used to involve<br />
teams <strong>of</strong> analysts who waded through various data sets<br />
and stages <strong>of</strong> processing and analysis to make sense <strong>of</strong><br />
how a business might view groups <strong>of</strong> customers. Using<br />
the Hadoop-style alternative and Cascading, we’re able<br />
to identify unconventional relationships across many<br />
data points with less effort, and in the process create<br />
new segmentations and insights.<br />
This way, we stay relevant and respond more quickly to<br />
customerdemand. We’re identifying new variations and<br />
shifts in the data on a real-time basis that would have<br />
otherwise taken weeks or months, or even missed<br />
completely using the old approach. The analyst’s role<br />
in creating these new algorithms and designing new<br />
methods <strong>of</strong> campaign planning is clearly key to this<br />
type <strong>of</strong> solution design. The outcome <strong>of</strong> all this is really<br />
interesting and I’m starting to see a subtle, organic<br />
response to different changes in customer behavior.<br />
PwC: Are you familiar with Bill James, a Major<br />
League Baseball statistician who has taken a<br />
rather different approach to metrics? James<br />
developed some metrics that turned out to be<br />
more useful than those used for many years<br />
in baseball. That kind <strong>of</strong> person seems to be<br />
the type that you’re enabling to hypothesize,<br />
perhaps even do some machine learning to<br />
generate hypotheses.<br />
RV: Absolutely. Our analytics team within Razorfish has<br />
the Bill James type <strong>of</strong> folks who can help drive different<br />
thinking and envision possibilities with the data. We<br />
need to find a lot more <strong>of</strong> those people. They’re not<br />
very easy to find. And we have some <strong>of</strong> the leading<br />
folks in the industry.<br />
You know, a long, long time ago we designed the<br />
Major League Baseball site and the platform. The stat<br />
section on that site was always the most difficult part<br />
<strong>of</strong> the site, but the business insisted it needed it. The<br />
amount <strong>of</strong> people who really wanted to churn through<br />
that data was small. We were using Oracle at the time.<br />
We used the concept <strong>of</strong> temporary tables, which<br />
would denormalize lots <strong>of</strong> different relational tables for<br />
performance reasons, and that was a challenge. If I<br />
had the cluster technology we do now back in 1999<br />
and 2000, we could have built to scale much more<br />
than going to two measly servers that we could cluster.<br />
48 PricewaterhouseCoopers Technology Forecast
PwC: The Bill James analogy goes beyond<br />
batting averages, which have been the age-old<br />
metric for assessing the contribution <strong>of</strong> a hitter<br />
to a team, to measuring other things that weren’t<br />
measured before.<br />
RV: Even crazy stuff. We used to do things like, show<br />
me all <strong>of</strong> Derek Jeter’s hits at night on a grass field.<br />
PwC: There you go. Exactly.<br />
RV: That’s the example I always use, because that was<br />
the hardest thing to get to scale, but if you go to the<br />
stat section, you can do a lot <strong>of</strong> those things. But if too<br />
many people went to the stat section on the site, the<br />
site would melt down, because Oracle couldn’t handle<br />
it. If I were to rebuild that today, I could use an EMR<br />
or a <strong>Big</strong>table and I’d be much happier.<br />
PwC: Considering the size <strong>of</strong> the <strong>Big</strong>table that<br />
you’re able to put together without using joins, it<br />
seems like you’re initially able to filter better and<br />
maybe do multistage filtering to get to something<br />
useful. You can take a cyclical approach to your<br />
analysis, correct?<br />
RV: Yes, you’re almost peeling away the layer <strong>of</strong> the<br />
onion. But putting data into a denormalized format does<br />
restrict flexibility, because you have so much more<br />
power with a where clause than you do with a standard<br />
EMR or <strong>Big</strong>table access mechanism.<br />
It’s like the difference between something built for<br />
exactly one task versus something built to handle tasks<br />
I haven’t even thought <strong>of</strong>. If you peel away the layer <strong>of</strong><br />
the onion, you might decide, wow, this data’s interesting<br />
and we’re going in a very interesting direction, so what<br />
about this? You may not be able to slice it that way. You<br />
might have to step back and come up with a different<br />
partition structure to support it.<br />
PwC: Social media is helping customers become<br />
more active and engaged. From a marketing<br />
analysis perspective, it’s a variation on a Super<br />
Bowl advertisement, just scaled down to that<br />
social media environment. And if that’s going to<br />
happen frequently, you need to know what is the<br />
impact, who’s watching it, and how are the<br />
people who were watching it affected by it. If<br />
you just think about the data ramifications <strong>of</strong><br />
that, it sort <strong>of</strong> blows your mind.<br />
RV: If you think about the popularity <strong>of</strong> Hadoop and<br />
<strong>Big</strong>table, which is really looking under the covers <strong>of</strong><br />
the way Google does its search, and when you think<br />
about search at the end <strong>of</strong> the day, search really is<br />
recommendations. It’s relevancy. What are the impacts<br />
on the ability <strong>of</strong> people to create new ways to do search<br />
and to compete in a more targeted fashion with the<br />
search engine? If you look three to five years out, that’s<br />
really exciting. We used to say we could never re-create<br />
that infrastructure that Google has; Google is the<br />
second largest server manufacturer in the world. But<br />
now we have a way to create small targeted ways <strong>of</strong><br />
doing what Google does. I think that’s pretty exciting. •<br />
“What are the impacts on the ability<br />
<strong>of</strong> people to create new ways to<br />
do search and to compete in a<br />
more targeted fashion with the<br />
search engine? If you look three to<br />
five years out, that’s really exciting.”<br />
— Ray Velez<br />
Managing petabyte-scale customer data analysis 49
Acknowledgments<br />
Advisory<br />
Sponsor & Technology Leader<br />
Tom DeGarmo<br />
US Thought Leadership<br />
Partner-in-Charge<br />
Tom Craren<br />
Center for Technology and Innovation<br />
Managing Editor<br />
Bo Parker<br />
Editors<br />
Vinod Baya, Alan Morrison<br />
Contributors<br />
Larry Best, Galen Gruman, Jimmy Guterman, Larry Marion, Bill Roberts<br />
Editorial Advisers<br />
Markus Anderle. Stephen Bay. Brian Butte, Tom Johnson, Krishna<br />
Kumaraswamy, Bud Mathaisel, Sean McClowry, Rajesh Munavalli,<br />
Luis Orama, Dave Patton, Jonathan Reichental, Terry Retter, Deepak Sahi,<br />
Carter Shock, David Steier, Joe Tagliaferro, Dimpsy Teckchandani,<br />
Cindi Thompson, Tom Urquhart, Christine Wendin, Dean Wotkiewich<br />
Copyedit<br />
Lea Anne Bantsari, Ellen Dunn<br />
Transcription<br />
Paula Burns<br />
50 PricewaterhouseCoopers Technology Forecast
Graphic Design<br />
Art Director<br />
Jacqueline Corliss<br />
Designer<br />
Jacqueline Corliss, Suzanne Lau<br />
Illustrator<br />
Donald Bernhardt, Suzanne Lau,<br />
Tatiana Pechenik<br />
Photographers<br />
Tim Szumowski<br />
Marina Waltz<br />
Online<br />
Director, Online Marketing<br />
Jack Teuber<br />
Designer and Producer<br />
Scott Schmidt<br />
Reviewers<br />
Dave Stuckey, Chris Wensel<br />
Marketing<br />
Bob Kramer<br />
Special thanks to<br />
Ray George, Page One<br />
Rachel Lovinger, Razorfish<br />
Mariam Sughayer, Disney<br />
Industry perspectives<br />
During the preparation <strong>of</strong> this publication, we benefited<br />
greatly from interviews and conversations with the<br />
following executives: and industry analysts:<br />
Bud Albers, executive vice president and chief<br />
technology <strong>of</strong>ficer, Technology Shared Services<br />
Group, Disney<br />
Matt Aslett, analyst, enterprise s<strong>of</strong>tware, the451<br />
John Avery, partner, Sungard Consulting Services<br />
Amr Awadallah, vice president, engineering,<br />
and chief technology <strong>of</strong>ficer, <strong>Cloudera</strong><br />
Phil Buckle, chief information <strong>of</strong>ficer, National Policing<br />
Improvement Agency<br />
Howard Dresner, president and founder,<br />
Dresner Advisory Services”<br />
Brian Donnelly, founder and chief executive <strong>of</strong>ficer,<br />
InSilico Discovery<br />
Matt Estes, principal architect, Technology Shared<br />
Services Group, Disney<br />
Jim Kobelius, senior analyst, Forrester Research<br />
Doug Lenat, founder and chief executive <strong>of</strong>ficer, Cycorp<br />
Roger Magoulas, research director, O’Reilly Media<br />
Nathan Marz, lead engineer, BackType<br />
Bill McColl, founder and chief executive <strong>of</strong>ficer,<br />
Cloudscale<br />
John Parkinson, acting chief technology <strong>of</strong>ficer,<br />
TransUnion<br />
David Smoley, chief information <strong>of</strong>ficer, Flextronics<br />
Mark Taylor, director, global solutions, Razorfish<br />
Scott Thompson, vice president, architecture,<br />
Technology Shared Services Group, Disney<br />
Ray Velez, chief technology <strong>of</strong>ficer, Razorfish<br />
Acknowledgments 51
pwc.com/us<br />
To have a deeper conversation<br />
about how this subject may affect<br />
your business, please contact:<br />
Tom DeGarmo<br />
Principal, Technology Leader<br />
PricewaterhouseCoopers<br />
+1 267-330-2658<br />
thomas.p.degarmo@us.pwc.com<br />
This publication is printed on Coronado Stipple Cover made from 30% recycled fiber; and<br />
Endeavor Velvet Book made from 50% recycled fiber, a Forest Stewardship Council (FSC)<br />
certified stock using 25% post-consumer waste.<br />
Recycled paper
Subtext<br />
<strong>Big</strong> <strong>Data</strong><br />
<strong>Data</strong> sets that range from many terabytes to petabytes in size, and<br />
that usually consist <strong>of</strong> less-structured information such as Web log files.<br />
Hadoop cluster<br />
A type <strong>of</strong> scalable computer cluster inspired by the Google<br />
Cluster Architecture and intended for cost-effectively processing<br />
less-structured information.<br />
Apache Hadoop<br />
The core <strong>of</strong> an open-source ecosystem that makes <strong>Big</strong> <strong>Data</strong> analysis<br />
more feasible through the efficient use <strong>of</strong> commodity computer clusters.<br />
Cascading<br />
A bridge from Hadoop to common Java-based programming techniques<br />
not previously usable in cluster-computing environments.<br />
NoSQL<br />
Gray data<br />
A class <strong>of</strong> non-relational data stores and data analysis techniques that<br />
are intended for various kinds <strong>of</strong> less-structured data. Many <strong>of</strong> these<br />
techniques are part <strong>of</strong> the Hadoop ecosystem.<br />
<strong>Data</strong> from multiple sources that isn’t formatted or vetted for<br />
specific needs, but worth exploring with the help <strong>of</strong> Hadoop<br />
cluster analysis techniques.<br />
Comments or requests? Please visit www.pwc.com/techforecast OR send e-mail to: techforecasteditors@us.pwc.com<br />
PricewaterhouseCoopers (www.pwc.com) provides industry-focused assurance, tax and advisory services to build public trust and enhance value for<br />
its clients and their stakeholders. More than 155,000 people in 153 countries across our network share their thinking, experience and solutions to<br />
develop fresh perspectives and practical advice.<br />
© 2010 PricewaterhouseCoopers LLP. All rights reserved. “PricewaterhouseCoopers” refers to PricewaterhouseCoopers LLP, a Delaware limited<br />
liability partnership, or, as the context requires, the PricewaterhouseCoopers global network or other member firms <strong>of</strong> the network, each <strong>of</strong> which is a<br />
separate and independent legal entity. This document is for general information purposes only, and should not be used as a substitute for consultation<br />
with pr<strong>of</strong>essional advisors.