Development of Micro Alloyed Structural Steels - Steelworld
Development of Micro Alloyed Structural Steels - Steelworld
Development of Micro Alloyed Structural Steels - Steelworld

You also want an ePaper? Increase the reach of your titles
YUMPU automatically turns print PDFs into web optimized ePapers that Google loves.
Technology<br />
<strong>Development</strong> <strong>of</strong> <strong>Micro</strong> <strong>Alloyed</strong><br />
<strong>Structural</strong> <strong>Steels</strong> in<br />
Secondary Steel Sector<br />
- R. K. Bagchi, Director, NISST<br />
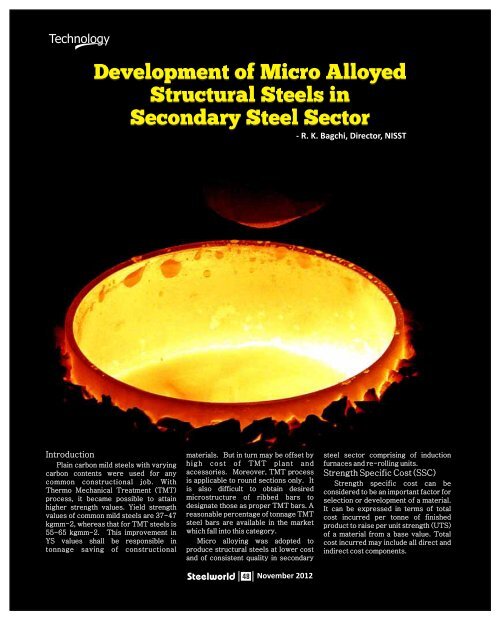
Introduction<br />
Plain carbon mild steels with varying<br />
carbon contents were used for any<br />
common constructional job. With<br />
Thermo Mechanical Treatment (TMT)<br />
process, it became possible to attain<br />
higher strength values. Yield strength<br />
values <strong>of</strong> common mild steels are 37-47<br />
kgmm-2, whereas that for TMT steels is<br />
55-65 kgmm-2. This improvement in<br />
YS values shall be responsible in<br />
tonnage saving <strong>of</strong> constructional<br />
materials. But in turn may be <strong>of</strong>fset by<br />
high cost <strong>of</strong> TMT plant and<br />
accessories. Moreover, TMT process<br />
is applicable to round sections only. It<br />
is also difficult to obtain desired<br />
microstructure <strong>of</strong> ribbed bars to<br />
designate those as proper TMT bars. A<br />
reasonable percentage <strong>of</strong> tonnage TMT<br />
steel bars are available in the market<br />
which fall into this category.<br />
<strong>Micro</strong> alloying was adopted to<br />
produce structural steels at lower cost<br />
and <strong>of</strong> consistent quality in secondary<br />
steel sector comprising <strong>of</strong> induction<br />
furnaces and re-rolling units.<br />
Strength Specific Cost (SSC)<br />
Strength specific cost can be<br />
considered to be an important factor for<br />
selection or development <strong>of</strong> a material.<br />
It can be expressed in terms <strong>of</strong> total<br />
cost incurred per tonne <strong>of</strong> finished<br />
product to raise per unit strength (UTS)<br />
<strong>of</strong> a material from a base value. Total<br />
cost incurred may include all direct and<br />
indirect cost components.<br />
48<br />
November 2012
Technology<br />
The base UTS value for 12mm dia mild<br />
steel structural ribbed bar is around 41<br />
kgmm-2. 12mm dia TMT bars having<br />
acceptable metallurgical quality<br />
presents a value <strong>of</strong> 65kgmm-2. If an<br />
amount <strong>of</strong> Rs 'X' is to be incurred per<br />
ton to produce the TMT bars, then SSC<br />
would be X/(65-41) or X/24. A lower<br />
value <strong>of</strong> SSC is desirable when two<br />
materials are to be compared.<br />
Experimental-Methodology<br />
<strong>Micro</strong> alloyed steels have been<br />
developed through induction melting<br />
furnace and controlled rolling route to<br />
r e p l a c e T M T b a r s u s e d f o r<br />
construction purposes.<br />
An induction furnace was selected<br />
for making steel ingots and a re-rolling<br />
mill was chosen for rolling the ingots to<br />
1 2 m m d i a r i b b e d b a r s . F o r<br />
investigation, a base chemistry was<br />
selected to have:<br />
%C %Si %Mn %S %P %Cr %Ni %Mo %Cu<br />
Min. .20 .25 .80 – -- ---------- traces ------------<br />
Max. .25 .35 1.00 .04 .04<br />
%Vanadium and %Niobium were<br />
both varied. Nitrogen content was<br />
aimed at 150ppm in some heats. Total<br />
12 heats were cast. Melting was done<br />
in a 500 kg (converted to 250 kg)<br />
induction melting furnace, 3½” x 4½”<br />
sized pencil ingots were cast and rolled<br />
to 12mm dia ribbed bars. 3 different<br />
sets <strong>of</strong> cooling parameters <strong>of</strong> rolled<br />
products were adopted.<br />
One set was made with full water<br />
quenching, as applied in TMT<br />
production (WQ). One large set was<br />
made with out water cooling. It was air<br />
cooled on cooling bed. One bar from<br />
each heat <strong>of</strong> this set was twisted after<br />
cooling [CTD(AC)] and rest was kept<br />
as it is (AC). The third set was again<br />
water cooled, but with much less water<br />
as compared to the first set (WC), as<br />
shown in Table 1:<br />
Set<br />
A<br />
B<br />
C<br />
D<br />
Heat No<br />
1-12<br />
1-12<br />
1-12<br />
1-12<br />
TABLE-1 : FOUR DIFFERENT SETS OF TRIAL<br />
Designate<br />
Post Rolling Treatment<br />
WQ<br />
AC<br />
CTD(AC)<br />
WC<br />
Results and Discussion<br />
Samples were taken from each stage <strong>of</strong><br />
production. One test piece was cast<br />
from each heat, it was normalized and<br />
tested for chemical analysis through<br />
d i r e c t r e a d i n g s p e c t r o m e t e r ,<br />
metallographic studies like micro<br />
structure, grain size and inclusion<br />
rating, hardness in BHN, mechanical<br />
tests like UTS, YS, %El and bendrebend<br />
tests were carried out. Tests<br />
pieces were cut from each heat <strong>of</strong> 4<br />
sets <strong>of</strong> rolled products and each set<br />
was tested for micro structure,<br />
hardness. UTS, YS and %El. The<br />
results have been presented in tabular<br />
form in Table-2 for inclusion rating and<br />
Table-3 through Table-8 for<br />
Mechanical tests.<br />
Inclusion Rating<br />
In all the heats, levels <strong>of</strong> inclusion<br />
types A, B & C were very good. Mixed<br />
oxides were high in almost all the heats.<br />
It is possible that some <strong>of</strong> these<br />
particles could be seen in SEM analysis<br />
and might have affected strength and<br />
ductility values.<br />
During steel melting, although<br />
measures were taken to reduce<br />
i n c l u s i o n l e v e l s , s o m e m o r e<br />
precautions are needed to reduce the<br />
level <strong>of</strong> mixed oxides in steels. It is<br />
important to control both indigenous<br />
and exogenous inclusions to improve<br />
mechanical properties. These are<br />
possible with little care in steel melting<br />
and casting.<br />
Mechanical Properties<br />
Results <strong>of</strong> mechanical tests have<br />
been presented below, from Table 3-<br />
Table-8.<br />
In unalloyed steel, AC resulted<br />
Water quenching as in TMT<br />
Normal air cooling in cooling bed<br />
Normal air cooling and CTD (cold twisted deformed)<br />
Water cooling with 50% lesser water as compared to set A<br />
(The treatment designations would be used later in the report e.g. Heat No.1, set A with<br />
water quench as 1AWQ and so on)<br />
almost equal or better strength and<br />
ductility as compared to WQ but were<br />
lower than WC. In the cases <strong>of</strong> V<br />
combinations, though strength values<br />
under AC were lower (2-13) than those<br />
under WQ, ductility values were better<br />
in AC. Here again, UTS values were<br />
higher under WC than those obtained<br />
under WQ and AC. Though %<br />
Elongation values were lower under<br />
WC than under WQ and AC, % RA values<br />
were more.<br />
Strength went down with increasing<br />
vanadium percentages, under almost all<br />
cooling conditions. But %E values were<br />
the lowest with WC and were higher<br />
under AC conditions, with the highest<br />
value obtained with V4. Vanadium<br />
produces strengthening effect through<br />
precipitation hardening and only AC<br />
enhances strength without sacrificing<br />
the ductility.<br />
When V+N combinations were<br />
used, similar trend as with was<br />
followed. All the WC samples<br />
developed LC. No appreciable<br />
improvement observed with N<br />
additions. %E values decreased with<br />
more %V under AC and WQ. Under WQ<br />
and WC, values <strong>of</strong> %E and %RA were<br />
lower than obtained under AC. Faster<br />
cooling enhanced strength values but<br />
reduced the ductility. Nb combinations<br />
also presented high strength and<br />
ductility values almost comparable to<br />
vanadium combinations. Different<br />
cooling conditions did not appreciably<br />
changed the UTS values but faster<br />
cooling rates resulted in marked<br />
reduction in ductility.<br />
50<br />
November 2012
Technology<br />
Code<br />
P<br />
V2<br />
V4<br />
V6<br />
V2N<br />
V4N<br />
V6N<br />
Nb2<br />
Nb4<br />
Nb6<br />
30V4N<br />
30VNb4N<br />
Code<br />
P<br />
V2<br />
V4<br />
V6<br />
V2N<br />
V4N<br />
V6N<br />
Nb2<br />
Nb4<br />
Nb6<br />
30VN<br />
30VNbN<br />
Code<br />
P<br />
V2<br />
V4<br />
V6<br />
V2N<br />
V4N<br />
V6N<br />
Nb2<br />
Nb4<br />
Nb6<br />
30V4N<br />
30VNb4N<br />
TABLE-2 : INCLUSION RATING OF TRIAL HEATS<br />
Inclusion Rating (Thin/Thick)<br />
Sulphide (a) Alumina (b) Silicate (c) Mixed oxides (d)<br />
0.5/0.5<br />
1/0.5<br />
1/0.5<br />
0.5/0.5<br />
Test Piece<br />
(NOR)<br />
180<br />
200<br />
153<br />
200<br />
195<br />
190<br />
195<br />
172<br />
200<br />
210<br />
216<br />
190<br />
Water<br />
Quench (WQ)<br />
200<br />
234<br />
253<br />
234<br />
226<br />
234<br />
226<br />
253<br />
264<br />
226<br />
258<br />
264<br />
TABLE-3 : HARDNESS, (BHN) VALUES OF TRIAL HEATS<br />
12 mm Dia Rolled Products<br />
Air<br />
CTD (AC)<br />
Cooled (AC)<br />
210<br />
226<br />
237<br />
210<br />
222<br />
237<br />
216<br />
258<br />
222<br />
253<br />
258<br />
253<br />
286<br />
271<br />
286<br />
279<br />
253<br />
247<br />
237<br />
253<br />
286<br />
247<br />
294<br />
286<br />
TABLE - 4 : UTS, KGMM-2 VALUES OF TRIAL HEATS<br />
Test Piece Water<br />
Air<br />
CTD (AC)<br />
(NOR) Quench (WQ) Cooled (AC)<br />
63<br />
67<br />
54<br />
51<br />
65<br />
59<br />
61<br />
62<br />
58<br />
54<br />
50<br />
68<br />
70<br />
81<br />
83<br />
74<br />
78<br />
83<br />
77<br />
72<br />
86<br />
75<br />
83<br />
87<br />
69<br />
79<br />
70<br />
61<br />
73<br />
75<br />
65<br />
75<br />
78<br />
65<br />
81<br />
76<br />
80<br />
86<br />
82<br />
82<br />
84<br />
84<br />
94<br />
78<br />
87<br />
68<br />
88<br />
90<br />
2/1<br />
2/1.5<br />
2.5/1.5<br />
1/0.5<br />
2/0.5<br />
1/-<br />
1/-<br />
0.5/-<br />
1/-<br />
1/-<br />
1.5/-<br />
0.5/-<br />
0.5/-<br />
0.5/-<br />
-/-<br />
1/-<br />
-/-<br />
1/-<br />
-/-<br />
-/-<br />
1/-<br />
0.5/-<br />
-/-<br />
-/-<br />
-/-<br />
-/-<br />
-/-<br />
0.5/-<br />
0.5/-<br />
-/-<br />
0.5/-<br />
0.5/-<br />
-/-<br />
-/-<br />
-/-<br />
0.5/-<br />
-/-<br />
2/-<br />
2/-<br />
2.5/-<br />
1.5/-<br />
2/-<br />
1.5/-<br />
1/-<br />
Water<br />
Cooled (WC)<br />
237<br />
286<br />
271<br />
237<br />
231<br />
301<br />
231<br />
247<br />
258<br />
258<br />
264<br />
258<br />
Water<br />
Cooled (WC)<br />
79<br />
89<br />
83<br />
72<br />
85<br />
83<br />
85<br />
75<br />
84<br />
73<br />
82<br />
88<br />
There was no appreciable change<br />
with V+Nb+N combination having<br />
0.28%C. All the samples (other than<br />
with V4) under CTD(AC) developed LC<br />
and resulted mostly low %El and %RA<br />
values, though the UTS values were<br />
above 80 kgmm-2. CTD resulted in<br />
raising dislocation density level <strong>of</strong><br />
already stresses rolled products.<br />
Best combination <strong>of</strong> strength and<br />
ductility values were obtained with V2<br />
(UTS: 79, YS: 59, %El : 23 & % RA :<br />
59) and Nb2 (UTS : 75, YS : 61, %El : 23<br />
& %RA : 66) Typical values obtained<br />
with 12mm2 TMT <strong>of</strong> SAIL/RINL, were<br />
UTS : 65, YS : 56, %El : 25 & %RA : 45.<br />
Summary <strong>of</strong> all the results have<br />
been presented in Table-9.<br />
Strength Specific Cost (SSC)<br />
Commonly, a typical 12 mm dia<br />
TMT bar <strong>of</strong> SAIL/RINL has a UTS value<br />
<strong>of</strong> 60 kgmm-2 and that <strong>of</strong> an ordinary<br />
mild steel ribbed bar is around 40<br />
kgmm-2. Assuming the similar quality<br />
<strong>of</strong> TMT bar is produced in the<br />
secondary steel sector w i t h a n<br />
annual production <strong>of</strong> 12,000 MT, total<br />
cost <strong>of</strong> the TMT plant and accessories<br />
as Rs 1.5 crores, IRR <strong>of</strong> 18% and an<br />
expected pay back period <strong>of</strong> 5 yrs, the<br />
SSC may be calculated as Rs 17.50.<br />
In case <strong>of</strong> micro alloyed steels<br />
with low %V/Nb, expected UTS level<br />
shall be around 75 kgmm-2. As far as<br />
the cost factor is concerned,<br />
requirement <strong>of</strong> vanadium shall be less<br />
than niobium, because in steel scrap,<br />
usually little vanadium comes as<br />
residual, but not niobium. Additional<br />
cost <strong>of</strong> micro alloyed steels with low<br />
vanadium(V2) shall be around Rs<br />
200.00. In this case, the SSC may be<br />
calculated as Rs 5.72 only, which is<br />
about 2.5 times less.<br />
Moreover, if due considerations are<br />
given and applied in the design<br />
calculations for constructional<br />
activities, then there will be more<br />
savings <strong>of</strong> constructional materials for<br />
the users <strong>of</strong> micro alloyed steels than <strong>of</strong><br />
TMT bars.<br />
Savings can be even more in case <strong>of</strong><br />
other sections <strong>of</strong> constructional<br />
materials, because in those cases, the<br />
difference in UTS shall be more (from<br />
45 kgmm-2 to 79 kgmm-2) as the TMT<br />
process can not be applied to the<br />
51<br />
November 2012
Technology<br />
Code<br />
P<br />
V2<br />
V4<br />
V6<br />
V2N<br />
V4N<br />
V6N<br />
Nb2<br />
Nb4<br />
Nb6<br />
30V4N<br />
30VNb4N<br />
Code<br />
P<br />
V2<br />
V4<br />
V6<br />
V2N<br />
V4N<br />
V6N<br />
Nb2<br />
Nb4<br />
Nb6<br />
30V4N<br />
30VNb4N<br />
-2<br />
TABLE-5: YS, KGMM VALUES OF TRIAL HEATS<br />
Test Piece<br />
(NOR)<br />
40<br />
43<br />
44<br />
35<br />
43<br />
46<br />
60<br />
40<br />
39<br />
36<br />
47<br />
47<br />
Water<br />
Quench (WQ)<br />
51<br />
63<br />
73<br />
64<br />
65<br />
68<br />
68<br />
49<br />
76<br />
64<br />
70<br />
74<br />
12 mm Dia Rolled Products<br />
Air<br />
CTD (AC)<br />
Cooled (AC)<br />
49<br />
59<br />
55<br />
48<br />
57<br />
59<br />
51<br />
61<br />
61<br />
50<br />
67<br />
61<br />
64<br />
83<br />
62<br />
64<br />
-LC<br />
-LC<br />
-LC<br />
60 LC<br />
-LC<br />
-LC<br />
TABLE - 6 : %ELONGATION VALUES OF TRIAL HEATS<br />
12 mm Dia Rolled Products<br />
Test Piece<br />
(NOR)<br />
30<br />
20<br />
27<br />
27<br />
19<br />
11<br />
9<br />
25<br />
24<br />
21<br />
7<br />
18<br />
Water<br />
Quench (WQ)<br />
23<br />
24<br />
16<br />
20<br />
24<br />
20<br />
15<br />
21<br />
15<br />
25<br />
20<br />
18<br />
Air<br />
Cooled (AC)<br />
25<br />
23<br />
28<br />
24<br />
24<br />
25<br />
20<br />
23<br />
20<br />
22<br />
17<br />
24<br />
66<br />
68<br />
CTD (AC)<br />
20<br />
20<br />
17<br />
19<br />
19<br />
18<br />
17<br />
10<br />
17<br />
20<br />
18<br />
20<br />
Water<br />
Cooled (WC)<br />
63<br />
80<br />
67<br />
60<br />
69 LC<br />
72 LC<br />
74 LC<br />
63<br />
74 LC<br />
63<br />
65 LC<br />
71 LC<br />
Water<br />
Cooled (WC)<br />
25<br />
18<br />
18<br />
20<br />
19<br />
20<br />
18<br />
19<br />
20<br />
19<br />
20<br />
16<br />
Code<br />
P<br />
V2<br />
V4<br />
V6<br />
V2N<br />
V4N<br />
V6N<br />
Nb2<br />
Nb4<br />
Nb6<br />
30V4N<br />
30VNb4N<br />
TABLE - 7 : %REDUCTION IN AREA VALUES OF TRIAL HEATS<br />
12 mm Dia Rolled Products<br />
Test Piece<br />
(NOR)<br />
52<br />
53<br />
63<br />
30<br />
50<br />
17<br />
23<br />
48<br />
34<br />
29<br />
5<br />
13<br />
Water<br />
Quench (WQ)<br />
57<br />
46<br />
51<br />
54<br />
56<br />
64<br />
55<br />
33<br />
51<br />
54<br />
54<br />
39<br />
Air<br />
Cooled (AC)<br />
61<br />
59<br />
57<br />
59<br />
54<br />
61<br />
65<br />
66<br />
63<br />
60<br />
56<br />
54<br />
CTD (AC)<br />
26<br />
38<br />
44<br />
58<br />
58<br />
51<br />
18<br />
37<br />
32<br />
60<br />
47<br />
45<br />
Water<br />
Cooled (WC)<br />
66<br />
55<br />
64<br />
70<br />
49<br />
51<br />
58<br />
67<br />
58<br />
62<br />
65<br />
53<br />
52<br />
November 2012
Technology<br />
Code<br />
P<br />
V2<br />
V4<br />
V6<br />
V2N<br />
V4N<br />
V6N<br />
Nb2<br />
Nb4<br />
Nb6<br />
30VN<br />
30VNbN<br />
Code<br />
P<br />
V2<br />
V4<br />
V6<br />
V2N<br />
V4N<br />
V6N<br />
Nb2<br />
Nb4<br />
Nb6<br />
30V4N<br />
30VNb4N<br />
TABLE - 8 : BEND-RE-BEND TEST RESULTS OF TRIAL HEATS<br />
12 mm Dia Rolled Products<br />
Test Piece<br />
(NOR)<br />
NC<br />
NC<br />
NC<br />
NC<br />
NC<br />
NC<br />
NC<br />
NC<br />
NC<br />
NC<br />
NC<br />
NC<br />
Water<br />
Quench (WQ)<br />
NC<br />
NC<br />
NC<br />
NC<br />
NC<br />
NC<br />
NC<br />
NC<br />
NC<br />
NC<br />
NC<br />
NC<br />
Air<br />
Cooled (AC)<br />
NC<br />
NC<br />
NC<br />
NC<br />
NC<br />
NC<br />
NC<br />
NC<br />
NC<br />
NC<br />
NC<br />
NC<br />
CTD (AC)<br />
LC<br />
LC<br />
LC<br />
NC<br />
NC<br />
LC<br />
LC<br />
LC<br />
NC<br />
NC<br />
LC<br />
LC<br />
Water<br />
Cooled (WC)<br />
TABLE - 9 : SUMMARY OF RESULTS<br />
Test Piece<br />
(Normalised)<br />
<strong>Micro</strong> Structure Rolled Product, Mech. Props<br />
VF(P) GS WQ AC WC WQ AC CTD WC<br />
25 5-6 B FP FP Nor Nor<br />
High<br />
40<br />
20<br />
25<br />
25<br />
55<br />
40<br />
40<br />
40<br />
30<br />
58<br />
50<br />
5<br />
6<br />
5-6<br />
5-6<br />
4-5<br />
4-5<br />
7<br />
5-6<br />
6-7<br />
6-7<br />
6<br />
B<br />
B<br />
B<br />
B<br />
B<br />
B<br />
B<br />
B<br />
B<br />
B<br />
B<br />
FP<br />
FP<br />
FP<br />
FP<br />
FP<br />
FP<br />
FP<br />
FP<br />
FP<br />
FP<br />
FP<br />
FP<br />
FP<br />
FP<br />
FP<br />
FP<br />
FP<br />
FP<br />
FP<br />
FP<br />
FP<br />
FP<br />
High<br />
High<br />
Low<br />
Low<br />
High<br />
Poor<br />
Low<br />
V High<br />
Poor<br />
High<br />
Low<br />
High<br />
Nor<br />
Poor<br />
Nor<br />
Nor<br />
Low<br />
Nor<br />
High<br />
Poor<br />
V High<br />
Nor<br />
HIGH<br />
&<br />
BRITTLE<br />
LC<br />
NC<br />
NC<br />
LC<br />
NC<br />
NC<br />
NC<br />
LC<br />
NC<br />
LC<br />
LC<br />
NC<br />
LC<br />
Nor<br />
VHigh<br />
Nor<br />
High<br />
High<br />
Low<br />
Nor<br />
Low<br />
Low<br />
Poor<br />
Nor<br />
sections other than rounds and<br />
squares.<br />
References<br />
L. F. Porter & P. E. Repass “The<br />
Evolution <strong>of</strong> HSLA <strong>Steels</strong>”. Journal <strong>of</strong><br />
Metals, April 1982 pp 14.<br />
E. E. Flecher, “A Review <strong>of</strong> the<br />
Status, Selection and Physical<br />
Metallurgy <strong>of</strong> High-Strength Lowalloy<br />
<strong>Steels</strong>”, Metals and Ceramics<br />
Information Centre Report, MCIC 78-<br />
89, March 1979.<br />
B, Motgi, A. K. Chakraborty & R. L.<br />
Kumar, “<strong>Micro</strong> alloyed <strong>Steels</strong>:<br />
M e t a l l u r g i c a l P r i n c i p l e s a n d<br />
Applications”, Industrial Product<br />
Finder, September 1996, pp 329.<br />
Jitender Patel & Shunichi<br />
Hashimoto, Review Article on “Niobium<br />
for the Steel Industry”, Vol. 5 No. 6,<br />
December 2002, pp 20.<br />
Bhatnagar, Oatar, Guha,.<br />
Chattopadhyaya & Sinha, “High<br />
Strength Low Alloy <strong>Structural</strong> <strong>Steels</strong>,<br />
NML Technical Journal, Vol. 19 No.1<br />
February 1977, pp 17.<br />
V. P. Agarwal & B. Mohapatra, “<br />
Experiences in the Production <strong>of</strong><br />
Controlled Rolled HSLA plates at<br />
Rourkela Steel Plant”.<br />
F. B. Pickering, “High Strength<br />
Low-Alloy <strong>Steels</strong>, a Decade <strong>of</strong><br />
Progress”, <strong>Micro</strong> alloying 75<br />
Proceedings, 1976 pp 3-24.<br />
S. Horejs, V. Smid, V. Navral, T.<br />
Prnka and R. Halbrstatove, “Possible<br />
Method <strong>of</strong> Melting V+N based Rebar<br />
Steel”, Wire Industry, May 1984, pp<br />
405-408.<br />
“Columbium Treated Mild-Carbon<br />
Steel,” Mechanical Engg. 81, January<br />
1959, p 53.<br />
W. B. Morrison, “Effect <strong>of</strong> Grain<br />
Size on Stress Strain Relationships in<br />
Low Carbon Steel”. ASM Transaction<br />
quarterly, 59, 1966, pp 824-846.<br />
J. Heslop and N. J. Petch,”<br />
Dislocation Locking and Fracture <strong>of</strong> á-<br />
Iron”. Philosophic Magazine, 2, 1957,<br />
pp 649-658.<br />
L. J. Cuddy, “<strong>Micro</strong>structures<br />
Developed During Thermo Mechanical<br />
Treatment <strong>of</strong> HSLA <strong>Steels</strong>”. Met<br />
Transaction, 12A, July 1981.<br />
53<br />
November 2012