3d Frangi-Based Lung Vessel Enhancement Filter ... - DIE - UPM
3d Frangi-Based Lung Vessel Enhancement Filter ... - DIE - UPM
3d Frangi-Based Lung Vessel Enhancement Filter ... - DIE - UPM

Create successful ePaper yourself
Turn your PDF publications into a flip-book with our unique Google optimized e-Paper software.
2013 IEEE 10th International Symposium on Biomedical Imaging:<br />
From Nano to Macro<br />
San Francisco, CA, USA, April 7-11, 2013<br />
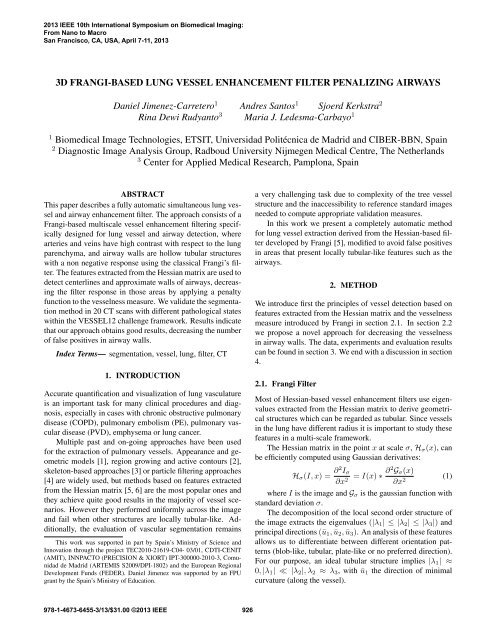
3D FRANGI-BASED LUNG VESSEL ENHANCEMENT FILTER PENALIZING AIRWAYS<br />
Daniel Jimenez-Carretero 1 Andres Santos 1 Sjoerd Kerkstra 2<br />
Rina Dewi Rudyanto 3 Maria J. Ledesma-Carbayo 1<br />
1 Biomedical Image Technologies, ETSIT, Universidad Politécnica de Madrid and CIBER-BBN, Spain<br />
2 Diagnostic Image Analysis Group, Radboud University Nijmegen Medical Centre, The Netherlands<br />
3 Center for Applied Medical Research, Pamplona, Spain<br />
ABSTRACT<br />
This paper describes a fully automatic simultaneous lung vessel<br />
and airway enhancement filter. The approach consists of a<br />
<strong>Frangi</strong>-based multiscale vessel enhancement filtering specifically<br />
designed for lung vessel and airway detection, where<br />
arteries and veins have high contrast with respect to the lung<br />
parenchyma, and airway walls are hollow tubular structures<br />
with a non negative response using the classical <strong>Frangi</strong>’s filter.<br />
The features extracted from the Hessian matrix are used to<br />
detect centerlines and approximate walls of airways, decreasing<br />
the filter response in those areas by applying a penalty<br />
function to the vesselness measure. We validate the segmentation<br />
method in 20 CT scans with different pathological states<br />
within the VESSEL12 challenge framework. Results indicate<br />
that our approach obtains good results, decreasing the number<br />
of false positives in airway walls.<br />
Index Terms— segmentation, vessel, lung, filter, CT<br />
1. INTRODUCTION<br />
Accurate quantification and visualization of lung vasculature<br />
is an important task for many clinical procedures and diagnosis,<br />
especially in cases with chronic obstructive pulmonary<br />
disease (COPD), pulmonary embolism (PE), pulmonary vascular<br />
disease (PVD), emphysema or lung cancer.<br />
Multiple past and on-going approaches have been used<br />
for the extraction of pulmonary vessels. Appearance and geometric<br />
models [1], region growing and active contours [2],<br />
skeleton-based approaches [3] or particle filtering approaches<br />
[4] are widely used, but methods based on features extracted<br />
from the Hessian matrix [5, 6] are the most popular ones and<br />
they achieve quite good results in the majority of vessel scenarios.<br />
However they performed uniformly across the image<br />
and fail when other structures are locally tubular-like. Additionally,<br />
the evaluation of vascular segmentation remains<br />
This work was supported in part by Spain’s Ministry of Science and<br />
Innovation through the project TEC2010-21619-C04- 03/01, CDTI-CENIT<br />
(AMIT), INNPACTO (PRECISION & XIORT) IPT-300000-2010-3, Comunidad<br />
de Madrid (ARTEMIS S2009/DPI-1802) and the European Regional<br />
Development Funds (FEDER). Daniel Jimenez was supported by an FPU<br />
grant by the Spain’s Ministry of Education.<br />
a very challenging task due to complexity of the tree vessel<br />
structure and the inaccessibility to reference standard images<br />
needed to compute appropriate validation measures.<br />
In this work we present a completely automatic method<br />
for lung vessel extraction derived from the Hessian-based filter<br />
developed by <strong>Frangi</strong> [5], modified to avoid false positives<br />
in areas that present locally tubular-like features such as the<br />
airways.<br />
2. METHOD<br />
We introduce first the principles of vessel detection based on<br />
features extracted from the Hessian matrix and the vesselness<br />
measure introduced by <strong>Frangi</strong> in section 2.1. In section 2.2<br />
we propose a novel approach for decreasing the vesselness<br />
in airway walls. The data, experiments and evaluation results<br />
can be found in section 3. We end with a discussion in section<br />
4.<br />
2.1. <strong>Frangi</strong> <strong>Filter</strong><br />
Most of Hessian-based vessel enhancement filters use eigenvalues<br />
extracted from the Hessian matrix to derive geometrical<br />
structures which can be regarded as tubular. Since vessels<br />
in the lung have different radius it is important to study these<br />
features in a multi-scale framework.<br />
The Hessian matrix in the point x at scale σ, H σ (x), can<br />
be efficiently computed using Gaussian derivatives:<br />
H σ (I, x) = ∂2 I σ<br />
∂x 2<br />
= I(x) ∗ ∂2 G σ (x)<br />
∂x 2 (1)<br />
where I is the image and G σ is the gaussian function with<br />
standard deviation σ.<br />
The decomposition of the local second order structure of<br />
the image extracts the eigenvalues (|λ 1 | ≤ |λ 2 | ≤ |λ 3 |) and<br />
principal directions (ū 1 , ū 2 , ū 3 ). An analysis of these features<br />
allows us to differentiate between different orientation patterns<br />
(blob-like, tubular, plate-like or no preferred direction).<br />
For our purpose, an ideal tubular structure implies |λ 1 | ≈<br />
0, |λ 1 | ≪ |λ 2 |, λ 2 ≈ λ 3 , with ū 1 the direction of minimal<br />
curvature (along the vessel).<br />
978-1-4673-6455-3/13/$31.00 ©2013 IEEE 926
2.2. Our Approach<br />
(a)<br />
Fig. 1: (a) Rendering of vesselness extraction for lung vessels.<br />
(b) Airways enhancement (threshold=15% for visualization).<br />
Using this information, <strong>Frangi</strong> et al. [5] designed a vesselness<br />
function, VF σ , to measure the similarity of one structure<br />
to an ideal tube:<br />
⎧<br />
0 if λ 2 > 0 or λ 3 > 0, 1<br />
⎪⎨ (<br />
VF σ (x) = 1 − exp<br />
(− R A 2 ))<br />
2α 2<br />
⎪⎩<br />
(<br />
1 − exp<br />
(b)<br />
exp<br />
(− R B 2 )<br />
2β<br />
)) (− 2 S2<br />
2c 2<br />
where α, β, c are parameters that control the sensitivity of the<br />
filter to the dissimilarity measures that distinguish between<br />
tube-like and plate-like structures (R A ), blob-like (R B ) and<br />
background (S):<br />
R A = |λ 2|<br />
|λ 3 |<br />
(2)<br />
(3)<br />
R B = √ |λ 1|<br />
(4)<br />
|λ2 λ 3 |<br />
√<br />
S = λ 2 1 + λ2 2 + λ2 3 (5)<br />
The final vesselness measure integrates the filter responses<br />
at different scales taking the maximum response:<br />
V F (x) =<br />
max VF σ (x) (6)<br />
σ min≤σ≤σ max<br />
Regardless of these dissimilarity measures, the filter<br />
shows a non-negative response in structures that are locally<br />
and partially tubular in the image. This is the case of airway<br />
walls, where a) they are partially tubes with the radius of wall<br />
thickness and b) sometimes they are in contact with vessels<br />
becoming indistinguishable from them.<br />
In order to overcome these difficulties it will be necessary<br />
to link the vesselness information with the airways structure<br />
to avoid false detections in those areas. Our approach will<br />
use the features previously extracted from the classical <strong>Frangi</strong><br />
filter to do it so.<br />
1 Condition for vessels brighter than background. For vessels darker than<br />
background the condition would be: λ 2 < 0 or λ 3 < 0<br />
In order to avoid erroneous detections in airway walls, information<br />
about the bronchial tree becomes necessary. Some<br />
works noticed the importance of airway wall removal before<br />
the lung vessel segmentation step, but in most of the cases<br />
they used an independent method for airways detection and<br />
morphological operations in order to attenuate or remove airway<br />
walls [7, 8]. Generally, those methods assumed a constant<br />
wall thickness in every bronchial generation which is not<br />
realistic. Furthermore, the additional airway segmentation increase<br />
computation times and complexity of the algorithm.<br />
Our proposal performs vessel and airway enhancement at<br />
the same time and suggests an adaptive airway wall attenuation<br />
in order to achieve a more accurate and efficient vessel<br />
enhancement. The first step consists on bronchial tubes detection.<br />
Later, we estimate airway walls depending on the<br />
bronchial generation. Finally, a penalty function is applied in<br />
wall areas to decrease the response of the vesselness filter.<br />
Airway enhancement. Since airways are tubular structures<br />
too, the same multi-scale filtering framework for the<br />
vessel enhancement could be used. Actually, if the scale range<br />
is appropriate (covering the possible radius of vessels and airways),<br />
a unique eigenvalue analysis of the Hessian would be<br />
necessary to extract both (Fig. 1).<br />
Thus, we compute the vesselness function (equation 2)<br />
twice, one for the vessel extraction, VF σ vessel<br />
(x), and one<br />
for the airways extraction, VF σ airway (x). The only difference<br />
between both is the condition of being zero, changing from<br />
λ 2 > 0 or λ 3 > 0 in vessel detection (structures brighter<br />
than the background) to λ 2 < 0 or λ 3 < 0 in airways detection<br />
(structures darker than the background). To get the<br />
final measure we use equation 6, obtaining V F vessel (x) and<br />
V F airway (x). The increment in computing time is minimum.<br />
Airway centerline extraction. A skeletonization algorithm<br />
for 3D grayscale images based on [9] is used to extract<br />
the centerlines of bronchial tubes. It uses not only the structural<br />
information, but the density (in this case is the vesselness<br />
measure VF σ airway (x)) to obtain a more accurate estimation<br />
of centerlines.<br />
Fig. 2: Airway estimation.<br />
green.<br />
Wall candidates are shown in<br />
927
Airway wall estimation. Taking advantage of features<br />
extracted from the Hessian analysis, we can use the scale, σ,<br />
and the first eigenvector, ū 1 , of maximal filter response in<br />
each point of the airway centerline. They will represent, respectively,<br />
lumen radius and directions along the vessel, so<br />
we can use them to estimate the position of the inner part of<br />
airway walls along the bronchial tubes.<br />
In order to estimate the position of the external part of airway<br />
walls we used wall thickness values wt(σ) measured in<br />
[10] for CT images, based on Weibel’s Model [11] which depend<br />
on bronchial generation. Fig. 2 shows an scheme of airway<br />
wall estimation in one point of the bronchial centerline.<br />
Wall candidate voxels will be in the intersection between the<br />
plane with normal vector ū 1 (direction along the airway) and<br />
a hollow sphere of radius σ and (σ + wt(σ)).<br />
Penalty function. The attenuation of airway walls is performed<br />
using a penalty function over candidate voxels in the<br />
walls. Since airway detection is a pseudo-probability segmentation<br />
(not a binary one), V F airway measures could be interpreted<br />
as confidence of having an airway in a specific point.<br />
This information is important when the penalty function is<br />
applied to wall voxels. Thus, we subtract the airway score<br />
V F airway (y) obtained in one point y of its centerline, to all<br />
the vessels scores V F vessel (x) obtained in the wall candidates<br />
for this specific point in the centerline of the bronchial tube<br />
(x ∈ W allCandidates(y)) as follows:<br />
V F vessel (x ∈ W allCandidates(y)) =<br />
max(0, V F vessel (x) − V F airway (y))<br />
The principal idea under this penalty function is the reduction<br />
of vessel confidence depending on the airway confidence.<br />
3.1. Dataset<br />
3. EXPERIMENTS AND RESULTS<br />
The dataset consists of 20 chest CT scans made available in<br />
the scope of the ISBI VESSEL12 Challenge. Details can be<br />
found on their website 2 .<br />
The scans come from different scanners and protocols, using<br />
contrast media in approximately half of the CT images.<br />
They are nearly isotropic with a maximum slice spacing of<br />
1 mm. About half of the scans contain pathologies such as<br />
emphysema, nodules or pulmonary embolisms.<br />
For each scan, a binary lungmask was available. They<br />
were used to reduce the scope in the vessel search. A binary<br />
erosion with a ball structuring element (radius 3 pixels) was<br />
applied and the rest of the image was fixed to the mode intensity<br />
inside the mask to reduce boundary effects in the limits<br />
of the lung.<br />
2 http://vessel12.grand-challenge.org/<br />
(7)<br />
3.2. Evaluation Measures<br />
The results have been uploaded online as a submission to<br />
VESSEL12 challenge, and evaluated identically as the rest<br />
of the participants. A variety of axial slices were selected<br />
from each image for manual labeling. In each slice, a large<br />
number of points within the lung fields (local maxima and<br />
ramdom points) were labeled by 3 observers as: vessel, lungparenchyma,<br />
fissure, airway/airwaywall or lesion.<br />
ROC curve analysis were used to evaluate the performance<br />
of the method. Different probability threshold values<br />
were used to compute true/false positives and true/false negatives<br />
and create points in the ROC curve. Finally, the area<br />
under the ROC curve Az and specifity/sensitivity at optimal<br />
threshold were computed.<br />
3.3. Results<br />
For the experiments we use a medium range of scales (σ =<br />
{0.5, 1, 1.5, ..., 3.5}) and parameters α = β = 0.5, c = 500.<br />
The filtered output was normalized to the range [0,255].<br />
Table 1 summarizes evaluation results on the dataset.<br />
Mean areas under the ROC curves Az (0.978 ± 0.013) show<br />
quite good performance of the algorithm in vessel detection,<br />
and values of specificity (0.900 ± 0.087) and sensitivity<br />
(0.973 ± 0.024) at optimal threshold are higher than 0.9 in<br />
almost all cases. As it is expected, scores become lower when<br />
vessels are smaller due to the size of the filter is related to the<br />
quantity of information used to evaluate the vesselness score.<br />
Moreover, contrast in small vessels is low. This makes the<br />
detection of high generation vessels a hard task.<br />
Results for vessels/airways walls are lower than the visual<br />
examination made us expect (Figure 3). The classical<br />
<strong>Frangi</strong> filter obtains values of Az between 0.738 and 0.906<br />
depending on the scales selection, specificity values between<br />
0.380 and 0.725 and sensitivity values between 0.889 and<br />
0.977. Our method outperforms these values slightly using<br />
(a)<br />
Fig. 3: (a) Example of critical area with vessels and airway<br />
walls in contact. (b) Segmentations obtained using <strong>Frangi</strong> filter<br />
(red) and our approach (white). Light pink is shown in<br />
common areas. Yellow arrows and elipse point to improvement<br />
areas. Threshold=5% of maximum vesselness response.<br />
(b)<br />
928
Table 1: Area under the ROC curve (Az), specificity and sensitivity<br />
at optimal threshold (from 0 to 1) results on the dataset<br />
using positive-points/negative-points as reference standard<br />
Az Specificity Sensitivity<br />
All vessels/Non-vessels 0.978 0.900 0.973<br />
Small vessels/Non-vessels 0.947 0.887 0.953<br />
Medium vessels/Non-vessels 0.985 0.968 0.953<br />
Large vessels/Non-vessels 0.987 0.991 0.965<br />
<strong>Vessel</strong>s/Airways walls 0.918 0.756 0.973<br />
the same scales vector. Nevertheless, the evaluation framework<br />
uses a relatively low amount of positive and negative<br />
points (compared with number of voxels involved), so the validation<br />
maybe is a little limited and broader specific studies<br />
could improve these results.<br />
A visual evaluation of segmentation results could assess<br />
strongly the contribution of this method in airway wall areas.<br />
An analysis of vessel connectivity sometimes shows incorrect<br />
connections between different vessel branches when airways<br />
wall removal is not applied. Our approach avoids many of the<br />
false positives in wall areas, correcting these mis-connections<br />
that could influence obtaining a more reliable vessel tree as<br />
well as other derived connectivity based measures<br />
Moreover, our method could simplify estimations of airway<br />
lumen area/arterial area (LA/AA ratio), a critical marker<br />
of bronchiectasis in, for example, cystic fibrosis studies.<br />
4. DISCUSSION AND CONCLUSIONS<br />
In this paper we have presented a novel approach to enhance<br />
lung vessels simultaneously to airway in CT scans. An existing<br />
method for vessel enhancement was improved to reduce<br />
false positives in airways walls, obtaining good results<br />
in vessel detection and airway wall exclusion. Since mean<br />
Az shows good results discerning vessels and airways walls,<br />
there is room for improvement in specificity and sensitivity.<br />
Additionally, a new vesselness function specifically designed<br />
for airway enhancement or the independent selection of parameters<br />
for vessel and airway segmentations could improve<br />
airway lumen detection and consequently, airway wall estimation.<br />
In studies where a connectivity analysis is important, our<br />
method could achieve more reliable segmentations of vessels.<br />
Its use could be also critical when a separation between veins<br />
and arteries is needed or in irrigation studies assessing which<br />
vessel branches supply blood to specific lung areas.<br />
Finally, this approach could have a direct application in<br />
bronchiectasis studies where a reliable LA/AA ratio is critical.<br />
5. REFERENCES<br />
[1] H. Shikata, E.A. Hoffman, and M. Sonka, “Automated<br />
segmentation of pulmonary vascular tree from 3D CT<br />
images,” in Proc. SPIE Int. Symp. Medical Imaging,<br />
2004, vol. 5369, pp. 107–116.<br />
[2] L. M. Lorigo, O. D. Faugeras, W. E. L. Grimson,<br />
R. Keriven, R. Kikinis, A. Nabavi, and C.-F. Westin,<br />
“Curves: Curve evolution for vessel segmentation,”<br />
Medical Image Analysis, vol. 5, pp. 195–206, 2001.<br />
[3] T. Tozaki, Y. Kawata, N. Niki, H. Ohmatsu, and<br />
N. Moriyama, “3-D visualization of blood vessels and<br />
tumor using thin slice CT images,” in Nuclear Science<br />
Symposium and Medical Imaging Conference. IEEE,<br />
1994, vol. 3, pp. 1470–1474.<br />
[4] R.S.J. Estepar, J.C. Ross, K. Russian, T. Schultz, G.R.<br />
Washko, and G.L. Kindlmann, “Computational vascular<br />
morphometry for the assessment of pulmonary vascular<br />
disease based on scale-space particles,” in Biomedical<br />
Imaging (ISBI), 2012 9th IEEE International Symposium<br />
on. IEEE, 2012, pp. 1479–1482.<br />
[5] A. <strong>Frangi</strong>, W. Niessen, K. Vincken, and M. Viergever,<br />
“Multiscale vessel enhancement filtering,” Medical Image<br />
Computing and Computer-Assisted Interventation-<br />
MICCAI98, pp. 130–137, 1998.<br />
[6] Y. Sato, S. Nakajima, N. Shiraga, H. Atsumi, S. Yoshida,<br />
T. Koller, G. Gerig, and R. Kikinis, “Three-dimensional<br />
multi-scale line filter for segmentation and visualization<br />
of curvilinear structures in medical images,” Medical<br />
Image Analysis, vol. 2, no. 2, pp. 143–168, 1998.<br />
[7] E. van Dongen and B. van Ginneken, “Automatic<br />
segmentation of pulmonary vasculature in thoracic CT<br />
scans with local thresholding and airway wall removal,”<br />
in Biomedical Imaging: From Nano to Macro, 2010<br />
IEEE International Symposium, 2010, pp. 668–671.<br />
[8] C. Fetita, P.Y. Brillet, and F.J. Prêteux, “Morphogeometrical<br />
approach for <strong>3d</strong> segmentation of pulmonary<br />
vascular tree in multi-slice CT,” in SPIE Medical Imaging,<br />
2009, vol. 7259, pp. 72594F–72594F.<br />
[9] N. Gagvani and D. Silver, “Parameter-controlled volume<br />
thinning,” Graphical Models and Image Processing,<br />
vol. 61, no. 3, pp. 149–164, 1999.<br />
[10] M. Montaudon, P. Desbarats, P. Berger, G. De Dietrich,<br />
R. Marthan, and F. Laurent, “Assessment of bronchial<br />
wall thickness and lumen diameter in human adults using<br />
multi-detector computed tomography: comparison<br />
with theoretical models,” Journal of Anatomy, vol. 211,<br />
no. 5, pp. 579–588, 2007.<br />
[11] E.R. Weibel, B. Sapoval, and M. Filoche, “Design of<br />
peripheral airways for efficient gas exchange,” Respiratory<br />
Physiology & Neurobiology, vol. 148, no. 1, pp.<br />
3–21, 2005.<br />
929