UNITECR Presentation September 2007 - QMAG
UNITECR Presentation September 2007 - QMAG
UNITECR Presentation September 2007 - QMAG

You also want an ePaper? Increase the reach of your titles
YUMPU automatically turns print PDFs into web optimized ePapers that Google loves.
Queensland<br />
Magnesia<br />
Scarce Natural<br />
Resources:<br />
Magnesia<br />
Supply and Demand<br />
Fundamentals<br />
Alan Roughead<br />
Managing Director<br />
<strong>UNITECR</strong>, Dresden<br />
19 th <strong>September</strong> <strong>2007</strong>
China is driving world growth…<br />
www.qmag.com.au<br />
P 2
China’s urbanisation is driving industrialisation and growth<br />
• China’s urban population will grow 438m by 2020<br />
• This is greater than the total population of USA + Japan<br />
Tier 1: Population > 4.5m and GDP/capita > US$3,000.<br />
Tier 2: Population > 4.5m or GDP/capita > US$3,000.<br />
Tier 3: Population 1.5-4.5m and GDP/capita US$1,500-US$3,000.<br />
Source: BHP Billiton<br />
www.qmag.com.au<br />
P 3
China is quickly moving to be the world’s No 1 consumer of<br />
key metals and minerals<br />
Source: BHP Billiton<br />
www.qmag.com.au<br />
P 4
China is the clear No 1 producer of steel and cement<br />
Source: Laplace Conseil<br />
www.qmag.com.au<br />
P 5
China’s growth is expected to continue for decades<br />
Ross Garnaut and Ligang Song “China’s Resources Demand At<br />
The Turning Point”, August <strong>2007</strong>:<br />
• China is in the early/moderate stages of growth in demand. It will be<br />
vastly more resource intensive and last longer than Japan and Korea.<br />
• China will grow by 4-8 times over the next 20 years. This is comparable<br />
to the total demand of the industrial world today.<br />
• China has commenced the move from a labour intensive economy to a<br />
capital intensive economy. This will require more minerals and metals.<br />
• Minerals and metals real prices will be much higher than they were<br />
during the last 25 years of 20 th century.<br />
• www.crawford.anu.edu.au/research_units/china/rio.php<br />
BHP Billiton does not expect consumption to peak until 2050.<br />
www.qmag.com.au<br />
P 6
China’s consumption intensity is still low<br />
Source: BHP Billiton<br />
www.qmag.com.au<br />
P 7
China’s consumption intensity is still low<br />
Source: Garnaut and Song<br />
www.qmag.com.au<br />
P 8
Major investments are being made on the strength of<br />
China’s growth story<br />
Rio acquires Alcan $38b<br />
Freeport acquires Phelps Dodge $26b<br />
Xstrata acquires Falconbridge $20b<br />
CVRD acquires Inco $19b<br />
BHP Billiton acquires WMC $9b<br />
Norilsk acquires LionOre $5b<br />
BHP Billiton organic growth pipeline $70b<br />
www.qmag.com.au<br />
P 9
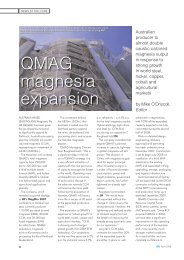
World magnesia industry 1992 – 2003<br />
The emergence of the Chinese MgO industry.<br />
Fragmented cottage industry.<br />
Poor safety and environmental standards.<br />
No recognition of proper accounting standards.<br />
Low global steel and refractory growth.<br />
Lack of market discipline (China + traders).<br />
Exports flooded the world market.<br />
Prices declined significantly.<br />
www.qmag.com.au<br />
P 10
CHINESE 97 EFM PRICES 1992-2003<br />
(US$/mt fob Europe)<br />
CHINESE 98 EFM PRICES 1992-2003<br />
(US$/mt fob Europe)<br />
500<br />
1000<br />
400<br />
800<br />
300<br />
600<br />
200<br />
400<br />
100<br />
200<br />
0<br />
92 93 94 95 96 97 98 99 00 01 02 03<br />
0<br />
92 93 94 95 96 97 98 99 00 01 02 03<br />
CHINESE 97 DBM PRICES 1992-2003<br />
(US$/mt fob Europe)<br />
350<br />
300<br />
250<br />
200<br />
150<br />
100<br />
50<br />
Prices reduced significantly (40-50%).<br />
MgO capacity closures outside China.<br />
>10 DBM producers – 1,000ktpa.<br />
>10 EFM producers – 100ktpa.<br />
0<br />
92 93 94 95 96 97 98 99 00 01 02 03 Source: <strong>QMAG</strong><br />
www.qmag.com.au<br />
P 11
World magnesia industry 2003 – <strong>2007</strong><br />
Acceleration of urbanisation and industrialisation of China.<br />
Massive growth in Chinese steel and refractory industries.<br />
Chinese MgO producers greater domestic/down stream focus.<br />
Fundamental and major shift in Chinese Govt policy:<br />
• Protect scarce resources<br />
• Elimination of export rebates and introduction of export taxes<br />
• Restriction in export licences<br />
• Focus on improving safety and environmental standards<br />
• RMB revaluation<br />
Chinese costs increasing. Quality declining. Availability reducing.<br />
Capacity closures permanent. Limited new capacity being added.<br />
Prices increased significantly.<br />
www.qmag.com.au<br />
P 12
600<br />
CHINESE 97 EFM PRICES 1992-<strong>2007</strong><br />
(US$/mt fob Europe)<br />
1000<br />
CHINESE 98 EFM PRICES 1992-<strong>2007</strong><br />
(US$/mt fob Europe)<br />
500<br />
800<br />
400<br />
600<br />
300<br />
200<br />
400<br />
100<br />
200<br />
0<br />
92 93 94 95 96 97 98 99 00 01 02 03 04 05 06 07<br />
0<br />
92 93 94 95 96 97 98 99 00 01 02 03 04 05 06 07<br />
400<br />
CHINESE 97 DBM PRICES 1992-<strong>2007</strong><br />
(US$/mt fob Europe)<br />
300<br />
200<br />
100<br />
Prices increased significantly (80-100%).<br />
Closed capacity could not re-open.<br />
Limited new capacity brought on stream.<br />
0<br />
92 93 94 95 96 97 98 99 00 01 02 03 04 05 06 07<br />
Source: <strong>QMAG</strong><br />
www.qmag.com.au<br />
P 13
China will improve safety and environment … but at a cost<br />
www.qmag.com.au<br />
P 14
World magnesia industry <strong>2007</strong> –<br />
Demand side<br />
China’s industrialisation will continue to drive world growth.<br />
Strong growth in MgO demand from steel, cement, nickel,<br />
copper, cobalt and environmental markets.<br />
<strong>QMAG</strong> market study. Conservative growth assumptions:<br />
• Total MgO growth 4.2% pa (330ktpa)<br />
• Refractory MgO growth 3.8% pa (220ktpa)<br />
• Chemical MgO growth 5.2% pa (110ktpa)<br />
• High value refractory MgO growth 4.3% (70ktpa)<br />
• High value chemical MgO growth 15.3% pa (60ktpa)<br />
Strong growth rates will continue for many years.<br />
www.qmag.com.au<br />
P 15
World magnesia industry <strong>2007</strong> –<br />
Supply side<br />
Chinese internal growth and Govt policy will constrain MgO<br />
export availability.<br />
Chinese costs will continue to increase and align with<br />
industrialised nations – especially energy, labour and HSE.<br />
Global MgO inventories are at low levels.<br />
Limited spare capacity/addition of new capacity outside China.<br />
Global growth requires the addition of new capacity equivalent to<br />
1½ <strong>QMAG</strong>’s per year.<br />
Significant barriers to entry – availability of new deposits, high<br />
greenfields capex requirements, availability of low cost energy.<br />
www.qmag.com.au<br />
P 16
World magnesia industry <strong>2007</strong> –<br />
Conclusions<br />
MgO market will remain tight and prices high for some time.<br />
There will be a greater strategic focus on scarce natural resources<br />
from both industrial minerals producers and consumers.<br />
Refractory companies will need to revisit their raw materials<br />
strategies:<br />
• Dependency on Chinese raw materials<br />
• Backward integration and ownership of raw materials<br />
www.qmag.com.au<br />
P 17
China is driving world growth…<br />
www.qmag.com.au<br />
P 18
… but don’t forget Brazil, Russia and India.<br />
www.qmag.com.au<br />
P 19
Thank you<br />
www.qmag.com.au<br />
P 20