(API): What is it? - East Side Union High School District
(API): What is it? - East Side Union High School District
(API): What is it? - East Side Union High School District

You also want an ePaper? Increase the reach of your titles
YUMPU automatically turns print PDFs into web optimized ePapers that Google loves.
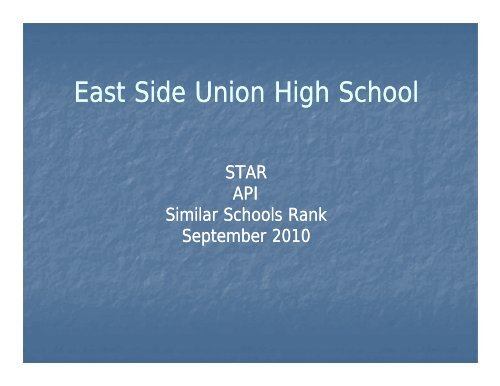
<strong>East</strong> <strong>Side</strong> <strong>Union</strong> <strong>High</strong> <strong>School</strong><br />
STAR<br />
<strong>API</strong><br />
Similar <strong>School</strong>s Rank<br />
September 2010
<strong>API</strong><br />
Academic Performance Index<br />
2010
<strong>API</strong><br />
• The <strong>API</strong> <strong>is</strong> a single number, ranging from a low<br />
of 200 to a high of 1000, that reflects a school’s,<br />
an LEA’s s, or a subgroup’s s performancelevel<br />
level,<br />
based on the results of statewide testing.<br />
• Its purpose <strong>is</strong> to measure the academic<br />
performance and growth of schools.<br />
• It <strong>is</strong> a measure created from CA state Law.
• D<strong>is</strong>tricts<br />
• <strong>School</strong>s<br />
• Subgroups<br />
Who Gets An <strong>API</strong> Score?<br />
• Ethnic<strong>it</strong>y, EL, Socioeconomically D<strong>is</strong>advantaged,<br />
SPED<br />
• new category - 2 or more races<br />
• 100 students t or 50 students t if 15% or more of<br />
population w<strong>it</strong>h scores
<strong>East</strong> <strong>Side</strong> <strong>Union</strong> <strong>High</strong> <strong>School</strong> D<strong>is</strong>trict <strong>API</strong><br />
ESUHSD <strong>API</strong> 2008-2010<br />
State <strong>API</strong><br />
2009-10<br />
2007-08 2008-09 2009-10<br />
BASE 709 720 730<br />
GROWTH 729 720 730 736<br />
CHANGE 11 10 6
<strong>East</strong> <strong>Side</strong> <strong>Union</strong> <strong>High</strong> <strong>School</strong> D<strong>is</strong>trict<br />
<strong>School</strong> <strong>API</strong> s<br />
2009 2009/2010 2010<br />
2010<br />
BASE <strong>API</strong> GROWTH GROWTH <strong>API</strong> State<br />
Similar<br />
<strong>School</strong><br />
HIGH SCHOOLS Rank Rank<br />
Andrew Hill 683 -3 680 3 2<br />
Evergreen Valley 837 2 839 9 4<br />
Independence d 750 6 756 6 7<br />
James Lick 659 22 681 3 6<br />
Mt Pleasant 693 3 696 4 6<br />
Oak Grove 699 5 704 4 3<br />
Piedmont Hills 814 -5 809 9 5<br />
Santa Teresa 763 14 777 7 2<br />
Silver Creek 763 8 771 7 7<br />
W. C. Overfelt 654 4 658 3 8<br />
Yerba Buena 662 11 673 3 5<br />
Apollo 590* 7 597* NA NA<br />
Foothill 626* -6 620* NA NA<br />
Pegasus 531* 125 656* NA NA<br />
Phoenix 587* -21 566* NA NA
James Lick <strong>API</strong><br />
2009<br />
Growth<br />
Actual<br />
2010<br />
Met Target<br />
Base <strong>API</strong><br />
Target<br />
Growth<br />
Growth <strong>API</strong><br />
<strong>API</strong><br />
<strong>School</strong>-wide<br />
659 7 22 681 Yes<br />
n = 859<br />
H<strong>is</strong>panic<br />
n = 644<br />
SED<br />
n = 573<br />
640 8 15 655 Yes<br />
648 8 23 671 Yes<br />
ELL<br />
609 10 4 613 No<br />
N = 427
2009<br />
Base <strong>API</strong><br />
Silver Creek <strong>API</strong><br />
Growth<br />
Target<br />
Actual<br />
Growth<br />
2010<br />
Growth <strong>API</strong><br />
Met Target<br />
<strong>API</strong><br />
<strong>School</strong>-wide<br />
763 5 8 771 Yes<br />
n = 1747<br />
Asian<br />
n = 742<br />
Filipino<br />
n = 200<br />
H<strong>is</strong>panic<br />
n = 611<br />
836 A 2 838 Yes<br />
786 5 15 801 Yes<br />
677 6 -3 674 No<br />
SED 732 5 15 747 Yes<br />
n = 860<br />
ELL<br />
N = 531<br />
687 6 -26<br />
661 No
James Lick Rank<br />
• State t Rank = 3<br />
• Similar <strong>School</strong>s Rank = 6<br />
• Median Base <strong>API</strong> = 659 Growth <strong>API</strong> = 681<br />
• Range in Base <strong>API</strong> 542 – 740<br />
• JL Base <strong>API</strong> = 659 Growth <strong>API</strong> = 681<br />
• State Rank<br />
• all schools in CA divided by 10 groups<br />
• 10 highest – 1 lowest<br />
• Similar <strong>School</strong>s Rank<br />
• 100 schools w<strong>it</strong>h similar demographics<br />
• Divide into 10 groups<br />
• 10 highest – 1 lowest<br />
• Rank of 6 <strong>is</strong> like being in the 60 th percentile
Silver Creek Rank<br />
• State t Rank = 7<br />
• Similar <strong>School</strong>s Rank = 7<br />
• Median Base <strong>API</strong> = 757 Growth <strong>API</strong> = 766<br />
• Range in Base <strong>API</strong> 626 – 890<br />
• EVHS Base <strong>API</strong> = 763 Growth <strong>API</strong> = 771<br />
• State Rank<br />
• all schools in CA divided by 10 groups<br />
• 10 highest – 1 lowest<br />
• Similar <strong>School</strong>s Rank<br />
• 100 schools w<strong>it</strong>h similar demographics<br />
• Divide into 10 groups<br />
• 10 highest – 1 lowest<br />
• Rank of 7 <strong>is</strong> like being in the 70 th percentile
Data Quest<br />
• http://dq.cde.ca.gov/dataquest/<br />
• For detailed information on all school go<br />
to th<strong>is</strong> webs<strong>it</strong>e
Tests Used To Calculate The <strong>API</strong><br />
• California Standards Tests – CST<br />
• Engl<strong>is</strong>h, Math, Science, Social Science, Grade 10 Science<br />
• Grades 9 - 11<br />
• California Modified Assessments – CMA 2011<br />
• Students w<strong>it</strong>h d<strong>is</strong>abil<strong>it</strong>ies<br />
• Engl<strong>is</strong>h, Algebra 1, Geometry, Grade 10 Science<br />
• California Alternative Performance Assessment –CAPA<br />
• Students w<strong>it</strong>h severe cogn<strong>it</strong>ive d<strong>is</strong>abil<strong>it</strong>ies<br />
• Engl<strong>is</strong>h, Math, Grade 10 Science<br />
• California <strong>High</strong> <strong>School</strong> Ex<strong>it</strong> Exam – CAHSEE<br />
• Grade 10 student results<br />
• Grade 11 – 12 student passing results
<strong>API</strong> Content Weight<br />
Content Area<br />
Approximate<br />
Weight<br />
CST/CAPA in ELA, Grades 9–11<br />
11 27.1%<br />
CST/CAPA in Mathematics, Grades 9–11<br />
18.1%<br />
CST/CAPA in Science, Grades 9–11<br />
22.9%<br />
CST in Social Science, Grades 9–11<br />
11 13.9%<br />
CAHSEE ELA, Grades 10–1212 9.0%<br />
CAHSEE Mathematics, Grades 10–1212 9.0%<br />
Note: Data in these tables assume an equal number of valid scores at each grade level and<br />
no m<strong>is</strong>sing data. If some students at a school do not take one or more tests, the indicator weights<br />
would be different than those shown above.
How Scores Count in the <strong>API</strong><br />
• CST/CMA/CAPA<br />
• Advanced = 1000 points<br />
• Proficient = 875 points<br />
• Basic = 700 points<br />
• Below Basic = 500 points<br />
• Far Below Basic = 200 points<br />
• CAHSEE<br />
• Pass = 1000<br />
Grade 10<br />
• Fail = 200<br />
• Pass = 1000<br />
Grade 11-12
Other Score Adjustments<br />
• No Math or Science - CST/CMA/CAPA<br />
• No Math test taken<br />
• Assigned a score of 200<br />
• No Science test taken<br />
• Assigned a score of 200
Improving <strong>API</strong> Scores<br />
• Students w<strong>it</strong>h higher proficiency levels get<br />
more points.<br />
• Get more points moving lower achieving<br />
students up proficiency levels.<br />
• FBB to BB = 300 more points<br />
• FBB to B = 500 more points<br />
• Prof to Adv = 125 more points<br />
• B to Prof = 175 points<br />
• Get more students passing CAHSEE<br />
• Get more students taking Math & Science
<strong>API</strong> Spreadsheet Calculator<br />
lato<br />
• Examples of moving students up<br />
proficiency levels