Phillip Securities Research - Phillip CFD
Phillip Securities Research - Phillip CFD
Phillip Securities Research - Phillip CFD

Create successful ePaper yourself
Turn your PDF publications into a flip-book with our unique Google optimized e-Paper software.
Technical Analysis 16 October 2008<br />
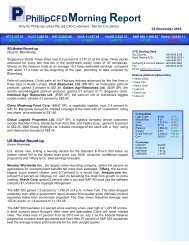
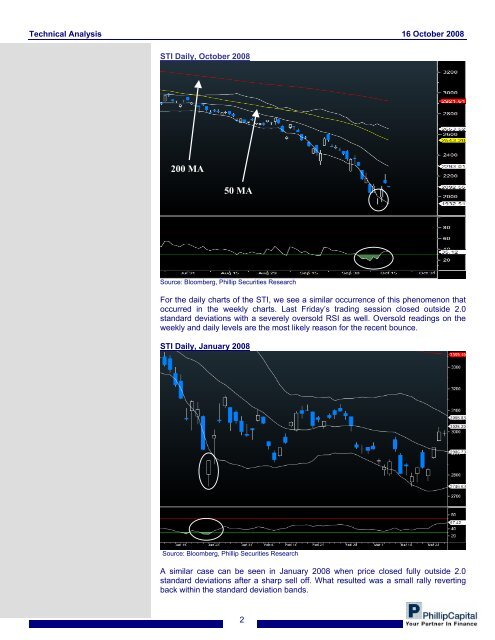
STI Daily, October 2008<br />
200 MA<br />
50 MA<br />
Source: Bloomberg, <strong>Phillip</strong> <strong>Securities</strong> <strong>Research</strong><br />
For the daily charts of the STI, we see a similar occurrence of this phenomenon that<br />
occurred in the weekly charts. Last Friday’s trading session closed outside 2.0<br />
standard deviations with a severely oversold RSI as well. Oversold readings on the<br />
weekly and daily levels are the most likely reason for the recent bounce.<br />
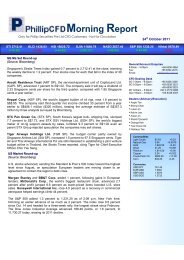
STI Daily, January 2008<br />
Source: Bloomberg, <strong>Phillip</strong> <strong>Securities</strong> <strong>Research</strong><br />
A similar case can be seen in January 2008 when price closed fully outside 2.0<br />
standard deviations after a sharp sell off. What resulted was a small rally reverting<br />
back within the standard deviation bands.<br />
2