Phillip Securities Research - Phillip CFD
Phillip Securities Research - Phillip CFD
Phillip Securities Research - Phillip CFD

You also want an ePaper? Increase the reach of your titles
YUMPU automatically turns print PDFs into web optimized ePapers that Google loves.
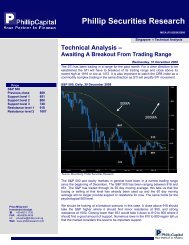
Technical Analysis 16 October 2008<br />
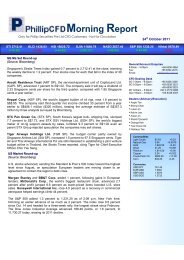
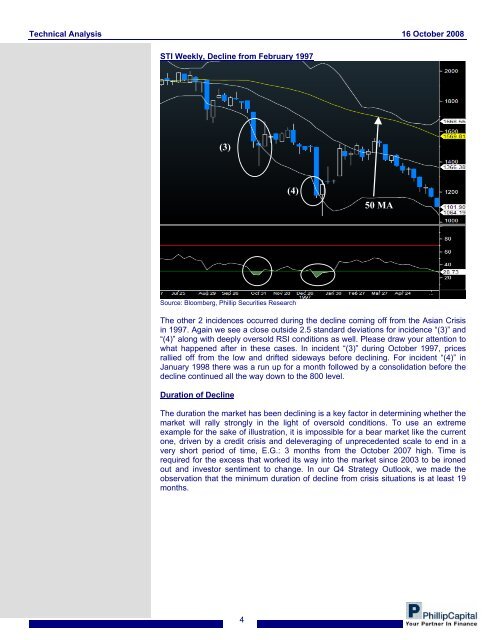
STI Weekly, Decline from February 1997<br />
(3)<br />
(4)<br />
50 MA<br />
Source: Bloomberg, <strong>Phillip</strong> <strong>Securities</strong> <strong>Research</strong><br />
The other 2 incidences occurred during the decline coming off from the Asian Crisis<br />
in 1997. Again we see a close outside 2.5 standard deviations for incidence “(3)” and<br />
“(4)” along with deeply oversold RSI conditions as well. Please draw your attention to<br />
what happened after in these cases. In incident “(3)” during October 1997, prices<br />
rallied off from the low and drifted sideways before declining. For incident “(4)” in<br />
January 1998 there was a run up for a month followed by a consolidation before the<br />
decline continued all the way down to the 800 level.<br />
Duration of Decline<br />
The duration the market has been declining is a key factor in determining whether the<br />
market will rally strongly in the light of oversold conditions. To use an extreme<br />
example for the sake of illustration, it is impossible for a bear market like the current<br />
one, driven by a credit crisis and deleveraging of unprecedented scale to end in a<br />
very short period of time, E.G.: 3 months from the October 2007 high. Time is<br />
required for the excess that worked its way into the market since 2003 to be ironed<br />
out and investor sentiment to change. In our Q4 Strategy Outlook, we made the<br />
observation that the minimum duration of decline from crisis situations is at least 19<br />
months.<br />
4