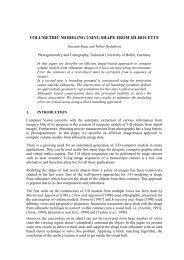
Scatterer Characterisation Using Polarimetric SAR Tomography
Scatterer Characterisation Using Polarimetric SAR Tomography
Scatterer Characterisation Using Polarimetric SAR Tomography

Create successful ePaper yourself
Turn your PDF publications into a flip-book with our unique Google optimized e-Paper software.
focussing, which is performed using standard high resolution<br />
methods such as Fourier, Capon, and MUSIC [5].<br />
A tomographic data acquisition system is constitued by K<br />
sensors, or interferometric paths. The signals xk received by<br />
each sensor k provided by D scatterers localised at height<br />
{zd} D d=1 are arranged in the K × 1 vector �x:<br />
�x =[A]�s + �n (1)<br />
where �s represents the backscattered power of the D scatterers<br />
and �n denotes a vector formed by scalar nk representing a<br />
circular Gaussian white noise. The [A] matrix, with dimension<br />
K × D, contains the phase response due to the sensor<br />
geometry only. This matrix is made up various vectors �a(zd)<br />
representing the steering vector, which corresponds to the d-th<br />
scatterer:<br />
�a(zd) =[e iφ1(zd) iφK(zd) T<br />
···e ] (2)<br />
where φk(zd) = − 4π<br />
λ<br />
each term is define by Fig. 2.<br />
zs<br />
H0<br />
√ (H0−zd+zs) 2 +(ygr+ys+ z d<br />
tan θ )2, where<br />
ys<br />
θ<br />
Ck<br />
ygr<br />
z<br />
tan θ<br />
θ z<br />
Fig. 2. Geometric parameters used during tomographic data processing.<br />
All high resolution methods are based on a covariance<br />
matrix formulation defined as:<br />
[R] =〈�x�x † 〉 which is estimated by [ ˆ N�<br />
R]=<br />
(3)<br />
n=1<br />
�xn�x † n<br />
where N > K represents the number of sample used,<br />
necessary to obtain a non-singular matrix [ ˆ R].<br />
To focus tomographic <strong>SAR</strong> data, two approaches based on<br />
high resolution methods are existing: classical- and subspacebased.<br />
Classical methods are the famous Fourier- and Caponbased<br />
approaches. The main idea is to focus the system on<br />
a certain height, corresponding to the height of a scatterer.<br />
To do that, the range of valid heights is scanned in order<br />
to find the maximum of power. The estimated powers given<br />
by Fourier- and Capon-based, ˆ PF (z) and ˆ PC(z) respectively,<br />
beamforming approaches are function of the height z:<br />
ˆPF (z) = �a(z)† [ ˆ R]�a(z)<br />
K2 and ˆ 1<br />
PC(z) =<br />
�a(z) † [ ˆ R] −1 (4)<br />
�a(z)<br />
where �a(z) represents the steering vector given by Eq. 2.<br />
The second category is based on the principle of subspace<br />
estimation. It gives an estimation of the scatterer height with<br />
an infinite resolution, independently of the signal-to-noise<br />
ratio (SNR). The must known subspace methods are MUSIC,<br />
ESPRIT, WSF [5]. In the case of tomographic <strong>SAR</strong> data<br />
processing, the MUSIC method has been used. The pseudobeamforming<br />
of MUSIC, ˆ PM(z), is given by:<br />
ˆPM(z) =<br />
1<br />
�a † ([ ÊN ][ ÊN ] † )�a<br />
where [ ÊN ] represents the noise subspace obtained after an<br />
eigendecomposition of the observed covariance matrix, [ ˆ R]=<br />
[ Ê][ˆ Λ][ Ê]† [5]. The term pseudo-beamforming is employed<br />
here because the position of the retrieved power is using only<br />
to localise the target height.<br />
The different methods presented above have been applied<br />
to a L-band data set of the E-<strong>SAR</strong>. The data were acquired<br />
in May 1998 on the test site of Oberpfaffenhofen/Germany.<br />
During the campaign fully polarimetric data sets were recorded<br />
from K =14 parallel flight tracks with a respective distance<br />
of approximatively 20 meters. The airplane used by the E-<br />
<strong>SAR</strong> is equipped with a high-precision positioning system,<br />
which allows an absolute estimation of the antenna tracks<br />
with an accuracy of few centimetres. With this data the errors<br />
arising from the aircraft movements are compensated by a new<br />
approach of motion compensation during <strong>SAR</strong> processing [6].<br />
Additionally, a very precise velocity and range delay variation<br />
compensation have been carried out. To minimise small errors<br />
in the absolute positioning of the aircraft, also a calibration<br />
of the image phases, based on the response of a single corner<br />
reflectors is performed.<br />
height (m)<br />
height (m)<br />
660<br />
650<br />
640<br />
630<br />
Fourier - HH<br />
street<br />
forest<br />
building corner<br />
reflector<br />
surface<br />
620<br />
0<br />
surface<br />
100 200 300 400 500<br />
azimuth position (pixels)<br />
MUSIC (1) - HH<br />
660<br />
street<br />
650<br />
640<br />
630<br />
forest<br />
building corner<br />
reflector<br />
surface<br />
620<br />
0<br />
surface<br />
100 200 300 400 500<br />
azimuth position (pixels)<br />
height (m)<br />
height (m)<br />
660<br />
650<br />
640<br />
630<br />
CAPON - HH<br />
street<br />
forest<br />
building corner<br />
reflector<br />
surface<br />
(5)<br />
620<br />
0<br />
surface<br />
100 200 300 400 500<br />
azimuth position (pixels)<br />
MUSIC (5) - HH<br />
660<br />
street<br />
650<br />
640<br />
630<br />
forest<br />
building corner<br />
reflector<br />
surface<br />
620<br />
0<br />
surface<br />
100 200 300 400 500<br />
azimuth position (pixels)<br />
Fig. 3. Fourier-, Capon-, MUSIC 1-, MUSIC 5-based height/azimuth slice<br />
tomograms.<br />
Fig. 3 represent height/azimuth slices of tomograms obtained<br />
using Fourier, Capon, and MUSIC approaches, respectively.<br />
The left part of the scene is constituted by a dense<br />
spruce forest with a height of 15 to 20 meters [1]. Then, the<br />
azimuth slice crosses a street, some bushes and a building.<br />
The right part of the scene consists of nearly flat grass land<br />
with a corner reflector.<br />
The Capon-based approach makes it possible to reduce the<br />
sidelobes, particularly strong in case of the building and the<br />
corner reflector. The ground under the forest is better visible<br />
with Capon-based approach. Indeed, the reflectivity of the