Gender Differences in Education Tuomas Pekkarinen - Index of - IZA
Gender Differences in Education Tuomas Pekkarinen - Index of - IZA
Gender Differences in Education Tuomas Pekkarinen - Index of - IZA

Create successful ePaper yourself
Turn your PDF publications into a flip-book with our unique Google optimized e-Paper software.
started to drop after the cohorts born <strong>in</strong> the 1950’s. At the same time, female university<br />
atta<strong>in</strong>ment cont<strong>in</strong>ued to <strong>in</strong>crease. Gaps <strong>in</strong> university atta<strong>in</strong>ment have become even larger <strong>in</strong><br />
the Nordic countries. Yet <strong>in</strong> these countries atta<strong>in</strong>ment levels <strong>of</strong> both men and women have<br />
kept on <strong>in</strong>creas<strong>in</strong>g. The <strong>in</strong>creas<strong>in</strong>g gender gap <strong>in</strong> the Nordic countries reflects particularly fast<br />
growth <strong>of</strong> female university atta<strong>in</strong>ment.<br />
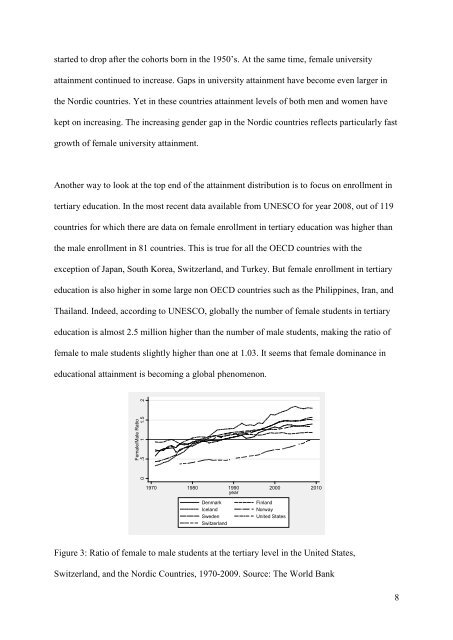
Another way to look at the top end <strong>of</strong> the atta<strong>in</strong>ment distribution is to focus on enrollment <strong>in</strong><br />
tertiary education. In the most recent data available from UNESCO for year 2008, out <strong>of</strong> 119<br />
countries for which there are data on female enrollment <strong>in</strong> tertiary education was higher than<br />
the male enrollment <strong>in</strong> 81 countries. This is true for all the OECD countries with the<br />
exception <strong>of</strong> Japan, South Korea, Switzerland, and Turkey. But female enrollment <strong>in</strong> tertiary<br />
education is also higher <strong>in</strong> some large non OECD countries such as the Philipp<strong>in</strong>es, Iran, and<br />
Thailand. Indeed, accord<strong>in</strong>g to UNESCO, globally the number <strong>of</strong> female students <strong>in</strong> tertiary<br />
education is almost 2.5 million higher than the number <strong>of</strong> male students, mak<strong>in</strong>g the ratio <strong>of</strong><br />
female to male students slightly higher than one at 1.03. It seems that female dom<strong>in</strong>ance <strong>in</strong><br />
educational atta<strong>in</strong>ment is becom<strong>in</strong>g a global phenomenon.<br />
Female/Male Ratio<br />
0 .5 1 1.5 2<br />
1970 1980 1990<br />
year<br />
2000 2010<br />
Denmark F<strong>in</strong>land<br />
Iceland Norway<br />
Sweden<br />
Switzerland<br />
United States<br />
Figure 3: Ratio <strong>of</strong> female to male students at the tertiary level <strong>in</strong> the United States,<br />
Switzerland, and the Nordic Countries, 1970-2009. Source: The World Bank<br />
8