Conservation Agriculture and Livelihoods of Smallholder Farmers in ...
Conservation Agriculture and Livelihoods of Smallholder Farmers in ...
Conservation Agriculture and Livelihoods of Smallholder Farmers in ...

Create successful ePaper yourself
Turn your PDF publications into a flip-book with our unique Google optimized e-Paper software.
Journal <strong>of</strong> Susta<strong>in</strong>able <strong>Agriculture</strong>, 35:757–779, 2011<br />
Copyright © Taylor & Francis Group, LLC<br />
ISSN: 1044-0046 pr<strong>in</strong>t/1540-7578 onl<strong>in</strong>e<br />
DOI: 10.1080/10440046.2011.606492<br />
<strong>Conservation</strong> <strong>Agriculture</strong> <strong>and</strong> <strong>Livelihoods</strong><br />
<strong>of</strong> <strong>Smallholder</strong> <strong>Farmers</strong> <strong>in</strong> Central Mozambique<br />
PETER NKALA, 1 NELSON MANGO, 2 <strong>and</strong> PRECIOUS ZIKHALI 3<br />
1 Center for Development Research (CDR), BOKU, University <strong>of</strong> Natural Resources <strong>and</strong> Applied<br />
Life Sciences, Vienna, Austria<br />
2 International Centre for Tropical <strong>Agriculture</strong> (CIAT), Harare, Zimbabwe<br />
3 International Water Management Institute (IWMI), Southern Africa Regional Office,<br />
Pretoria, South Africa<br />
This article demonstrates how conservation agriculture impacts<br />
smallholder farmers’ livelihoods <strong>in</strong> Mozambique through<br />
<strong>in</strong>creased crop productivity <strong>and</strong> yields, us<strong>in</strong>g primary data<br />
on smallholder farmers practic<strong>in</strong>g conservation agriculture <strong>and</strong><br />
others not us<strong>in</strong>g this technology from Nhanguo, Pumbuto, <strong>and</strong><br />
Ruaca <strong>in</strong> Manica <strong>and</strong> S<strong>of</strong>ala prov<strong>in</strong>ces. Data analysis employs<br />
semiparametric propensity score match<strong>in</strong>g methods. Direct correlations<br />
between conservation agriculture, higher productivity<br />
<strong>and</strong> yields; <strong>and</strong> <strong>in</strong>direct correlations with changes <strong>in</strong> household<br />
<strong>in</strong>comes <strong>and</strong> food security are suggested. Conclusively, systematic<br />
target<strong>in</strong>g <strong>of</strong> conservation agriculture to different farmer<br />
categories, can improve livelihoods, household <strong>in</strong>comes <strong>and</strong> food<br />
security. We recommend <strong>in</strong>tegration <strong>of</strong> conservation agriculture<br />
<strong>in</strong>to the rural development policy framework <strong>in</strong> Mozambique.<br />
KEYWORDS conservation agriculture, livelihoods, Mozambique,<br />
productivity, propensity score match<strong>in</strong>g, smallholder farmers<br />
We gratefully acknowledge research fund<strong>in</strong>g from the International Centre for Tropical<br />
<strong>Agriculture</strong> (CIAT) <strong>and</strong> the University <strong>of</strong> Natural Resources <strong>and</strong> Applied Life Sciences (BOKU).<br />
We also thank all reviewers for their comments <strong>and</strong> suggestions on earlier drafts <strong>of</strong> this<br />
article.<br />
Address correspondence to Peter Nkala, Center for Development Research (CDR),<br />
BOKU, University <strong>of</strong> Natural Resources <strong>and</strong> Applied Life Sciences, Vienna, Austria. E-mail:<br />
peter.nkala@boku.ac.at or pmasay<strong>in</strong>a@yahoo.co.uk<br />
757
758 P. Nkala et al.<br />
1. INTRODUCTION<br />
In many regions <strong>of</strong> Sub-Saharan Africa (SSA) cont<strong>in</strong>uous cropp<strong>in</strong>g <strong>and</strong> use<br />
<strong>of</strong> <strong>in</strong>appropriate farm<strong>in</strong>g practices has had massive negative environmental<br />
impacts characterized by decl<strong>in</strong><strong>in</strong>g soil fertility <strong>and</strong> erosion, degradation <strong>of</strong><br />
vast expanses <strong>of</strong> arable l<strong>and</strong> further caus<strong>in</strong>g low yields, food <strong>in</strong>security<br />
<strong>and</strong> perennial starvation (Guto et al. 2011). These problems are particularly<br />
<strong>in</strong>tense <strong>in</strong> poor develop<strong>in</strong>g countries like Mozambique where more<br />
than 80% <strong>of</strong> the population <strong>of</strong> smallholder farmers still rely on simple traditional<br />
technologies <strong>and</strong> tools; ma<strong>in</strong>ly h<strong>and</strong>-held hoes, m<strong>in</strong>imal use <strong>of</strong> animal<br />
traction <strong>and</strong> no tractors. L<strong>and</strong> scarcity, <strong>in</strong>creas<strong>in</strong>g population pressure,<br />
poorly targeted agricultural policies <strong>and</strong> agricultural management strategies<br />
exacerbate the problem. Apart from the negative impacts on agricultural productivity,<br />
food security, <strong>and</strong> environmental damage, negative tertiary effects<br />
<strong>of</strong> the smallholder farmers <strong>and</strong> their families’ “resource m<strong>in</strong><strong>in</strong>g” activities<br />
<strong>in</strong>clude hunger <strong>and</strong> imm<strong>in</strong>ent threat <strong>of</strong> malnutrition related illnesses.<br />
Dur<strong>in</strong>g the past three decades many rural development <strong>and</strong> research<br />
organizations 1 <strong>in</strong> partnership with government m<strong>in</strong>istries have <strong>in</strong>troduced<br />
technologies attempt<strong>in</strong>g restoration <strong>of</strong> soil fertility, moisture conservation<br />
<strong>and</strong> <strong>in</strong>creased productivity such as conservation agriculture (CA). Many<br />
authors are conv<strong>in</strong>ced that such technologies can mitigate the effects <strong>of</strong><br />
soil degradation, moderate soil surface conditions, improve crop yields,<br />
<strong>and</strong> <strong>in</strong>crease benefits <strong>and</strong> reduce production costs <strong>in</strong> the smallholder sector<br />
(Derpsch 2005; Chikonye et al. 2006; Govaerts et al. 2009; Guto et al. 2011).<br />
S<strong>in</strong>ce 2007, the International Centre for Tropical <strong>Agriculture</strong> (CIAT),<br />
International Maize <strong>and</strong> Wheat Improvement Centre (CIMMYT), <strong>and</strong> development<br />
agencies from both government <strong>and</strong> non-governmental organizations<br />
have been <strong>in</strong>volved <strong>in</strong> the promotion <strong>of</strong> conservation agriculture (CA)<br />
<strong>in</strong> central <strong>and</strong> northern Mozambique. Demonstrat<strong>in</strong>g that agricultural development<br />
<strong>in</strong>terventions <strong>and</strong> research can improve livelihoods <strong>of</strong> smallholder<br />
farmers has been the ma<strong>in</strong> objective <strong>of</strong> these <strong>in</strong>terventions. Experiences<br />
with conservation agriculture from the global south countries like Brazil <strong>and</strong><br />
Argent<strong>in</strong>a have shown that the adoption <strong>of</strong> productivity enhanc<strong>in</strong>g technologies<br />
<strong>of</strong>ten accelerate livelihood changes <strong>in</strong> economic <strong>and</strong> socio<strong>in</strong>stitutional<br />
conditions <strong>of</strong> actors <strong>in</strong>volved as would be expected (Bailey 1988; Bene 2003;<br />
Bene <strong>and</strong> Obirih-Opareh 2009). The secondary outcomes <strong>of</strong> susta<strong>in</strong>able<br />
agricultural practices is precipitation <strong>of</strong> <strong>in</strong>creases <strong>in</strong> food security, household<br />
<strong>in</strong>come <strong>and</strong> general welfare, which are good <strong>and</strong> desirable livelihood<br />
outcomes especially for the poor groups <strong>of</strong> smallholder farmers.<br />
Empirical evidence suggests that conservation agriculture generally produces<br />
higher net returns compared to conventional tillage <strong>in</strong> the long run<br />
although it may be associated with low short run returns (Sorrenson 1997;<br />
Stonehouse 1997; Pretty 2006; Lienhard et al. 2006; Giller et al. 2009). Higher
<strong>Smallholder</strong> <strong>Farmers</strong> <strong>in</strong> Central Mozambique 759<br />
returns are attributed to reduced costs <strong>of</strong> mach<strong>in</strong>ery, fuel <strong>and</strong> labor comb<strong>in</strong>ed<br />
with better soil <strong>and</strong> water management strategies. Stonehouse (1997)<br />
used a simulation exercise to demonstrate that <strong>of</strong>fsite benefits <strong>of</strong> conservation<br />
tillage accounted for a majority <strong>of</strong> the net social benefits <strong>in</strong> southern<br />
Ontario, Canada. By 2009, about 6% world’s total cropl<strong>and</strong> was be<strong>in</strong>g susta<strong>in</strong>ably<br />
exploited as a result <strong>of</strong> efforts to correct the negative impact <strong>of</strong><br />
conventional agriculture (World Bank 1991; Bolliger 2007; Twomlow et al.<br />
2008; Giller et al. 2009; Lal 2009).<br />
Despite strong assumptions that CA technology <strong>in</strong>creases crop productivity<br />
<strong>and</strong> yield stability, Giller et al. (2009) argue that promotion <strong>of</strong> CA as<br />
a panacea to agricultural problems <strong>in</strong> the tropics has gone without rigorous<br />
debate. For the first time, challeng<strong>in</strong>g the authenticity <strong>of</strong> the claims by organizations<br />
like the Food <strong>and</strong> Agricultural Organization <strong>of</strong> the United Nations<br />
([FAO] 2008) <strong>and</strong> other high proponents <strong>of</strong> CA; on the grounds that different<br />
country sett<strong>in</strong>gs do matter <strong>in</strong> the successful adoption <strong>of</strong> CA. Giller<br />
et al. (2009) question the rationale <strong>of</strong> implement<strong>in</strong>g CA as a package among<br />
smallholder farmers given different local conditions <strong>in</strong> SSA compared to the<br />
global North <strong>and</strong> South American countries. Thus, challenges faced with<br />
attempted wholesale adoption <strong>of</strong> CA has resulted <strong>in</strong> decomposition <strong>of</strong> CA<br />
<strong>in</strong>to those aspects that can be easily implemented <strong>and</strong> those that need to be<br />
decomposed to suit specific conditions <strong>of</strong> farmers.<br />
Accord<strong>in</strong>g to FAO (2001), CA rests on three pillars: m<strong>in</strong>imum soil disturbance,<br />
crop rotation <strong>and</strong> permanent soil cover. 2 Direct drill<strong>in</strong>g or chisel<strong>in</strong>g<br />
the soil only where seeds are placed us<strong>in</strong>g <strong>in</strong>-row chisels, direct seeders,<br />
or disk openers ensures m<strong>in</strong>imum soil disturbance. Weed <strong>and</strong> pest control<br />
are done us<strong>in</strong>g synthetic herbicides, like glyphosate 3 <strong>and</strong> pesticides<br />
with cultivation only permitted <strong>in</strong> emergency situations. Permanent cover<br />
crops or nonremoval <strong>of</strong> residues protects the soil from erosion <strong>and</strong> weeds.<br />
Varied crop rotation helps <strong>in</strong> weed control <strong>and</strong> boost<strong>in</strong>g soil fertility. Broadly<br />
def<strong>in</strong>ed, CA is part <strong>of</strong> susta<strong>in</strong>able agriculture comb<strong>in</strong><strong>in</strong>g best practices with<br />
discont<strong>in</strong>uation <strong>of</strong> production systems associated with negative environmental<br />
externalities created by conventional agriculture (D’Souza et al. 1993;<br />
Kassie et al. 2009).<br />
The ma<strong>in</strong> advantage <strong>of</strong> CA is the technology’s ability to address a broad<br />
set <strong>of</strong> farm<strong>in</strong>g constra<strong>in</strong>ts particularly common among smallholder farmers<br />
<strong>in</strong> vulnerable communities (Lee 2005; Lienhard et al. 2006). The constra<strong>in</strong>ts<br />
<strong>in</strong> question <strong>in</strong>clude lack <strong>of</strong> sufficient equipment for l<strong>and</strong> preparation, sow<strong>in</strong>g,<br />
weed<strong>in</strong>g <strong>and</strong> harvest<strong>in</strong>g. High labor requirements still rema<strong>in</strong> a major<br />
constra<strong>in</strong>t especially dur<strong>in</strong>g the wet season when <strong>in</strong>cessant ra<strong>in</strong>s give farmers<br />
limited chances to weed their fields. Large scale herbicide application is<br />
also not feasible given the f<strong>in</strong>ancial leverage <strong>of</strong> most farmers, hence, manual<br />
weed<strong>in</strong>g is always paramount. All the above factors are common <strong>and</strong><br />
relevant <strong>in</strong> Mozambique <strong>and</strong> affect particularly the smallholder sector.
760 P. Nkala et al.<br />
Despite benefits <strong>of</strong> CA, adoption <strong>of</strong> this technology has been slow <strong>in</strong><br />
Mozambique because farmers lack relevant skills, knowledge, <strong>and</strong> equipment,<br />
yet there are <strong>in</strong>adequate extension services 4 <strong>and</strong> poverty among<br />
others. CA has also not been widely promoted <strong>in</strong> Mozambique as only a few<br />
nongovernmental organizations are actively <strong>in</strong>volved for fixed time periods<br />
<strong>and</strong> to some extent the technology seems arguably <strong>in</strong>appropriate for the<br />
majority <strong>of</strong> smallholder farmers given huge resource constra<strong>in</strong>ts they face.<br />
<strong>Farmers</strong>’ participation <strong>in</strong> any agricultural technology such as CA depends<br />
on multiple farmer <strong>and</strong> farm specific factors that <strong>in</strong>fluence farmers’ decision<br />
to adopt the technology <strong>and</strong> what farmers perceive would be the<br />
impacts <strong>of</strong> the technologies on their livelihoods; which all said <strong>and</strong> done<br />
is the ultimate objective driv<strong>in</strong>g farmers to engage <strong>in</strong> productive activities.<br />
The livelihood outcomes <strong>in</strong>clude positive changes <strong>in</strong> productivity, household<br />
<strong>in</strong>come, wealth endowments, food security, <strong>and</strong> reduced household<br />
exposure to risk <strong>and</strong> vulnerability. For conservation agriculture to be seen<br />
as effective <strong>in</strong> promot<strong>in</strong>g livelihoods, it should positively impact on these<br />
above livelihood outcomes, which sometimes CA may be unable to do <strong>in</strong><br />
the short run.<br />
As the perceptions paradigm suggests, farmers behavior is shaped by<br />
the perception that CA impacts positively <strong>in</strong> improv<strong>in</strong>g livelihoods (Uaiene<br />
et al. 2009). These behaviors are driven by farmer specific factors such<br />
as age, gender, household size, level <strong>of</strong> education, <strong>and</strong> marital status,<br />
all <strong>of</strong> which are <strong>in</strong>directly l<strong>in</strong>ked to perceptions about livelihood outcomes<br />
<strong>and</strong> <strong>in</strong>terven<strong>in</strong>g technologies. We, therefore, assume the necessity<br />
to exam<strong>in</strong>e farmers’ perceptions on the different technological impacts on<br />
livelihoods for the promotion, adoption <strong>and</strong> susta<strong>in</strong>ed use <strong>of</strong> technologies<br />
such as CA.<br />
However, the role <strong>of</strong> conservation agriculture (CA) <strong>in</strong> improv<strong>in</strong>g<br />
livelihoods <strong>of</strong> smallholder farmers fac<strong>in</strong>g low productivity <strong>in</strong> agriculture <strong>and</strong><br />
extreme food <strong>in</strong>security is debatable, <strong>and</strong> most researchers agree that CA<br />
impacts positively on livelihoods while others th<strong>in</strong>k this is not the case.<br />
In this article, we <strong>in</strong>vestigate how CA impacts changes <strong>in</strong> livelihood outcomes<br />
through changes <strong>in</strong> productivity, yields, household <strong>in</strong>come, <strong>and</strong><br />
food security. The study uses the smallholder CA farmers’ households 5<br />
Nhanguo, Pumbuto, <strong>and</strong> Ruaca communities <strong>of</strong> Manica <strong>and</strong> S<strong>of</strong>ala prov<strong>in</strong>ces<br />
<strong>in</strong> Mozambique, as the units <strong>of</strong> analysis. Very few studies on agricultural<br />
systems <strong>in</strong> Africa go beyond analyz<strong>in</strong>g the determ<strong>in</strong>ants <strong>of</strong> adoption to discuss<strong>in</strong>g<br />
the impact <strong>of</strong> CA on farmers’ livelihoods <strong>and</strong> this article seeks to<br />
fill that gap. The article extends the debate from adoption to the grounded<br />
impact <strong>of</strong> the technology on people’s livelihoods. We employ semiparametric<br />
econometric methods that (1) exam<strong>in</strong>e the covariates that <strong>in</strong>fluence<br />
the farmers’ decision to practice CA, <strong>and</strong> (2) assess the impact <strong>of</strong> CA on<br />
livelihood outcomes after controll<strong>in</strong>g for the possibility that CA <strong>and</strong> non-CA<br />
farmers could be systematically different.
<strong>Smallholder</strong> <strong>Farmers</strong> <strong>in</strong> Central Mozambique 761<br />
The rest <strong>of</strong> the article is arranged as follows: Section 2 discusses the<br />
underly<strong>in</strong>g analytical framework followed by the description <strong>of</strong> the study<br />
sett<strong>in</strong>g <strong>in</strong> section 3. Section 4 presents the data used <strong>in</strong> the empirical analysis<br />
<strong>and</strong> the outl<strong>in</strong>e <strong>of</strong> empirical model <strong>and</strong> estimation strategy is done <strong>in</strong><br />
section 5. The results, conclusions <strong>and</strong> recommendations are dealt with <strong>in</strong><br />
sections 6 <strong>and</strong> 7, respectively.<br />
2. THE APPROACH<br />
The systems dynamics (SD) <strong>and</strong> susta<strong>in</strong>able livelihoods framework (SLF)<br />
expla<strong>in</strong> how livelihoods benefit from available resources through engag<strong>in</strong>g<br />
<strong>in</strong> certa<strong>in</strong> activities <strong>in</strong> an environment governed by some exist<strong>in</strong>g rules<br />
<strong>and</strong> <strong>in</strong>stitutions. People undertake livelihood strategies us<strong>in</strong>g assets owned<br />
to transform their lives. Assets owned are key <strong>in</strong> implement<strong>in</strong>g livelihood<br />
strategies such as crop farm<strong>in</strong>g <strong>and</strong> livestock rear<strong>in</strong>g which are necessary<br />
for realization <strong>of</strong> desired livelihood outcomes (LaFlamme <strong>and</strong> Davies 2007).<br />
We posit an <strong>in</strong>direct but positive relationship between the types <strong>of</strong> assets<br />
owned <strong>and</strong> envisaged livelihood outcomes.<br />
In this article, we adopt the Chambers <strong>and</strong> Conway (1992) def<strong>in</strong>ition<br />
<strong>of</strong> a livelihood as compris<strong>in</strong>g “capabilities, assets <strong>and</strong> activities required to<br />
make a liv<strong>in</strong>g ...<strong>and</strong> to cope with <strong>and</strong> recover from shocks <strong>and</strong> stresses”<br />
(Krantz 2001, 6). These authors provide a work<strong>in</strong>g framework for many <strong>in</strong>ternational<br />
humanitarian <strong>and</strong> rural development organizations <strong>in</strong> underst<strong>and</strong><strong>in</strong>g<br />
the importance <strong>of</strong> resources <strong>and</strong> transformation structures <strong>in</strong> realiz<strong>in</strong>g welfare<br />
goals (Start <strong>and</strong> Johnson 2004). The framework expla<strong>in</strong>s how complex<br />
issues <strong>of</strong> rural development could be approached <strong>and</strong> successfully addressed<br />
(Chambers <strong>and</strong> Conway 1992).<br />
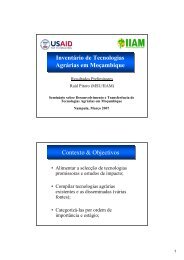
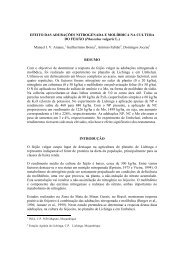
The susta<strong>in</strong>able livelihoods framework illustrated <strong>in</strong> Figure 1, adapted<br />
from Chambers <strong>and</strong> Conway (1992) is a framework show<strong>in</strong>g the relationship<br />
among the context <strong>of</strong> the farmers’ assets (represented by different forms <strong>of</strong><br />
capital), transformation structures, livelihood strategies, <strong>and</strong> livelihood outcomes.<br />
Specifically, the framework illustrates how, by avail<strong>in</strong>g households<br />
opportunities for livelihood strategies through promotion <strong>of</strong> agricultural<br />
technology, development <strong>in</strong>terventions impact livelihood outcomes. The<br />
framework shows the <strong>in</strong>direct relationship between livelihood outcomes <strong>and</strong><br />
households’ assets <strong>and</strong> the role <strong>of</strong> transformation structures <strong>and</strong> livelihood<br />
strategies. The assets comprise natural (l<strong>and</strong> <strong>and</strong> its resources), f<strong>in</strong>ancial<br />
(sav<strong>in</strong>gs <strong>and</strong> credit supplies), physical (<strong>in</strong>frastructure such as roads), social<br />
(social networks), <strong>and</strong> human forms <strong>of</strong> capital (skills <strong>and</strong> education levels).<br />
Assets form build<strong>in</strong>g blocks <strong>of</strong> susta<strong>in</strong>able livelihoods, impact<strong>in</strong>g household<br />
capacity to withst<strong>and</strong> challenges <strong>of</strong> shocks encountered <strong>in</strong> improv<strong>in</strong>g<br />
livelihoods.
762 P. Nkala et al.<br />
Development <strong>in</strong>terventions<br />
(CIAT/CIMMYT projects)<br />
Livelihood assets<br />
(Farmer <strong>and</strong><br />
farm specific<br />
characteristics)<br />
Social assets<br />
Human assets<br />
F<strong>in</strong>ancial assets<br />
Natural assets<br />
Physical assets<br />
Livelihood strategies<br />
<strong>Conservation</strong> <strong>Agriculture</strong><br />
Technology<br />
Livelihood<br />
outcomes<br />
Household <strong>in</strong>come<br />
Social capital<br />
Yields/Productivity<br />
Food security<br />
Risk <strong>and</strong> vulnerability<br />
Livelihood context<br />
Political <strong>and</strong> economic <strong>in</strong>stitutions<br />
Policy environment<br />
FIGURE 1 L<strong>in</strong>k between conservation agriculture <strong>and</strong> livelihood outcomes. Source: Authors’<br />
own adaptation <strong>of</strong> the Susta<strong>in</strong>able <strong>Livelihoods</strong> Framework.<br />
Given asset endowments, households make decisions regard<strong>in</strong>g adoption<br />
<strong>of</strong> technology perceived by farmers to generate positive social <strong>and</strong><br />
economic outcomes. The livelihood context <strong>in</strong>cludes important broad political<br />
<strong>and</strong> economic structures <strong>and</strong> the exist<strong>in</strong>g policy environment. Arguably,<br />
these policies <strong>and</strong> economic structures <strong>in</strong>fluence livelihood assets hold<strong>in</strong>gs,<br />
strategies undertaken, activities <strong>of</strong> development agencies <strong>and</strong> ultimately<br />
resultant livelihood outcomes.<br />
As illustrated <strong>in</strong> Figure 1, the system is characterized by forward <strong>and</strong><br />
backward l<strong>in</strong>kages <strong>in</strong> response to changes <strong>in</strong> farm <strong>and</strong> farmer specific<br />
variables captured through livelihood assets <strong>and</strong> observed livelihood<br />
outcomes. A specific “package” <strong>of</strong> farm <strong>and</strong> farmer specific factors or<br />
livelihood assets is associated with each outcome although each factor<br />
may be l<strong>in</strong>ked to various other outcomes. <strong>Conservation</strong> agriculture is an<br />
<strong>in</strong>terven<strong>in</strong>g mechanism through which farmers, given their socioeconomic<br />
characteristics <strong>and</strong> farm characteristics, transform livelihoods. That is, farmers<br />
adopt CA to enhance l<strong>and</strong> productivity <strong>in</strong> order to ultimately improve<br />
livelihoods. Therefore, socioeconomic <strong>and</strong> farm specific characteristics <strong>and</strong><br />
expected positive benefits from CA <strong>in</strong>fluence the farmers’ decisions about
<strong>Smallholder</strong> <strong>Farmers</strong> <strong>in</strong> Central Mozambique 763<br />
technology adoption/adaptation. The actual <strong>and</strong> perceived impact <strong>of</strong> CA on<br />
livelihoods varies with the geographical location <strong>of</strong> the farm, biophysical<br />
<strong>and</strong> <strong>in</strong>stitutional constra<strong>in</strong>ts <strong>and</strong> socioeconomic factors that favor specific<br />
practices. <strong>Farmers</strong> are heterogeneous <strong>and</strong> face dynamic political <strong>and</strong><br />
economic environments that determ<strong>in</strong>e adaptation trajectories tak<strong>in</strong>g care<br />
<strong>of</strong> ensu<strong>in</strong>g constra<strong>in</strong>ts <strong>and</strong> opportunities for CA.<br />
3. DESCRIPTION OF THE STUDY SITES<br />
The three study sites discussed <strong>in</strong> this paper are located <strong>in</strong> the vulnerable<br />
agricultural production regions <strong>in</strong> Manica <strong>and</strong> S<strong>of</strong>ala prov<strong>in</strong>ces <strong>of</strong><br />
Mozambique where livelihood options <strong>of</strong> farmers are limited to agriculture,<br />
vegetable vend<strong>in</strong>g, charcoal production <strong>and</strong> basketry or weav<strong>in</strong>g <strong>in</strong> a few<br />
cases. The vulnerability is characterized by remoteness <strong>in</strong> location; less fertile<br />
soils, obsolete, <strong>and</strong> <strong>in</strong>adequate <strong>in</strong>frastructure (schools, cl<strong>in</strong>ics, roads, etc.)<br />
<strong>and</strong> low literacy levels. There are extreme poverty levels <strong>in</strong> most cases far<br />
higher than the national average. Ra<strong>in</strong>fall averages between 600 <strong>and</strong> 800mm<br />
per year <strong>in</strong> altitudes <strong>of</strong> 0–200 m <strong>and</strong> 600–800 m <strong>in</strong> Manica prov<strong>in</strong>ce, <strong>and</strong><br />
200–600 m to 600–1000 m <strong>in</strong> S<strong>of</strong>ala prov<strong>in</strong>ce. Soils <strong>in</strong> Pumbuto, Ruaca, <strong>and</strong><br />
Gorongosa vary from s<strong>and</strong>y to s<strong>and</strong>y-loam <strong>and</strong> Gorongosa has a mixture <strong>of</strong><br />
both fertile red-clay <strong>and</strong> shallow s<strong>and</strong>y soils.<br />
Furthermore, established livelihoods were seriously disrupted dur<strong>in</strong>g<br />
the 14 years <strong>of</strong> civil conflict that ended <strong>in</strong> 1992, with the sign<strong>in</strong>g <strong>of</strong> the<br />
peace agreement <strong>in</strong> Rome, between the ma<strong>in</strong> belligerent parties, FRELIMO<br />
(Frente de Libertacao de Mozambique) <strong>and</strong> RENAMO (Resistancia Nacional<br />
de Mozambique). Dur<strong>in</strong>g the conflict, many farmers <strong>in</strong> these study areas<br />
fled to neighbor<strong>in</strong>g towns <strong>of</strong> Chimoio, Casa Banana, <strong>and</strong> Beira. Even farmers<br />
who rema<strong>in</strong>ed <strong>in</strong> the communities <strong>and</strong> bore the brunt <strong>of</strong> the civil war<br />
failed to practice agriculture but fled homesteads <strong>and</strong> sought refuge <strong>in</strong> the<br />
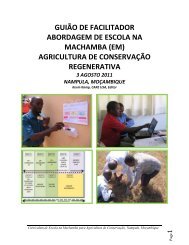
mounta<strong>in</strong>s surviv<strong>in</strong>g on hunt<strong>in</strong>g wildlife <strong>and</strong> gather<strong>in</strong>g wild plants. The location<br />
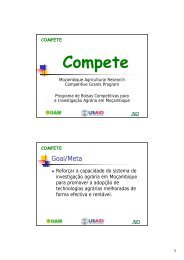
<strong>of</strong> the three study sites <strong>in</strong> relation to the 11 prov<strong>in</strong>ces <strong>of</strong> Mozambique<br />
are illustrated <strong>in</strong> Figure 2 below.<br />
Nhanguo is <strong>in</strong> Gorongosa district <strong>of</strong> S<strong>of</strong>ala; Pumbuto <strong>and</strong> Ruaca are <strong>in</strong><br />
Gondola district <strong>of</strong> Manica prov<strong>in</strong>ce. CIMMYT <strong>and</strong> CIAT embarked on CA<br />
projects <strong>in</strong> 24 communities <strong>in</strong> more than 10 districts <strong>in</strong> Mozambique us<strong>in</strong>g<br />
the participatory technology development (PTD) approach. 6 Long-term trials<br />
were envisaged for each district <strong>and</strong> for Sussundenga Zonal Research station.<br />
Each experimental plot was 3000 m 2 (50 × 60 m). <strong>Farmers</strong>’ groups numbered<br />
20–30 people; some better <strong>of</strong>f farmers opted for <strong>in</strong>dividual experiments on<br />
family plots.<br />
Although livelihood strategies are limited, agriculture rema<strong>in</strong>s the ma<strong>in</strong><br />
source <strong>of</strong> livelihood <strong>in</strong> all the three communities. Other livelihood strategies
764 P. Nkala et al.<br />
S<strong>of</strong>ala<br />
prov<strong>in</strong>ce<br />
Nhanguo<br />
Manica<br />
prov<strong>in</strong>ce, Ruaca<br />
<strong>and</strong> Pumbuto<br />
KEY<br />
1 Cabo Delgado<br />
2 Gaza<br />
3 Inhambane<br />
4 Manica<br />
5 Maputo-Cidade<br />
6 Maputo<br />
7 Nampula<br />
8 Niassa<br />
9 S<strong>of</strong>ala<br />
10 Tete<br />
11 Zambezia<br />
These are the 11 prov<strong>in</strong>ces<br />
<strong>in</strong> Mozambique <strong>and</strong> the<br />
study sites are <strong>in</strong> two<br />
prov<strong>in</strong>ces, 4 (Manica) <strong>and</strong><br />
9 (S<strong>of</strong>ala).<br />
FIGURE 2 The specific project sites <strong>in</strong> Manica <strong>and</strong> S<strong>of</strong>ala prov<strong>in</strong>ces <strong>in</strong> Mozambique. (Color<br />
figure available onl<strong>in</strong>e.)<br />
<strong>in</strong>clude, produc<strong>in</strong>g <strong>and</strong> sell<strong>in</strong>g charcoal, microenterprises, h<strong>and</strong>icrafts, <strong>and</strong><br />
local beer (nippa or cabanga). Local markets 7 for agricultural produce are<br />
not well developed so farmers <strong>in</strong>cur high transport costs to markets <strong>in</strong><br />
Gorongosa, Gondola, Manica <strong>and</strong> Chimoio centers. About 30–40% <strong>of</strong> farmers<br />
<strong>in</strong> all communities have pigs <strong>and</strong> goats raised for own consumption<br />
<strong>and</strong> to supplement household <strong>in</strong>comes. Very few farmers <strong>in</strong> Ruaca own<br />
cattle mostly obta<strong>in</strong>ed through the CARITAS livestock development project<br />
<strong>in</strong>troduced 10 years ago; so the area has traditionally been a non-livestock<br />
area.<br />
4. DATA AND DESCRIPTIVE STATISTICS<br />
Direct observations, group discussions <strong>and</strong> semistructured questionnaires<br />
were the ma<strong>in</strong> data collection approaches employed <strong>in</strong> 12 months<br />
to October 2009. Individual household <strong>in</strong>terviews were conducted on<br />
165 smallholder farmers’ households across the three sites. Forty-eight percent<br />
were farmers who had been tra<strong>in</strong>ed on CA pr<strong>in</strong>ciples by <strong>in</strong>terven<strong>in</strong>g<br />
organizations <strong>and</strong> government extension workers <strong>and</strong> this distribution is<br />
shown <strong>in</strong> Table 1. Participation <strong>in</strong> the CA projects was voluntary, although<br />
evidence also showed that <strong>in</strong> some <strong>in</strong>stances experiences <strong>of</strong> the extension<br />
<strong>of</strong>ficer, <strong>and</strong> <strong>in</strong>volvement <strong>in</strong> farmer field school (FFS) <strong>in</strong>fluenced farmer<br />
participation.<br />
The CA farmers were purposively sampled (hence, our use <strong>of</strong> the<br />
propensity scores match<strong>in</strong>g technique) from those <strong>in</strong>volved <strong>in</strong> the conservation<br />
agriculture project which started <strong>in</strong> 2007 <strong>and</strong> non-CA farmers were
<strong>Smallholder</strong> <strong>Farmers</strong> <strong>in</strong> Central Mozambique 765<br />
TABLE 1 Number <strong>of</strong> Respondents by Community, District, <strong>and</strong> Prov<strong>in</strong>ce<br />
Number <strong>of</strong> farmers<br />
Prov<strong>in</strong>ce District Community CA Non-CA Total<br />
Manica Gondola Nhanguo 22 25 47<br />
Messica Pumbuto 26 29 55<br />
S<strong>of</strong>ala Gorongosa Ruaca 31 32 63<br />
Total 79 86 165<br />
Source: Field study, 2008–2009.<br />
r<strong>and</strong>omly selected from the rema<strong>in</strong><strong>in</strong>g farmers’ households <strong>in</strong> each community.<br />
It was not possible to r<strong>and</strong>omly select CA participants as these had<br />
already been identified through purposive sampl<strong>in</strong>g. All CA farmers had<br />
gone through two cycles <strong>of</strong> CA on their own, hence, had a relatively good<br />
underst<strong>and</strong><strong>in</strong>g <strong>of</strong> its impact. Most <strong>of</strong> the CA farmers <strong>in</strong> Pumbuto had participated<br />
<strong>in</strong> the FAO FFS project that ended <strong>in</strong> 2007 <strong>and</strong> were co-opted <strong>in</strong>to the<br />
CIAT/CIMMYT conservation agriculture project.<br />
The questionnaire based data collected covered background characteristics<br />
like age, gender, marital status, level <strong>of</strong> education, <strong>and</strong> socioeconomic<br />
variables like l<strong>and</strong>, livestock ownership, knowledge <strong>of</strong> CA, perceived<br />
changes <strong>in</strong> household food security, <strong>in</strong>come, access to credit <strong>and</strong> extension<br />
services. Data on field <strong>and</strong> cash crops, distance to markets <strong>and</strong> farmers’<br />
perceptions about CA’s impact on livelihoods s<strong>in</strong>ce <strong>in</strong>troduction <strong>of</strong> the<br />
technology were also collected.<br />
Notwithst<strong>and</strong><strong>in</strong>g different views <strong>and</strong> controversies on perceptions versus<br />
reality, we argue that perceptions <strong>of</strong> food security risk does <strong>in</strong>fluence<br />
the household effort expended <strong>in</strong> agriculture <strong>and</strong>, hence, the subsequent<br />
value attached to own food production (Seeth et al. 1998). Maddison (2007)<br />
used perceptions <strong>of</strong> farmers from 11 different countries to determ<strong>in</strong>e the<br />
ability <strong>of</strong> farmers <strong>in</strong> Africa to detect climate change <strong>and</strong> how they adapted;<br />
the results showed that farmers’ perceptions do matter <strong>and</strong> <strong>in</strong> most cases<br />
available records from weather stations were shorter than memories <strong>of</strong> farmers.<br />
Statistical tests also showed convergence or cluster<strong>in</strong>g <strong>of</strong> farmers who<br />
claimed to have observed certa<strong>in</strong> characteristics <strong>of</strong> climate change, with<br />
neighbor<strong>in</strong>g farmers also tell<strong>in</strong>g a consistent story. This study is, therefore,<br />
grounded on the strong assumption that practic<strong>in</strong>g CA is a two stage process<br />
whereby first smallholder farmers perceive the technology to improve productivity,<br />
yields, <strong>and</strong> subsequently guarantee<strong>in</strong>g better livelihood outcomes<br />
<strong>and</strong> then mak<strong>in</strong>g a firm decision to adopt or not to adopt CA. Despite lack<br />
<strong>of</strong> evidence <strong>of</strong> actual outcomes, but with support use <strong>of</strong> surveys <strong>and</strong> perceptions<br />
as <strong>in</strong> the above studies, this article is still relevant <strong>and</strong> contributes<br />
mean<strong>in</strong>gfully to a broad discussion <strong>of</strong> CA on smallholder agriculture.<br />
Table 2 gives a summary <strong>of</strong> statistics <strong>and</strong> description <strong>of</strong> variables used<br />
<strong>in</strong> the empirical model that we discuss <strong>in</strong> the follow<strong>in</strong>g section. We report
766 P. Nkala et al.<br />
TABLE 2 Descriptive Statistics (Means) <strong>of</strong> Variables Used <strong>in</strong> the Analysis<br />
Variable<br />
Description<br />
CA<br />
farmer<br />
Non-CA<br />
farmer<br />
t test<br />
(p-values)<br />
Both<br />
Dependent variables<br />
Productivity 1 = improvement <strong>in</strong><br />
0.72 0.19 0.00 0.44<br />
productivity is reported<br />
0 = otherwise<br />
Income 1 = improvement <strong>in</strong><br />
0.67 0.55 0.10 0.61<br />
household <strong>in</strong>comes is<br />
reported<br />
0 = otherwise<br />
Food 1 = improvement <strong>in</strong> food 0.75 0.74 0.97 0.75<br />
security security is reported<br />
0 = otherwise<br />
Independent variables<br />
CA farmer 1 = farmer practices CA 0.48<br />
0 = otherwise<br />
Age Age <strong>of</strong> household head 43.23 41.81 0.53 42.49<br />
Gender 1 = female household head 0.34 0.41 0.39 0.38<br />
0 = male<br />
Marital status 1 = s<strong>in</strong>gle household head 0.84 0.74 0.15 0.79<br />
0 = otherwise<br />
Household Total household members 6.94 6.63 0.63 6.78<br />
size<br />
Education Highest level <strong>of</strong> education 1.71 1.78 0.47 1.75<br />
<strong>in</strong> the household.<br />
1 = 0–8 years <strong>of</strong> school<strong>in</strong>g;<br />
2 = more than 8 years<br />
Wealth Monetary value <strong>of</strong> total 440.92 304.78 0.30 369.96<br />
livestock hold<strong>in</strong>gs <strong>in</strong> USD<br />
Farm size Total farm size, <strong>in</strong> hectares 4.27 3.43 0.21 3.83<br />
Cultivated Area <strong>of</strong> farm size cultivated 3.41 3.20 0.59 3.30<br />
area annually, <strong>in</strong> hectares<br />
Markets Distance to the nearest 7.23 3.61 0.02 5.36<br />
primary market, <strong>in</strong> km<br />
Maize 1 = household grows maize 0.90 0.74 0.01 0.82<br />
as the major cash crop<br />
0 = otherwise<br />
Extension Distance to the nearest 16.37 13.58 0.19 14.92<br />
extension <strong>of</strong>fice, km<br />
Pumbuto Dummy for Pumbuto<br />
0.39 0.37 0.79 0.38<br />
community<br />
Ruaca Dummy for Ruaca<br />
0.33 0.34 0.91 0.33<br />
community<br />
Nhanguo Dummy for Nhanguo<br />
community<br />
0.28 0.29 0.86 0.29<br />
this for the CA <strong>and</strong> non-CA groups separately <strong>and</strong> for the pooled sample.<br />
We perform t tests to <strong>in</strong>vestigate whether differences <strong>in</strong> means <strong>of</strong> these<br />
variables are significantly different between the two groups <strong>and</strong> f<strong>in</strong>ally we<br />
report the p values from these tests.
<strong>Smallholder</strong> <strong>Farmers</strong> <strong>in</strong> Central Mozambique 767<br />
The statistics <strong>in</strong>dicate that CA farmers were 48% <strong>of</strong> the sample size <strong>of</strong><br />
165 CA <strong>and</strong> non-CA farmers. Around 44%, 61%, <strong>and</strong> 75% <strong>of</strong> the pooled<br />
farmers report improvements <strong>in</strong> productivity, household <strong>in</strong>come <strong>and</strong> food<br />
security, respectively. Reported livelihood changes are statistically different<br />
between CA <strong>and</strong> non-CA farmers with regards to perceived improvements<br />
<strong>in</strong> productivity whereby 72% <strong>of</strong> CA farmers report improvements <strong>in</strong><br />
productivity compared to 19% <strong>of</strong> non-CA farmers.<br />
Overall, the t tests reveal very <strong>in</strong>significant differences <strong>in</strong> the characteristics<br />
between the two groups. Significant differences exist with regards<br />
to productivity <strong>and</strong> wealth endowments <strong>in</strong>clud<strong>in</strong>g to a lesser extent differences<br />
with regards to access to markets. 8 In addition CA farmers are<br />
significantly more likely to grow maize as a cash crop compared to non-CA<br />
farmers. This is probably because cowpeas, pigeon peas <strong>and</strong> maize were<br />
selected as demonstration trial crops as all farmers <strong>in</strong> the three districts were<br />
issued with maize seed for the trials. Be<strong>in</strong>g a staple crop, maize was also<br />
over-represented <strong>in</strong> both the CA <strong>and</strong> non-CA farmers groups.<br />
Thirty-eight percent <strong>of</strong> the farmers are female with an average age<br />
<strong>of</strong> 42 years. The gender over-representation <strong>of</strong> men l<strong>in</strong>ks with strong traditional<br />
<strong>and</strong> cultural practices that dist<strong>in</strong>guish gender roles <strong>in</strong> agriculture<br />
mostly biased toward men. Observations revealed the existence <strong>of</strong> female<br />
<strong>and</strong> child-headed households <strong>in</strong> all communities.<br />
An average household <strong>in</strong> the sample consists <strong>of</strong> seven members with an<br />
average annual wealth hold<strong>in</strong>g for both groups <strong>of</strong> farmers <strong>of</strong> U.S. $369.96.<br />
This wealth hold<strong>in</strong>g further confirms high poverty levels among smallholder<br />
farmers <strong>in</strong> the three districts. The average farm size is 3.83 hectares <strong>and</strong> the<br />
average cultivated area is 3.30 hectares.<br />
On average, farmers walk about 15 km to the nearest agricultural extension<br />
<strong>of</strong>fice. These <strong>of</strong>fices are located at the district rather than rural service<br />
centers for Pumbuto <strong>and</strong> Ruaca. In Nhanguo, the local extension worker<br />
lives at the rural service center. Access to farmers by the extension workers<br />
is problematic because <strong>of</strong> associated transport problems <strong>of</strong> liv<strong>in</strong>g away from<br />
work stations.<br />
5. THE EMPIRICAL MODEL AND ESTIMATION STRATEGY<br />
Broadly this empirical analysis explores how changes precipitated by CA<br />
subsequently impact changes <strong>in</strong> farmers’ livelihoods. Primary livelihood outcomes<br />
<strong>of</strong> <strong>in</strong>terest are reported changes <strong>in</strong> crop productivity, household<br />
<strong>in</strong>come <strong>and</strong> food security. Each <strong>of</strong> these outcomes is b<strong>in</strong>ary, recorded as<br />
one for improvement <strong>in</strong> the <strong>in</strong>dicator <strong>and</strong> zero otherwise.<br />
Our estimation strategy uses a semi-parametric framework, specifically<br />
the propensity score match<strong>in</strong>g (PSM) method. This strategy considers the<br />
possibility that CA <strong>and</strong> non-CA farmers might exhibit systematic differences
768 P. Nkala et al.<br />
<strong>in</strong> characteristics that might make them less comparable <strong>and</strong> that selection<br />
<strong>in</strong>to CA or non-CA group has largely been non-r<strong>and</strong>om, based <strong>in</strong>stead<br />
on certa<strong>in</strong> unobservable criteria. This would complicate attempts to isolate<br />
the impact <strong>of</strong> CA on livelihood outcomes <strong>of</strong> <strong>in</strong>terest, ma<strong>in</strong>ly, because the<br />
study uses survey <strong>in</strong>stead <strong>of</strong> experimental data. R<strong>and</strong>omization associated<br />
with experimental data enables isolation <strong>of</strong> CA effects by ensur<strong>in</strong>g that the<br />
treatment <strong>and</strong> control groups are selected r<strong>and</strong>omly from a potential population<br />
<strong>of</strong> all farmers. By break<strong>in</strong>g the correlation between treatment <strong>and</strong><br />
the confound<strong>in</strong>g unobserved environment, r<strong>and</strong>omization ensures that the<br />
CA experimental group is no different from the control group. In this case,<br />
a statistically significant difference <strong>in</strong> the livelihoods <strong>of</strong> the two groups can<br />
be confidently attributed to CA to some extent. However, the fact that we<br />
use survey data suggests nonr<strong>and</strong>om selection <strong>in</strong>to the CA group which<br />
poses a risk that those differences between CA <strong>and</strong> non-CA farmers could<br />
be mistaken for effects <strong>of</strong> CA.<br />
Accord<strong>in</strong>gly, we use the PSM method to deal with these challenges.<br />
PSM is a semiparametric method that gives an average treatment effect<br />
on the treated (ATT), which is considered a better <strong>in</strong>dicator <strong>of</strong> whether<br />
to cont<strong>in</strong>ue promot<strong>in</strong>g programs that target specific groups <strong>of</strong> <strong>in</strong>terest like<br />
poor farmers than population-wide average treatment effects given by probit<br />
models (Rosenbaum <strong>and</strong> Rub<strong>in</strong> 1983; Heckman 1996; Rosenbaum 2002). CA<br />
is the treatment variable, while reported improvements <strong>in</strong> crop productivity,<br />
household <strong>in</strong>come, <strong>and</strong> food security are the outcomes <strong>of</strong> <strong>in</strong>terest <strong>and</strong><br />
non-CA farmers are the control group.<br />
PSM is based on the assumption that it is not possible for each farmer<br />
to be both <strong>in</strong> the CA as well as non-CA group. This then necessitates the<br />
creation <strong>of</strong> a counterfactual <strong>of</strong> what can be observed by match<strong>in</strong>g CA (treatment)<br />
<strong>and</strong> non-CA (control) groups. PSM therefore matches CA to non-CA<br />
farmers with similar values <strong>of</strong> X giv<strong>in</strong>g us the follow<strong>in</strong>g equation to estimate:<br />
ATT = E [y d=1 |d = 1, p (X)] − E [y d=0 |d = 0, p (X)]. (1)<br />
ATT st<strong>and</strong>s for the average treatment effect on the treated (CA farmers),<br />
y d=1 |d = 1 is the reported changes <strong>in</strong> livelihood outcomes actually observed<br />
<strong>in</strong> the CA farmer subsample, while y d=0 |d = 0 is the change observed <strong>in</strong> the<br />
non-CA group. p(X) is the propensity score, which is def<strong>in</strong>ed as conditional<br />
probability <strong>of</strong> be<strong>in</strong>g <strong>in</strong> the CA group conditional on X. Match<strong>in</strong>gon<br />
the propensity score circumvents the challenge <strong>of</strong> match<strong>in</strong>g on covariates,<br />
which poses a dimensionality problem particularly when match<strong>in</strong>g on many<br />
covariates.<br />
The PSM is, thus, a two-stage process, first perform<strong>in</strong>g a probit or<br />
logit regression by calculat<strong>in</strong>g the household’s propensity to be <strong>in</strong> the CA<br />
group, that is, p(X) is calculated <strong>in</strong> this stage. The vector X conta<strong>in</strong>s a set <strong>of</strong><br />
covariates deemed to <strong>in</strong>fluence the decision to practice CA. The second stage
<strong>Smallholder</strong> <strong>Farmers</strong> <strong>in</strong> Central Mozambique 769<br />
uses propensity scores obta<strong>in</strong>ed <strong>in</strong> the first stage to match CA <strong>and</strong> non-CA<br />
farmers. A number <strong>of</strong> match<strong>in</strong>g methods can be used <strong>in</strong> this stage, each us<strong>in</strong>g<br />
a different function to conduct the match<strong>in</strong>g although the result <strong>of</strong> each is<br />
an ATT value that <strong>in</strong>dicates the impact <strong>of</strong> CA on the selected livelihoods<br />
<strong>in</strong>dicators. We use the kernel match<strong>in</strong>g method, which matches a treated<br />
unit to all control units weighted <strong>in</strong> proportion to the closeness between the<br />
treated <strong>and</strong> the control unit, that is, control units receive weights based on<br />
the distance between their propensity score <strong>and</strong> the propensity score <strong>of</strong> the<br />
treated unit to which they are be<strong>in</strong>g matched. To check the robustness <strong>of</strong> the<br />
results from kernel match<strong>in</strong>g we also use another match<strong>in</strong>g algorithm <strong>in</strong> the<br />
calculation <strong>of</strong> the ATT: the nearest neighbor match<strong>in</strong>g method. It <strong>in</strong>volves<br />
choos<strong>in</strong>g a unit form the control or comparison group as a match<strong>in</strong>g partner<br />
for a treated <strong>in</strong>dividual that is closest <strong>in</strong> terms <strong>of</strong> the propensity score. 9<br />
The PSM relies on the conditional <strong>in</strong>dependence assumption (CIA),<br />
which assumes that the effects <strong>of</strong> CA are not <strong>in</strong>fluenced by any correlation<br />
between unobserved factors <strong>and</strong> a farmer’s decision to participate<br />
<strong>in</strong> CA. This means that PSM controls only for bias among the observed<br />
covariates. In reality, however, there could be unobserved variables (e.g.,<br />
managerial skills) or a hidden selection bias that could also be significantly<br />
driv<strong>in</strong>g these differences. Hidden bias can occur when two farmers with<br />
the same observed covariates have different chances <strong>of</strong> practic<strong>in</strong>g CA due<br />
to an unobserved covariate. If this unobserved covariate is related to the<br />
livelihood outcomes affected by CA, then failure to account for this hidden<br />
bias can alter conclusions drawn about the effects <strong>of</strong> CA. To check<br />
whether our results are sensitive to the effect <strong>of</strong> unobserved variables we<br />
use “Rosenbaum bounds” to <strong>in</strong>vestigate how strong the effect <strong>of</strong> unobservable<br />
covariates has to be <strong>in</strong> order to reverse <strong>in</strong>ferences drawn about the<br />
effects <strong>of</strong> CA (Rosenbaum 2002).<br />
Assume that for household i, ω i ∈ [0, 1] is the unobserved variable that<br />
could potentially affect livelihood outcomes. Rosenbaum (2002) shows that<br />
when two matched farmers, i <strong>and</strong> j, with similar observed characteristics<br />
may have different probabilities <strong>of</strong> participat<strong>in</strong>g <strong>in</strong> CA then the bounds on<br />
the odds ratio that either <strong>of</strong> them will participate is:<br />
1<br />
Ɣ ≤ p i(X)(1 − p j (X))<br />
≤ Ɣ, (2)<br />
p j (X)(1 − p i (X))<br />
where p i (X) <strong>and</strong>p j (X) are the probabilities <strong>of</strong> participat<strong>in</strong>g <strong>in</strong> CA by households<br />
i <strong>and</strong> j, respectively, <strong>and</strong> i # j. The odds ratio for selection <strong>in</strong>to the CA<br />
group is given by Ɣ = exp[γ (ω i − ω j )] for matched households i <strong>and</strong> j. The<br />
effect <strong>of</strong> the unobserved factor on the participation decision is measured<br />
byγ .Ifγ = 1 <strong>and</strong>, thus, Ɣ = 1, then both households have the same probability<br />
<strong>of</strong> participat<strong>in</strong>g <strong>in</strong> CA <strong>and</strong> there is no hidden bias. As Ɣ <strong>in</strong>creases, the<br />
<strong>in</strong>fluence <strong>of</strong> the unobserved factor; if it exists, goes up. Sensitivity analysis
770 P. Nkala et al.<br />
evaluates how much the effect <strong>of</strong> CA is changed by chang<strong>in</strong>g the values<br />
<strong>of</strong> Ɣ, that is, exam<strong>in</strong><strong>in</strong>g the bounds on 1/Ɣ <strong>and</strong> Ɣ. The limitation <strong>of</strong> the<br />
Rosenbaum bounds method is that it does not <strong>in</strong>dicate whether an unobserved<br />
bias exists, but identifies how large the hidden bias would need to<br />
be to nullify the estimated treatment effect. The assessment <strong>of</strong> the match<strong>in</strong>g<br />
quality <strong>and</strong> sensitivity analysis is based on kernel match<strong>in</strong>g; our pr<strong>in</strong>cipal<br />
match<strong>in</strong>g method.<br />
6. RESULTS AND DISCUSSION<br />
This section presents <strong>and</strong> discusses the empirical results from semiparametric<br />
PSM analyses on crop productivity, household <strong>in</strong>come, <strong>and</strong> food<br />
security. We also explore the reliability <strong>of</strong> the PSM results by assess<strong>in</strong>g the<br />
quality <strong>of</strong> the match<strong>in</strong>g process <strong>and</strong> perform<strong>in</strong>g a sensitivity analysis based<br />
on the Rosenbaum bounds, concentrat<strong>in</strong>g on the livelihood outcomes for<br />
which a significant impact <strong>of</strong> CA is found.<br />
6.1. What Factors Determ<strong>in</strong>e <strong>Farmers</strong>’ Practices <strong>of</strong> <strong>Conservation</strong><br />
<strong>Agriculture</strong>?<br />
Table 3 presents the results from the first stage probit estimation <strong>of</strong> practic<strong>in</strong>g<br />
CA <strong>and</strong> factors affect<strong>in</strong>g the likelihood <strong>of</strong> choos<strong>in</strong>g CA. These results give<br />
an <strong>in</strong>dication <strong>of</strong> the socioeconomic determ<strong>in</strong>ants <strong>of</strong> farmers’ decisions to<br />
practice conservation agriculture.<br />
TABLE 3 Probit Estimates for Adoption <strong>of</strong> <strong>Conservation</strong> <strong>Agriculture</strong><br />
Variable Coefficient Std. error<br />
Log <strong>of</strong> age −0.015 0.357<br />
Gender −0.138 0.249<br />
Marital status 0.248 0.293<br />
Log <strong>of</strong> household size −0.023 0.246<br />
Education 0.132 0.201<br />
Log <strong>of</strong> wealth 0.196 ∗∗∗ 0.073<br />
Log <strong>of</strong> cultivated area −0.269 0.28<br />
Log <strong>of</strong> markets 0.442 ∗∗∗ 0.165<br />
Maize 0.649 ∗∗ 0.298<br />
Log <strong>of</strong> extension 0.260 0.191<br />
Constant −1.803 1.556<br />
Log likelihood −104.404<br />
Likelihood ratio test: χ 2 (12) 15.150<br />
Correct predictions (%) 70<br />
Observations 162<br />
Notes: ∗∗∗ , ∗∗ , ∗ significant at 1%, 5%, <strong>and</strong> 10%, respectively. The estimation controls for village or<br />
community dummies.
<strong>Smallholder</strong> <strong>Farmers</strong> <strong>in</strong> Central Mozambique 771<br />
The <strong>in</strong>volvement <strong>in</strong> CA tended to be for the more wealthy farmers,<br />
which could be attributed to the fact that a) <strong>in</strong> Pumbuto farmers co-opted<br />
<strong>in</strong>to CA were already members <strong>of</strong> the FFS <strong>and</strong> b) common practice that<br />
wealthier households are more likely to jo<strong>in</strong> <strong>in</strong>terventions. The probability<br />
l<strong>in</strong>k<strong>in</strong>g wealthier households to CA corroborates well with the effectiveness<br />
<strong>and</strong> will<strong>in</strong>gness to <strong>in</strong>vest <strong>in</strong> appropriate technology, which is usually a<br />
feat for the rich. The wealth variable is proxied by the value <strong>of</strong> total livestock<br />
hold<strong>in</strong>gs as an <strong>in</strong>dicator <strong>of</strong> total assets hold<strong>in</strong>gs as other asset hold<strong>in</strong>gs<br />
by these groups <strong>of</strong> farmers were <strong>in</strong>significant <strong>in</strong> expla<strong>in</strong><strong>in</strong>g the household<br />
wealth status. This suggests that wealthier households, with higher asset<br />
endowments are more likely to practice conservation agriculture than their<br />
poorly resourced counterparts as stated <strong>in</strong> Giller et al. (2009). In Pumbuto,<br />
l<strong>and</strong> scarcity was a negative factor as one respondent reiterated “because I<br />
do not have enough l<strong>and</strong> for farm<strong>in</strong>g, <strong>and</strong> tools to even work on all the l<strong>and</strong><br />
that I own I cannot practice CA on all my l<strong>and</strong>.”<br />
We <strong>in</strong>fer from the results a positive relationship between markets <strong>and</strong><br />
practices <strong>of</strong> conservation agriculture as markets create non-farm opportunities<br />
that compete with time allocated for agricultural activities. Alternatively,<br />
this result could be captur<strong>in</strong>g the fact that the further away from the market<br />
a household is, the less the opportunities to pursue alternative compet<strong>in</strong>g<br />
market driven activities. This leaves households with limited options<br />
<strong>and</strong>, hence, the <strong>in</strong>creased likelihood <strong>of</strong> practic<strong>in</strong>g conservation agriculture.<br />
However, we are also aware that, for Pumbuto, <strong>in</strong>itial <strong>in</strong>volvement <strong>in</strong> FFS<br />
played an important role <strong>in</strong> participat<strong>in</strong>g <strong>in</strong> CA.<br />
6.2. Treatment Effects From the Propensity Score Match<strong>in</strong>g Methods<br />
The PSM method enables us to <strong>in</strong>vestigate how CA has impacted reported<br />
changes <strong>in</strong> livelihood outcomes. The method uses estimated propensity<br />
scores from the first stage results presented <strong>in</strong> Table 3 to generate samples<br />
<strong>of</strong> matched CA <strong>and</strong> non-CA groups us<strong>in</strong>g the kernel <strong>and</strong> nearest neighbor<br />
match<strong>in</strong>g methods.<br />
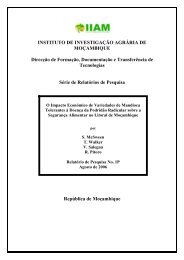
We impose the common support condition <strong>in</strong> the estimation by match<strong>in</strong>g<br />
<strong>in</strong> the region <strong>of</strong> common support. Figure 3 shows the distribution <strong>of</strong><br />
propensity scores <strong>and</strong> the region <strong>of</strong> common support. The bottom half <strong>of</strong><br />
the figure shows the propensity scores distribution for the nontreated, while<br />
the upper-half refers to the treated <strong>in</strong>dividuals. The densities <strong>of</strong> the scores<br />
are on the y axis. The figure <strong>in</strong>dicates that the common support condition<br />
is satisfied as there is overlap <strong>in</strong> the distribution <strong>of</strong> the propensity scores <strong>of</strong><br />
both treated <strong>and</strong> nontreated groups.<br />
PSM results are presented <strong>in</strong> Table 4. Only observations with<strong>in</strong> common<br />
support are used, that is, observations for which matches were found (76 CA<br />
farmers as <strong>in</strong>dicated <strong>in</strong> Table 4). As already stated above, ATT is the average<br />
treatment effect on the treated. The st<strong>and</strong>ard errors for the ATT are calculated
772 P. Nkala et al.<br />
0 .2 .4 .6 .8 1<br />
Propensity Score<br />
Untreated<br />
Treated: Off support<br />
Treated: On support<br />
FIGURE 3 Propensity score distribution <strong>and</strong> the common support condition. (Color figure<br />
available onl<strong>in</strong>e.)<br />
TABLE 4 Average Treatment Effects from Propensity Score Match<strong>in</strong>g<br />
Productivity Income Food security<br />
Kernel<br />
Nearest<br />
neighbor<br />
Kernel<br />
Nearest<br />
neighbor<br />
Kernel<br />
Nearest<br />
neighbor<br />
CA farmers 0.71 0.71 0.67 0.67 0.74 0.74<br />
Non-CA farmers 0.18 0.18 0.66 0.71 0.74 0.72<br />
Difference, ATT 0.53 ∗∗∗ 0.53 ∗∗∗ 0.01 −0.039 −0.003 0.01<br />
(Std. Error) (0.10) (0.12) (0.10) (0.12) (0.10) (0.12)<br />
Total number <strong>of</strong> observations<br />
CA farmers 79 79 79 79 79 79<br />
Non-CA farmers 86 86 86 86 86 86<br />
Number <strong>of</strong> observations with<strong>in</strong> common support<br />
CA farmers 76 76 76 76 76 76<br />
Non-CA farmers 86 86 86 86 86 86<br />
Notes: ∗∗∗ , ∗∗ , ∗ significant at 1%, 5%, <strong>and</strong> 10%, respectively.<br />
us<strong>in</strong>g bootstrapp<strong>in</strong>g with 200 replications. The results are used to calculate<br />
the impact <strong>of</strong> CA on reported improvements <strong>in</strong> crop productivity, household<br />
<strong>in</strong>come, <strong>and</strong> household food security.<br />
The results <strong>in</strong>dicate a positive impact <strong>of</strong> CA on productivity <strong>and</strong> this is<br />
supported with statements from most farmers <strong>in</strong> group discussions <strong>in</strong> Ruaca<br />
that<br />
conservation agriculture is helpful because we see a lot <strong>of</strong> changes, s<strong>in</strong>ce<br />
we started our harvest has improved <strong>and</strong> we do not have to move from<br />
place to place <strong>and</strong> have stopped cutt<strong>in</strong>g <strong>and</strong> burn<strong>in</strong>g trees as we used<br />
to do before.
<strong>Smallholder</strong> <strong>Farmers</strong> <strong>in</strong> Central Mozambique 773<br />
They <strong>in</strong>dicate that, controll<strong>in</strong>g for socioeconomic characteristics, a r<strong>and</strong>omly<br />
chosen farmer among the CA group is shown to be 0.53 probability po<strong>in</strong>ts<br />
more likely to report an improvement <strong>in</strong> crop productivity than a non-CA<br />
farmer.<br />
This result is consistent for both the kernel <strong>and</strong> nearest neighbor match<strong>in</strong>g<br />
methods. However, the results do not reveal a significant direct effect<br />
<strong>of</strong> CA on household <strong>in</strong>comes <strong>and</strong> food security h<strong>in</strong>t<strong>in</strong>g at the possibility <strong>of</strong><br />
an <strong>in</strong>direct l<strong>in</strong>k between CA, household <strong>in</strong>come, <strong>and</strong> food security. On the<br />
contrary, this implies that there is a direct l<strong>in</strong>k between CA <strong>and</strong> productivity.<br />
Furthermore, this postulates that changes <strong>in</strong> productivity are immediate<br />
benefits <strong>of</strong> CA while changes <strong>in</strong> household <strong>in</strong>comes <strong>and</strong> food security might<br />
occur <strong>in</strong> the long term. Our discussions with farmers also implored that early<br />
plant<strong>in</strong>g could also expla<strong>in</strong> the <strong>in</strong>crease <strong>in</strong> productivity.<br />
Although it can be argued that the impacts <strong>of</strong> CA can only be felt by<br />
farmers <strong>in</strong> the medium to long term, our results highlight the positive impacts<br />
<strong>of</strong> CA on livelihoods through <strong>in</strong>creased productivity. As one farmer <strong>in</strong> Ruaca<br />
put it,<br />
s<strong>in</strong>ce we started practic<strong>in</strong>g this type <strong>of</strong> agriculture, l<strong>in</strong>ha-l<strong>in</strong>ha, 10 <strong>and</strong><br />
our harvest has <strong>in</strong>creased substantially although we experience problems<br />
with weeds. We do not have money to pay for weed<strong>in</strong>g but we can pay<br />
us<strong>in</strong>g gra<strong>in</strong> <strong>and</strong> if a person is hired to do the weed<strong>in</strong>g for 3 days we<br />
give him a bucket <strong>of</strong> maize. I managed to build this extra house, bought<br />
this animal drawn cart <strong>and</strong> three bicycles that my children use to go to a<br />
secondary school <strong>in</strong> Messica. We now have enough food for the whole<br />
year <strong>and</strong> we use some <strong>of</strong> the gra<strong>in</strong> to pay for labor for weed<strong>in</strong>g, we used<br />
to experience problems with food especially just before the first ra<strong>in</strong>s.<br />
In a broader sense, the results underscore the role <strong>of</strong> CA <strong>in</strong> improv<strong>in</strong>g<br />
livelihoods <strong>of</strong> smallholder farmers through <strong>in</strong>creased crop yields. These benefits<br />
rema<strong>in</strong> significant even after controll<strong>in</strong>g for possible self-selection bias<br />
with regards to the decision to participate <strong>in</strong> CA. These results further justify<br />
the need to promote CA as a productivity-enhanc<strong>in</strong>g technology <strong>in</strong> areas<br />
experienc<strong>in</strong>g low yields <strong>in</strong> Mozambique.<br />
6.3. Assess<strong>in</strong>g the Quality <strong>of</strong> the Match<strong>in</strong>g Process<br />
S<strong>in</strong>ce the PSM method conditions only on the propensity score we, therefore,<br />
assess the quality <strong>of</strong> the match<strong>in</strong>g process by perform<strong>in</strong>g balanc<strong>in</strong>g tests that<br />
exam<strong>in</strong>e the st<strong>and</strong>ardized bias for all covariates used <strong>in</strong> the match<strong>in</strong>g process.<br />
This checks whether the match<strong>in</strong>g procedure is able to balance the distribution<br />
<strong>of</strong> the covariates <strong>in</strong> both the CA <strong>and</strong> non-CA groups. In the case <strong>of</strong> a<br />
successful match<strong>in</strong>g process, the differences should not exist after match<strong>in</strong>g.
774 P. Nkala et al.<br />
TABLE 5 Balanc<strong>in</strong>g Tests for All Match<strong>in</strong>g Covariates<br />
Mean St<strong>and</strong>ardized bias t test<br />
Variable CA Non-CA % bias % reduction <strong>in</strong> bias p values<br />
Log <strong>of</strong> age 3.74 3.76 −3.4 72.8 0.84<br />
Gender 0.34 0.35 −2.5 81.2 0.88<br />
Marital status 0.83 0.83 0.6 97.3 0.97<br />
Log <strong>of</strong> household size 1.98 2.03 −9.6 33.5 0.55<br />
Education 1.72 1.72 0.0 99.6 0.99<br />
Log <strong>of</strong> wealth 4.63 4.92 −15.4 69.6 0.29<br />
Log <strong>of</strong> farm area cultivated 1.38 1.46 −16.7 −41.7 0.32<br />
Log <strong>of</strong> markets 1.63 1.62 1.7 97.5 0.92<br />
Maize 0.89 0.90 −1.0 97.6 0.94<br />
Log <strong>of</strong> extension 2.54 2.64 −11.3 58.8 0.51<br />
Pumbuto 0.40 0.34 11.0 −163.5 0.50<br />
Ruaca 0.33 0.43 −21.9 −1181.9 0.19<br />
The st<strong>and</strong>ardized bias is def<strong>in</strong>ed as the difference between the sample<br />
means <strong>in</strong> the CA <strong>and</strong> the matched non-CA sub-samples as a percentage <strong>of</strong><br />
the square root <strong>of</strong> the average <strong>of</strong> the sample variances <strong>in</strong> both groups.<br />
Intuitively, the st<strong>and</strong>ardized bias considers the size <strong>of</strong> the difference <strong>in</strong><br />
means <strong>of</strong> a condition<strong>in</strong>g variable between the CA <strong>and</strong> non-CA groups, scaled<br />
by the square root <strong>of</strong> the average <strong>of</strong> the variances <strong>in</strong> the orig<strong>in</strong>al samples.<br />
In addition two-sample t tests are used to <strong>in</strong>vestigate the significance <strong>of</strong> the<br />
post-match<strong>in</strong>g differences <strong>in</strong> the covariate means for the two groups. We do<br />
this only for reported improvements <strong>in</strong> productivity for which the CA effect<br />
was found to be significant. Table 5 presents the results <strong>of</strong> this analysis <strong>and</strong><br />
the results suggests that the propensity score is balanced for each covariate<br />
between CA <strong>and</strong> non-CA groups. The reduction <strong>in</strong> the st<strong>and</strong>ardized bias is<br />
substantially reduced after match<strong>in</strong>g <strong>and</strong> the test <strong>of</strong> the null hypothesis <strong>of</strong><br />
no significant differences after match<strong>in</strong>g cannot be rejected at 10% for all the<br />
variables.<br />
6.4. Sensitivity Analysis<br />
For the sensitivity analysis we adopt Becker <strong>and</strong> Galiendo’s (2007) procedure<br />
for bound<strong>in</strong>g treatment effects estimated for b<strong>in</strong>ary outcomes. The approach<br />
uses the Mantel <strong>and</strong> Haenszel (MH) test statistic which computes the<br />
ATT while sett<strong>in</strong>g the level <strong>of</strong> hidden bias to a certa<strong>in</strong> value,Ɣ. In this<br />
case, the MH statistic tests the null hypothesis <strong>of</strong> no CA effect <strong>and</strong> calculates<br />
a hypothetical significance level which represents the bound on the<br />
significance level <strong>of</strong> the treatment effect <strong>in</strong> the case <strong>of</strong> endogenous selfselection<br />
<strong>in</strong>to CA. The lower bound suggests the case when the CA effect
<strong>Smallholder</strong> <strong>Farmers</strong> <strong>in</strong> Central Mozambique 775<br />
TABLE 6 Sensitivity Analysis Us<strong>in</strong>g the Mantel-Haenszel Bounds<br />
Gamma values Qmh+ Qmh− pmh+ pmh−<br />
1 6.55 6.55
776 P. Nkala et al.<br />
7. CONCLUSIONS AND POLICY RECOMMENDATIONS<br />
The objective <strong>of</strong> this article was to <strong>in</strong>vestigate how practic<strong>in</strong>g conservation<br />
agriculture (CA) impacts changes <strong>in</strong> livelihood outcomes, particularly focus<strong>in</strong>g<br />
on changes <strong>in</strong> crop productivity, household <strong>in</strong>come <strong>and</strong> food security.<br />
Notwithst<strong>and</strong><strong>in</strong>g controversies <strong>and</strong> disagreements about CA, we f<strong>in</strong>d evidence<br />
<strong>in</strong> support <strong>of</strong> CA’s ability to improve smallholder farmers’ livelihoods.<br />
In particular, we f<strong>in</strong>d evidence <strong>of</strong> productivity-enhanc<strong>in</strong>g benefits <strong>of</strong> CA:<br />
Practic<strong>in</strong>g CA is found to be significantly associated with reported improvements<br />
<strong>in</strong> crop yields. This suggests that it is possible to realize small positive<br />
short run benefits form CA, which may <strong>in</strong>crease gradually <strong>in</strong> the long run.<br />
This is further supported by anecdotal evidence that shows that successful<br />
CA farmers have made significant livelihoods improvements expla<strong>in</strong>ed<br />
by accumulation <strong>of</strong> household <strong>and</strong> farm<strong>in</strong>g assets <strong>and</strong> social capital further<br />
strengthen<strong>in</strong>g the case for conservation agriculture <strong>in</strong> the enhancement <strong>of</strong><br />
livelihoods <strong>of</strong> smallholder farmers.<br />
From this result we conclude that conservation agriculture can improve<br />
livelihoods <strong>of</strong> farmers <strong>in</strong> Mozambique but it is necessary to be conscious<br />
about the different ecologies <strong>and</strong> categories <strong>of</strong> farmers <strong>in</strong> different areas.<br />
<strong>Conservation</strong> agriculture is not for all categories <strong>of</strong> farmers particularly the<br />
very poor farmers; although these are the most deserv<strong>in</strong>g <strong>of</strong> all other groups.<br />
The significance <strong>of</strong> wealth <strong>in</strong> the likelihood <strong>of</strong> practic<strong>in</strong>g conservation agriculture<br />
suggests that policies that reduce poverty or <strong>in</strong>crease asset hold<strong>in</strong>gs<br />
<strong>of</strong> households could positively impact efforts to promote the widespread<br />
adoption <strong>of</strong> CA <strong>in</strong> Mozambique. Support systems dur<strong>in</strong>g the <strong>in</strong>itial stages are<br />
necessary for poor <strong>and</strong> more deserv<strong>in</strong>g farmers to benefit from CA otherwise<br />
the technology would just benefit only the already rich farmers.<br />
F<strong>in</strong>ally, for conservation agriculture to effectively improve livelihoods <strong>of</strong><br />
farmers <strong>in</strong> vulnerable production regions <strong>of</strong> Mozambique, we recommend<br />
policies that correctly target conservation agriculture to appropriate categories<br />
<strong>of</strong> well-resourced farmers <strong>and</strong> empowerment for the poorer groups<br />
<strong>of</strong> farmers. Policies for the reduction <strong>of</strong> environmental constra<strong>in</strong>ts are also<br />
necessary for the m<strong>in</strong>imization <strong>of</strong> negative impacts on the soil <strong>and</strong> other<br />
environmental impacts. Furthermore, such policies should <strong>in</strong>tegrate conservation<br />
agriculture <strong>in</strong>to the overall development policy framework <strong>of</strong><br />
Mozambican agriculture.<br />
NOTES<br />
1. These <strong>in</strong>clude the Food <strong>and</strong> <strong>Agriculture</strong> Organization <strong>of</strong> the United Nations (FAO), International<br />
Centre for Tropical <strong>Agriculture</strong> (CIAT), <strong>and</strong> the International Maize <strong>and</strong> Wheat Improvement Centre<br />
(CIMMYT) that have been particularly active <strong>in</strong> central <strong>and</strong> northern regions <strong>of</strong> Mozambique s<strong>in</strong>ce<br />
2005 <strong>and</strong> 2007, respectively.<br />
2. This article does not seek to give a detailed description <strong>of</strong> what CA is; that has been dealt with<br />
<strong>in</strong> other literature (FAO 2001, 2008; Twomlow et al. 2008).
<strong>Smallholder</strong> <strong>Farmers</strong> <strong>in</strong> Central Mozambique 777<br />
3. Glyphosate is a commonly applied herbicide <strong>in</strong> CA acclaimed to be non-selective, effective<br />
(noth<strong>in</strong>g survives) <strong>in</strong> kill<strong>in</strong>g weeds <strong>of</strong> all types <strong>in</strong>clud<strong>in</strong>g grasses, perennials, <strong>and</strong> shrubs. It gets absorbed<br />
<strong>in</strong>to leaves <strong>and</strong> s<strong>of</strong>t stalk tissue <strong>and</strong> is then transported to various enzyme systems where it <strong>in</strong>hibits<br />
metabolism lead<strong>in</strong>g to death <strong>of</strong> the plant <strong>in</strong> days or weeks.<br />
4. Extension services <strong>in</strong> Mozambique are characterized by under fund<strong>in</strong>g <strong>and</strong> <strong>in</strong>adequate manpower.<br />
In 2004, there were 708 extension workers <strong>and</strong> these had reduced to 600 <strong>in</strong> 2009 <strong>and</strong> only 30%<br />
<strong>of</strong> the rural districts <strong>in</strong> Mozambique had access to public extension services (Gemo 2006; Uaiene et al.<br />
2009).<br />
5. This is def<strong>in</strong>ed as the farmer, his household, <strong>and</strong> his fields where all decision mak<strong>in</strong>g on crop<br />
production is done <strong>and</strong> implemented.<br />
6. The PTD approach acknowledges the important role played by the farmer <strong>in</strong> technology dissem<strong>in</strong>ation,<br />
hence, places participation by farmers at all levels through workshops that encourage shar<strong>in</strong>g <strong>of</strong><br />
ideas, build<strong>in</strong>g on what is already known by the farmers, as opposed to top-down approaches that seek<br />
to enforce ideas <strong>of</strong> scientists <strong>and</strong> other technology <strong>in</strong>novators on the farmers.<br />
7. It is only <strong>in</strong> Nhanguo where there is a well-constructed market structure whereby farmers rent<br />
stalls from which they sell produce, but, <strong>in</strong> Ruaca <strong>and</strong> Pumbuto, farmers sell produce from underneath<br />
trees or by the roadside at the local bus<strong>in</strong>ess centres.<br />
8. This refers to the local unorganized markets characteristics <strong>of</strong> Pumbuto <strong>and</strong> Ruaca.<br />
9. More details on this method can be found <strong>in</strong> Becker <strong>and</strong> Ich<strong>in</strong>o (2002). The estimation here<br />
uses the STATA 10’s psmatch2 rout<strong>in</strong>e developed by Leuven <strong>and</strong> Barbara (2003).<br />
10. L<strong>in</strong>ha is a Portuguese word for l<strong>in</strong>e, so villages say l<strong>in</strong>ha-l<strong>in</strong>ha to mean that they drop the seeds<br />
<strong>in</strong> a l<strong>in</strong>e as opposed to r<strong>and</strong>om placement <strong>of</strong> seed <strong>in</strong> the soil that they used to do before <strong>in</strong>troduction<br />
<strong>of</strong> CA.<br />
11. Table 6 reports both the lower <strong>and</strong> upper bounds although for positive <strong>and</strong> significant effects<br />
report<strong>in</strong>g the lower bounds might not be necessary.<br />
REFERENCES<br />
Bailey, C. 1988. The social consequences <strong>of</strong> tropical shrimp mariculture development.<br />
Ocean <strong>and</strong> Shorel<strong>in</strong>e Management 11:31–44.<br />
Becker, S. O., <strong>and</strong> M. Calliendo. 2007. Sensitivity analysis for average treatment<br />
effect. Stata Journal 7:71–83.<br />
Becker, S. O., <strong>and</strong> A. Ich<strong>in</strong>o. 2002. Estimation <strong>of</strong> average treatment effects based on<br />
propensity scores. Stata 2:358–377.<br />
Bene, C. 2003. When fishery rhymes with poverty, a first step beyond the old<br />
paradigm on poverty <strong>in</strong> small-scale fisheries. World Development 36(1):945–971.<br />
Bene, C., <strong>and</strong> N. Obirih-Opareh. 2009. Social <strong>and</strong> economic impacts <strong>of</strong> agricultural<br />
productivity <strong>in</strong>tensification: The case <strong>of</strong> brush park fisheries <strong>in</strong> Lake Volta.<br />
Agricultural Systems 102:1–10.<br />
Bolliger, A. 2007. Is zero-till an appropriate agricultural alternative for disadvantaged<br />
smallholders <strong>of</strong> South Africa? A study <strong>of</strong> surrogate systems <strong>and</strong><br />
strategies, smallholder sensitivities <strong>and</strong> soil glycoprote<strong>in</strong>s. PhD Thesis. University<br />
<strong>of</strong> Copenhagen. Copenhagen, Denmark.<br />
Chambers, R., <strong>and</strong> G. Conway. 1992. Susta<strong>in</strong>able rural livelihoods: Practical<br />
concepts for the 21st century. IDS Discussion Paper 296. Brighton: IDS.<br />
Chikoye, D., J. Ellis-Jones, G. Tarawali, P. Kormawa, O. Nielsen, S. Ibana, <strong>and</strong><br />
T. R. Avav. 2006. <strong>Farmers</strong>’ perceptions <strong>of</strong> the spear grass (Imperata cyl<strong>in</strong>drica)<br />
problem <strong>and</strong> its control <strong>in</strong> the lowl<strong>and</strong> sub-humid savannah <strong>of</strong> Nigeria. Food<br />
<strong>Agriculture</strong> <strong>and</strong> the Environment 4: 118–126.
778 P. Nkala et al.<br />
Derpsch, R. 2005. The extent <strong>of</strong> conservation agriculture adoption worldwide—<br />
Implications <strong>and</strong> impacts. In Proceed<strong>in</strong>gs on CD. III World Congress on<br />
<strong>Conservation</strong> <strong>Agriculture</strong>: L<strong>in</strong>k<strong>in</strong>g <strong>Livelihoods</strong> <strong>and</strong> <strong>Conservation</strong>. Nairobi,<br />
Kenya. October 3–7.<br />
D’Souza, G., D. Cyphers, <strong>and</strong> T. Phipps. 1993. Factors affect<strong>in</strong>g adoption <strong>of</strong><br />
agricultural practices. Agricultural Resource Economics Review 22:159–165.<br />
Food <strong>and</strong> <strong>Agriculture</strong> Organization <strong>of</strong> the United Nations. 2008. Invest<strong>in</strong>g<br />
<strong>in</strong> susta<strong>in</strong>able agriculture <strong>in</strong>tensification, the role <strong>of</strong> conservation agriculture.<br />
A Framework for Action. http://www.fao.org/ag/ca/doc/proposed_frame<br />
work.pdf<br />
Food <strong>and</strong> <strong>Agriculture</strong> Organization <strong>of</strong> the United Nations. 2001. The economics <strong>of</strong><br />
soil productivity <strong>in</strong> Africa. Soils Bullet<strong>in</strong>. Rome.<br />
Gemo, H. 2006. Recursos humanos na exatensao agraria publica em Mozambique<br />
(1987–2006). Estudos sobre Investigacao e Extensao Agraria Volume 1, IIAM,<br />
DNEA, MINAG–Maputo.<br />
Giller, K. E., E. Witter, M. Corbeels, <strong>and</strong> P. Tittonell. 2009. <strong>Conservation</strong> <strong>Agriculture</strong><br />
<strong>and</strong> smallholder farm<strong>in</strong>g <strong>in</strong> Africa: The heretics’ view. Field Crop Research<br />
114:23–34.<br />
Govaerts, B., N. Verhulst, A. Castellanos-Navarrete, K. D. Sayre, J. Dixon, <strong>and</strong><br />
L. Dendooven. 2009. <strong>Conservation</strong> agriculture <strong>and</strong> soil carbon sequestration:<br />
Between myth <strong>and</strong> farmer reality. Critical Review. Plant Science 28:97–122.<br />
Guto, S. N., P. Pypers, B. Vanlauwe, N. de Ridder, <strong>and</strong> K. E. Giller. 2011. Socioecological<br />
niches for m<strong>in</strong>imum tillage <strong>and</strong> crop-residue retention <strong>in</strong> cont<strong>in</strong>uous<br />
maize cropp<strong>in</strong>g systems <strong>in</strong> smallholder farms <strong>of</strong> central Kenya, soil tillage<br />
conservation. Agronomy Journal 103(3):644–654.<br />
Heckman, J. 1996. R<strong>and</strong>omization as an <strong>in</strong>strumental variable estimator. Review <strong>of</strong><br />
Economics <strong>and</strong> Statistics 56:336–41.<br />
Kassie, M., P. Zikhali, K. Manjur, <strong>and</strong> S. Edwards. 2009. Adoption <strong>of</strong> susta<strong>in</strong>able<br />
agricultural practices evidence from a semi-arid region <strong>of</strong> Ethiopia. Natural<br />
Resources Forum 33:189–198.<br />
Krantz, L. 2001. The susta<strong>in</strong>able livelihood approach to poverty reduction: An <strong>in</strong>troduction<br />
swedish <strong>in</strong>ternational development cooperation agency division for<br />
policy <strong>and</strong> socio-economic analysis. (Unpublished manuscript.)<br />
LaFlamme, M., <strong>and</strong> J. Davies. 2007. Develop<strong>in</strong>g a Shared model for<br />
susta<strong>in</strong>able aborig<strong>in</strong>al livelihoods <strong>in</strong> natural-cultural resource management,<br />
CRC–Desert knowledge. http://www.desertknowledgecrc.com.au/research/<br />
<strong>in</strong>l<strong>and</strong>publications.html (accessed 29 August 2011).<br />
Lal, R. 2009. The plough <strong>and</strong> agricultural susta<strong>in</strong>ability. Susta<strong>in</strong>able <strong>Agriculture</strong><br />
33:66–84<br />
Lee, D. R. 2005. Agricultural susta<strong>in</strong>ability <strong>and</strong> technology adoption: Issues <strong>and</strong><br />
policies for develop<strong>in</strong>g countries. American Journal <strong>of</strong> Agricultural Economics<br />
87(5):1325–1334.<br />
Leuven, E., <strong>and</strong> B. Barbara. 2003. Statistical s<strong>of</strong>tware components S432001, Boston<br />
College Department <strong>of</strong> Economics, revised May 2, 2009.<br />
Lienhard, P., H. Tran Quoc, C. Khamxaykhay, T. Sosomphou, F. Tivet, G.<br />
Lestrel<strong>in</strong>, K. Panyasiri,et al.2006. Improv<strong>in</strong>g smallholder livelihood, Watershed<br />
<strong>and</strong> soil management through consevation agriculture <strong>in</strong> Laos (Unpublished<br />
manuscript).
<strong>Smallholder</strong> <strong>Farmers</strong> <strong>in</strong> Central Mozambique 779<br />
Maddison, D. 2007. The perceptions <strong>of</strong> <strong>and</strong> adaptation to climate change <strong>in</strong><br />
Africa, Policy Research Work<strong>in</strong>g Paper 4308, Development Research Group,<br />
Susta<strong>in</strong>able Rural <strong>and</strong> Urban Development Team. The World Bank.<br />
Pretty, J. 2000. Can susta<strong>in</strong>able agriculture feed Africa? New evidence on progress,<br />
processes <strong>and</strong> impacts. Centre for Environment <strong>and</strong> Society. University <strong>of</strong> Essex.<br />
Colchester. UK.<br />
Pretty, J. 1999. Can susta<strong>in</strong>able agriculture feed Africa? New evidence on progress,<br />
process <strong>and</strong> impacts. Environment, Development <strong>and</strong> Susta<strong>in</strong>ability 1:253–274.<br />
Rosenbaum, P. R. 2002. Observational studies. New York: Spr<strong>in</strong>ger.<br />
Rosenbaum, P. R., <strong>and</strong> D. B. Rub<strong>in</strong>. 1983. The central role <strong>of</strong> the propensity score<br />
<strong>in</strong> observational studies for causal effects. Bometrika 70:42–55.<br />
Seeth, H., S. Chachnov, A. Sur<strong>in</strong>ov, <strong>and</strong> J. Von Braun. 1998. Russian poverty:<br />
Muddl<strong>in</strong>g through economic transition with garden plots. World Development<br />
26(9):1611–1623.<br />
Sorrenson, W. J. 1997. F<strong>in</strong>ancial <strong>and</strong> economic implications <strong>of</strong> no-tillage <strong>and</strong> crop<br />
rotations compared to conventional cropp<strong>in</strong>g systems. TCI Occasional Paper<br />
Series No. 9, Rome, Food <strong>and</strong> <strong>Agriculture</strong> Organization <strong>of</strong> the United Nations.<br />
Start, D., <strong>and</strong> C. Johnson. 2004. Livelihood options? The political economy <strong>of</strong><br />
access opportunity <strong>and</strong> diversification. Overseas Development Institute (ODI).<br />
Work<strong>in</strong>g paper 233.<br />
Stonehouse, P.D. 1997. Socio-economics <strong>of</strong> alternative tillage systems. Soil <strong>and</strong><br />
Tillage Research 43:109–130.<br />
Twomlow, S. J., L. Hove, W. Mupangwa, <strong>and</strong> P. Masikati. 2008. Precision conservation<br />
agriculture for vulnerable farmers <strong>in</strong> low-potential zones. International<br />
Crop Research Institute for the Semi-Arid Tropics (ICRISAT). Zimbabwe.<br />
Uaiene, R. N., C. Arndt, <strong>and</strong> W. A. Masters. 2009. Determ<strong>in</strong>ants <strong>of</strong> agricultural<br />
technology adoption <strong>in</strong> mozambique. Discussion paper no. 67E.<br />
National Directorate <strong>of</strong> Studies <strong>and</strong> Policy Analysis, M<strong>in</strong>istry <strong>of</strong> Plann<strong>in</strong>g <strong>and</strong><br />
Development, Republic <strong>of</strong> Mozambique.<br />
World Bank. 1991. World Development Report 1991. Wash<strong>in</strong>gton, DC: Oxford<br />
University Press.