Brunei Economic Bulletin Vol.3 Issue No.2 - Brunei Resources
Brunei Economic Bulletin Vol.3 Issue No.2 - Brunei Resources
Brunei Economic Bulletin Vol.3 Issue No.2 - Brunei Resources

You also want an ePaper? Increase the reach of your titles
YUMPU automatically turns print PDFs into web optimized ePapers that Google loves.
BRUNEI ECONOMIC BULLETIN<br />
Volume 3, <strong>Issue</strong> 2<br />
Date : 9/2004<br />
THE EDITOR<br />
BRUNEI ECONOMIC BULLETIN (BEB)<br />
JPKE (DEPARTMENT OF ECONOMIC PLANNING AND DEVELOPMENT)<br />
PRIME MINISTER’S OFFICE<br />
Inside this issue:<br />
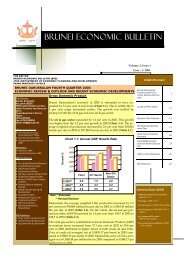
BRUNEI DARUSSALAM SECOND QUARTER 2004<br />
ECONOMIC REVIEW & OUTLOOK AND RECENT ECONOMIC DEVELOPMENTS<br />
Gross Domestic Product<br />
THE EDITOR:<br />
BRUNEI ECONOMIC<br />
BULLETIN (BEB)<br />
JPKE (DEPARTMENT OF ECO-<br />
NOMIC PLANNING AND DEVELOP-<br />
MENT)<br />
PRIME MINISTER'S OFFICE<br />
Phone:<br />
+673-2-233344<br />
Fax: +673-2-230226<br />
Email: info@jpke.gov.bn<br />
BEB Panel of Advisors<br />
♦ Permanent Secretary<br />
Prime Minister’s Office<br />
♦ Director General JPKE,<br />
♦ Deputy Director Generals<br />
JPKE<br />
BEB Editors<br />
♦ Directors, JPKE<br />
♦ Assistant Directors, JPKE<br />
BEB Contributors<br />
♦ Hj Abd Razak Hj Angas<br />
♦ Abd Amin Hashim<br />
♦ Shahrom Hj Suhaimi<br />
♦ Hj Mazlan Hj Mohd Salleh<br />
♦ Mashor POKID Dato Paduka<br />
Hj Musa<br />
♦ Shamsul Bahrin Hj Mohd<br />
Hussain<br />
♦ Dk Hjh Siti Nirmala Pg Hj<br />
Mohammad<br />
♦ Zureidah Hj Abit<br />
♦ Pg Metussin Pg Hj Tuah<br />
♦ Hj Joharry Hj Karim<br />
♦ Hjh Aisah Hj Sani<br />
♦ Hjh Norfatiniwati Hj<br />
Muhammad<br />
BEB Publishers<br />
♦ Noor Jusmin Hj Abd Samad<br />
♦ Hairol Nizam Hj Abd Hamid<br />
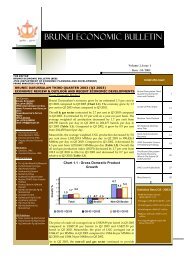
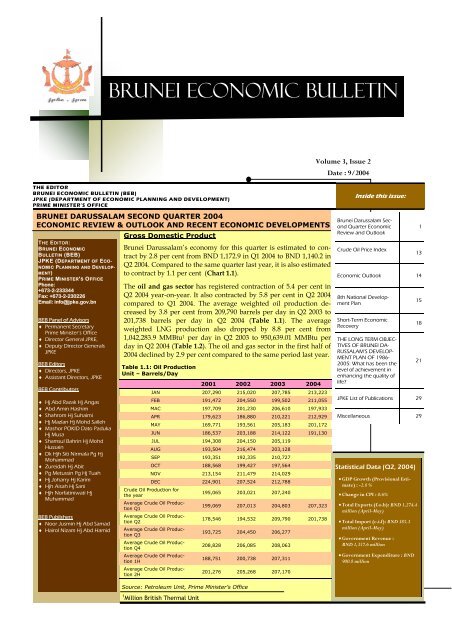
<strong>Brunei</strong> Darussalam’s economy for this quarter is estimated to contract<br />
by 2.8 per cent from BND 1,172.9 in Q1 2004 to BND 1,140.2 in<br />
Q2 2004. Compared to the same quarter last year, it is also estimated<br />
to contract by 1.1 per cent (Chart 1.1).<br />
The oil and gas sector has registered contraction of 5.4 per cent in<br />
Q2 2004 year-on-year. It also contracted by 5.8 per cent in Q2 2004<br />
compared to Q1 2004. The average weighted oil production decreased<br />
by 3.8 per cent from 209,790 barrels per day in Q2 2003 to<br />
201,738 barrels per day in Q2 2004 (Table 1.1). The average<br />
weighted LNG production also dropped by 8.8 per cent from<br />
1,042,283.9 MMBtu 1 per day in Q2 2003 to 950,639.01 MMBtu per<br />
day in Q2 2004 (Table 1.2). The oil and gas sector in the first half of<br />
2004 declined by 2.9 per cent compared to the same period last year.<br />
Table 1.1: Oil Production<br />
Unit – Barrels/Day<br />
2001 2002 2003 2004<br />
JAN 207,290 215,020 207,785 213,223<br />
FEB 191,472 204,550 199,502 211,055<br />
MAC 197,709 201,230 206,610 197,933<br />
APR 179,623 186,880 210,221 212,929<br />
MAY 169,771 193,561 205,183 201,172<br />
JUN 186,537 203,188 214,122 191,130<br />
JUL 194,308 204,150 205,119<br />
AUG 193,504 216,474 203,128<br />
SEP 193,351 192,335 210,727<br />
OCT 188,568 199,427 197,564<br />
NOV 213,154 211,479 214,029<br />
DEC 224,901 207,524 212,788<br />
Crude Oil Production for<br />
the year<br />
195,065 203,021 207,240<br />
Average Crude Oil Production<br />
Q1<br />
Average Crude Oil Production<br />
Q2<br />
Average Crude Oil Production<br />
Q3<br />
Average Crude Oil Production<br />
Q4<br />
Average Crude Oil Production<br />
1H<br />
Average Crude Oil Production<br />
2H<br />
1 Million British Thermal Unit<br />
199,069 207,013 204,803 207,323<br />
178,546 194,532 209,790 201,738<br />
193,725 204,450 206,277<br />
208,828 206,085 208,063<br />
188,751 200,738 207,311<br />
201,276 205,268 207,170<br />
Source: Petroleum Unit, Prime Minister’s Office<br />
<strong>Brunei</strong> Darussalam Second<br />
Quarter <strong>Economic</strong><br />
Review and Outlook<br />
Crude Oil Price Index<br />
Statistical Data (Q2, 2004)<br />
• GDP Growth (Provisional Estimate)<br />
: -2.8 %<br />
• Change in CPI : 0.6%<br />
• Total Exports (f.o.b): BND 1,274.4<br />
million (April-May)<br />
• Total Import (c.i.f): BND 385.3<br />
million (April-May)<br />
• Government Revenue :<br />
BND 1,357.6 million<br />
• Government Expenditure : BND<br />
900.8 million<br />
1<br />
13<br />
<strong>Economic</strong> Outlook 14<br />
8th National Development<br />
Plan<br />
Short-Term <strong>Economic</strong><br />
Recovery<br />
THE LONG TERM OBJEC-<br />
TIVES OF BRUNEI DA-<br />
RUSSALAM’S DEVELOP-<br />
MENT PLAN OF 1986-<br />
2005: What has been the<br />
level of achievement in<br />
enhancing the quality of<br />
life?<br />
15<br />
18<br />
21<br />
JPKE List of Publications 29<br />
Miscellaneous 29
P AGE 2<br />
BRUNEI DARUSSALAM Q2 2004<br />
ECONOMIC REVIEW & OUTLOOK AND RECENT ECONOMIC DEVELOPMENTS<br />
Table 1.2: LNG Production<br />
Unit - MMBtu/Day<br />
2001 2002 2003 2004<br />
JAN 1,033,542.9 1,046,388.0 1,118,431.0 1,117,753.6<br />
FEB 962,006.0 1,095,799.0 1,112,133.0 1,073,981.0<br />
MAC 1,141,934.0 990,443.0 1,165,771.0 1,063,286.8<br />
APR 864,858.0 750,836.0 1,037,552.0 1,126,284.33<br />
MAY 682,869.0 687,569.0 1,002,617.0 785,019.35<br />
JUN 960,671.0 915,497.0 1,088,055.0 946,134.00<br />
JUL 838,649.0 1,061,756.0 1,050,631.0<br />
AUG 936,035.0 1,061,236.0 948,691.0<br />
SEP 1,023,296.0 980,426.0 970,991.7<br />
OCT 1,048,142.0 1,062,589.0 992,310.7<br />
NOV 976,540.0 1,037,404.0 1,038,770.0<br />
DEC 1,146,837.0 1,059,582.0 1,062,209.0<br />
LNG Production for the<br />
Year 968,124.0 978,804.0 1,049,143.0<br />
Average LNG Production<br />
Q1 1,048,621.7 1,042,490.4 1,132,777.6 1,085,249.5<br />
Average LNG Production<br />
Q2 834,448.5 783,567.4 1,042,283.9 950,639.01<br />
Average LNG Production<br />
Q3 931,674.8 1,035,060.1 990,426.5<br />
Average LNG Production<br />
Q4 1,058,049.4 1,053,363.3 1,031,013.2<br />
Average LNG Production<br />
1H 940,943.4 912,243.8 1,087,280.5 1,017,944.23<br />
Average LNG Production<br />
2H 994,862.1 1,044,211.7 1,011,005.5<br />
Source: Petroleum Unit, Prime Minister's Office<br />
Table 1.3: Oil and Gas Production Index<br />
2000 2001 2002 2003 2004<br />
JAN 109.7 108.0 111.2 110.9 112.8<br />
FEB 113.1 100.0 109.0 107.7 110.6<br />
MAC 112.6 108.0 104.4 112.0 105.6<br />
APR 103.7 92.6 91.6 109.2 113.0<br />
MAY 98.7 83.2 92.0 106.2 97.8<br />
JUN 75.9 98.2 102.7 112.2 99.4<br />
JUL 93.3 97.1 107.8 107.8<br />
AUG 93.7 99.9 112.2 103.8<br />
SEP 91.6 102.6 100.9 107.2<br />
OCT 91.8 101.7 106.1 103.2<br />
NOV 107.0 108.3 109.6 110.6<br />
DEC 109.0 118.0 108.9 110.9<br />
Average Index for the Year 100.0 101.5 104.7 108.5<br />
Average Index for Q1 111.8 105.5 108.2 110.3 109.7<br />
Average Index for Q2 92.8 91.2 95.4 109.2 103.3<br />
Average Index for Q3 92.9 99.8 107.0 106.2<br />
Average Index for Q4 102.6 109.3 108.2 108.2<br />
Average Index for H1 102.3 98.3 101.7 109.7<br />
Average Index for H2 97.7 104.6 107.6 107.2<br />
Base year 2000=100<br />
Source: Petroleum Unit, Prime Minister’s Office<br />
Table 1.4: Agricultural Sector<br />
Crop Production<br />
Q2 03 Q1 04 Q2 04<br />
growth<br />
(%)<br />
(Q-O-Q)<br />
growth<br />
(%)<br />
(Y-O-Y)<br />
Vegetables (Tons) 2,564.02 2,023.0 3,012.0 48.9 17.5<br />
Fruits (Tons) 835.7 836.0 806.0 (3.6) (3.6)<br />
Ornamental horticulture (trees) 55,956.0 74,536.0 56,966.0 (23.6) 1.8<br />
Cut Flowers (unit) 29,693.0 31,258.0 34,459.0 10.2 16.1<br />
Various Plantations (Tons) 61.1 62.0 87.0 40.0 42.4<br />
Livestock Production<br />
Buffaloes (Tons) 50.4 16.1 30.0 86.3 (40.5)<br />
BRUNEI ECONOMIC BULLETIN<br />
The oil and gas production index (OGPI) contracted by 5.4 per<br />
cent from 109.2 in Q2 2003 to 103.3 in Q2 2004. On a quarteron-quarter<br />
basis the OGPI also contracted by 5.8 per cent from<br />
109.7 in Q1 2004 (Table 1.3).<br />
The price of crude oil averaged at US$38.20 per barrel in Q2<br />
2004 compared to US$27.33 per barrel a year ago and<br />
US$35.59 in Q1 2004. Meanwhile, the price of LNG averaged<br />
at US$4.71 per MMBtu compared to US$4.70 per MMBtu a<br />
year ago and US$4.67 in Q1 2004.<br />
The overall non-oil and gas sector is estimated to expand by<br />
3.9 per cent in Q2 2004 compared to the same period last year.<br />
Compared to Q1 2004, it is estimated to grow marginally by<br />
0.4 per cent. The year-on-year growth was supported by improvement<br />
in forestry; mining; quarrying and manufacturing;<br />
wholesale and retail; and transport and communication sectors.<br />
Activities in the agricultural sector are estimated to register a<br />
1.4 per cent growth in Q2 2004 compared to the same period a<br />
year ago. This was due to the increase in the production of<br />
vegetables; ornamental horticulture (trees); cut flowers; various<br />
plantations; and chicken eggs (Table 1.4). On a quarter-on<br />
quarter basis, this sector is also estimated to grow by 5.3 per<br />
cent in Q2 2004.<br />
The forestry sector grew at an estimated rate of 21.0 per cent<br />
in Q2 2004 year-on-year. Compared to Q1 2004, it registered a<br />
17.8 percent growth. The production of round timber increased<br />
by 32.3 per cent from 25.1 thousands cubic metres in<br />
Q2 2003 to 33.2 thousands cubic metres in Q2 2004 (Table 1.5).<br />
Compared to Q1 2004, it registered an increase of 5.4 per cent<br />
from 31.5 thousands cubic metres. The production of bakau<br />
poles also increased by 14.9 per cent from 28.2 thousand<br />
pieces in Q2 2003 to 32.4 thousand pieces in Q2 2004. Compared<br />
to Q1 2004, it increased by 26.6 per cent, from 25.6 thousand<br />
pieces during that quarter.<br />
Activities in the fishery sector are estimated to decline by 22.8<br />
per cent compared to the same period last year. Compared to<br />
Q1 2004, this sector also registered a decrease of 60.1 per cent.<br />
The largest downward effect was from the production of the<br />
capture industry. The production dropped by 24.8 per cent<br />
from 4,242.8 metric tonnes in Q2 2003 to 3,192.0 metric tonnes<br />
in Q2 2004 and on quarter on quarter basis the production<br />
dropped by 57.1 per cent from 7,440.6 metric tonnes in Q1<br />
2004 (Table 1.6).<br />
Chart 1.1: Growth of Gross Domestic Product Year-on-year<br />
Cattle (Tons) 0.4 3.1 0.3 (90.3) (25.0)<br />
Goats (Tons) 0.07 1.3 - - -<br />
Broiler Chicken (Tons) 4,166.2 4,242.0 3,967.0 (6.5) (4.8)<br />
Chicken Eggs (Millions) 26.1 27.7 28.4 8.8<br />
Fresh Milk (Litres) 22,939.0 24,519.0 16,900.0 (26.3)<br />
Source: Agricultural Department<br />
Table 1.5: Forestry Sector<br />
Q2 03 Q1 04 Q2 04 growth (%) growth (%)<br />
(Q-O-Q) (Y-O-Y)<br />
Round Timber ('000 Cubic Metres) 25.1 31.5 33.2 5.4 32.3<br />
Bakau Poles (Thousand Pieces) 28.2 25.6 32.4 26.6 14.9<br />
Source: Forestry Department<br />
%<br />
16<br />
14<br />
12<br />
10<br />
8<br />
6<br />
4<br />
2<br />
0<br />
-2<br />
-4<br />
-6<br />
Q1 03 Q2 03 Q3 03 Q4 03 Q1 04 Q2 04<br />
Total Oil Non-oil
BRUNEI ECONOMIC BULLETIN<br />
P AGE 3<br />
BRUNEI DARUSSALAM Q2 2004<br />
ECONOMIC REVIEW & OUTLOOK AND RECENT ECONOMIC DEVELOPMENTS<br />
Table 1.6: Fishery Sector<br />
Capture Industry (Metric Tonnes)<br />
Q2 03 Q1 04 Q2 04<br />
growth<br />
(%)<br />
(Q-O-Q)<br />
growth<br />
(%)<br />
(Y-O-Y)<br />
4,242.83 7,440.61 3,192.0 (57.10) (24.77)<br />
Commercial 1,016.96 662.99 875.15 32.0 (13.94)<br />
Small Scale Fishermen 3,225.87 6,777.62 2,316.83 (65.82) (28.18)<br />
Aquaculture Industry (Metric<br />
Tonnes)<br />
112.28 146.52 156.54 6.84 39.42<br />
Fish 17.45 19.71 21.01 6.60 20.40<br />
Prawn 70.90 97.53 106.59 9.29 50.34<br />
Fresh Water Fish 23.93 29.28 28.94 (1.16) 20.94<br />
Total Production 4,355.11 7,587.13 3,348.54 (55.87) (23.11)<br />
Source: Fishery Department<br />
Table 1.7: Mining/Quarrying/Manufacturing Sector<br />
Cement Production<br />
(Tonnes)<br />
Sawn Timber Production<br />
(Thousands cubic<br />
metre)<br />
Fish Processing Production<br />
(Tonnes)<br />
Charcoals Production<br />
(thousand Kg)<br />
Q2 03 Q1 04 Q2 04<br />
growth<br />
(%)<br />
(Q-O-Q)<br />
growth<br />
(%)<br />
(Y-O-Y)<br />
57,969.0 55,471.3 59,041.5 4.5 1.5<br />
13.3 11.0 15.0 36.4 12.8<br />
144.7 128.1 130.13 1.6 (10.1)<br />
6.3 4.4 6.7 52.3 6.3<br />
Cable Production (Kg) 158,662.0 165,388.2 202,682.9 22.5 27.7<br />
Roofing Production<br />
(Tonnes)<br />
Switchboard Production<br />
(Unit)<br />
Reverse-Osmosis Water<br />
Production (thousand<br />
litres)<br />
Source: Department of <strong>Economic</strong> Planning & Development<br />
%<br />
41<br />
39<br />
37<br />
35<br />
33<br />
31<br />
29<br />
27<br />
705.6 652.9 543.0 (16.8) (23.0)<br />
1,227.0 512.0 965.0 88.5 (21.4)<br />
112.0 115.0 117.0 1.7 4.5<br />
Chart 1.2: Hotel Occupancy Rate<br />
Q1 03 Q2 03 Q3 03 Q4 03 Q1 04 Q2 04<br />
Chart 1.3: Growth Rate of Communication Sector<br />
%<br />
20<br />
16<br />
12<br />
8<br />
4<br />
0<br />
Q1 03 Q2 03 Q3 03 Q4 03 Q1 04 Q2 04<br />
Chart 1.4: Seaborne Cargo Handled<br />
The mining, quarrying and manufacturing sector registered<br />
an estimated growth rate of 8.6 per cent in Q2 2004 compared<br />
to Q2 2003 due to the increase in production of cement, sawn<br />
timber, charcoals, reverse osmosis water, cable and bricks. On<br />
a quarter-on-quarter basis this sector grew by an estimated 4.1<br />
per cent compared to Q1 2004 (Table 1.7).<br />
The construction sector has shown improvement year-on-year<br />
and registered an estimated 5.7 per cent growth in Q2 2004. It<br />
is also estimated to expand by 7.4 per cent compared with the<br />
previous quarter.<br />
The wholesale and retail trade sector posted an estimated 8.5<br />
growth in Q2 2004 compared to Q2 2003. Compared with the<br />
previous quarter, this sector is estimated to have expanded by<br />
6.1 per cent. Survey on selected major wholesale companies<br />
registered a 4.6 per cent growth in the value of sales in Q2 2004<br />
year-on-year. On a quarter-on-quarter basis the value of sales<br />
also increased by 3.8 per cent. Meanwhile, survey on selected<br />
major retail companies registered a 14.4 per cent increased in<br />
the value of sales in Q2 2004 year-on-year. Likewise, on a<br />
quarter-on-quarter basis the value of retail sales rose by 8.4 per<br />
cent.<br />
The restaurants and hotels sector is estimated to contract by<br />
5.4 per cent in Q2 2004 compared to the same period last year.<br />
Compared with the previous quarter, it is estimated to have<br />
contracted by 1.5 per cent. The hotels occupancy rates have<br />
dropped by 7.7 per cent from 31.0 per cent in Q2 2003 to 28.6<br />
per cent in Q2 2004 (Chart 1.2). However, on a quarter-onquarter<br />
basis the rates have increased by 1.3 per cent compared<br />
to Q1 2004. Meanwhile, the value of sales from the selected<br />
major restaurants declined by 3.1 per cent compared to<br />
Q2 2003. On quarter-on-quarter basis the value of sales also<br />
dropped by 4.2 per cent.<br />
The transport and communication sector grew at an estimated<br />
17.1 per cent in Q2 2004 compared to a year ago. Compared<br />
with the previous quarter, this sector is estimated to have expanded<br />
by 5.4 per cent. The improved year-on-year growth<br />
was mainly attributed to better performance in the communication<br />
sector (Chart 1.3). The volume of cargo handled also<br />
increased by 33.1 per cent in Q2 2004 compared to a year ago<br />
(Chart 1.4).<br />
The banking and finance sector registered a contraction of 7.0<br />
per cent in Q2 2004 compared to Q2 2003. However, compared<br />
to Q1 2004 it grew by 3.8 per cent. Total interest income from<br />
loans and advances stood at BND 107.0 million in Q2 2004<br />
compared to BND 115.0 million and BND 114.8 million collected<br />
in Q2 2003 and Q1 2004 respectively (Chart 1.5).<br />
The insurance sector is estimated to register a contraction of<br />
0.4 per cent in Q2 2004 compared to the same period a year<br />
earlier. However, compared to Q1 2004, it expanded by 26.8<br />
per cent.<br />
Chart 1.5: Banks Loans and Advances<br />
13 0<br />
500,000<br />
12 5<br />
freight tonnes<br />
400,000<br />
300,000<br />
200,000<br />
100,000<br />
0<br />
Q1 03 Q2 03 Q3 03 Q4 03 Q1 04 Q2 04<br />
BNDmillion<br />
12 0<br />
115<br />
110<br />
10 5<br />
10 0<br />
Q1 03 Q2 03 Q3 03 Q4 03 Q1 04 Q2 04
P AGE 4<br />
BRUNEI ECONOMIC BULLETIN<br />
BRUNEI DARUSSALAM Q2 2004<br />
ECONOMIC REVIEW & OUTLOOK AND RECENT ECONOMIC DEVELOPMENTS<br />
Table 2.1 : Consumer Price Index Q2 2003, Q1 and Q2 2004<br />
I<br />
Commodity Group Weight Q2 03<br />
Source: Department of <strong>Economic</strong> Planning & Development<br />
Jan-<br />
June<br />
03<br />
Q1 04<br />
Q2<br />
04<br />
Jan-<br />
June<br />
04<br />
All 10,000 100.6 100.6 100.7 101.3 101.0<br />
Food & Non-Alcoholic<br />
Beverages<br />
2877 99.0 99.5 100.0 100.7 100.4<br />
II Clothing & Footwear 561 99.5 98.8 97.5 96.0 96.7<br />
III<br />
IV<br />
Housing, Water,<br />
Electricity & Maintenance<br />
Household Goods &<br />
Operations<br />
884 100.1 100.0 98.0 98.4 98.2<br />
860 100.4 100.1 95.7 95.0 95.4<br />
V Transport 2251 105.0 104.3 106.1 106.5 106.3<br />
VI Communication 548 95.5 96.1 94.2 93.3 93.8<br />
VII Education 471 99.4 99.8 99.9 99.9 99.8<br />
VIII Medical & Health 98 98.5 98.2 98.2 98.2 98.2<br />
IX<br />
X<br />
Recreation & Entertainment<br />
Miscellaneous Goods<br />
& Services<br />
814 100.0 100.1 103.5 108.3 105.9<br />
636 100.6 100.4 101.4 101.3 101.4<br />
Table 2.2: Consumer Price Index April-June 2004<br />
Commodity Group<br />
Weight<br />
2004<br />
April May June<br />
All 10,000 101.3 101.3<br />
I Food & Non-Alcoholic Beverages 2877 100.8 100.7 100.7<br />
II Clothing & Footwear 561 93.4 98.6 95.9<br />
III Housing, Water, Electricity & Maintenance 884 98.1 98.5 98.7<br />
IV Household Goods, Services & Operations 860 95.0 96.2 93.7<br />
V Transport 2251 106.8 106.2 106.6<br />
VI Communication 548 94.0 93.2 92.8<br />
VII Education 471 99.9 100.1 99.7<br />
VIII Medical & Health 98 98.1 98.3 98.3<br />
IX Recreation & Entertainment 814 109.5 106.9 108.4<br />
X Miscellaneous Goods & Services 636 100.6 101.7 101.6<br />
Chart 2.1: CPI Percentage Changes Between Q2 2004 and Q1 2004<br />
101.2<br />
Consumer Price Index<br />
The average Consumer Price Index (CPI) for the second quarter<br />
of 2004 was 101.3, an increase of 0.6 per cent from 100.7 in<br />
Q1 2004 (Table 2.1. The CPI for April, May and June 2003<br />
stood at 101.3, 101.3 and 101.2 respectively (Table 2.2). The<br />
CPI for January to June 2004 increased by 0.4 per cent compared<br />
to that of 100.6 in the same period last year. The average<br />
CPI for the second quarter 2004 compared to the same<br />
period last year recorded a marginal increase of 0.7 per cent<br />
from 100.6 to 101.3.<br />
CPI Changes for the Q2 2004 relative to Q1 of 2004<br />
The average CPI for Q2 2004 rose by 0.6 per cent compared<br />
to Q1 2004 due to the hike seen in Major Group indices of<br />
Recreation & Entertainment by 4.6 per cent; Food & Non-<br />
Alcoholic Beverages by 0.7 per cent; and Housing, Water,<br />
Electricity & Maintenance by 0.4 per cent.<br />
The Recreation & Entertainment index increased by 4.6 per<br />
cent due to higher price of Holiday Package Expenses which<br />
rose by 7.0 per cent.<br />
The increase in the price of Fresh Chicken by 13.2 per cent<br />
contributed to the increase in the Major Group Index of<br />
Food & Non-Alcoholic Beverages by 0.7 per cent.<br />
The Major Group Index of Transport rose by 0.4 per cent as a<br />
result of an increase in the Purchase of Vehicles Index by 2.4<br />
per cent.<br />
The Housing, Water, Electricity & Maintenance index rose to<br />
0.4 per cent due to the increase in Accommodation price by<br />
1.0 per cent.<br />
The largest downward effect on the CPI for this quarter<br />
came from Clothing and Footwear (Chart 2.1). This was due<br />
to the decline in the sub-group indices of Ready-Made<br />
Clothing Accessories by 1.2 per cent; Materials for<br />
Male/Female by 3.0 per cent; Wedding Dress, Accessories<br />
and Rental by 2.1 per cent; Tailoring Charges by 1.5 per cent;<br />
and Footwear by 1.2 per cent.<br />
Food & Non Alcoholic Beverages<br />
Clothing & Footwear<br />
Housing, Water, Electricity &<br />
M aint enance<br />
Household Goods, Services &<br />
Operat ions<br />
Transport<br />
Communicat ion<br />
Educat ion<br />
M edical & Health<br />
Recreation & Ent ertainment<br />
M iscellaneous Goods & Services<br />
0.7<br />
-1.5<br />
0.4<br />
-0.7<br />
0.4<br />
-0.9<br />
0<br />
0<br />
-0.1<br />
4.6<br />
-5 0 5<br />
CPI Changes for the Q2 of 2004 relative to the same<br />
period in 2003<br />
The average CPI for Q2 2004 increased by 0.7 per cent compared<br />
to 100.6 in the same period last year (Table 2.1). The<br />
Recreation & Entertainment Index advanced by 8.3 per cent<br />
which accounted for half of the increase in the overall CPI.<br />
The Major Group Indices of Food & Non-Alcoholic Beverages<br />
also increased by 1.7 per cent; Transport by 1.4 per cent;<br />
Education by 0.5 per cent; and Miscellaneous Goods and<br />
Services by 0.7 per cent respectively.<br />
The Recreation & Entertainment Index witnessed a sharp<br />
increase of 8.3 per cent when compared to the same period<br />
last year. This was mainly due to a 12.8 per cent rise in the<br />
price of Holiday Package Expenses which was a consequence<br />
of the increase in prices of Umrah Package which<br />
coincide with school holidays.<br />
The increase in prices of Beef (Cattle), Fresh and Frozen; and<br />
Fresh Chicken by 22.7 per cent and 17.8 per cent respectively
BRUNEI ECONOMIC BULLETIN<br />
P AGE 5<br />
BRUNEI DARUSSALAM Q2 2004<br />
ECONOMIC REVIEW & OUTLOOK AND RECENT ECONOMIC DEVELOPMENTS<br />
Chart 2.2: CPI Percentage Changes Between Q2 2004 and Q2<br />
2003<br />
Food & Non Alcoholic Beverages<br />
1.7<br />
Clothing & Footwear<br />
-3.5<br />
Housing, Water, Electricity &<br />
M aintenance<br />
Household Goods, Services &<br />
Operations<br />
Transport<br />
Communication<br />
Education<br />
Medical & Health<br />
Recreation & Entertainment<br />
Miscellaneous Goods & Services<br />
-5.4<br />
-1.7<br />
-2.3<br />
-0.3<br />
1.4<br />
0.5<br />
0.7<br />
8.3<br />
-10 0 10<br />
Chart 2.3: CPI Percentage Changes for the period of January-<br />
June 2004 relative to the same period in 2003<br />
Food & Non Alcoholic Beverages<br />
0.9<br />
Index<br />
Clothing & Footwear<br />
Housing, Water, Electricity &<br />
M aintenance<br />
Household Goods, Services &<br />
Operations<br />
Transport<br />
Communication<br />
Education<br />
M edical & Health<br />
Recreation & Entertainment<br />
M iscellaneous Goods & Services<br />
10 2 . 0<br />
10 1. 0<br />
10 0 . 0<br />
-4.7<br />
-2.1<br />
-1.8<br />
-2.4<br />
0.0<br />
0.0<br />
1.9<br />
1.0<br />
5.8<br />
-10.0 -5.0 0.0 5.0 10.0<br />
Consumer Pric e Index 2002=100<br />
(Jan-June 2004)<br />
100.1<br />
100.8<br />
101.2<br />
101.3<br />
101.3<br />
101.2<br />
accounted for the largest upward movement of the Major<br />
Group Index of Food & Non-Alcoholic Beverages.<br />
The Miscellaneous Goods and Services index rose by 0.7 per<br />
cent as a result of increases in sub-group indices of personal<br />
care by 0.4 per cent and Personal Effects and Other Personal<br />
Goods by 4.4 per cent.<br />
The largest downward influence was from the Household<br />
Goods and Operations Index (Chart 2.2). The index dropped<br />
by 5.4 per cent as a result of decreases in the prices of Furniture<br />
(11.9 per cent); Floor Covering (8.2 per cent); Household<br />
Furnishings (0.2 per cent); Audio, Video Equipments, Musical<br />
Instruments (4.5 per cent); Household Equipments and Electrical<br />
Appliances (7.1 per cent); Kitchen Appliances and Utensils<br />
(7.6 per cent); Crockery and Cutlery (6.8 per cent); Household<br />
Operation (0.7 per cent); and Other Household Services<br />
(0.4 per cent).<br />
CPI Changes for the period January-June 2004/2003<br />
The 0.4 per cent increase in the CPI was brought about by the<br />
increase observed in Major Group indices of Food and Non-<br />
Alcoholic Beverages by 0.9 per cent; Transport (1.9 per cent);<br />
Recreation and Entertainment (5.8 per cent); and Miscellaneous<br />
Goods and Services (1.0 per cent) (Chart 2.3).<br />
The 0.9 per cent increase in the index for Food and Non-<br />
Alcoholic Beverages was the result of increases in the subgroup<br />
indices of Meat and Meat Products (9.3 per cent); Dairy<br />
Products and Eggs (5.6 per cent); Cooking Oils and Fats (7.2 per<br />
cent); Vegetables (1.5 per cent); Sugar, Sugar Preserves and<br />
Confectionery (3.6 per cent); Coffee, Tea and Cocoa (0.6 per<br />
cent; and Food/Drink Away From Home (0.2 per cent).<br />
The Transportation index rose by 1.9 per cent reflecting an increase<br />
in the price of Private Road Transport by 1.9 per cent<br />
and Air Transport by 3.3 per cent.<br />
The Major Group Index of Recreation and Entertainment increased<br />
by 5.8 per cent due to the soaring prices of Holiday<br />
Package Expenses which rose by 9.8 per cent.<br />
The Miscellaneous Goods and Services index was up by 1.0 per<br />
cent due to the increases in sub-group indices of Personal Care;<br />
and Personal Effects and Other Personal Goods by 0.8 per cent<br />
and 5.4 per cent respectively.<br />
The largest downward effect was from the Major Group Index<br />
of Household Goods & Operation (Chart 2.3). The price dipped<br />
by 4.7 per cent as a result of decreases in the price of Furniture<br />
(10.2 per cent); Floor Covering (4.9 per cent); Audio, Video<br />
Equipments, Musical Instruments (4.4 per cent); Household<br />
Equipments and Electrical Appliances (7.0 per cent); Kitchen<br />
Appliances and Utensils (7.8 per cent); Crockery and Cutlery<br />
(6.5 per cent); and Household Operation (0.2 per cent).<br />
99.0<br />
98.0<br />
Jan Feb March Apr May June
P AGE 6<br />
BRUNEI ECONOMIC BULLETIN<br />
BRUNEI DARUSSALAM Q2 2004<br />
ECONOMIC REVIEW & OUTLOOK AND RECENT ECONOMIC DEVELOPMENTS<br />
Table 3.1:GOVERNMENT FINANCE (BND MILLION)<br />
Q1 2004 Q2 2004 Q2 2003<br />
Total Revenues 1,398.0 1,357.6 1,225.4<br />
Tax 824.7 726.9 640.7<br />
Non-tax 573.3 630.7 584.7<br />
Total Expenditure 1,429.5 900.8 986.0<br />
Current 1,202.5 768.5 781.0<br />
Capital 227.0 132.3 204.9<br />
Budget Surplus/ (Deficit) (31.5) 456.8 239.4<br />
Source: Treasury Department, Ministry of Finance<br />
Table 3.2: GOVERNMENT REVENUE & EXPENDITURE (BND MIL-<br />
LION)<br />
Q1 2004 Q2 2004 Q2 2003<br />
Total Revenue 1,398.0 1,357.6 1,225.4<br />
Tax revenue 824.7 726.9 640.7<br />
Taxes on net income and<br />
profits<br />
797.5 698.7 612.1<br />
Corporate taxes 796.5 698.0 611.0<br />
Oil & Gas production<br />
companies<br />
758.4 643.2 560.5<br />
Other companies 38.1 54.8 50.5<br />
Individuals (estate duty) 0.0 0.0 0.4<br />
Stamp 0.9 0.7 0.7<br />
Taxes on international trade 24.3 25.6 25.9<br />
Import duties 24.3 25.6 25.9<br />
Motor vehicles tax 14.1 14.2 14.2<br />
Tobacco 5.1 5.4 5.2<br />
Others 5.1 6.0 6.5<br />
Taxes on goods and services<br />
3.0 2.6 2.7<br />
Licences 3.0 2.6 2.7<br />
Financial companies 0.1 0.1 0.0<br />
Others 2.9 2.5 2.7<br />
Non-tax revenue 573.3 630.7 584.7<br />
Property income 497.8 570.4 513.3<br />
Oil sector 482.1 561.2 485.4<br />
Oil & Gas Royalties 160.0 121.9 106.3<br />
Dividend paid by oil<br />
companies<br />
322.1 439.3 379.1<br />
Other 15.7 9.2 27.9<br />
Other royalties 0.3 0.4 0.4<br />
Rent and interest 3.9 3.0 5.1<br />
Others 11.5 5.8 22.4<br />
Administrative fees and<br />
charges on sales of goods<br />
and fines 74.8 59.6 70.7<br />
Telecom & utilities 54.9 40.6 50.5<br />
Other 19.9 19.0 20.2<br />
Other non-tax revenue 0.7 0.8 0.7<br />
Total Expenditure 1,429.5 900.8 986.0<br />
Current 1,202.5 768.5 781.0<br />
Wages & Salaries 422.8 336.2 316.1<br />
OCAR 465.6 284.3 286.8<br />
Charged 314.1 148.0 178.1<br />
Capital 227.0 132.3 204.9<br />
OCSE 156.6 52.1 104.1<br />
Development Expenditure 70.4 80.2* 82.9<br />
Investment in Public Enterprise<br />
NA NA 18.0<br />
Budget Surplus/ Deficit (31.5) 456.8 239.3<br />
Source: Treasury Department, Ministry of Finance (includes latest entries<br />
for the Quarter) * Provisional<br />
NA - Not Available<br />
Fiscal Sector<br />
Fiscal Position<br />
In Q2 2004, the Government revenue of BND 1,357.6 million<br />
exceeded its expenditure of BND 900.8 million, which resulted<br />
in a budget surplus of BND 456.8 million compared<br />
to BND 239.4 million during the same quarter last year<br />
(Table 3.1). The budget surplus in Q2 2004 was primarily<br />
due to the decrease in government expenditure, when compared<br />
to the government finance in Q1 2004.<br />
Government Revenue<br />
The total revenue fell by 2.9 percent from BND 1,398.0 million<br />
in Q1 2004 to BND 1,357.6 million in Q2 2004. However,<br />
it was BND 132.3 million (10.8 percent) higher compared to<br />
BND 1,225.3 million collected in Q2 2003.<br />
As shown in Table 3.2, in Q2 2004, 53.5 percent of the total<br />
revenue collected was in the form of tax revenue and only<br />
46.5 percent was from non-tax sources. The former comprises<br />
of taxes on net income and profits, taxes on international<br />
trade, and taxes on goods and services, which decreased<br />
from BND 824.7 million in Q1 2004 to BND 726.9<br />
million in Q2 2004. The decrease was mainly due to the drop<br />
in oil and gas corporate taxes, from BND 758.4 million in Q1<br />
2004 to BND 643.2 million in Q2 2004. The increase in corporate<br />
taxes by 43.8 percent from other companies was not<br />
enough to compensate for the decrease in the oil and gas<br />
corporate taxes. Nevertheless, the tax collected in Q2 2004<br />
was BND 86.2 million higher than the amount collected in<br />
the same quarter last year.<br />
The non-tax revenue, which consists of property income,<br />
administrative fees and charges on sales of goods and fines<br />
including telecommunication and utilities, and others, recorded<br />
an increase of BND 57.4 million from BND 573.3<br />
million in Q1 2004 to BND 630.7 million in Q2 2004. The Q2<br />
2004 figure was also an increase of 7.9 per cent (BND 46.0<br />
million) compared to that in Q2 2003. The increase was<br />
mainly due to the increase in the dividends paid by the oil<br />
and gas companies, as shown in Table 3.2. This figure increased<br />
by 36.4 percent from BND 322.1 million in Q1 2004<br />
to BND 439.3 million in Q2 2004; and by 15.9 percent compared<br />
to that of Q2 2003.<br />
Government Expenditure<br />
The government expenditure, which comprises current and<br />
capital expenditures (CAPEX), decreased by 37.0 percent<br />
from BND 1,429.5 million in Q1 2004 to BND 900.8 million<br />
in Q2 2004 (Table 3.2). This was due to the decline in both<br />
current and capital expenditures over the period from BND<br />
1,202.5 million and BND 227.0 million in Q1 2004 to BND<br />
768.5 million and BND 132.3 million in Q2 2004 respectively.<br />
Of the total current expenditure during this quarter, 43.7<br />
percent was for personnel emoluments (Wages & Salaries).<br />
CAPEX, which includes Other Charges Special Expenditure<br />
(OCSE) and Development Expenditure (DE), decreased by<br />
41.7 percent compared to that recorded in Q1 2004. Compared<br />
to Q2 2003, CAPEX recorded a decrease of BND 72.6<br />
million (-35.4 percent) from BND 204.9 million. However,<br />
the DE increased by 13.9 percent from BND 70.4 million in<br />
Q1 2004 to BND 80.2 million in Q2 2004, but dropped<br />
slightly by 3.3 percent from the same quarter last year. The
BRUNEI ECONOMIC BULLETIN<br />
P AGE 7<br />
BRUNEI DARUSSALAM Q2 2004<br />
ECONOMIC REVIEW & OUTLOOK AND RECENT ECONOMIC DEVELOPMENTS<br />
12000<br />
Chart 4.1 Money Supply<br />
OCSE recorded a decrease of 66.7 percent from BND 156.6<br />
million in Q1 2004 to BND 52.1 million in Q2 2004. Compared<br />
to Q2 last year, OCSE also fell by half, from BND 104.1 million.<br />
10000<br />
BND million<br />
8000<br />
6000<br />
4000<br />
2000<br />
0<br />
2003 2004<br />
June July Aug Sep Oct Nov Dec Jan Feb M ar Apr M ay June<br />
Month<br />
CIC M1 Qm M2<br />
Monetary Sector<br />
Money Supply<br />
As shown in Chart 4.1, the domestic narrow money (M1)<br />
expansions increased by 1.8 percent, from BND2,481.3 million<br />
in March 2004 to BND2,525.2 million in June 2004. This<br />
expansion was affected by an increase in M1 components<br />
where currency in circulation increased by 0.9 percent from<br />
BND656.2 million to BND662.0 million and demand deposits<br />
increased by 2.1 percent from BND1,825.1 million to<br />
BND1,863.2 million. Within the same period, broad money<br />
(M2) increased marginally by 2.6 percent from BND10,856.7<br />
million to BND11,135.4 million due to the increase in quasi<br />
money. Fixed deposit increased by 3.3 percent from<br />
BND5,639.4 million in March 2004 to BND5,827.1 million in<br />
June 2004 and savings and others (current deposits and call<br />
money) increased by 1.7 percent from BND2,736 million in<br />
March 2004 to BND2,783.1 million in June 2004. On a yearon-year<br />
basis, broad money increased by only 9.7 percent<br />
from BND10,150.2 million in June 2003 to BND11,135.4 million<br />
in June 2004.<br />
Assets and Liabilities<br />
TABLE 4.1 – Assets and Liabilities<br />
Assets and Liabilities in the banking system are shown in<br />
Table 4.1. The commercial banks’ total assets and liabilities<br />
increased by 6.6 percent from BND13,690 million in March<br />
2004 to BND14,594 million in June 2004. This was due to an<br />
increase in domestic and foreign deposits with banks and<br />
other assets. Domestic and foreign deposits increased by 12.3<br />
percent from BND6,272 million in March 2004 to BND7,045<br />
million in June 2004. Similarly, loans and advances increased<br />
by 0.8 percent, from BND5,392 million to BND5,437 million<br />
and other assets also increased by 8.8 percent from BND909<br />
million to BND989 million. Liabilities in the banking system<br />
also increased where deposits rose by 2.7 percent from<br />
BND10,201 million to BND10,473 million. This was due to<br />
increases in demand deposits by 2 percent from BND1,825<br />
million to BND1,863 million, time deposits by 3.3 percent<br />
Assets / Liabilities 2003 2004<br />
June July Aug Sep Oct Nov Dec Jan Feb Mar Apr May Jun<br />
Assets 12,925 12,218 12,081 12,900 12,683 12,798 13,495 13146 13117 13,690 13,514 13,391 14,594<br />
Cash 169 163 165 138 174 208 245 176 171 175 145 154 146<br />
Due from bank : 5,907 5,225 4,979 5,737 5,508 5,557 6,204 5,738 5,715 6,272 6,110 5,920 7,045<br />
in BD 1,100 784 614.3 912 862 795 1023 1,048 1082 1,151 1,105 1,048 1,488<br />
outside BD 4,807 4,441 4364.5 4,825 4646 4,762 5181 4,690 4633 5,121 5,005 4,872 5,557<br />
Loans and Advances 5,259 5,269 5304 5,346 5351 5,392 5387 5,398 5383 5,392 5,373 5,385 5,437<br />
Investment 721 689 744 775 744 726 715 873 925 942 961 985 977<br />
Other assets 869 872 889 904 906 915 944 961 923 909 925 947 989<br />
Liabilities 12,925 12,218 12,081 12,900 12,683 12,798 13,495 13146 13117 13,690 13,515 13,390 14,593<br />
Deposits 9,504 9,255 9,313 9,768 9,659 9,825 10,205 9914 9861 10,201 10,075 9,973 10,473<br />
Demand 1,971 1,853 1837 1,986 1899 2,038 2149 1967 1932 1,825 1,686 1,739 1,863<br />
Time 4,998 4,902 4980 5,280 5214 5,218 5457 5257 5207 5,640 5,629 5,445 5,827<br />
Saving 2,535 2,500 2496 2,502 2546 2,569 2599 2690 2722 2,736 2,760 2,789 2,783<br />
Due to bank 1,541 1,077 877 1,240 1,111 1,023 1,394 1308 1319 1,538 1,445 1,400 2,060<br />
in BD 1,308 970 771 1,130 1016 931 1222 1182 1221 1,444 1,354 1,306 1,937<br />
outside BD 233 107 106 110 95 92 172 126 98 94 91 94 123<br />
Other liabilities 1,880 1887 1891 1892 1913 1950 1896 1924 1937 1,951 1,995 2,017 2,060<br />
Source: Financial Institution Division, Ministry of Finance
P AGE 8<br />
BRUNEI ECONOMIC BULLETIN<br />
BRUNEI DARUSSALAM Q2 2004<br />
ECONOMIC REVIEW & OUTLOOK AND RECENT ECONOMIC DEVELOPMENTS<br />
TABLE 4.2 – Direction of Lending<br />
2003<br />
2004<br />
Mar Jun Sep Dec Mar Jun<br />
Total 4347 4386 4486 5386 5391 5438<br />
Agriculture 34 35 33 33 41 33<br />
Credit & Finance 15 17 22 23 21 27<br />
Manufacturing 89 91 96 90 90 91<br />
Transportation 186 197 213 201 193 203<br />
Construction 467 457 471 460 450 484<br />
General Commerce 497 478 497 481 465 476<br />
Professional Services 107 115 94 100 94 43<br />
Personal Loans 2479 2528 2591 3517 3567 3621<br />
Mortgage 473 468 469 481 470 460<br />
Source: Financial Institution Division, Ministry of Finance<br />
Chart 4.2 Non-Performing Loans<br />
800<br />
700<br />
600<br />
500<br />
2003 2004<br />
400<br />
300<br />
200<br />
100<br />
0<br />
Jun Jul Aug Sep Oct Nov Dec Jan Feb M ar Apr M ay Jun<br />
Month<br />
60-90 days 91-120 days >120 days Tot al<br />
Source: Financial Institution Division, Ministry of Finance<br />
BND Million<br />
from BND5,640 million to BND5,827 million and savings by 1.7<br />
percent from BND2,736 million to BND2,783 million during the<br />
same period.<br />
Other liabilities increased by 5.6 percent from BND1,951 million<br />
to BND2,060 million. On a year on year basis, the banking assets<br />
and liabilities rose by 12.9 percent from BND12,925 million in<br />
June 2003 to BND14,594 million in June 2004.<br />
Lending<br />
Lending aggregates, as shown in Table 4.2, rose by only 0.9<br />
percent from BND5,391 million in March 2004 to BND5,438<br />
million in June 2004. The main contributor to the increase was<br />
Personal Loan which comprised 66.6 percent (BND 3,621) of the<br />
total loans recorded in June 2004. Loans to Construction, General<br />
Commerce and Mortgage contributed 8.9 percent (BND484<br />
million), 8.6 percent (BND476 million), and 8.46 percent<br />
(BND460 million), respectively. Lower contributions from Agriculture<br />
(0.6 percent), Credit and Finance (0.5 percent), Manufacturing<br />
(1.67 percent), Professional Services (0.8 percent) and<br />
Transportation (3.7 percent) were also recorded<br />
As also observed in the first quarter, loan aggregates was still<br />
dominated by Personal Loans. In comparison, the share of loans<br />
to productive sectors such as Agriculture and Manufacturing to<br />
total loans was still minimal, when combined, represented only<br />
2.3 percent of total.<br />
Compared to lending direction in the first quarter’s, loans to<br />
several economic sectors were down by almost 25 percent on<br />
average. Loans to Agriculture dropped by 19.5 percent from<br />
BND41 million to BND33 million. Similarly loans to Mortgage<br />
decreased by 2.1 percent from BND470 million to BND460 million<br />
while loans to Professional Services decreased by 54.3 percent<br />
from BND94 million to BND43 million. However, loans to<br />
other sectors have recorded increases. Substantial increase was<br />
observed for loans to Credit and Finance which increased by<br />
28.6 percent from BND21 million to BND27 million. Loans to<br />
Construction increased by 7.6 percent from BND450 million to<br />
BND484 million while loans to General Commerce rose by 2.4<br />
percent from BND465 million to BND476 million. Loans to<br />
Manufacturing increased marginally by 1.1 percent from<br />
BND90 million to BND91 million while Personal Loans rose by<br />
1.5 percent from BND3,567 million to BND3,621 million. Loans<br />
to Transportation grew by 5.2 percent from BND193 million to<br />
BND203 million.<br />
Non-Performing Loans<br />
Non-performing loans (NPLs) declined further owing to the<br />
favourable economic conditions (the growth in non-oil GDP by<br />
3.9 per cent). Preliminary information in Chart 4.2, showed that<br />
NPLs based on 6-month classification moderated to BND7.63<br />
million in June 2004, down from BND14.88 million in March<br />
2004. NPLs based on 3-month classification fell to BND25.90<br />
million, down from BND29.09 million. Improvements in the<br />
level of NPLs were also due to lower incidence of new NPLs<br />
and write-offs of bad loans coupled with strong recoveries and<br />
reclassification of NPLs to performing loans.<br />
Non-performing loans aggregates decreased by 1.0 percent<br />
from BND651.74 million in March 2004 to BND645.52 million in<br />
June 2004. On a year-on-year basis, NPLs decreased by 7.5 percent<br />
from BND698.18 million in June 2003. The ratio of the NPL
BRUNEI ECONOMIC BULLETIN<br />
P AGE 9<br />
BRUNEI DARUSSALAM Q2 2004<br />
ECONOMIC REVIEW & OUTLOOK AND RECENT ECONOMIC DEVELOPMENTS<br />
%<br />
Chart 4.3 – Deposit Rates in<br />
<strong>Brunei</strong> Darussalam Banking System<br />
0.4<br />
0.35<br />
0.3<br />
0.25<br />
0.2<br />
0.15<br />
0.1<br />
0.05<br />
0<br />
Jun Aug Oct Dec Feb Apr Jun<br />
to loans aggregates decreased by 0.3 percentage points from 12.1 percent<br />
in March 2004 to 11.8 percent in June 2004 and decreased on a<br />
year-on-year basis by 4.1 percentage points from 15.9 percent in June<br />
2003 to 11.8 percent in June 2004. Although the decrease in the NPL<br />
was a positive sign to the banking system, the NPL was still a cause of<br />
concern and there was a need for greater domestic economic improvement<br />
and other financial tools to address the situation.<br />
On a positive note, the financial strength of the domestic banking system<br />
as a whole is still adequate to provide liquidity to finance real output<br />
expansions.<br />
Interest and Exchange Rates<br />
3 6 9 12<br />
Source: Hongkong and Shanghai Banking Corporation<br />
CHART 5.1: BRUNEI DARUSSALAM EXPORT, IMPORT<br />
& BALANCE OF TRADE, APRIL-MAY 2003 & APRIL-<br />
MAY 2004<br />
BND Million<br />
1,000<br />
800<br />
600<br />
400<br />
200<br />
-<br />
April 2003 April 2004 May 2003 May 2004<br />
Total Exports 584.0 655.4 617.5 619.0<br />
Total Imports 217.2 188.7 198.2 196.6<br />
Total Trade 801.2 844.1 815.6 815.5<br />
Balance of Trade 366.8 466.7 419.3 422.4<br />
CHART 5.2: BRUNEI DARUSSALAM EXPORT, IMPORT<br />
& BALANCE OF TRADE, JANUARY-MAY 2004<br />
BND Million<br />
150 0<br />
10 0 0<br />
500<br />
0<br />
Total Exports 689.4 627.4 714.4 655.4 619.0<br />
Total Imports 205.6 335.8 194.0 188.7 196.6<br />
Total Trade 895.1 963.2 908.4 844.1 815.5<br />
Balance of<br />
Trade<br />
Jan<br />
2004<br />
Feb<br />
2004<br />
Mar<br />
2004<br />
Apr<br />
2004<br />
May<br />
2004<br />
483.8 291.6 520.4 466.7 422.4<br />
The interest rates in the <strong>Brunei</strong> Darussalam banking system had declined<br />
continuously over the past five years through the end of 2003,<br />
apparently squeezed by a combination of regulatory and market pressure.<br />
Surprisingly the prime lending rates remained unchanged at 5.5<br />
percent per annum since September 2000. Deposits rates (Chart 4.3)<br />
were also unchanged as in last quarter of 2003 at 0.225 percent, 0.25<br />
percent and 0.3375 percent for the 3, 6 and 12-month deposits respectively.<br />
Savings deposit rates varied according to the amounts deposited.<br />
There is no interest for deposits of less than BND 499.99. The interest<br />
rates of 0.05 percent is specified for deposits of between BND500<br />
and BND99,999.99 and 0.1 percent for deposits of BND100,000.00 and<br />
above.<br />
Singapore’s lending rates of 5.3 percent also remained constant since<br />
the last quarter of 2003. The 3, 6 and 12-month deposits were still unchanged<br />
at 0.41 percent, 0.52 percent and 0.71 percent respectively.<br />
Similarly, the highest negotiated Singapore’s savings deposit rates of<br />
0.23 percent remained unchanged. Generally, the rates offered by<br />
banks in Singapore were more attractive for various investments than<br />
those offered by the domestic banking system.<br />
From January 2004 to June 2004, the <strong>Brunei</strong> Dollar depreciated against<br />
the US dollar from 1.6987 to 1.7120 on average and from 1.7020 to<br />
1.7243 at end of period. Based on past trend, the US dollar is expected<br />
to weaken and forecasted to prevail at 1.58 against the <strong>Brunei</strong> Dollar at<br />
the end of the year.<br />
Conclusion<br />
The growth momentum of the monetary sector as a whole were dependent<br />
on the progress in the domestic economic developments and<br />
activities and the indirect impact of the exchange rate volatility affecting<br />
demand and supply of domestic trades.<br />
External Sector<br />
Total and Balance of Trade<br />
In April 2004, the total trade was BND 844.1 million which was an increase<br />
of 5.4 per cent from BND 801.2 million in April 2003. However<br />
in May 2004, there was a slight reduction in total trade by 0.02 per cent<br />
from BND 815.6 million in May 2003 to BND 815.5 million. Similarly,<br />
total trade decreased by 3.4 per cent between April and May 2004.<br />
A trade surplus of BND 466.7 million was recorded in April 2004<br />
which was 27.2 per cent higher than April 2003 figure of BND 366.8<br />
million. In May 2004, a trade surplus was also recorded which was 0.7<br />
per cent higher from BND 419.3 million in May 2003 to BND 422.4 million.<br />
However, there was reductions in trade surplus by 9.5 per cent<br />
between April and May 2004 (Chart 5.1).<br />
Both the total trade and trade surplus showed downward trend for the<br />
period between January to May 2004 (Chart 5.2).
P AGE 10<br />
BRUNEI ECONOMIC BULLETIN<br />
BRUNEI DARUSSALAM Q2 2004<br />
ECONOMIC REVIEW & OUTLOOK AND RECENT ECONOMIC DEVELOPMENTS<br />
CHART 5.3: EXPORTS BY MAJOR COMMODITY, JAN-MAY 2004<br />
April<br />
2003<br />
BND Million<br />
April<br />
2004<br />
May<br />
2003<br />
May<br />
2004<br />
Apr '03 &<br />
Apr '04<br />
% Change<br />
May '03<br />
& May<br />
'04<br />
Apr '04 &<br />
May '04<br />
Oil and Gas 545.0 591.2 548.8 575.3 8.5 4.8 (2.7)<br />
Petroleum 301.3 336.3 308.2 387.2 11.6 25.6 15.1<br />
LNG 243.6 254.9 240.6 188.1 4.6 (21.8) (26.2)<br />
Non-Oil &<br />
Gas<br />
39.0 64.2 68.7 43.7 64.4 (36.4) (32.0)<br />
Garment 20.8 27.4 39.7 23.4 31.8 (41.2) (14.8)<br />
Machinery<br />
& Transport<br />
Equipment<br />
11.4 29.1 16.2 13.9 154.3 (14.1) (52.2)<br />
Others 6.8 7.7 12.8 6.4 13.0 (49.9) (16.5)<br />
Total Exports<br />
BND Million<br />
900<br />
800<br />
700<br />
600<br />
500<br />
400<br />
Jan '04 Feb '04 Mar '04 Apr '04 May '04<br />
Total Exports 689.4 627.4 714.4 655.4 619.0<br />
Oil and Gas 624.6 544.6 659.0 591.2 575.3<br />
Non-Oil & Gas 64.8 82.8 55.4 64.2 43.7<br />
TABLE 5.1: EXPORTS BY MAJOR COMMODITY, APRIL-MAY 2003<br />
AND APRIL-MAY 2004<br />
584.0 655.4 617.5 619.0 12.2 0.2 (5.6)<br />
90<br />
80<br />
70<br />
60<br />
50<br />
40<br />
30<br />
BND Million<br />
Exports<br />
The total exports in April 2004 increased by 12.2 per cent from<br />
BND 584.0 million in April 2003 to BND 655.4 million. In May<br />
2004, total exports were BND 619.0 million which was an increase<br />
of 0.2 per cent from BND 617.5 million in May 2003.<br />
However there were reduction in total exports by 5.6 per cent<br />
between April and May 2004. Exports in April and May 2004<br />
were still dominated by oil and gas which contributed 90.2 per<br />
cent and 92.9 per cent of total exports respectively.<br />
With respect to the trend of total exports for the period between<br />
January and May 2004, it showed some correlation with<br />
the Oil and Gas exports since Oil and Gas were the major exports<br />
for <strong>Brunei</strong> Darussalam (Chart 5.3).<br />
Oil and Gas exports in April 2004 were BND 591.2 million<br />
which was an increase of 8.5 per cent from BND 545.0 million<br />
in April 2003. Oil and Gas exports in May 2004 also increased<br />
by 4.8 per cent from BND 548.8 million in May 2003 to BND<br />
575.3 million. However Oil and Gas exports decreased by 5.6<br />
per cent in May 2004 on a month-month basis.<br />
Petroleum exports (crude and condensate) in May 2004 was<br />
BND 387.2 million which was 25.6 per cent higher compared<br />
to May 2003. The increase was due to higher oil price which<br />
recorded average oil price per barrel of US$39.40 in May 2004<br />
compared to US$27.18 in May 2003. Similarly, the petroleum<br />
exports increased by 11.6 per cent in April 2004 from the same<br />
month of 2003 as a result of higher oil price which recorded<br />
average oil price per barrel of US$37.23 in April 2004 compared<br />
to US$27.69 in April 2003. On month on month basis,<br />
petroleum exports increased by 15.1 per cent in May 2004.<br />
The LNG exports in April 2004 was BND 254.9 million. This<br />
was an increase of 4.6 per cent compared to BND 243.6 million<br />
in April 2003. In contrast to April 2004, the LNG exports decreased<br />
by 21.8 per cent from BND 240.6 million in May 2003<br />
to BND 188.1 million in May 2004. Similarly, the LNG exports<br />
decreased by 26.2 per cent between April and May 2004. The<br />
decrease was due to lower LNG production for exports which<br />
recorded only 908,235.81 MMBtu/day in May 2004 compared<br />
to 1,036,790.0 MMBtu/day in May 2003. The average LNG<br />
price for April and May 2004 were US$4.68 per MMBtu and<br />
US$4.74 per MMBtu respectively.<br />
The Non-Oil and Gas exports in April 2004 were BND 64.2<br />
million. This was indeed an increase of 64.4 per cent from<br />
BND 39.0 million in April 2003. The increase was mainly due<br />
to higher exports of Machinery & Transport Equipment in<br />
April 2004 of BND 29.1 million which was an increase of 154.3<br />
per cent from BND 11.4 million in April 2003.<br />
In May 2004, Non-Oil and Gas exports decreased by 36.4 per<br />
cent from BND 68.7 million in May 2003 to BND 43.7 million.<br />
This was mainly due to lower exports of Garment in May 2004<br />
of BND 23.4 million which was a decrease of 41.2 per cent<br />
from BND 39.7 million in May 2003.<br />
Similarly, Non-Oil and Gas exports decreased by 32.0 per cent<br />
in May 2004 on a month-month basis. The decrease was<br />
mainly due to lower exports of Machinery & Transport Equipment<br />
by 52.2 per cent in May 2004 (Table 5.1).
BRUNEI ECONOMIC BULLETIN<br />
BRUNEI DARUSSALAM Q2 2004<br />
ECONOMIC REVIEW & OUTLOOK AND RECENT ECONOMIC DEVELOPMENTS<br />
P AGE 11<br />
AUSTRALIA<br />
12 .7%<br />
CHINA<br />
KOREA<br />
9.7%<br />
OTHERS<br />
26.9%<br />
8.3%<br />
AUSTRALIA<br />
6.0%<br />
CHART 5.4: EXPORT MARKET IN APRIL 2004<br />
CHINA<br />
0.0%<br />
OTHERS<br />
10 .8 %<br />
JAPAN<br />
44.4%<br />
CHART 5.5: EXPORT MARKET IN MAY 2004<br />
KOREA<br />
13.9%<br />
ASEAN<br />
9.9%<br />
ASEAN<br />
22.4%<br />
JAPAN<br />
35.0%<br />
TABLE 5.2: EXPORT MARKET FOR APRIL-MAY 2003 AND APRIL-MAY 2004<br />
April<br />
2003<br />
BND Million<br />
April<br />
2004<br />
May<br />
2003<br />
May<br />
2004<br />
Apr '03<br />
& Apr<br />
'04<br />
% Change<br />
May '03<br />
& May<br />
'04<br />
Apr '04 &<br />
May '04<br />
ASEAN 151.5 147.0 157.5 61.6 (3.0) (60.9) (58.1)<br />
JAPAN 238.9 290.9 267.2 216.4 21.8 (19.0) (25.6)<br />
KOREA 48.4 63.3 45.9 86.1 30.6 87.4 36.0<br />
AUSTRA-<br />
LIA<br />
52.1 83.2 50.8 36.9 59.7 (27.4) (55.6)<br />
CHINA 29.4 0.2 30.2 51.5 (99.4) 70.6 27,356.7<br />
OTHERS 63.8 70.9 65.8 166.6 11.2 153.1 135.0<br />
TOTAL<br />
EXPORTS<br />
584.0 655.4 617.5 619.0 12.2 0.2 (5.6)<br />
TABLE 5.3: IMPORTS BY COMMODITY, APRIL-MAY 2003 AND APRIL-MAY<br />
2004<br />
BND Million<br />
% Change<br />
April<br />
'03<br />
April<br />
'04<br />
May<br />
'03<br />
May<br />
'04<br />
Apr<br />
'03 &<br />
Apr<br />
'04<br />
May<br />
'03 &<br />
May<br />
'04<br />
Apr<br />
'04 &<br />
May<br />
'04<br />
Food & live animals 30.1 23.4 23.6 31.7 (22.4) 34.3 35.5<br />
Beverages & tobacco 4.0 6.0 3.6 4.3 49.9 19.1 (28.3)<br />
Crude material inedible<br />
5.5 2.0 1.8 1.4 (63.5) (20.4) (29.2)<br />
Mineral fuels 1.7 1.3 1.6 1.6 (23.5) (0.5) 17.8<br />
Animal & vegetable<br />
oils and fats<br />
1.3 1.3 1.4 1.3 (3.4) (8.6) 1.0<br />
Chemicals 14.9 16.5 16.8 16.7 10.2 (0.8) 1.2<br />
Manufactured goods 64.7 55.7 61.1 49.9 (14.0) (18.4) (10.4)<br />
Machinery & transport<br />
equipments<br />
70.5 61.2 68.2 68.5 (13.2) 0.4 12.0<br />
Miscellaneous manufactured<br />
articles<br />
23.7 20.5 19.0 20.7 (13.5) 8.7 1.1<br />
Miscellaneous transactions<br />
and commodities,<br />
n.e.cmanufactured<br />
articles<br />
0.7 0.8 1.0 0.5 24.6 (48.5) (41.8)<br />
Total imports (c.i.f) 217.2 188.7 198.2 196.6 (13.1) (0.8) 4.2<br />
With respect to the destination of exports, in April 2004, 44.4<br />
per cent of the total exports were to Japan, followed by<br />
ASEAN countries (22.4 per cent), Australia (12.7 per cent) and<br />
Korea (9.7 per cent) (Chart 5.4). Compared to April 2003,<br />
<strong>Brunei</strong>’s exports to Australia, Korea and Japan in April 2004<br />
increased by 59.7 per cent, 30.6 per cent and 21.8 per cent respectively.<br />
Exports to China and ASEAN countries declined by<br />
99.4 per cent and 3.0 per cent respectively. The huge decrease<br />
of <strong>Brunei</strong> Darussalam’s exports to China was due to no Petroleum<br />
exports in April 2004.<br />
In May 2004, Japan remained the dominant exports market<br />
which accounted for 35.0 per cent of total exports, followed by<br />
Korea (13.9 per cent), ASEAN countries (9.9 per cent), China<br />
(8.3 per cent) and Australia (6.0 per cent) (Chart 5.5). Compared<br />
to May 2003, <strong>Brunei</strong>’s exports to Korea and China in<br />
May 2004 increased by 87.4 per cent and 70.6 per cent respectively.<br />
Exports to ASEAN countries, Australia and Japan declined<br />
by 60.9 per cent, 27.4 per cent and 19.0 per cent respectively.<br />
In comparison to April 2004, <strong>Brunei</strong> Darussalam’s exports in<br />
May 2004 to Korea increased by 36.0 per cent from BND 63.3<br />
million to BND 86.1 million. There was also a significant increase<br />
in exports to China from BND 187,492 in April 2004 to<br />
BND 51,479,048 in May 2004 due to exports of mineral fuels<br />
recorded at BND 51,476,041 in May 2004. However, there were<br />
reductions in exports to ASEAN Countries, Australia and Japan<br />
by 58.1 per cent, 55.6 per cent and 25.6 per cent respectively<br />
(Table 5.2).<br />
Imports<br />
In April 2004, total imports were BND 188.7 million, which<br />
was a decrease of 13.1 per cent compared to April 2003 imports<br />
of BND 217.2 million. The decrease in imports was due<br />
to the decline in the imports of Crude Material Inedible by 63.5<br />
per cent, Mineral Fuels (23.5 per cent), Food & Live Animals<br />
(22.4 per cent), Manufactured Goods (14.0 per cent), Miscellaneous<br />
Manufactures Articles (13.5 per cent), Machinery &<br />
Transport Equipment (13.2 per cent) and Animal & Vegetable<br />
Oils and Fats (3.4 per cent). Such decreases were moderated by<br />
the increases in Beverages & Tobacco by 49.9 per cent, Miscellaneous<br />
Transactions and Commodities (24.6 per cent) and<br />
Chemicals (10.2 per cent).<br />
In May 2004, total imports decreased slightly by 0.8 per cent<br />
from BND 198.2 million in May 2003 to BND 196.6 million due<br />
to the reduction in the imports of Miscellaneous Transactions<br />
and Commodities by 48.5 per cent, Crude Material Inedible<br />
(20.4 per cent), Manufactured Goods (18.4 per cent), Animal &<br />
Vegetables Oils & Fats (8.6 per cent), Chemicals (0.8 per cent)<br />
and Mineral Fuels (0.5 per cent). The increases in Food & Live<br />
Animals by 34.3 per cent, Beverages & Tobacco (19.1 per cent),<br />
Miscellaneous Manufactured Articles (8.7 per cent) and Machinery<br />
& Transport Equipment (0.4 per cent) were insufficient<br />
to offset the total reduction in imports.<br />
On the contrary, total imports increased by 4.2 per cent in May<br />
2004 on a month-on-month basis due mainly to high imports<br />
of Food & Live Animals by 35.5 per cent and also imports of<br />
Machinery & Transport Equipment by 12.0 per cent in May<br />
2004 (Table 5.3).
P AGE 12<br />
BRUNEI DARUSSALAM Q2 2004<br />
ECONOMIC REVIEW & OUTLOOK AND RECENT ECONOMIC DEVELOPMENTS<br />
BRUNEI ECONOMIC BULLETIN<br />
CHART 5.6: TOTAL IMPORTS, JANUARY-MAY 2004<br />
350<br />
BND Million<br />
CHART 5.7: MAJOR COMMODITY IMPORTS IN<br />
APRIL 2004<br />
M iscellaneous<br />
manufactured<br />
articles<br />
10.9%<br />
Machinery &<br />
transport<br />
equipments<br />
32.4%<br />
Others<br />
6.1%<br />
Food & live<br />
animals<br />
12.4%<br />
Chemicals<br />
8.7%<br />
M anufactured<br />
goods<br />
29.5%<br />
CHART 5.8: MAJOR COMMODITY IMPORTS IN MAY<br />
2004<br />
M iscellaneous<br />
manufactured<br />
articles<br />
10.5%<br />
Machinery &<br />
transport<br />
equipments<br />
34.9%<br />
10 0 %<br />
80%<br />
60%<br />
40%<br />
20%<br />
0%<br />
300<br />
250<br />
200<br />
150<br />
11.3<br />
6.1<br />
14.1<br />
10.5<br />
29.2<br />
23.6<br />
17.7<br />
104.6<br />
Others<br />
4.6%<br />
15.1<br />
3.9<br />
11.2<br />
10.3<br />
20.4<br />
17.9<br />
17.5<br />
92.3<br />
12.2<br />
6.1<br />
9.8<br />
8.6<br />
17.8<br />
19.7<br />
24.4<br />
99.5<br />
Trend Line<br />
Jan 2004 Feb 2004 M ac 2004 Apr 2004 M ay 2004<br />
Total Imports 205.6 335.8 194.0 188.7 196.6<br />
Food & live<br />
animals<br />
16.1%<br />
Chemicals<br />
8.5%<br />
M anufactured<br />
goods<br />
25.4%<br />
CHART 5.9: ORIGIN OF IMPORTS, APRIL-MAY 2003 AND<br />
APRIL-MAY 2004<br />
BND<br />
M illion<br />
11.7<br />
6.7<br />
10.3<br />
12.2<br />
23.7<br />
21.6<br />
17.1<br />
93.2<br />
April '03 April '04 May '03 May '04<br />
ASEAN EU JAPAN USA CHINA HONG KONG AUSTRALIA OTHERS<br />
Total imports showed a downward trend for the period between<br />
January and May 2004 (Chart 5.6). The high total imports<br />
in February 2004 was due to high imports of Machinery<br />
& Transport Equipment from the European Union.<br />
In April 2004, Machinery and Transport Equipment constituted<br />
32.4 per cent of total imports, followed by Manufactured<br />
Goods (29.5 per cent), Food & live animals (12.4 per cent), Miscellaneous<br />
Manufactured Articles (10.9 per cent) and Chemicals<br />
(8.7 per cent) (Chart 5.7).<br />
In May 2004, Machinery and Transport Equipment remained<br />
the major imports commodity which accounted for 34.9 per<br />
cent of total imports, followed by Manufactured Goods (25.4<br />
per cent), Food & live animals (16.1 per cent), Miscellaneous<br />
Manufactured Articles (10.5 per cent) and Chemicals (8.5 per<br />
cent) (Chart 5.8).<br />
With regards to the origin of imports, in April 2004, 48.9 per<br />
cent of total imports were from ASEAN countries, followed by<br />
the USA (10.8 per cent), Japan (9.5 per cent), the European<br />
Union (9.3 per cent), Hong Kong (5.9 per cent), China (5.4 per<br />
cent) and Australia (2.1 per cent) (Chart 5.9).<br />
Compared to April 2003, <strong>Brunei</strong> Darussalam’s imports in April<br />
2004 from Australia, the USA, Japan, Hong Kong, ASEAN<br />
countries, China and the European Union decreased by 37.0<br />
per cent, 30.1 per cent, 24.1 per cent, 20.2 per cent, 11.7 per<br />
cent, 2.6 per cent and 1.0 per cent respectively.<br />
In May 2004, ASEAN countries remained the main source of<br />
imports which accounted for 47.4 per cent of total imports,<br />
followed by the USA (12.1 per cent), Japan (11.0 per cent), the<br />
European Union (8.7 per cent), China (6.2 per cent), Hong<br />
Kong (5.2 per cent) and Australia (3.4 per cent).<br />
In comparison to May 2003, <strong>Brunei</strong> Darussalam’s imports in<br />
May 2004 from China increased by 42.5 per cent, followed by<br />
the USA (33.2 per cent), Australia (9.9 per cent), Japan (9.6 per<br />
cent) and Hong Kong (5.2 per cent). However, imports from<br />
the European Union and ASEAN countries declined by 29.9<br />
per cent and 6.3 per cent respectively.<br />
Compared to April 2004, <strong>Brunei</strong> Darussalam’s May 2004 imports<br />
from Australia increased by 72.7 per cent, followed by<br />
Japan (20.6 per cent), China (19.0 per cent), the USA (16.0 per<br />
cent) and ASEAN countries (1.0 per cent). However, imports<br />
from Hong Kong and the European Union declined by 8.2 per<br />
cent and 2.6 per cent respectively (Table 5.4).<br />
TABLE 5.4: ORIGIN OF IMPORTS, APRIL-MAY 2003 AND APRIL-MAY 2004<br />
BND Million<br />
April '03 April '04 May '03 May '04<br />
April '03<br />
& April<br />
'04<br />
% Change<br />
May '03<br />
& May<br />
'04<br />
April '04<br />
& May<br />
'04<br />
ASEAN 104.6 92.3 99.5 93.2 (11.7) (6.3) 1.0<br />
EU 17.7 17.5 24.4 17.1 (1.0) (29.9) (2.6)<br />
JAPAN 23.6 17.9 19.7 21.6 (24.1) 9.6 20.6<br />
USA 29.2 20.4 17.8 23.7 (30.1) 33.2 16.0<br />
CHINA 10.5 10.3 8.6 12.2 (2.6) 42.5 19.0<br />
HONG<br />
KONG<br />
14.1 11.2 9.8 10.3 (20.2) 5.2 (8.2)<br />
AUSTRALIA 6.1 3.9 6.1 6.7 (37.0) 9.9 72.7<br />
OTHERS 11.3 15.1 12.2 11.7 32.9 (4.7) (22.5)<br />
TOTAL<br />
IMPORTS<br />
217.2 188.7 198.2 196.6 (13.1) (0.8) 4.2
BRUNEI ECONOMIC BULLETIN<br />
P AGE 13<br />
BRUNEI DARUSSALAM Q2 2004<br />
ECONOMIC REVIEW & OUTLOOK AND RECENT ECONOMIC DEVELOPMENTS<br />
Chart 6.1: <strong>Brunei</strong> Darussalam Average Weighted Crude Oil<br />
Prices<br />
US$/Barrel<br />
45<br />
40<br />
35<br />
30<br />
25<br />
33.41<br />
32.39<br />
32.27 32.73<br />
31.02<br />
30.98<br />
30.03<br />
31.35<br />
28.64 30.02<br />
30.35 29.35<br />
27.85<br />
27.69<br />
25.73<br />
27.07<br />
26.31 26.51 27.18<br />
24.60<br />
26.60<br />
24.76<br />
39.4<br />
38.47<br />
37.23<br />
36.22 37.83<br />
Average Weighted Crude Oil Price Index<br />
The average weighted Crude Oil Price Index (COPI) for Q2 2004 increased<br />
by 39.8 per cent year-on-year from 92 to 128.6. On a quarteron-quarter<br />
basis, the COPI increased by 7.3 per cent from 119.8 (Table<br />
6.1).<br />
<strong>Brunei</strong> Darussalam’s average weighted crude oil price decreased by<br />
3.2 per cent from US$38.47 per barrel in March 2004 to US$37.23 per<br />
barrel in April 2004 (Table 6.1 and Chart 6.1). Then it rose by 5.8 per<br />
cent to US$39.4 in May 2004. However, it decreased again by 4 per cent<br />
to US$37.83 per barrel in June 2004. The average weighted crude oil<br />
price stood at US$38.2 per barrel in Q2 2004 compared to US$27.33 per<br />
barrel in Q2 2003 and US$35.59 per barrel in Q1 2003.<br />
20<br />
APR 2002 JUL OCT JAN 2003 APR JULY OCT JAN 2004 APR<br />
Source: Petroleum Unit, Prime Minister's Office<br />
Table 6.1 : Average Weighted Price of Crude Oil<br />
Unit - US$/Barrel<br />
2001 2002 2003 2004<br />
JAN 26.24 19.67 30.02 32.73<br />
FEB 27.27 20.17 30.98 36.22<br />
MAC 26.79 22.99 33.41 38.47<br />
APR 27.75 24.76 27.69 37.23<br />
MAY 28.99 25.73 27.18 39.40<br />
JUN 28.05 24.60 27.07 37.83<br />
JUL 25.99 26.31 30.03<br />
AUG 24.91 27.85 30.35<br />
SEP 24.96 28.64 29.35<br />
OCT 20.19 26.60 32.39<br />
NOV 18.79 26.51 32.27<br />
DEC 18.60 31.02 31.35<br />
Average W.Crude Oil Price for the<br />
Year<br />
24.67 25.33 30.17<br />
Average W.Crude Oil Price Q1 26.73 20.87 33.41 35.59<br />
Average W.Crude Oil Price Q2 28.23 25.03 27.30 38.20<br />
Average W.Crude Oil Price Q3 25.29 27.59 29.33<br />
Average W.Crude Oil Price Q4 19.19 28.02 32.00<br />
Average W.Crude Oil Price 1H 27.45 22.95 30.33 36.89<br />
Average W.Crude Oil Price 2H 23.19 27.51 30.71<br />
Average Weighted Crude Oil Price Index<br />
2001 2002 2003 2004<br />
JAN 88.3 66.2 101.0 110.2<br />
FEB 91.8 67.9 104.3 121.9<br />
MAC 90.2 77.4 112.5 129.5<br />
APR 93.4 83.3 93.2 125.3<br />
MAY 97.6 86.6 91.5 132.6<br />
JUN 94.4 82.8 91.1 127.3<br />
JUL 87.5 88.6 101.1<br />
AUG 83.8 93.7 102.2<br />
SEP 84.0 96.4 98.8<br />
OCT 68.0 89.5 109.0<br />
NOV 63.2 89.2 108.6<br />
DEC 62.6 104.4 105.5<br />
Average Index for the Year 83.0 85.3 101.5<br />
Average Index for Q1 90.0 70.2 106.1 119.8<br />
Average Index for Q2 95.0 84.2 91.9 128.6<br />
Average Index for Q3 85.1 92.9 98.7<br />
Average Index for Q4 64.6 94.3 107.7<br />
Average Index for 1H 92.4 77.2 102.1<br />
Average Index for 2H 78.1 92.6 103.4<br />
Base year 2000=100<br />
Source: Petroleum Unit, Prime Minister's Office<br />
World oil prices closed at around US$35.45 per barrel at the end of Q1<br />
2004. Prices remained stable above US$33.45 per barrel throughout<br />
April 2004. May 5 then saw oil prices hit a fresh 13-year high reaching<br />
US$39.40 per barrel due to tight supplies in the US and the fear that<br />
violence in the Middle East would intensify. A day later, prices rose<br />
further to US$39.40 per barrel amid renewed violence in the Middle<br />
East.<br />
On May 13, oil prices hit an all-time high reaching US$40.60 per barrel<br />
following worries about global demand and gasoline supplies. Prices<br />
rose further on May 17 to a new record high (around US$41.40 per<br />
barrel) on concern that rapid fuel demand growth would outpace<br />
global supplies at a time when traders feared an attack on the Middle<br />
East oil infrastructure. Prices eventually fell a day later to around<br />
US$40.10 per barrel on signs that the oil producers' cartel, the Organization<br />
of Petroleum Exporting Countries (OPEC), would vote to increase<br />
production when it was due to meet in June 2004.<br />
May 24 however saw oil prices rose again to around US$41.30 per barrel<br />
due to soaring oil demand caused by global economic expansion.<br />
There has been higher than expected oil demand in industrialized<br />
countries. China’s rapidly expanding economy also has created a huge<br />
demand boost. Prices then remained stable around US$40.90 per barrel<br />
throughout the end of May 2004.<br />
On June 1, oil prices struck a new record high (around US$41.70 per<br />
barrel) on concerns that a violence campaigns by Islamic militants in<br />
Saudi Arabia could destabilize the world’s biggest crude exporter. The<br />
next two weeks subsequently saw oil prices on a falling trend to<br />
around US$38.39 per barrel amid expectations that higher OPEC production<br />
and rising imports of the United States of America (USA)<br />
would increase inventories in the USA, the world's largest energy consumer.<br />
Prices however increased again on June 18 to around US$38.50 per<br />
barrel after attacks on pipelines in Iraq. The next two weeks then saw<br />
oil prices declined gradually and eventually closed at around US$37.50<br />
per barrel at the end of June 2004.
P AGE 14<br />
BRUNEI ECONOMIC BULLETIN<br />
BRUNEI DARUSSALAM Q2 2004<br />
ECONOMIC REVIEW & OUTLOOK AND RECENT ECONOMIC DEVELOPMENTS<br />
<strong>Economic</strong> Outlook for Q2 2004<br />
The economy of <strong>Brunei</strong> Darussalam is expected to grow further in Q3<br />
2004 and again the non-oil private sector is likely to provide the momentum.<br />
On the production side, the oil and gas sector may not show<br />
significant increase due to “capacity constraint”. However, the higher<br />
oil price may contribute to higher export revenue and the resulting<br />
general spill-over effects. Furthermore, economic expansion of regional<br />
economies may help boost business confidence in this country.<br />
The non-oil private sector will be enhanced by expansions in mining,<br />
quarrying and manufacturing, construction, wholesale and retail<br />
trades, transportation and communication and other services sectors.<br />
These are the sectors which have revealed significant growth during<br />
the first half of 2004. The restaurant and hotel sector in particular, will<br />
be boosted by the upcoming royal birthday and wedding functions.<br />
Furthermore, an examination of job vacancies 1 in the private sector has<br />
revealed a significant increment over the past two quarters, especially<br />
in the services sector. With better economic outlook and more investment,<br />
job opportunities are also anticipated to increase further along<br />
with non-oil sector growth.<br />
As expected, the government financial position (budget surplus) has<br />
improved in Q2 2004 compared to Q1 2004 but this was largely due to<br />
the decline in government current expenses. During the same period,<br />
the government development expenditure is expected to increase<br />
again in Q3 2004.<br />
Since October 2003, the broader measure of money supply, M2, has<br />
increased during the last three quarters. Non-performing loans have<br />
also decreased, especially after February 2004. Similarly, loans advances<br />
have also increased generally in Q2 2004 compared to the previous<br />
quarter, even though the bulk goes to personal requirements. All<br />
of these developments show some level of confidence in both the business<br />
community and the consumers and the same is expected to persist<br />
in the next quarter.<br />
On the external sector, although the trade statistics showed a decline in<br />
exports between April and May 2004, imports are increasing during<br />
the same period. This is especially true for both tradeable and investment<br />
goods such as those under machinery and transport equipment<br />
and foods and live animals categories. These trade indicators, together<br />
with the aforementioned, are positive signs of a growing economy, at<br />
least in the short and the medium term.<br />
1 These job vacancies are monitored based on those advertised in the Borneo <strong>Bulletin</strong> from January to June 2004. Between Q1 and Q2 of 2004,<br />
there was an increase in job opportunities of nearly 50 percent, from 293 to 432 job vacancies. The bulk of these opportunities (76 percent of<br />
total in Q2 2004) are in the professionals, technicians and clerical occupational categories.
BRUNEI ECONOMIC BULLETIN<br />
8th NATIONAL DEVELOPMENT PLAN<br />
P AGE 15<br />
Q2 2004 Project Implementation Review<br />
For the fiscal year of 2004-2005, a total of BND 900 million has<br />
been allocated to implement some 480 projects of the 8 th National<br />
Development Plan. Out of this amount, BND 526 million has been<br />
allocated to fund 210 on-going projects, including projects which<br />
have been completed, but are awaiting penultimate and final payments.<br />
The balance of this fund (BND 374 million) will finance the implementation<br />
of the remaining 270 projects.<br />
The BND 900 million allocation has been distributed to major development<br />
sectors as shown in Table 1 below.<br />
TABLE 1: Budget Allocation by Major Sectors and Category of Projects<br />
Sectors<br />
On-Going Projects<br />
(BND) & % of Total<br />
Sectoral Allocation<br />
New Projects<br />
(BND) & % of Total Sectoral<br />
Allocation<br />
TOTAL SECTORAL<br />
ALLOCATION<br />
(BND)<br />
Industry & Commerce<br />
74,458,000<br />
(81.78%)<br />
16,590,000<br />
(18.22%)<br />
91,048,000<br />
Transport & Communication<br />
Social Services<br />
Public Utilities<br />
Public Buildings<br />
Security<br />
Miscellaneous<br />
ICT<br />
GRAND TOTAL<br />
100,429,000 67,213,000<br />
59.91% 40.09%<br />
167,642,000<br />
94,638,000 112,478,000<br />
45.69% 54.31%<br />
207,116,000<br />
90,910,000 75,580,000<br />
54.60% 45.40%<br />
166,490,000<br />
62,675,000 22,850,000<br />
73.28% 26.72%<br />
85,525,000<br />
64,250,000 28,900,000<br />
68.97% 31.03%<br />
93,150,000<br />
16,689,000 8,340,000<br />
66.68% 33.32%<br />
25,029,000<br />
22,000,000 42,000,000<br />
34.38% 65.63%<br />
64,000,000<br />
526,049,000 373,951,000 900,000,000<br />
58.45% (41.55%)<br />
100%<br />
TABLE 2: BREAKDOWN OF STATUS OF ON-GOING PROJECTS<br />
Q2 2004<br />
COMPLETED PRO-<br />
JECTS<br />
Number BND<br />
of Projects<br />
million<br />
ON-GOING PRO-<br />
JECTS<br />
Number BND<br />
of Projects<br />
million<br />
PROJECTS IN<br />
OTHER STAGES 1<br />
Number BND<br />
of million<br />
Projects<br />
TOTAL 70 79.7 129 426.5 11 19.8<br />
TABLE 3: STATUS OF NEW PROJECTS FOR Q2 2004<br />
Status<br />
Number of<br />
New Projects<br />
2004 Allocation<br />
BND million<br />
Completed 9 2.8<br />
Under Implementation 31 84.0<br />
Tender Awarded 2 2.8<br />
Awaiting Tender 33 74.1<br />
Tendering Process 28 53.9<br />
Other stages 2 167 156.3<br />
Total 270 373.9<br />
From Table 1, the Social Services Sector receives the highest allocation<br />
of BND 207 million. Out of this, 46 per cent will be utilised to<br />
fund on-going projects while the remaining 54 per cent has been<br />
allocated to finance projects that are yet to be implemented.<br />
Meanwhile, the Miscellaneous Sector receives the least allocation<br />
of just over BND 25 million, for which 67 per cent will be used to<br />
finance on-going projects.<br />
Q2 2004 IMPLEMENTATION ACHIEVEMENT: PHYSICAL<br />
STATUS<br />
A. On-Going Projects<br />
Out of 210 on-going projects, a total of 70 projects (with allocations<br />
of about BND 80 million) were completed. Table 2 summarizes the<br />
status of on-going projects.<br />
B. Newly Implemented Projects<br />
Out of a total of 270 projects, 9 were completed (with allocation of<br />
BND 2.8 million). The status of other new projects is as shown in<br />
Table 3.<br />
1 & 2<br />
Other Stages here include projects which are in the process of preparing tender documents, pre-design, design, concept formulation and<br />
awaiting appointment of consultants. It also includes projects which are being KIVed and other stages prior to implementation
P AGE 16<br />
BRUNEI ECONOMIC BULLETIN<br />
8th NATIONAL DEVELOPMENT PLAN<br />
TABLE 4: PROJECTS WITH APPROVED CONSULTANTS<br />
FOR Q2 2004<br />
No VOTE NO PROJECT DESCRIPTION<br />
1 816-007 Telemetry for BSB Sewerage System<br />
2 815-016 Renovation to Block 3 and Outpatient<br />
Clinic at Raja Isteri Pengiran Anak<br />
Saleha Hospital, BSB<br />
3 815-015 Renovation and Repair to Accident<br />
and Emergency Unit at Raja Isteri<br />
Pengiran Anak Saleha Hospital, BSB<br />
4 803-016 Development of Marine Park: National<br />
Turtle Conservation and Management<br />
Centre<br />
5 817-001- BSB/Muara/Tutong Water Supply<br />
007<br />
Scheme Stage 6: Improvements to<br />
Planned Maintenance<br />
6 801-003 Development Schemes for Fruit<br />
Industry – Phase 2 – Plantation<br />
Infrastructure Development for<br />
Merangking, Bukit Sawat, Belait<br />
District<br />
DATE OF<br />
APPOINT-<br />
MENT<br />
10-May-04<br />
18-May-04<br />
18-May-04<br />
27-May-04<br />
27-May-04<br />
27-May-04<br />
7 806-035 Medical Institute Building, UBD 27-May-04<br />
8 820-015- H3 Houses at Kg Meragang Housing 27-May-04<br />
002-003 Scheme<br />
9 820-015- H4 Houses at Kg Meragang Housing 27-May-04<br />
002-004 Scheme<br />
10 818-001-<br />
001<br />
Dumping Area, Kuala Belait, Phase 1 27-May-04<br />
Chart 1: SPENDING BY SECTORS, Q2 2004<br />
BND Millions<br />
40<br />
35<br />
30<br />
25<br />
20<br />
15<br />
10<br />
5<br />
0<br />
4.77<br />
Industry &<br />
Commerce<br />
35.06<br />
Transport &<br />
Communication<br />
18 .8 9<br />
Social<br />
Services<br />
6.85<br />
Public<br />
Utilities<br />
Sectors<br />
Q2 (2004)<br />
4.25<br />
Public<br />
Buildings<br />
4.36<br />
Security<br />
0.24<br />
Miscellaneous<br />
4.05<br />
ICT<br />
B. Appointment of Consultants<br />
During Q2 2004, 10 consultants were appointed to undertake projects<br />
as shown in Table 4.<br />
Q2 2004 IMPLEMENTATION ACHIEVEMENT: FINANCIAL<br />
STATUS<br />
Warrants <strong>Issue</strong>d<br />
The breakdown of the financial warrants issued in Q2 2004, by<br />
major sectors is as shown in Table 5. A total of about BND 189<br />
million worth of warrants for all major sectors were approved. The<br />
Transport and Communication Sector received the highest<br />
amount of about BND 74 million, accounting for 41 per cent of the<br />
total value of warrants issued.<br />
Expenditure<br />
Chart 1 shows expenditure in Q2 2004 for each major sector.<br />
The Transport and Communication Sector recorded the highest<br />
expenditure, especially during Q2 2004 as compared with the rest<br />
of the major sectors. During this period, this sector spent BND 35<br />
million or 47 per cent against approved warrants of BND 74 million.<br />
The Miscellaneous Sector registered the least spending in Q2<br />
2004, amounting to BND 0.23 million or 19.7 per cent against approved<br />
warrants.<br />
Overall, expenditure in Q2 2004 amounted to BND 78.4 million or<br />
8.7 per cent against 2004-2005 allocations and about 42 per cent<br />
against approved warrants worth BND 189 million. This is shown<br />
in Table 5 and Chart 2.<br />
CHART 2: NDP Major Sectors - Allocation, Warrants, Expenditure,<br />
Q2 2004<br />
BND Millions<br />
220<br />
200<br />
180<br />
160<br />
140<br />
120<br />
100<br />
80<br />
60<br />
40<br />
20<br />
0<br />
91<br />
12<br />
5<br />
Industry &<br />
Commerce<br />
168 166<br />
74<br />
35<br />
Transport &<br />
Communication<br />
207<br />
47<br />
19<br />
Social<br />
Services<br />
23<br />
7<br />
Sectors<br />
86<br />
93<br />
64<br />
25<br />
13<br />
7 11<br />
4 4 10.2 4<br />
2004 Allocation Warrants April 2004 - Jun 2004<br />
Expenditure April 2004 - Jun 2004<br />
Public<br />
Utilities<br />
Public<br />
Buildings<br />
Security<br />
Miscellaneous<br />
ICT<br />
Table 5: ALLOCATION, WARRANT AND EXPENDITURE, Q2 2004<br />
SECTORS<br />
2004 Allocation<br />
(BND)<br />
Warrants<br />
<strong>Issue</strong>d<br />
(BND)<br />
Percentage<br />
Of Warrants<br />
<strong>Issue</strong>d Against<br />
Total Warrants<br />
Q2 2004<br />
Expenditure<br />
(BND)<br />
Percentage of Expenditure<br />
Against Allocation<br />
Percentage of Expenditure<br />
Against Warrants<br />
Industry and Commerce 91,048,000 12,143,796 6.44% 4,768,582 5.2 39.3<br />
Transport and Communication 167,642,000 74,236,279 39.35% 35,055,782 20.9 47.2<br />
Social Services 207,116,000 47,255,236 25.05% 18,884,608 9.1 40.0<br />
Public Utilities 166,490,000 23,107,563 12.25% 6,849,292 4.1 29.6<br />
Public Building 85,525,000 13,219,957 7.01% 4,251,226 5 32.2<br />
Security 93,150,000 7,000,213 3.71% 4,362,909 4.7 62.3<br />
Miscellaneous 25,029,000 1,196,688 0.63% 235,609 0.9 19.7<br />
ICT 64,000,000 10,493,368 5.56% 4,046,751 6.3 38.6<br />
Grand total 900,000,000 188,653,100 100.00% 78,454,759 8.7 41.6
BRUNEI ECONOMIC BULLETIN<br />
8th NATIONAL DEVELOPMENT PLAN<br />
P AGE 17<br />
ANALYSIS OF ACHIEVEMENTS FOR Q2 2004<br />
Approved warrants for the period of April to June 2004 totaled<br />
BND188,653,100, which was 95 per cent of the target.<br />
Expenditure for the same period of time totaled BND 78,454,759 which<br />
was 44 per cent of the target.<br />
Up to Q2 2004, the total expenditure recorded was about 42 per cent of<br />
total warrants issued for the same period, but only about 9 per cent of<br />
total allocations for the said quarter. This is shown in Table 5.<br />
On a year-on-year comparison, spending in Q2 2004 (BND 78.5 million)<br />
was a 2 per cent increased as compared to Q2 2003 (BND 77.2 million).<br />
With the increase in spending, physical status of projects had improved<br />
on a year – on – year comparison. The number of projects completed was<br />
30 per cent (79 projects) higher in Q2 2004 as compared to Q2 2003 (61<br />
projects).<br />
The record shows, from 210 on-going projects, 70 projects were completed,<br />
with total allocation of BND 80 million. Only 11 projects are in<br />
‘other stages’ category, while 129 other projects are still in<br />
‘implementation stage’, with an estimated allocation of BND 427 million.<br />
The remaining 270 new projects, with an estimated allocation of BND<br />
374 million, 9 projects were completed (with allocation of BND 2.8 million).<br />
Thirty-one (31) projects have just commenced their implementation.<br />
Sixty-three (63) projects (with allocation BND 130.8 million) that<br />
have just been awarded and projects that are in the stage of tendering,<br />
are expected to commence implementation in the third and fourth quarters<br />
of 2004.<br />
While the amount of warrants approved may be high, implementing and<br />
client agencies alike have not spent enough to meet the target of an average<br />
monthly expenditure of BND 66 million. The reasons for this may be<br />
attributed to a number of factors. However the trend appears to strongly<br />
suggest delays in many processing stages:<br />
♦ in the process of tendering of projects, specifically in the assessment<br />
of tenders by clients and implementing agencies;<br />
♦ in the processing of claims for payments;<br />
♦ in the finalization of accounts for the purpose of paying penultimate<br />
payments and release of retention funds;<br />
Delays are also caused by the re-tendering of projects due to contractors’<br />
failure to undertake or complete the work. As a result, there is an obvious<br />
need for additional efforts to address such delays in order to further<br />
improve project implementation performance.<br />
JPKE in consultation with the Ministry of Development and the Ministry<br />
of Finance are currently working towards resolving the issue.<br />
IMPLEMENTATION PROJECTION<br />
Spending in the first quarter of the financial year has been observed to be<br />
low, as with previous years. However, this will soon pick its momentum<br />
in the subsequent quarters.<br />
Four sectors will remain active in the next quarters: (1) Transport and<br />
Communications; (2) Social Services; (3) Public Utilities and (4) Public<br />
Buildings.<br />
The Security sector and Industry and Commerce sector will probably<br />
edge their way towards the four active sectors. This is shown by the drastic<br />
rise in spending for both sectors.
P AGE 18<br />
BRUNEI ECONOMIC BULLETIN<br />
SHORT TERM ECONOMIC RECOVERY<br />
Sub Total 12 276 C/D/E<br />
TOTAL 13 300 C/D/E<br />
Source: Department of Implementation and Monitoring, JPKE<br />
Table 2: Implementation Status of Housing Development Scheme<br />
Phase 1 (HDD)<br />
Site<br />
Table 1: Implementation Status of Housing Development Scheme<br />
Phase 1 (PWD)<br />
Package<br />
No. Of Types of<br />
Site<br />
Status<br />
Number<br />
Houses Houses<br />
PROJECTS RETENDERED<br />
Kg. Katok A 1 24 E ON GOING<br />
Sub Total 1 24 E<br />
PROJECTS COMPLETED<br />
2 26 E COMPLETED<br />
3 22 E COMPLETED<br />
4 25 E COMPLETED<br />
5 24 E COMPLETED<br />
6 21 D COMPLETED<br />
7 23 D COMPLETED<br />
8 23 C COMPLETED<br />
9 24 C COMPLETED<br />
10 19 C COMPLETED<br />
Kg Katok B 11 29 D COMPLETED<br />
12 20 C COMPLETED<br />
13 20 C COMPLETED<br />
Contract<br />
Number<br />
No. of<br />
Houses<br />
Types of<br />
Houses<br />
Status<br />
Completion<br />
Date/<br />
(Revised)<br />
PROJECTS RETENDERED<br />
Kg. Pandan H10B 22 TERRACE ON GOING 31/10/2004<br />
Kg. Rimba H23B 13 D ON GOING 31/07/200<br />
4<br />
H29A 20 D ON GOING 31/12/200<br />
4<br />
Sub Total :<br />
To Be<br />
Retendered<br />
3 55 TERRACE<br />
/D<br />
PROJECTS COMPLETED<br />
Lambak<br />
H35A 19 D COMPLETED<br />
Kanan<br />
Kg Pandan H10A 5 D COMPLETED<br />
H10C 22 TERRACE COMPLETED<br />
H10D 22 TERRACE COMPLETED<br />
Kg Rimba H23A 12 D COMPLETED<br />
H29B 32 D COMPLETED<br />
H29C 17 D COMPLETED<br />
H29D 27 D COMPLETED<br />
Sub Total :<br />
8 156 D,TERRACE<br />
Completed<br />
TOTAL 11 211 D,TERRACE<br />
Source: Department of Implementation and Monitoring, JPKE<br />
PUBLIC HOUSING DEVELOPMENT SCHEME<br />
First Phase<br />
A sum of BND 34,975,776 was spent under Phase 1, of which BND<br />
22,968,721 was for projects implemented by the Public Works Department<br />
(PWD) and BND 12,007,055 by the Housing Development<br />
Department (HDD).<br />
Construction of 300 houses by the Public Works Department<br />
As shown in Table 1, the contract for Package 1 involving 24<br />
houses in Kg Katok A was being mobilised on site. Altogether, 12<br />
packages were completed involving 276 houses in Kg Katok A and<br />
Kg Katok B.<br />
Out of 276 houses completed, 204 houses in Kg Katok A and Kg<br />
Katok B were handed over to beneficiaries. The remaining 72<br />
houses are expected to be handed over in Q4 2004.<br />
Construction of 211 houses by Housing Development Department<br />
Table 2 shows there are 3 remaining on-going contracts. Contract<br />
H10B, a retendered contract involving 22 terrace houses in Kg Pandan<br />
is expected to be completed by the end of October 2004. Contracts<br />
H23B could not be completed as scheduled and need an extension<br />
of time. While Contract H29A involving 20 houses in Kg<br />
Rimba are expected to be completed by the end of December this<br />
year.<br />
Infrastructure Works<br />
The status of the two infrastructure works involving road works at<br />
Kg. Katok A and Water Reticulation System in Kg. Katok B, remained<br />
unchanged since Q4 2003 (Table 3).<br />
Second Phase<br />
A total of BND 10,095,190 has been spent in the second phase.<br />
Construction of 250 houses by the Public Works Department.<br />
As shown in table 4,one of the contracts at Kg Katok B namely<br />
package 14 involving the construction of 15 houses retendered in<br />
the last quarter 2003 was finally awarded in March 2004.The progress<br />
of this contract is very slow. It is estimated to be five months<br />
behind schedule.<br />
Table 3: Implementation Status of Infrastructure Phase 1 – (PWD)<br />
Site Project Status<br />
Kg Katok A 1. Improvement of Jalan Tungku DELAYED<br />
Kg Katok B 2. Supply & Laying Water Pipe DELAYED<br />
Source : Department of Implementation and Monitoring, JPKE<br />
Table 4: Implementation Status of Housing Development Scheme—<br />
Phase 2 – (PWD)<br />
Site<br />
Package<br />
Number<br />
No. of<br />
Houses<br />
Types of<br />
Houses<br />
Status<br />
Kg Katok B 14 15 D & E ON GOING<br />
15 15 E COMPLETED<br />
Kg Katok A 16 14 D COMPLETED<br />
Kg Sungai<br />
17 22 D ON GOING<br />
Buloh<br />
18 22 D ON GOING<br />
19 28 D ON GOING<br />
20 24 D ON GOING<br />
21 24 D ON GOING<br />
22 24 D ON GOING<br />
23 23 E ON GOING<br />
24 24 E ON GOING<br />
25 15 E ON GOING<br />
Total 12 250<br />
Source : Department of Implementation and Monitoring, JPKE<br />
The construction of 206 houses at Kg Sungai Buloh under packages<br />
17-25 are still on going of which eight packages (17,19,20,21,22,23,24<br />
and 25) involving 184 houses are expected to be completed very<br />
soon. While package 18 involving 22 houses is scheduled to be completed<br />
by February 2005(Table 4).<br />
Infrastructure Works<br />
By the end of Q1 2004, in Kg. Katok A, one electrical and one water<br />
supply works have been completed while telecommunication<br />
works was delayed. In Kg. Katok B only the water works project<br />
was completed and both the electrical and communication works<br />
are delayed due to the delay in the award of contract for package 14<br />
at Kg Katok B.<br />
None of the 5 infrastructure works in Kg Sungai Buloh were completed.<br />
The 3 road works contract are still on going and are behind<br />
schedule. The electrical and telecommunication works are also delayed<br />
and have exceeded their contract period. This is mainly due<br />
to the delay in the construction of sewerline and water works.<br />
These contracts, therefore, require extension of time.
BRUNEI ECONOMIC BULLETIN<br />
P AGE 19<br />
SHORT TERM ECONOMIC RECOVERY<br />
MAINTENANCE OF GOVERNMENT BUILDINGS, COMPOUNDS<br />
AND ASSETS<br />
The maintenance of government buildings, compounds and assets<br />
under the Short-Term <strong>Economic</strong> Recovery Plan continues to be implemented<br />
by the Department of Planning and Estate Management,<br />
Ministry of Education and Department of Building Services, Public<br />
Works Department.<br />
TABLE 5: DISTRIBUTION OF CONTRACTS, NUMBER OF CONTRACTS &<br />
NUMBER OF SUCCESSFUL COMPANIES<br />
PHASE<br />
TOTAL NO. OF<br />
CONTRACTS<br />
NUMBER OF<br />
CONTRACTS<br />
AWARDED<br />
NUMBER OF<br />
SUCCESSFUL<br />
COMPANIES<br />
1 51 50 31<br />
2 134 128 82<br />
3 139 132 68<br />
4 66 55 33<br />
5<br />
(re-tendered)<br />
22 22 17<br />
TOTAL 412 387 231<br />
* As of 30 th June 2004<br />
The projects were implemented in 5 stages beginning March 2002 in<br />
which the first 2 phases were awarded in 2002. The third and the<br />
fourth phase of the project were awarded in the Q1 and Q2 2003<br />
respectively. The fifth phase (re-tendered) was awarded in December<br />
2003.<br />
The overall number of works tendered in the five phases was 412, in<br />
which 387 contracts were awarded to 231 successful companies<br />
(Table 5).<br />
Under Phase 1, the total number of contracts was 51 and only 50<br />
were awarded to 31 companies. For Phase 2, out of the total number<br />
of 134 contracts, only 128 contracts were awarded to 82 companies.<br />
Under Phase 3, the total number of contracts was 139 and only<br />
132 were awarded to 68 companies. A total of 66 contracts were<br />
tendered under Phase 4, whereby only 55 contracts were awarded<br />
to 33 companies. Under Phase 5, a total of 22 contracts were<br />
awarded to 17 companies (Table 5).<br />
Overall physical progress<br />
With regards to the physical progress, out of 363 contracts that were<br />
carried out, 325 contracts were completed and paid. A total of 10<br />
contracts were completed and still under final measurement stage,<br />
whilst 14 contracts were still under implementation. A total of 3<br />
contracts were to be terminated due to several reasons such as failure<br />
of the awarded contractors to complete the contracts on time.<br />
As of Q2 2004, 11 contracts were reported delayed (Table 6).<br />
Progress for each phase<br />
Phase 1<br />
TABLE 6: PHYSICAL IMPLEMENTATION PROGRESS<br />
As of 30 th June 2004, out of the 50 contracts under Phase 1, 48 were<br />
implemented of which 46 contracts were completed, 2 contracts<br />
were terminated due to the failure of the awarded contractors to<br />
complete the contracts on time while the remaining 2 contracts were<br />
delayed (Table 6). Payments made for this phase totalled BND<br />
958,137.38.<br />
PHASE<br />
NO. OF<br />
WORKS<br />
AWARDED<br />
NO. OF<br />
WORKS TER-<br />
MINATED<br />
NO. OF IMPLE-<br />
MENTED<br />
WORKS<br />
NO. OF<br />
WORKS COM-<br />
PLETED AND<br />
PAID<br />
NO. OF WORKS<br />
COMPLETED AND<br />
FINAL MEAS-<br />
UREMENT<br />
NO. OF WORKS<br />
UNDER IMPLEMEN-<br />
TATION<br />
NO.<br />
WORKS<br />
DELAYED<br />
NO. OF<br />
WORKS TO BE<br />
TERMINATED<br />
1 50 2 48 46 0 0 2 0<br />
2 128 17 111 107 1 0 1 2<br />
3 132 5 127 117 3 1 5 1<br />
4 55 0 55 40 6 9 0 0<br />
5 22 0 22 15 0 4 3 0<br />
TOTAL 387 24 363 325 10 14 11 3<br />
* As of 30 th June 2004<br />
Phase 2<br />
Under Phase 2, 82 contractors were given a total of 128 contracts<br />
amounting to BND 4,318,088.79. As of 30 th June 2004, 107 contracts<br />
out of 111 implemented were completed, 1 contract was still under<br />
final measurement stage, and 1 contract was delayed. A total of 17<br />
contracts were terminated due to failure of the awarded contractors<br />
to complete the contracts. A total of 2 contracts were to be terminated<br />
(Table 6). Payment made for this phase totaled BND<br />
3,899,752.16.
P AGE 20<br />
SHORT TERM ECONOMIC RECOVERY<br />
Phase 3<br />
BRUNEI ECONOMIC BULLETIN<br />
For Phase 3, 68 contractors were awarded a total of 132 contracts<br />
amounting to BND 10,240,663.91. At the end of Q2 2004, 117 contracts<br />
out of 127 implemented were completed, 3 contracts under<br />
final measurement stage, 1 contract under implementation, and 5<br />
were terminated. The remaining 5 contracts were delayed and 1<br />
contract will be terminated (Table 6). Payments made for this<br />
phase totalled BND 7,592,109.61.<br />
Phase 4<br />
Under phase 4, 33 contractors were awarded a total of 55 contracts<br />
with a total value of BND 4,311,024.86. As of Q2 2004, 40 contracts<br />
out of 55 implemented were completed, 6 contracts were still under<br />
final measurement stage, whilst the remaining 9 contracts were still<br />
under implementation (Table 6). Payments made for this phase<br />
totalled BND 2,337,462.70.<br />
Phase 5<br />
Out of 22 re-tendered contracts which were implemented under<br />
Phase 5, 15 contracts were completed, 4 under implementation, and<br />
3 were delayed (Table 6). As of 30 th June 2004, payments made for<br />
this phase totalled BND 204,997.37.<br />
WORKING CAPITAL CREDIT FUND SCHEME<br />
Table 7: Loans Approved by Banks According To <strong>Economic</strong><br />
Sectors, Q2 2004.<br />
In Q2 of 2004, 21 loan applications with a total value of BND<br />
4,189,113.00 were approved (Table 7). These loans were for financing<br />
projects in the sectors construction (51.6 per cent), ICT (16.8 per<br />
cent), business (16.7 per cent), services (12.4 per cent), primary resources<br />
(1.3 per cent), and manufacturing (1.2 per cent).<br />
SECTORS<br />
NUMBER OF<br />
LOANS AP-<br />
PROVED<br />
SERVICES 8<br />
BUSINESS 6<br />
CONSTRUCTION 4<br />
ICT 1<br />
MANUFACTURING 1<br />
PRIMARY RESOURCES 1<br />
BAIDURI<br />
(BND)<br />
30,000<br />
(1)<br />
220,000<br />
(2)<br />
1,492,531<br />
(1)<br />
704,182<br />
(1)<br />
LOAN AMOUNTS APPROVED THROUGH BANKS<br />
(No. of Loans in bracket)<br />
HSBC<br />
(BND)<br />
430,000<br />
(3)<br />
450,000<br />
(2)<br />
50,000<br />
(1)<br />
IBB<br />
(BND)<br />
257,400<br />
(5)<br />
50,000<br />
(1)<br />
220,000<br />
(1)<br />
55,000<br />
(1)<br />
IDBB<br />
(BND)<br />
230,000<br />
(2)<br />
TOTAL<br />
(BND)<br />
517,400<br />
700,000<br />
2,162,531<br />
704,182<br />
50,000<br />
55,000<br />
TOTAL 21 2,446,713 930,000 582,400 230,000 4,189,113<br />
Table 8: Loans Approved in the Working Capital Credit Fund,<br />
January 2001 – June 2004<br />
SECTORS<br />
LOANS APPROVED<br />
VALUE<br />
NO<br />
BND<br />
Services 77 11,204,400.00<br />
Primary <strong>Resources</strong> 16 4,243,400.00<br />
Business 43 4,935,072.00<br />
ICT 22 10,628,604.00<br />
Manufacturing 4 354,000.00<br />
Tourism 2 555,000<br />
Construction 34 13,534,809.00<br />
Total 198 45,455,285.00<br />
By comparison, in Q2 2003, 10 loans were approved amounting to<br />
BND 1,116,200.00. The loans approved for Q2 2004 reflect the continuing<br />
high interest of entrepreneurs on the scheme as observed<br />
in Q1 2004, where 20 loans were approved with the amount of<br />
BND 5,187,300.00. Since the introduction of the scheme in January<br />
2001 until June this year, the total number of loans approved<br />
reached 198 and the overall value BND 45,455,285.00 (Table 8).<br />
Loans were distributed to all categories of firm ownership, with<br />
79.0 per cent going to firms owned by Rakyat Jati and majority<br />
Rakyat Jati (Table 9).<br />
Table 9: Loan Approved To Firms<br />
Firms<br />
Number<br />
♦ Proportion<br />
Loan Amounts<br />
Value<br />
♦ Proportion<br />
‘Rakyat Jati’<br />
135<br />
68.2%<br />
BND 29,111,179<br />
64.1%<br />
Category of Company Ownership<br />
‘Rakyat Jati’<br />
Majority<br />
30<br />
15.2%<br />
BND 6,643,897<br />
14.6%<br />
Majority Citizens and<br />
Permanent Residence<br />
26<br />
13.1%<br />
BND 6,737,678<br />
14.8%<br />
Citizens and others<br />
7<br />
3.5%<br />
BND 2,962,531<br />
6.5%<br />
Total<br />
198<br />
100%<br />
BND 45,455,285.00<br />
100%
BRUNEI ECONOMIC BULLETIN<br />
P AGE 21<br />
THE LONG TERM OBJECTIVES OF BRUNEI DARUSSALAM’S DEVELOPMENT PLAN OF 1986-<br />
2005: What has been the level of achievement in enhancing the quality of life?<br />
Introduction<br />
Since regaining its full independence, <strong>Brunei</strong> Darussalam has<br />
gone through nearly two decades of National Development Plan<br />
(NDP) programs which started in 1986. Since then this country<br />
has experienced various economic and socio-political transformations<br />
which have influenced the quality of life of its people. For<br />
the first time in 1986, <strong>Brunei</strong> Darussalam engaged itself in its plan<br />
for long term development encompassing a period of two decades<br />
(1986-2005) and embracing four National Development Plans,<br />
starting with the 5 th NDP. Obviously, the outlined long term development<br />
objectives have their roots in and basis on developmental<br />
experiences prior to 1986 as well as on the aspirations during<br />
that time for the future.<br />
This article reviews the socio-economic achievements that have<br />
been observed in <strong>Brunei</strong> Darussalam with respect to some relevant<br />
long term objectives. The achievements are analyzed based<br />
on policies and programs as incorporated in the corresponding<br />
National Development Plans. A number of variables could be utilized<br />
to examine the quality of life of the people. In this article,<br />
quality of life is appraised based on indicators of the basic necessities<br />
of life, namely, education, health and housing and to some<br />
extent the environment. Wherever relevant, cross-country benchmarking<br />
is done to examine <strong>Brunei</strong> Darussalam’s position vis-àvis<br />
those countries during certain period of time. If the indicators<br />
show some level of under-achievements then they signal to some<br />
presence of pertinent issues that need to be considered seriously.<br />
These are the challenges and problems that need to be addressed<br />
in future planning.<br />
MACROECONOMIC OBJECTIVES AND THE LONG<br />
TERM NDP OBJECTIVES<br />
For any nations, irrespective of whether they are developed, developing or<br />
less developed countries, their economic progress are based on the<br />
achievement of basic macroeconomic objectives which ultimately leads to<br />
maintenance if not improvement in the people’s quality of life. The macroeconomic<br />
objectives ensure:<br />
ο Sustainable economic growth;<br />
ο Full employment of resources;<br />
ο Price Stability;<br />
ο Equitable distribution of income; and<br />
ο External balance.<br />
For some countries, even though some of the above objectives are<br />
not outlined explicitly, they are expressed in a different way and<br />
yet are inclined towards the ultimate goals of the macroeconomic<br />
objectives. For <strong>Brunei</strong> Darussalam, it has outlined its nine longterm<br />
development objectives which carry with them some elements<br />
of the macroeconomic objectives, as shown in BOX 1. Apart<br />
from addressing the macroeconomic objectives, some of the long<br />
term objectives also emphasized on social welfare and the environment<br />
as well as the interests of the indigenous <strong>Brunei</strong> citizens.<br />
Even though the objective of equitable distribution of income is<br />
not expressed explicitly, this objective has been practiced in<br />
<strong>Brunei</strong> Darussalam in its very own way in the form of in-kind<br />
transfers. These include the provision of services in education,<br />
health and other social services with minimum charges or even<br />
virtually-free. Indeed, the government has a very important role<br />
in this respect through the opening of its employment opportunities<br />
and the arrays of generous fringe benefits.
P AGE 22<br />
BRUNEI ECONOMIC BULLETIN<br />
THE LONG TERM OBJECTIVES OF BRUNEI DARUSSALAM’S DEVELOPMENT PLAN OF 1986-<br />
2005: What has been the level of achievement in enhancing the quality of life?<br />
BOX 1<br />
THE LONG TERM DEVELOPMENT OBJECTIVES 1986-2005<br />
ο Improve the quality of life;<br />
ο Maximize (optimize) the economic utilization of national resources;<br />
ο Develop new export-oriented and import substitution industries;<br />
ο Accelerate human resources development to meet the demand of an increasingly sophisticated<br />
economy;<br />
ο Maintain full employment and increase productivity level;<br />
ο Maintain a moderate rate of inflation;<br />
ο Foster a dynamic, disciplined and caring society with its citizens as agents for progress<br />
and development;<br />
ο Encourage and nurture the development of “Rakyat Melayu” as leaders of industry and<br />
commerce; and<br />
ο Have a clean and healthy environment.<br />
The National Development Plans, commencing with the 5th NDP,<br />
were developed based on the nine long term objectives. Almost all<br />
of the development programs are centered on physical infrastructure<br />
developments. These physical infrastructure developments of<br />
course are inevitable and are precursor to and complement of human<br />
development. However, it was argued that once a country<br />
has gone through or “completed” the development of these prerequisites,<br />
attention should be emphasized on soft infrastructure<br />
development. In this respect the 8 th NDP is pivotal as it has placed<br />
a premium on non-physical infrastructural programs. The 8 th NDP<br />
budget has been specifically apportioned to areas in human resources,<br />
science and technology and ICT developments. Furthermore,<br />
these efforts will be instrumental in taking <strong>Brunei</strong> Darussalam<br />
forward into the new economy of the 21 st century. None the<br />
less, the relationship between physical infrastructure and human<br />
development will become obscure if their development is not<br />
based on a systematic and strategic planning. In this respect, the<br />
formulation of an acceptable national vision supported by outlines<br />
of long term perspectives plan is necessary.<br />
ACHIEVEMENTS OF THE LONG TERM DEVELOPMENT<br />
OBJECTIVES<br />
The long term objectives outlined above represent both aspects of<br />
development, economic and socio-political ones. Both aspects are<br />
obviously intimately-related and two-way in nature. On the one<br />
hand, the sustainability and strength of economic growth are the<br />
foundations of socio-political integrity. On the other hand, sociopolitical<br />
integrity and stability are necessary and pre-conditions<br />
for the economy to grow. The ultimatum borne out of sociopolitical<br />
cohesion and economic expansion is of course improvement<br />
in the quality of life 1 . The quality of life of the people could<br />
be evaluated, among others, through indicators of life expectancy,<br />
literacy rate and per capita income, all of which requires aspects of<br />
economic growth, employment generation, low inflation rate and<br />
stable socio-political and natural environment.<br />
Whatever the intentions and efforts on the part of the government<br />
with regard to economic development, the improvement in the<br />
quality of life is still the ultimate goal. This aspect of development<br />
fits into the universal and current trend of development which<br />
1 The long term development objectives outlined in BOX 1 are interdependent, especially for the first objective to improve the quality of life of the people. This objective<br />
is realized by the other eight objectives; it is the end product and therefore merits being the ultimate goals of development.
BRUNEI ECONOMIC BULLETIN<br />
P AGE 23<br />
THE LONG TERM OBJECTIVES OF BRUNEI DARUSSALAM’S DEVELOPMENT PLAN OF 1986-<br />
2005: What has been the level of achievement in enhancing the quality of life?<br />
BOX 2<br />
QUALITY OF LIFE INDICATORS<br />
♦<br />
♦<br />
♦<br />
♦<br />
♦<br />
♦<br />
♦<br />
♦<br />
♦<br />
♦<br />
♦<br />
people;<br />
♦ population growth and density<br />
♦ population structure<br />
♦ families and households<br />
knowledge and skills;<br />
♦ educational enrolment<br />
♦ qualification levels<br />
economic standard of living;<br />
♦ income level<br />
♦ household expenditure<br />
♦ social deprivation<br />
♦ costs<br />
economic development;<br />
♦ economic growth<br />
♦ employment<br />
♦ growth in entrepreneur<br />
♦ retail sales<br />
♦ tourism<br />
housing;<br />
♦ housing costs and affordability<br />
♦ size of households<br />
♦ government housing provision<br />
health;<br />
♦ life expectancy<br />
♦ infant mortality<br />
♦ diseases<br />
♦ access to medical and health facilities<br />
natural environment;<br />
♦ waste management<br />
♦ air and water quality<br />
♦ biodiversity<br />
♦ drinking water quality<br />
built environment;<br />
♦ city environment<br />
♦ green space<br />
♦ noise pollution<br />
♦ traffic and transport<br />
♦ public transport<br />
safety and comfort;<br />
♦ perception of safety<br />
♦ road casualties<br />
♦ crime levels<br />
social connectedness; and<br />
♦ electronic communications<br />
♦ community strength and spirit<br />
♦ diversity<br />
civil and political rights.<br />
♦ Involvement in decision making<br />
Source: Quality of Life in New Zealand’s 8 Largest City 2003<br />
CHART 1<br />
BRUNEI DARUSSALAM’S GDP PER CAPITA, 1985-2003<br />
GDP per CAPITA (BND)<br />
40000<br />
35000<br />
30000<br />
25000<br />
20000<br />
150 0 0<br />
10 0 0 0<br />
5000<br />
0<br />
1985<br />
1987<br />
1989<br />
1991<br />
1993<br />
1995<br />
1997<br />
1999<br />
2001<br />
2003<br />
35<br />
30<br />
25<br />
20<br />
15<br />
10<br />
5<br />
0<br />
OIL PRICE (USD)<br />
emphasizes “development with a human face” 2 . The trends in the<br />
quality of life indicators enable us to fathom whether a nation has<br />
accomplished its socio-economic objectives and targets. For <strong>Brunei</strong><br />
Darussalam, all the long term objectives outlined above are supportive<br />
of the ultimate goal to improve the quality of life of the<br />
people.<br />
From a universal perspective, the objective to improve the quality<br />
of life covers some characteristics and indicators as listed in BOX<br />
2. For most of the characteristics listed, government has a vital<br />
role to help accomplish them, more so for <strong>Brunei</strong> Darussalam<br />
which has been well known for its welfarism. In this respect, according<br />
to the United Nations Development Programme, <strong>Brunei</strong><br />
Darussalam is ranked 33 rd among 177 nations on its Human Development<br />
Index of 2004 3 . <strong>Brunei</strong> Darussalam is ranked top<br />
among Islamic nations, second only after Singapore among<br />
ASEAN member countries; and 5 th among Asians (Japan, Hong<br />
Kong, Singapore, South Korea and <strong>Brunei</strong> Darussalam in that order).<br />
From one perspective, such an achievement is a pride to the nation.<br />
However, what is more important is the degrees to which we<br />
as a nation are able to sustain if not improve on it. In terms of life<br />
expectancy, registration in educational institutions and the literacy<br />
rate, <strong>Brunei</strong> Darussalam’s achievement is relatively high and<br />
even surpassing those attained by some developed countries.<br />
However, the generally declining trend since the early 1980’s in<br />
the per capita income variable signals toward the need for a more<br />
concerted effort in improving it. This is especially true where<br />
there is a wide gap between the per capita income arising out of<br />
the oil and gas industry and that of the non-oil and gas private<br />
economy. Improvement in the per capita income is one of the important<br />
pre-conditions for further growth and structural change.<br />
CHART 1 shows the GDP per Capita for <strong>Brunei</strong> Darussalam between<br />
1985 and 2003. The trend in GDP per Capita shows a close<br />
relationship with oil price, at least between 1985 and 1999. The<br />
high GDP per Capita for 1985 reflects the relatively high price of<br />
oil during that year (US$26.50 per barrel). In 1998, the world’s oil<br />
price dropped drastically to US$11.91 per barrel and the GDP per<br />
Capita moved in the same direction.<br />
Since the 1970’s, <strong>Brunei</strong> Darussalam has been one of the world’s<br />
richest countries. In 2002 (based on UNDP Human Development<br />
Index of 2004), in terms of the GDP per Capita it is fourth among<br />
East Asian nations after Japan, Hong Kong, and Singapore. However,<br />
due to <strong>Brunei</strong> Darussalam’s dependence on oil and gas resources,<br />
the GDP per Capita does not truly indicate a strong relationship<br />
between economic growth and development. On the one<br />
hand, there is the issue of sustainability of this economic structure.<br />
While the benefits to the country as a whole are obvious, this economic<br />
structure suffers the problems characteristic of rentierism 4 .<br />
On the other hand, however, especially in consideration of the<br />
strong role of the <strong>Brunei</strong> Darussalam’s government in the distribution<br />
of wealth, the relatively high GDP per capita is a positive<br />
indication of the overall development of the economy. But this<br />
should not preclude us from examining the real and long-term<br />
effects on the well-being of the people.<br />
Theoretically, the trickle down effect of growth arising out of a<br />
vital sector 5 to the economy occurs through forward and back-<br />
2 United Nations Development Programme<br />
3 Human Development Index (HDI) is a composite index of human development which takes into consideration indexes of Per Capita Income, Literacy Rate and Enrolment<br />
in Educational Institutions and Life Expectancy.<br />
4 Rentierism refers to (is measured as) the proportion of rents in government revenue, with 40 % as the benchmark. Rentierism and natural resource dependency are<br />
not the same thing, though in practice they are highly correlated. Natural resource dependency is generally measured as the share of natural resource exports as a<br />
percentage of GDP. (Herb, 2003).<br />
5 For <strong>Brunei</strong> Darussalam this refers to the oil and gas sector, which has been the staple of the economy for more than three decades.
P AGE 24<br />
BRUNEI ECONOMIC BULLETIN<br />
THE LONG TERM OBJECTIVES OF BRUNEI DARUSSALAM’S DEVELOPMENT PLAN OF 1986-<br />
2005: What has been the level of achievement in enhancing the quality of life?<br />
CHART 2<br />
THE RATES OF INFLATION IN BRUNEI DARUSSA-<br />
LAM, 1986-2003<br />
7<br />
%<br />
6<br />
5<br />
4<br />
3<br />
2<br />
1<br />
0<br />
-1 1985 1987 1989 1991 1993 1995 1997 1999 2001 2003<br />
-2<br />
-3<br />
CHART 3<br />
COMPARISON OF THE RATES OF INFLATION IN<br />
ASEAN5, 1992-2002<br />
12<br />
10<br />
8<br />
6<br />
4<br />
2<br />
0<br />
-2<br />
-4<br />
4.3 2.4 6 2<br />
1.3 1.7 -0.4 -0.1<br />
-2.3<br />
1992 1994 1996 1998 2000 2002<br />
<strong>Brunei</strong> M alaysia Philippines<br />
Singapore<br />
Thailand<br />
1.2<br />
0.6<br />
ward linkages, consumption linkage and fiscal linkage. In this linkage<br />
context, Tse and Fernandez (1987), based on available information during<br />
the time of write-up, contends that the experience of <strong>Brunei</strong> Darussalam<br />
economic development in the 1970’s and early 80’s was one where there<br />
was “growth without development”. In other words, economic growth<br />
(growth in output) during the period under consideration did not contribute<br />
significantly to socio-economic development. That was then.<br />
However, what needs to be put in the right perspective is the fact that<br />
socio-economic development in <strong>Brunei</strong> Darussalam is unique. Forward<br />
and backward linkages and consumption linkage may be minimal but<br />
fiscal linkage is strong. Today, the government, for example, has been an<br />
important source of employment opportunities for its people, afforded to<br />
<strong>Brunei</strong>ans a wide range of social services and in many cases virtually<br />
free. Sustainability, of course is the most pertinent issue in this respect.<br />
The quality of life or standard of living is also related to the costs of living.<br />
If the costs to support decent lifestyles are high, it will translate into<br />
a decline in the purchasing power of nominal dollar. Generally, the costs<br />
of living are associated with the rates of inflation. The higher the rates of<br />
inflation in an economy, the more expensive it is to purchase goods of<br />
the same worth as before. The trend for the rates of inflation for <strong>Brunei</strong><br />
Darussalam between 1986 and 2003 is shown in CHART 2. On average,<br />
the rate of inflation during the period is approximately 1.5 percent,<br />
which is quite low and satisfies the national long-term objective to maintain<br />
a moderate rate of inflation. However, there are a few exceptions<br />
during the period where the rates are very much higher in 1993 (4.3 percent)<br />
and 1995 (6.0 percent). Apart from that, <strong>Brunei</strong> Darussalam has also<br />
experienced a deflation of -2.3 percent in 2002. A deflation is a situation<br />
where an economy experiences a decrease in the general price level.<br />
Typically, the benefits of deflation go to consumers and purchasers of<br />
intermediate inputs.<br />
The control or stabilization of price levels in <strong>Brunei</strong> Darussalam is<br />
mainly sought through administrative procedures rather than through<br />
monetary devices (policies) as usually practiced in other economies. The<br />
trend in the rates of inflation in <strong>Brunei</strong> Darussalam reflects the country’s<br />
trade policies. The increase in the rate of inflation in 1995, for example,<br />
was in line with the government’s decision to increase import duties on<br />
automobiles in early 1995; from 20 percent to as high as 200 percent according<br />
to engine capacity. When the government made a u-turn in November<br />
2001 by decreasing the the import duties to their original acrossthe-board<br />
rate of 20 percent (15 percent for heavy vehicles), the policy is<br />
reflected in the negative inflation rate for 2002. Apart from policies as<br />
such, the government had also enacted the Price Control Act in 1977.<br />
Continuous monitoring has been practiced to prevent deliberate price<br />
increases.<br />
However, because <strong>Brunei</strong> Darussalam imports almost all of its economic<br />
requirements, it has not been able to contain inflationary pressures arising<br />
out of its import trading partners. In this regard, <strong>Brunei</strong> Darussalam<br />
faces the policy dilemma that befits common interests, between nations<br />
as well as between consumers and producers within <strong>Brunei</strong> Darussalam.<br />
The adoption of import substitution policy, for example, will become<br />
more meaningful if the costs of production in this country are low and<br />
competitive. To some extent, such a policy will enable <strong>Brunei</strong> Darussalam<br />
to reduce imported inflation. Never the less, the participation and<br />
membership of <strong>Brunei</strong> Darussalam in ASEAN Free Trade Arrangement<br />
(AFTA), for example, is beneficial to consumers even though this may<br />
have some negative effects on potential producers of homogenous or<br />
related goods.<br />
CHART 3 indicates the rate of inflation for <strong>Brunei</strong> Darussalam relative to<br />
those rates experienced by ASEAN4. In comparing the inflation rates for<br />
<strong>Brunei</strong> Darussalam with respect to the ASEAN4 rates, there is a general
BRUNEI ECONOMIC BULLETIN<br />
P AGE 25<br />
THE LONG TERM OBJECTIVES OF BRUNEI DARUSSALAM’S DEVELOPMENT PLAN OF 1986-<br />
2005: What has been the level of achievement in enhancing the quality of life?<br />
%<br />
CHART 4<br />
LITERACY RATES FOR BRUNEI DARUSSALAM AND<br />
SELECTED<br />
100<br />
98<br />
96<br />
94<br />
92<br />
90<br />
88<br />
86<br />
84<br />
82<br />
94.7<br />
87.9<br />
92.5<br />
<strong>Brunei</strong> Darussalam Malaysia Singapore Japan South Korea Hong Kong<br />
99.0<br />
97.9<br />
93.5<br />
trend that the rates for <strong>Brunei</strong> Darussalam is lower especially when<br />
compared to that of the Philippines, Thailand and Malaysia. After 1995,<br />
the inflation rates of <strong>Brunei</strong> Darussalam were a mirror image of the rates<br />
of inflation of Singapore. While Malaysia, Thailand and the Philippines<br />
were adversely affected, <strong>Brunei</strong> Darussalam (and Singapore) seemed to<br />
have been insulated from the negative effects of the Asian Financial Crisis<br />
in 1998. The effects of the financial crisis had been prominent on the<br />
exchange rates of countries in the region but the effects were relatively<br />
in favour of the <strong>Brunei</strong>an currency. Both Malaysia and Singapore are<br />
major trading partners of <strong>Brunei</strong> Darussalam, especially as a source of<br />
imports. The deflation in 2002 for <strong>Brunei</strong> Darussalam reflects not only<br />
on the trade policy it has adopted, but also on the movement of inflation<br />
rates in its trading partners. Specifically, as observed in Chart 3, this is<br />
shown by the identical trend in the direction of Singapore’s inflation<br />
rate. The stabilization effects of the rates of inflation in the other ASEAN<br />
countries seemed to be at work during the period under consideration.<br />
In this case, observe that the inflation rates for Singapore, Philippines<br />
and Thailand move in the downward direction. In other words, since we<br />
import substantially from these countries, any downward trend in their<br />
inflation rates will translate into lower rate of inflation for <strong>Brunei</strong> Darussalam.<br />
Human resources development is an important basis for the improvement<br />
of the quality of life. When the level and quality of education improved<br />
over time, in general it is associated with the same improvement<br />
in the quality of life of individuals employed with higher wages. In its<br />
unrelenting efforts to ensure a high quality of life of the people, the government<br />
has undertaken numerous programs that give direct effects to<br />
the quality of life especially in education, medical and health and housing.<br />
In the areas of education, programs related to the provision of basic<br />
infrastructure and human resources development has been undertaken<br />
and progressing. The country’s achievement in education has been relatively<br />
high. Indicators such as the literacy rate and the rate of enrolment<br />
in educational institutions are at par with, if not better than, the more<br />
developed nations.<br />
The rates of literacy depicted in CHART 4 shows the rate for <strong>Brunei</strong><br />
Darussalam in relation to the rates for regional economies in 2001. The<br />
literacy rate (94.7 percent) for <strong>Brunei</strong> Darussalam is relatively high. It is<br />
higher than the rates for Singapore, Malaysia and Hong Kong although<br />
far below that of Japan and South Korea. What is more important for<br />
<strong>Brunei</strong> Darussalam apart from improving the rates of literacy and registration<br />
in educational institutions is to ensure a high level of quality of<br />
its human resources that could help bring the country forward. This<br />
issue becomes more relevant in an era where the competitive advantage<br />
of a nation is the educational quality of its people especially in the areas<br />
of science and technology and research and development.<br />
A number of other indicators could be utilized to gauge both the quality<br />
and quantity of educational standards apart from the literacy rates. Indicators<br />
such as registration in educational institutions, the<br />
teacher:student ratio, the percentage of students in tertiary education as<br />
well as the proportion of expenditure on education out of total expenditure,<br />
all have shown encouraging developments and helps positively<br />
towards improving the quality of life of <strong>Brunei</strong>ans.<br />
Reflections about the quality of life could also be seen through health<br />
indicators. In this context, the indicator of life expectancy is the general<br />
measurement for the quality of life of the people. Life expectancy indicator<br />
is vital as it reflects socio-economic progress in connection to life<br />
styles, access to medical and health services as well as the implied development<br />
in other aspects of medical and health. In this respect, the<br />
government has also played important roles in ensuring high health<br />
standards through the implementation of various programs and strategies<br />
within and outside of the National Development Plans. Improvement<br />
in the quality of life has also directly helped the development in
P AGE 26<br />
BRUNEI ECONOMIC BULLETIN<br />
THE LONG TERM OBJECTIVES OF BRUNEI DARUSSALAM’S DEVELOPMENT PLAN OF 1986-<br />
2005: What has been the level of achievement in enhancing the quality of life?<br />
Years<br />
%<br />
CHART 5<br />
LIFE EXPECTANCY RATES FOR BRUNEI DARUSSA-<br />
LAM AND SELECTED ASIAN COUNTRIES, 2001<br />
82<br />
80<br />
78<br />
76<br />
74<br />
72<br />
70<br />
68<br />
76.1<br />
72.8<br />
78.1<br />
81.3<br />
75.2<br />
79.7<br />
<strong>Brunei</strong> Darussalam Malaysia Singapore Japan South Korea Hong Kong<br />
CHART 6<br />
INFANT MORTALITY RATES FOR BRUNEI DARUSSA-<br />
LAM AND SELECTED ASIAN NATIONS, 2001<br />
9<br />
8<br />
7<br />
6<br />
5<br />
4<br />
3<br />
2<br />
1<br />
0<br />
6.8<br />
8.0<br />
3.0 3.0<br />
<strong>Brunei</strong> Darussalam Malaysia Singapore Japan South Korea<br />
TABLE 1<br />
THE AVERAGE SIZE OF HOUSEHOLD IN BRUNEI DA-<br />
RUSSALAM<br />
5.0<br />
1981 1991 2001<br />
Average size of household 5.8 5.8 6.0<br />
medical and health especially medical and health services supplied by<br />
the private sector. In a way this has lightened the burden of the government<br />
in terms of its medical and health expenditures.<br />
CHART 5 gives another picture about the quality of life in <strong>Brunei</strong> Darussalam<br />
where the life expectancy in 2001 is 76.1 years which is lower<br />
compared to 78.1 years for Singapore and 81.3 years for Japan. Never<br />
the less, the life expectancy for <strong>Brunei</strong> Darussalam is higher compared<br />
to Malaysia and South Korea. On a gender basis, in 2001 the life expectancy<br />
for male is 74.0 years while it is 77.1 years for the female. This is<br />
an improvement compared to 1991 where the rates are 72.1 years for the<br />
male and 76.5 for the female. In reflecting the relationship between GDP<br />
Per Capita and Life Expectancy, especially for Japan, Hong Kong and<br />
Singapore, there seemed to be some correlation between the two variables.<br />
This implies that one of the important policies is to improve on<br />
income generation. But the trend in the kind of diseases and health<br />
problems inflicting the <strong>Brunei</strong>an population, i.e. those related to affluence<br />
such as heart diseases, cancer, hypertension, obesity and diabetes,<br />
signals to the needs of non-income policies.<br />
Apart from life expectancy rates, health quality could also be associated<br />
with the indicator of infant mortality per 1,000 births. This indicator is a<br />
reflection of the success, or otherwise, of health-care programs as well as<br />
the level of health-care awareness. For <strong>Brunei</strong> Darussalam, the mortality<br />
rate of 6.8 per 1,000 births shows some positive development even<br />
though this rate is higher compared to those experienced by the more<br />
developed nations such as Singapore and Japan. (CHART 6) Indeed,<br />
this rate is far lower compared to 21.7 per 1,000 births in 1979 and 12.1<br />
per thousand births in 1985. Efforts, though, needs to be multipled to<br />
narrow the gap between that experienced by <strong>Brunei</strong> Darussalam and<br />
other countries which have lower infant mortality rates.<br />
The ability to acquire a decent dwelling is also one of the basic necessities<br />
for a respectable standard of living. A number of factors could be<br />
taken into consideration when analyzing issues related to housing. This<br />
includes the ability to purchase and the cost of housing, household overcrowding,<br />
house ownership and the role of the government in providing<br />
and subsidizing the purchase of housing. Overcrowding in a household<br />
could be analyzed through the indicator of the size of household.<br />
This indicator is vital in determining accessibility and ability to purchase<br />
a home, especially for the head of a household. For the low income<br />
earner and those with limited ability to ownership usually share a<br />
home with other family members. This indicator also tells the extent of<br />
housing needs of the masses. Apart from those issues, an overcrowded<br />
dwelling may lead to undesirable health and educational problems.<br />
For <strong>Brunei</strong> Darussalam, the provision of housing and facilitation of<br />
house ownership has been one of the many priorities of the government.<br />
This includes the provision of zero interest loan schemes for government<br />
employees, housing schemes of various kinds, resettlement and<br />
land ownership for its citizens. The achievement in the provision of<br />
housing through housing schemes has been far below the ideal level.<br />
The waiting list for housing scheme continued to be long, perhaps,<br />
partly due to the rapid population growth in the 1980’s.<br />
In general, TABLE 1 shows the average size of household in <strong>Brunei</strong> Darussalam.<br />
The stagnating size of household in <strong>Brunei</strong> Darussalam since<br />
the early 1980’s signals the need to step-up effort and efficiency in housing<br />
provision especially in the process of housing development 6 . Even<br />
though the population growth for <strong>Brunei</strong> Darussalam has declined to<br />
2.5 percent in 2001 compared to 3.1 percent in 1991, the demand for<br />
housing has increased overwhelmingly. This was partly due to the<br />
population structure of <strong>Brunei</strong> Darussalam where a very large percentage<br />
consists of the young population. In the future, the demand for<br />
housing is bound to be high as well, as the population structure<br />
changed very little since the 1980’s.<br />
6 The slightly higher average size of household in 2001 (6.0 persons) may be due to the employment of domestic helpers, personal drivers and gardeners.
BRUNEI ECONOMIC BULLETIN<br />
P AGE 27<br />
THE LONG TERM OBJECTIVES OF BRUNEI DARUSSALAM’S DEVELOPMENT PLAN OF 1986-<br />
2005: What has been the level of achievement in enhancing the quality of life?<br />
TABLE 2: THE APPLICATIONS FOR AND PROVISION<br />
OF HOUSING UNDER THE NATIONAL HOUSING<br />
SCHEME<br />
2001 2002 2003<br />
APPLICATIONS 15,735 15,297 15,128<br />
PROVISION OF<br />
HOUSING<br />
438 169 264<br />
SHORTFALL (15,297) (15,128) (14,864)<br />
300,000<br />
250,000<br />
200,000<br />
Ha 150,000<br />
100,000<br />
50,000<br />
0<br />
<strong>Brunei</strong>-Muara Belait Tutong Temburong<br />
District Area<br />
Source: Department of Forestry Website<br />
♦<br />
♦<br />
♦<br />
♦<br />
♦<br />
♦<br />
♦<br />
Estimated areas covered by forest<br />
BOX 3<br />
STRATEGIES TO ENSURE CLEAN AND<br />
HEALTHY ENVIRONMENT<br />
Ensure optimal utilization of natural resources<br />
Prevent and reduce the negative effects on<br />
the environment as a result of population<br />
growth and human activities<br />
Ensue a balance between socio-economic<br />
objectives and a quality and sustainable<br />
environmental concerns<br />
Increase the utilization of latest and environment<br />
friendly technology<br />
Enhance control and enforcement mechanism<br />
Enhance awareness of and support from the<br />
public<br />
Improve on existing public amenities and<br />
services<br />
In TABLE 2, the issue of housing in <strong>Brunei</strong> Darussalam could be observed<br />
where the provision of houses to the masses through a number<br />
of government housing schemes are unable to meet the increasing demand.<br />
From the demand side, the population structure as mentioned<br />
above is an important variable. This is also true of the levels of income<br />
which play differing roles. From one perspective, for a family with a low<br />
income per capita this may force them to share dwelling with their close<br />
relative, or if affordable, may choose a low-cost housing scheme. From<br />
the other point of view, for a family with above average to high per capita<br />
income they may opt for a corresponding housing scheme such as<br />
the government employee housing scheme. Whatever the circumstances,<br />
the national housing scheme undoubtedly is faced with excessive<br />
demand due to a number of factors such as the availability of financial<br />
loans, provision of land for housing development and infrastructural<br />
facilities.<br />
As we have observed, the main issue faced by the authority is a situation<br />
where the demand for housing scheme is far in excess of the ability<br />
to supply or provide it. Generally, between 2001 and 2003, the national<br />
housing scheme has been able to provide to less than 2.0 percent of the<br />
demand. This implies and necessitates a reassessment of both the housing<br />
and related policy itself as well as the mechanism in the provision of<br />
the houses. As iterated above, a shortfall in housing leads to negative<br />
implications to the people.<br />
The natural as well as the built environment have important roles in<br />
helping to maintain if not improve the quality of life of the people. The<br />
quality of life can also be measured based on a few indicators such as<br />
forest coverage, air and water quality, the quality of piped water and the<br />
quality of natural environment such as beaches and river as well as the<br />
built environment. Population growth and economic growth usually<br />
exert pressure on the sustainability and richness of the natural environment.<br />
Strains due to urbanization and its enlargement and industrial<br />
development lead to issues related to the system and management of<br />
drainage, waste disposal and sewerage.<br />
In <strong>Brunei</strong> Darussalam, population growth has indeed put a strain on the<br />
balance between the enlargement of urban areas and the natural environment.<br />
Even though the total area covered by virgin forest is still<br />
abundant compared to developed areas (CHART 7), there are areas<br />
such as the <strong>Brunei</strong> and Muara district with high population density and<br />
rapid economic growth, that have shown symptoms of strain and imbalance.<br />
In terms of air and water quality, <strong>Brunei</strong> Darussalam is relatively<br />
free from pollution due to the limited number of industries. Never the<br />
less, proactive approach is necessary in monitoring pollutants such as<br />
those from light industries in the form of used oil and household effluents.<br />
With regard to the supply of clean piped water, <strong>Brunei</strong> Darussalam<br />
has scored highly, where clean water is distributed to nearly 100 percent<br />
of the population.<br />
The government, on its part, has persistently embarked on efforts to<br />
ensure environmental awareness among the public. The establishment<br />
of the Department of Environment, Parks and Recreation in May 2002 is<br />
a commitment towards environmental concern. This department has<br />
developed strategies to maintain and to ensure appropriate and positive<br />
environment to enhance the quality of life. (BOX 3)
P AGE 28<br />
BRUNEI ECONOMIC BULLETIN<br />
THE LONG TERM OBJECTIVES OF BRUNEI DARUSSALAM’S DEVELOPMENT PLAN OF 1986-<br />
2005: What has been the level of achievement in enhancing the quality of life?<br />
CONCLUSION<br />
In general, it could be concluded that from the perspective of the quality<br />
of life, <strong>Brunei</strong> Darussalam’s achievements in enhancing it is at par if not<br />
better than those attained by some developed countries. All those indicators<br />
that have been discussed above are only a few of the available<br />
indicators to describe the quality of life of <strong>Brunei</strong>ans. Also, those are<br />
only general indicators and there are many others that are more specific<br />
and able to deepen our knowledge about the quality of life.<br />
In the past, the government played instrumental roles in enhancing the<br />
quality of life of the people. This role will undoubtedly be necessary in<br />
the future. However, efforts must be stepped-up to ensure a larger and<br />
active participation of individuals and the private sector in this direction.<br />
Policies that can differentiate between those who really deserve<br />
government’s help, in education and health, for example, need to be<br />
formulated. Policies that help minimize the burden of the government<br />
are important, but so are those that support the growth and development<br />
of the private sector.<br />
While some indicators of the quality of life of <strong>Brunei</strong>ans show some degree<br />
of accomplishment, others are less persuasive. We noted that<br />
<strong>Brunei</strong> Darussalam has been successful in improving some social aspects<br />
of development but the economic element remained to be desired.<br />
Specifically, the GDP per Capita has been declining since the middle of<br />
the eighties. Furthermore, the bulk of it arises out of the oil and gas sector.<br />
In other words, income from the non-oil private sector has been less<br />
significant compared with that derived from the oil and gas sector. Inadvertently,<br />
this feature has implicated some segment of the population in<br />
a negative way. The number of unemployed locals has been growing<br />
which give rise to some negative social issues.<br />
Therefore, it is in the best interest of the nation that future development<br />
planning should focus on enhancing economic growth which brings<br />
along with it job opportunities and eventually improvement in the quality<br />
of life of the masses. While the role of the private sector is vital to<br />
economic growth, the role of the government in the overall socioeconomic<br />
development is equally important. Development planning for<br />
the next 20-30 years should include to augment government’s efficiency<br />
in its role to speedily enhance the quality of education at all levels via<br />
human resources development, research and development, IT and science<br />
and technology development; to efficiently facilitate ownership of<br />
housing; to provide proficiently health and medical facilities; to ensure<br />
sound environmental safety and to provide resourcefully state-of-the-art<br />
physical infrastructure. Efficiency and timely provision of all these will<br />
certainly contribute immensely to development and nation-building as a<br />
whole.
V OLUME 3, ISSUE 2 P AGE 29<br />
Miscellaneous<br />
LIST OF JPKE PUBLICATIONS AVAILABLE FOR PURCHASE<br />
No. List BND<br />
1. <strong>Brunei</strong> Darussalam Statistical Yearbook 82 / 83, 83/84 7.00<br />
2. <strong>Brunei</strong> Darussalam Statistical Yearbook 2000 / 2001, 2002 8.00<br />
3. <strong>Brunei</strong> Statistics of External Trade 1991, 1992, 1993, 1994, 2001, 2002 20.00<br />
4. Vital Statistics 1991, 1992, 1993, 1994, 1998, 2000, 2001, 2002, 7.00<br />
5. 6th and 7th National Development Plan 1991-1995 30.00<br />
6. Seventh National Development Plan 1996-2000 15.00<br />
7. Rancangan Kemajuan Negara ke 7 1996-2000 15.00<br />
8. Rancangan Kemajuan Negara ke 4 1980-1984 7.00<br />
9. Summary Tables of the <strong>Brunei</strong> Population Census 1991 20.00<br />
10. Report on the 1991 Population Census 20.00<br />
11. Report on the 1991 Housing Census 20.00<br />
12. Report on the Labour Force Survey 1995 10.00<br />
13. Demographic Situation & Population Projection 1991 – 2011 10.00<br />
14. PERJALANAN NBD memasuki ALAF BARU (Kulit Nipis) 25.00<br />
15. PERJALANAN NBD memasuki ALAF BARU (Kulit Tebal) 40.00<br />
16. The JOURNEY <strong>Brunei</strong> Darussalam into the next Millennium (Hard Cover) 40.00<br />
17. Preliminary Report of the Population and Housing Census 2001 2.50<br />
18. Consumer Price Index for Negara <strong>Brunei</strong> Darussalam Base 1990 = 100 7.00<br />
19. Preliminary Report of the 2002 <strong>Economic</strong> Census 2.50<br />
JPKE HOTLINE<br />
• JPKE has dedicated a hotline for the public to make any inquiries, complaints, and comments, regarding<br />
prices, sales and promotion activities.<br />
• The hotline is 2230223 is located at Level 3 (West Wing) Department of Implementation and Monitoring,<br />
JPKE, Jalan Ong Sum Ping, Bandar Seri Begawan, BA1311. The hotline operates during office hours.<br />
• With this initiative, it is hoped that JPKE can provide and maintain quality assurance services to the public.<br />
The Editors Welcome any comments and suggestions from readers through:-<br />
THE EDITOR<br />
BRUNEI ECONOMIC BULLETIN (BEB)<br />
JPKE (DEPARTMENT OF ECONOMIC PLANNING AND DEVELOPMENT)<br />
PRIME MINISTER’S OFFICE<br />
BLOCK 2A<br />
JALAN ONG SUM PING<br />
BANDAR SERI BEGAWAN, BA1311<br />
All rights reserved. Copyright of the Government of His Majesty The Sultan and Yang Di Pertuan<br />
of <strong>Brunei</strong> Darussalam. No part of this publication may be reproduced in any material form or by<br />
any means, electronic or mechanical, including photocopying, recording or in any information<br />
storage or retrieval system without prior permission from the Government, except for permitted<br />
fair dealing under Copyright Order 2000.<br />
© 2002
BRUNEI ECONOMIC BULLETIN<br />
Supplementary Copy<br />
Volume 3, <strong>Issue</strong> 2<br />
Date : 09/2004<br />
THE EDITOR<br />
BRUNEI ECONOMIC BULLETIN (BEB)<br />
JPKE (DEPARTMENT OF ECONOMIC PLANNING AND DEVELOPMENT)<br />
PRIME MINISTER’S OFFICE<br />
Approved Price Certificate <strong>Issue</strong>d During the Second Quarter 2004<br />
COMPANIES<br />
TYPES /<br />
CERTIFICATE SR PRICES<br />
ACCESSORIES<br />
CAR MODELS<br />
REFERENCE (BND)<br />
GHK<br />
MITSUBISHI AIRTREK TURBO 4WD 07/04/2004 47,750.00<br />
MOTORS 2.0 A/T JPKE/PC/50/4<br />
MITSUBISHI GRANDIS 2.4 A/T 06/05/2004 45,350.00<br />
JPKE/PC/50/4<br />
MITSUBISHI MAGNA VR A/T 08/05/2004 44,750.00<br />
F38ATYGERJ<br />
JPKE/PC/50/4<br />
MITSUBISHI L200 2.8 DOUBLE CAB TURBO 08/05/2004 43,600.00<br />
4WD 4A/T (K77TGJERXFRU)<br />
JPKE/PC/50/4<br />
CHEVROLET OPTRA 1.6 M/T 27/05/2004 19,950.00<br />
JPKE/PC/50/4<br />
MITSUBISHI OUTLANDER 2.4 A/T 27/05/2004 39,400.00<br />
JPKE/PC/50/4<br />
MITSUBISHI AIRTREK 2WD A/T 02/06/2004 35,050.00<br />
JPKE/PC/50/4<br />
SETIA<br />
HYUNDAI ACCENT 5 DRS 1.5 GL A/T 26/05/2004 17,750.00<br />
MOTORS<br />
JPKE/PC/50/03PT II<br />
QAF AUTO BMW 318 I TOURING 5DRS SALOON 15/05/2004 79,850.00<br />
(MOEL 2003-PETROL)<br />
JPKE/PC/50/14<br />
BMW 325 CI CABRIOLET 2DRS SALOON 15/05/2004 88,550.00<br />
JATI<br />
TRANSPORT<br />
(MODEL 2003- PETROL)<br />
JPKE/PC/50/14<br />
BMW 520 I A/T 27/05/2004 92,550.00<br />
JPKE/PC/50/14<br />
BMW 525 I AUTO 4DRS (MODEL 2003) 03/06/2004 106,850.00<br />
JPKE/PC/50/14<br />
BMW 530 I AUTO 4DRS ( MODEL 3003) 03/06/2004 126,950.00<br />
JPKE/PC/50/14<br />
MERCEDES-BENZ S 280 27/05/2004 156,750.00<br />
JPKE/PC/50/13<br />
MERCEDES-BENZ E320 27/05/2004 141,550.00<br />
JPKE/PC/50/13<br />
MERCEDES-BENZ E 200 K 27/05/2004 100,900.00<br />
JPKE/PC/50/13<br />
MERCEDES-BENZ S350L 27/05/2004 170,400.00<br />
JPKE/PC/50/13<br />
MERCEDES-BENZ E 240 17/06/2004 115,500.00<br />
JPKE/PC/50/13<br />
SOME ON THE ROAD (OTR) PRICES DO NOT INCLUDE OPTIONAL ACCESSORIES AS<br />
LISTED. PLEASE CARE TO CHECK PRICE CERTIFICATES<br />
SR.:- Show Room<br />
Inside this issue:<br />
GHK Motors 1<br />
Setia Motors 1<br />
QAF Auto 1<br />
Jati Transport 1<br />
Boustead 2<br />
Grand Motors 2<br />
Happy Motoring 2<br />
Premier Automobiles 2<br />
TCY Motors 2<br />
United Motors 2<br />
Lau Motor Sdn Bhd 3<br />
Maju Motors 3<br />
Phone: +673-2-233344<br />
Fax: +673-2-230226<br />
Email: info@jpke.gov.bn
P AGE 2<br />
BRUNEI ECONOMIC BULLETIN<br />
Approved Price Certificate <strong>Issue</strong>d During the Second Quarter 2004<br />
COMPANIES<br />
BOUSTEAD<br />
TYPES /<br />
CERTIFICATE<br />
ACCESSORIES<br />
CAR MODELS<br />
REFERENCE<br />
NISSAN PATROL GRX S/WAGON A/T 07/04/2004<br />
SPECIAL VERSION (TWSSRHAY61URAC-C<br />
JPKE/PC/29/13PT VII<br />
SUZUKI LIANA 1.6 H/BACK 24/04/2004<br />
5M/T<br />
JPKE/PC/29/13PT VII<br />
SUZUKI LIANA 1.6 H/BACK 24/04/2004<br />
4A/T<br />
JPKE/PC/29/13PT VII<br />
KIA PICANTO 1.1L EX 24/04/2004<br />
M./T<br />
JPKE/PC/29/13PT VII<br />
NISSAN X-TRAIL COMFORT 4A/T 22/05/2004<br />
JPKE/PC/29/13PT VII<br />
NISSAN TERRANO SE 7 SEATER DIESEL A/T 25/05/2004<br />
JPKE/PC/29/13PT VII<br />
NISSAN TERRANO SLX 7 SEATER DIESEL M/T 25/05/2004<br />
JPKE/PC/29/13PT VII<br />
SUZUKI GRAND VITARA 1.6 3DRS A/T 25/05/2004<br />
JPKE/PC/29/13PT VII<br />
SUZUKI GRAND VITARA 1.6 3DRS MA/T 25/05/2004<br />
JPKE/PC/29/13PT VII<br />
SUZUKI GRAND VITARA 1.6 5DRS A/T 25/05/2004<br />
JPKE/PC/29/13PT VII<br />
SUZUKI IGNIS SPORT 1.5 3DRS H/B M/T 25/05/2004<br />
JPKE/PC/29/13PT VII<br />
SR PRICES<br />
(BND)<br />
61,950.00<br />
23,250.00<br />
24,350.00<br />
15,800.00<br />
35,200.00<br />
57,250.00<br />
48,300.00<br />
30,200.00<br />
27,950.00<br />
29,900.00<br />
20,300.00<br />
GRAND MOTORS<br />
KIA PICANTO 1.1L EX M/T 24/04/2004<br />
JPKE/PC/50/15<br />
15,800.00<br />
KIA PICANTO 1.1L EX A/T 10/05/2004<br />
JPKE/PC/50/15<br />
17,350.00<br />
MAZDA F/L MX-5 1.8L 2DRS CONVERTIBLE 05/05/2004<br />
DOHC 6-SPEED M/T ND61 AAC<br />
JPKE/PC/50/15<br />
42,650.00<br />
HAPPY MOTORING HONDA ODYSSEY 2.4 EXV 07/06/2004 47,500.00<br />
WAGON A/T<br />
JPKE/PC/50/8<br />
PREMIER<br />
AUTOMOES<br />
FORD FOCUS 4DRS 1.6 COMFORT ST3 08/05/2004 21,300.00<br />
M/T GASOLINE<br />
JPKE/PC/50/18<br />
FORD ESCAPE 2.3 LITRE XLS A/T 4WD 28/06/2004 42,250.00<br />
JPKE/PC/50/18<br />
TCY MOTORS SSANGYONG REXTON RX 270 A/T 24/04/2004 47,900.00<br />
DIESEL<br />
JPKE/PC/50/2<br />
SSANGYONG REXTON RX 290 M/T 04/05/2004 35,900.00<br />
DIESEL<br />
JPKE/PC/50/2<br />
AUDI TT3.2 QUATTRO DSG A/T 12/06/2004 95,750.00<br />
8N30BL<br />
JPKE/PC/50/2<br />
AUDI S4 TIP A/T 12/06/2004 147,250.00<br />
8E2S4L<br />
JPKE/PC/50/2<br />
UNITED MOTORS VOLVO XC 90 T6 SUV 4WD A/T 2.9 cc 14/04/2004 102,850.00<br />
JPKE/PC/50/7<br />
SOME ON THE ROAD (OTR) PRICES DO NOT INCLUDE OPTIONAL ACCESSORIES AS LISTED. PLEASE CARE TO<br />
CHECK PRICE CERTIFICATES<br />
SR.:- Show Room
BRUNEI ECONOMIC BULLETIN<br />
P AGE 3<br />
Approved Price Certificate <strong>Issue</strong>d During the Second Quarter 2004<br />
COMPANIES<br />
TYPES /<br />
CAR MODELS<br />
ACCESSORIES<br />
CERTIFICATE<br />
REFERENCE<br />
SR PRICES<br />
(BND)<br />
LAU MOTOR<br />
SDN BHD<br />
SUBARU IMPREZA 4D 2.0 GX AWD 05/05/2004 33,300.00<br />
5M/T<br />
JPKE/PC/50/10<br />
SUBARU IMPREZA 4D 2.0 STI AWD 05/05/2004 66,650.00<br />
6M/T<br />
JPKE/PC/50/10<br />
SUBARU IFORESTER SW 2.5 AWD 05/05/2004 46,100.00<br />
XS 4A/T<br />
JPKE/PC/50/10<br />
SUBARU LEGACY 4D AWD 2.0 I 05/05/2004 42,600.00<br />
4A/T<br />
JPKE/PC/50/10<br />
SUBARU LEGACY 4D AWD 2.0 GT 05/05/2004 60,850.00<br />
5A/T<br />
JPKE/PC/50/10<br />
SUBARU LEGACY SW AWD 2.0 I 05/05/2004 45,650.00<br />
4A/T<br />
JPKE/PC/50/10<br />
SUBARU LEGACY SW AWD 2.0 GT 05/05/2004 67,800.00<br />
SPEC B 5A/T<br />
JPKE/PC/50/10<br />
SUBARU OUTBACK AWD 2.5 I 05/05/2004 54,100.00<br />
A/T<br />
JPKE/PC/50/10<br />
SUBARU OUTBACK AWD 2.5 I 05/05/2004 49,550.00<br />
LUXURY A/T<br />
JPKE/PC/50/10<br />
MAJU MOTORS VOLKSWAGEN POLO 1.4 A/T 2DRS 05/04/2004 28,900.00<br />
HATCH BACK<br />
JPKE/PC/50/16<br />
VOLKSWAGEN POLO 1.4 A/T 4DRS 05/04/2004<br />
32,850.00<br />
HATCH BACK<br />
JPKE/PC/50/16<br />
VOLKSWAGEN POLO 1.4 M/T 2DRS 05/04/2004 31,900.00<br />
HATCH BACK<br />
JPKE/PC/50/16<br />
VOLKSWAGEN POLO 1.4 M/T 4DRS 05/04/2004<br />
29,800.00<br />
HATCH BACK<br />
RENAULT KANGOO 1.9 M/T 5DRS<br />
HATCHBACK<br />
DIESEL<br />
RENAULT VELSATIS 3.5 A/T 5DRS<br />
HATCHBACK<br />
PETROL<br />
RENAULT MEGANE 1.6 A/T 4DRS SEDAN<br />
PETROL<br />
RENAULT MEGANE 1.4 M/T 4DRS SEDAN<br />
PETROL<br />
RENAULT MEGANE II SPORT HATCH 1.6 A/T<br />
3DRS PETROL<br />
JPKE/PC/50/16<br />
13/04/2004<br />
JPKE/PC/50/16<br />
13/04/2004<br />
JPKE/PC/50/16<br />
13/04/2004<br />
JPKE/PC/50/16<br />
13/04/2004<br />
JPKE/PC/50/16<br />
11/05/2004<br />
26,500.00<br />
69,000.00<br />
31,600.00<br />
27,600.00<br />
32,850.00<br />
SOME ON THE ROAD (OTR) PRICES DO NOT INCLUDE OPTIONAL ACCESSORIES AS LISTED. PLEASE CARE TO<br />
CHECK PRICE CERTIFICATES<br />
SR.:- Show Room
P AGE 4<br />
BRUNEI ECONOMIC BULLETIN<br />
Notes