A novel fuzzy clustering algorithm based on a fuzzy scatter matrix ...
A novel fuzzy clustering algorithm based on a fuzzy scatter matrix ...
A novel fuzzy clustering algorithm based on a fuzzy scatter matrix ...

You also want an ePaper? Increase the reach of your titles
YUMPU automatically turns print PDFs into web optimized ePapers that Google loves.
644 K.-L. Wu et al. / Pattern Recogniti<strong>on</strong> Letters 26 (2005) 639–652<br />
will move away from x with a corresp<strong>on</strong>ding<br />
weighted term g i . Since g i is a m<strong>on</strong>ot<strong>on</strong>e increasing<br />
functi<strong>on</strong> of b, the cluster centers obtained by FCS<br />
with a large b value will be more far away from x<br />
than the centers obtained with a small b value. The<br />
proposed FCS <str<strong>on</strong>g>clustering</str<strong>on</strong>g> <str<strong>on</strong>g>algorithm</str<strong>on</strong>g> is summarized<br />
as follows:<br />
FCS Algorithm 1. (see also Yang et al.<br />
(2003)) Set the iterati<strong>on</strong> counter ‘ = 0 and choose<br />
the initial values a ð0Þ<br />
i , i =1,...,c. Given b, e >0<br />
Step 1. Find g ð‘þ1Þ<br />
i using (15)<br />
Step 2. Find l ð‘þ1Þ<br />
ij using (13)<br />
Step 3. Find a ð‘þ1Þ<br />
i using (14)<br />
Increment ‘; until max i ka ð‘þ1Þ<br />
i<br />
a ð‘Þ<br />
i k < e.<br />
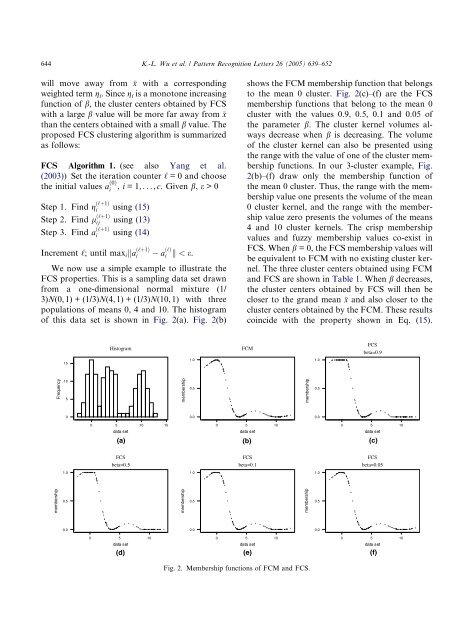
We now use a simple example to illustrate the<br />
FCS properties. This is a sampling data set drawn<br />
from a <strong>on</strong>e-dimensi<strong>on</strong>al normal mixture (1/<br />
3)N(0, 1) + (1/3)N(4, 1) + (1/3)N(10, 1) with three<br />
populati<strong>on</strong>s of means 0, 4 and 10. The histogram<br />
of this data set is shown in Fig. 2(a). Fig. 2(b)<br />
shows the FCMmembership functi<strong>on</strong> that bel<strong>on</strong>gs<br />
to the mean 0 cluster. Fig. 2(c)–(f) are the FCS<br />
membership functi<strong>on</strong>s that bel<strong>on</strong>g to the mean 0<br />
cluster with the values 0.9, 0.5, 0.1 and 0.05 of<br />
the parameter b. The cluster kernel volumes always<br />
decrease when b is decreasing. The volume<br />
of the cluster kernel can also be presented using<br />
the range with the value of <strong>on</strong>e of the cluster membership<br />
functi<strong>on</strong>s. In our 3-cluster example, Fig.<br />
2(b)–(f) draw <strong>on</strong>ly the membership functi<strong>on</strong> of<br />
the mean 0 cluster. Thus, the range with the membership<br />
value <strong>on</strong>e presents the volume of the mean<br />
0 cluster kernel, and the range with the membership<br />
value zero presents the volumes of the means<br />
4 and 10 cluster kernels. The crisp membership<br />
values and <str<strong>on</strong>g>fuzzy</str<strong>on</strong>g> membership values co-exist in<br />
FCS. When b = 0, the FCS membership values will<br />
be equivalent to FCMwith no existing cluster kernel.<br />
The three cluster centers obtained using FCM<br />
and FCS are shown in Table 1. When b decreases,<br />
the cluster centers obtained by FCS will then be<br />
closer to the grand mean x and also closer to the<br />
cluster centers obtained by the FCM. These results<br />
coincide with the property shown in Eq. (15).<br />
Histogram<br />
FCM<br />
FCS<br />
beta=0.9<br />
15<br />
1.0<br />
1.0<br />
Frequency<br />
10<br />
5<br />
membership<br />
0.5<br />
membership<br />
0.5<br />
0<br />
0.0<br />
0.0<br />
0 5 10 15<br />
0 5 10<br />
0 5 10<br />
data set<br />
data set<br />
data set<br />
(a) (b) (c)<br />
FCS<br />
beta=0.5<br />
FCS<br />
beta=0.1<br />
FCS<br />
beta=0.05<br />
1.0<br />
1.0<br />
1.0<br />
membership<br />
0.5<br />
membership<br />
0.5<br />
membership<br />
0.5<br />
0.0<br />
0.0<br />
0.0<br />
0 5 10<br />
0 5 10<br />
0 5 10<br />
data set<br />
data set<br />
data set<br />
(d) (e) (f)<br />
Fig. 2. Membership functi<strong>on</strong>s of FCM and FCS.