Identification of Pharmacogenomic Biomarker Classifiers in Cancer ...
Identification of Pharmacogenomic Biomarker Classifiers in Cancer ...
Identification of Pharmacogenomic Biomarker Classifiers in Cancer ...

You also want an ePaper? Increase the reach of your titles
YUMPU automatically turns print PDFs into web optimized ePapers that Google loves.
<strong>Identification</strong> <strong>of</strong> <strong>Pharmacogenomic</strong> <strong>Biomarker</strong> <strong>Classifiers</strong> <strong>in</strong><br />
<strong>Cancer</strong> Drug Development<br />
Richard Simon<br />
To Appear <strong>in</strong> <strong>Pharmacogenomic</strong>s, Anticancer Drug Discovery and<br />
Response, (F Innocenti editor), Humana Press<br />
Physicians need improved tools for select<strong>in</strong>g treatments for <strong>in</strong>dividual patients. Many<br />
syndromes traditionally viewed as <strong>in</strong>dividual diseases are heterogeneous <strong>in</strong> molecular<br />
pathogenesis and treatment responsiveness. This results <strong>in</strong> treatment <strong>of</strong> many patients<br />
with <strong>in</strong>effective drugs and leads to the conduct <strong>of</strong> large cl<strong>in</strong>ical trials to identify small<br />
average treatment benefits for heterogeneous groups <strong>of</strong> patients. New genomic and<br />
proteomic technologies provide powerful tools for the selection <strong>of</strong> patients likely to<br />
benefit from a therapeutic without unacceptable adverse events. In this chapter we<br />
attempt to clarify how pharmacogenomic biomarker classifiers <strong>of</strong> the patients most likely<br />
to benefit from a drug can be identified and utilized dur<strong>in</strong>g cl<strong>in</strong>ical development.<br />
Keywords: <strong>Pharmacogenomic</strong>s, biomarker, genomics, DNA microarray, cl<strong>in</strong>ical trial<br />
design, validation<br />
Richard Simon, D.Sc.<br />
Biometric Research Branch<br />
National <strong>Cancer</strong> Institute<br />
9000 Rockville Pike<br />
Bethesda MD 20892-7434<br />
U.S.A.<br />
301.496-0975 (tel)<br />
301.402-0560 (fax)
simon@mail.nih.gov<br />
1. Introduction<br />
Physicians need improved tools for select<strong>in</strong>g treatments for <strong>in</strong>dividual patients. For<br />
example, many cancer treatments benefit only a m<strong>in</strong>ority <strong>of</strong> the patients to whom they are<br />
adm<strong>in</strong>istered. Be<strong>in</strong>g able to predict which patients are most likely to benefit would not<br />
only save patients from unnecessary toxicity and <strong>in</strong>convenience, but might facilitate their<br />
receiv<strong>in</strong>g drugs that are more likely to help them. In addition, the current over-treatment<br />
<strong>of</strong> patients results <strong>in</strong> major expense for <strong>in</strong>dividuals and society, an expense which may<br />
not be <strong>in</strong>def<strong>in</strong>itely susta<strong>in</strong>able. In this paper we will address some key issues <strong>in</strong> the<br />
validation <strong>of</strong> pharmacogenomic classifiers.<br />
2. <strong>Pharmacogenomic</strong> <strong>Biomarker</strong> <strong>Classifiers</strong><br />
Much <strong>of</strong> the discussion about disease biomarkers is <strong>in</strong> the context <strong>of</strong> markers which<br />
measure some aspect <strong>of</strong> disease status, extent, or activity. Such biomarkers are <strong>of</strong>ten<br />
proposed for use <strong>in</strong> early detection <strong>of</strong> disease or as a surrogate endpo<strong>in</strong>t for evaluat<strong>in</strong>g<br />
prevention or therapeutic <strong>in</strong>terventions. The validation <strong>of</strong> such biomarkers is difficult for<br />
a variety <strong>of</strong> reasons, but particularly because the molecular pathogenesis <strong>of</strong> many<br />
diseases is <strong>in</strong>completely understood and hence it is not possible to establish the biological<br />
relevance <strong>of</strong> a measure <strong>of</strong> disease status.<br />
2
A pharmacogenomic biomarker is any pre-treatment measurable quantity that can be used<br />
to select treatment; for example, the result <strong>of</strong> an immunohistochemical assay for a s<strong>in</strong>gle<br />
prote<strong>in</strong>, the abundance <strong>of</strong> a prote<strong>in</strong> <strong>in</strong> serum, the abundance <strong>of</strong> mRNA transcripts for a<br />
gene <strong>in</strong> a sample <strong>of</strong> disease tissue or the presence/absence status <strong>of</strong> a specified germ-l<strong>in</strong>e<br />
polymorphism or tumor mutation. A pharmacogenomic biomarker classifier is a<br />
mathematical function that translates the biomarker values to a set <strong>of</strong> prognostic<br />
categories. These categories generally correspond to levels <strong>of</strong> predicted cl<strong>in</strong>ical outcome.<br />
With the advent <strong>of</strong> gene expression pr<strong>of</strong>il<strong>in</strong>g, it is <strong>in</strong>creas<strong>in</strong>gly common to def<strong>in</strong>e<br />
composite pharmacogenomic biomarker classifiers based on the levels <strong>of</strong> expression <strong>of</strong><br />
dozens <strong>of</strong> genes. For a fully specified classifier, however, all <strong>of</strong> the parameters and cutpo<strong>in</strong>ts<br />
are specified for determ<strong>in</strong><strong>in</strong>g how to weight the different components and how to<br />
map the multivariate data <strong>in</strong>to a def<strong>in</strong>ed set <strong>of</strong> categories. A completely def<strong>in</strong>ed classifier<br />
can be used to select patients and stratify patients for therapy <strong>in</strong> cl<strong>in</strong>ical trials that enable<br />
the cl<strong>in</strong>ical value <strong>of</strong> the classifier to be evaluated. Specify<strong>in</strong>g only the genes <strong>in</strong>volved<br />
does not enable one to structure prospective cl<strong>in</strong>ical validation experiments <strong>in</strong> which<br />
patients are assigned or stratified <strong>in</strong> prospectively well def<strong>in</strong>ed ways.<br />
3 Types <strong>of</strong> <strong>Pharmacogenomic</strong> <strong>Biomarker</strong> <strong>Classifiers</strong><br />
<strong>Pharmacogenomic</strong> biomarkers can either be def<strong>in</strong>ed based on the known molecular target<br />
<strong>of</strong> the drug or empirically developed by compar<strong>in</strong>g responders versus non-responders<br />
with regard to whole genome tumor characterizations such as transcript expression<br />
pr<strong>of</strong>il<strong>in</strong>g. The former approach is preferable for a variety <strong>of</strong> reasons. First, a biomarker<br />
3
with a strong biological rationale l<strong>in</strong>ked to the mechanism <strong>of</strong> action <strong>of</strong> the drug is more<br />
satisfy<strong>in</strong>g than a “black box” classifier. Second, development time is likely to be shorter,<br />
and f<strong>in</strong>ally a reproducible assay for a s<strong>in</strong>gle gene/prote<strong>in</strong> biomarker may be<br />
implementable on a platform that does not require fresh/frozen tumor.<br />
Mutation-targeted drugs are drugs which are specific to a mutated gene which is driv<strong>in</strong>g<br />
the growth <strong>of</strong> a tumor. For example, there is currently considerable <strong>in</strong>terest <strong>in</strong> develop<strong>in</strong>g<br />
drugs specific for mutated B-raf which is present <strong>in</strong> approximately 60 percent <strong>of</strong> human<br />
melanomas. Such drugs have automatic pharmacogenomic biomarkers based on assay<strong>in</strong>g<br />
for the presence <strong>of</strong> the mutation. In general, the mutation could either be a po<strong>in</strong>t mutation<br />
as <strong>in</strong> B-raf, gene amplification, or deletion.<br />
Many current cancer drugs are selected to <strong>in</strong>hibit oncogenes that are mutated <strong>in</strong> some<br />
tumors. Although the drugs are not designed to be specific for the mutated forms <strong>of</strong> the<br />
associated prote<strong>in</strong>s, presence or absence <strong>of</strong> a mutation can be used as a natural<br />
pharmacogenomic biomarker <strong>of</strong> the patients most likely to benefit from the drugs.<br />
Papadopoulous et al review the experience with molecularly targeted drugs <strong>of</strong> this type<br />
{Papadopoulos, 2006 #287}.<br />
Although all chemotherapeutic drugs are “molecularly targeted” <strong>in</strong> the sense that they<br />
<strong>in</strong>teract with specific <strong>in</strong>tracellular components {Papadopoulos, 2006 #287}, <strong>in</strong> some<br />
cases the true target is not known when the drug is developed, <strong>in</strong> some cases there are<br />
multiple targets, and <strong>in</strong> many cases there is no obvious assay for determ<strong>in</strong><strong>in</strong>g the extent to<br />
4
which the target is driv<strong>in</strong>g tumor growth. In these cases one must generally use empirical<br />
methods to develop pharmacogenomic biomarker classifiers <strong>of</strong> the patients most likely to<br />
benefit from the drug. With this approach a tra<strong>in</strong><strong>in</strong>g set <strong>of</strong> tumor specimens from patients<br />
who have responded to the drug is assayed and compared to a tra<strong>in</strong><strong>in</strong>g set <strong>of</strong> specimens<br />
from patients who have not responded. The specimens are assayed, us<strong>in</strong>g either whole<br />
genome technology such as expression pr<strong>of</strong>il<strong>in</strong>g or us<strong>in</strong>g assays based on candidate<br />
genes, and a predictive classifier is developed for identify<strong>in</strong>g the tumors most likely to<br />
respond. In the next section, we will describe some aspects <strong>of</strong> the development <strong>of</strong> such<br />
classifiers us<strong>in</strong>g whole genome transcript expression pr<strong>of</strong>il<strong>in</strong>g.<br />
4. Develop<strong>in</strong>g Empirical <strong>Pharmacogenomic</strong> <strong>Classifiers</strong> Us<strong>in</strong>g Gene Expression<br />
There are three components to the empirical approach <strong>of</strong> develop<strong>in</strong>g a predictive<br />
classifier. The first is determ<strong>in</strong><strong>in</strong>g which genes to <strong>in</strong>clude <strong>in</strong> the predictor. This is<br />
generally called “feature selection”. Includ<strong>in</strong>g too many “noise variables” <strong>in</strong> the predictor<br />
usually reduces the accuracy <strong>of</strong> prediction. The second is specification <strong>of</strong> the<br />
mathematical function that will provide a predicted class label for any given expression<br />
vector. The third is parameter estimation. Most k<strong>in</strong>ds <strong>of</strong> predictors have parameters that<br />
must be assigned values before the predictor is fully specified. For many k<strong>in</strong>ds <strong>of</strong><br />
predictors there is also a cut-po<strong>in</strong>t that must be specified for translat<strong>in</strong>g a quantitative<br />
predictive <strong>in</strong>dex <strong>in</strong>to a predicted class label (eg 0 or 1) for b<strong>in</strong>ary class prediction<br />
problems.<br />
5
Feature selection is usually based on identif<strong>in</strong>g the genes that are differentially expressed<br />
among the classes when considered <strong>in</strong>dividually. For example, if there are two classes,<br />
one can compute a t-test or a modified t-test <strong>in</strong> which a hierarchical variance model is<br />
used for <strong>in</strong>creas<strong>in</strong>g the degrees <strong>of</strong> freedom for estimation <strong>of</strong> the gene-specific with<strong>in</strong>class<br />
variances {Wright, 2003 #284}. The logarithm <strong>of</strong> the expression measurements are<br />
used as the basis <strong>of</strong> the statistical significance tests. The genes that are significantly<br />
differentially expressed at a specified significance level are selected for <strong>in</strong>clusion <strong>in</strong> the<br />
class predictor. The str<strong>in</strong>gency <strong>of</strong> the significance level used controls the number <strong>of</strong><br />
genes that are <strong>in</strong>cluded <strong>in</strong> the model. Although many computationally complex methods<br />
have been published to identify optimal sets <strong>of</strong> genes which together provide good<br />
discrim<strong>in</strong>ation, little compell<strong>in</strong>g evidence currently exists that the computational effort <strong>of</strong><br />
these methods is warranted.<br />
Many algorithms have been used effectively with DNA microarray data for predict<strong>in</strong>g <strong>of</strong><br />
a b<strong>in</strong>ary outcome, e.g. response versus non-response. Dudoit et al. {Dudoit, 2002 #42}<br />
compared several algorithms us<strong>in</strong>g several publicly available data sets. A l<strong>in</strong>ear<br />
discrim<strong>in</strong>ant is a function<br />
l( x) = ∑ wx<br />
i i<br />
(1)<br />
i∈F<br />
where x i denotes the logarithm <strong>of</strong> the expression measurement for the i’th gene, w i is the<br />
weight given to that gene, and the summation is over the set F <strong>of</strong> features (genes) selected<br />
6
for <strong>in</strong>clusion <strong>in</strong> the class predictor. For a two-class problem, there is a threshold value d,<br />
and a sample with expression pr<strong>of</strong>ile def<strong>in</strong>ed by a vector x <strong>of</strong> values is predicted to be <strong>in</strong><br />
class 1 or class 2 depend<strong>in</strong>g on whether l( x ) as computed from equation (1) is less than<br />
the threshold d or greater than d respectively.<br />
Many types <strong>of</strong> classifiers are based on l<strong>in</strong>ear discrim<strong>in</strong>ants <strong>of</strong> the form shown <strong>in</strong> (1).<br />
They differ with regard to how the weights are determ<strong>in</strong>ed. The oldest form <strong>of</strong> l<strong>in</strong>ear<br />
discrim<strong>in</strong>ant is Fisher’s l<strong>in</strong>ear discrim<strong>in</strong>ant. To compute the weights for the Fisher l<strong>in</strong>ear<br />
discrim<strong>in</strong>ant, one must estimate the correlation between all pairs <strong>of</strong> genes that were<br />
selected <strong>in</strong> the feature selection step. The study by Dudoit et al. <strong>in</strong>dicated that Fisher’s<br />
l<strong>in</strong>ear discrim<strong>in</strong>ant did not perform well unless the number <strong>of</strong> selected genes was small<br />
relative to the number <strong>of</strong> samples. The reason is that <strong>in</strong> other cases there are too many<br />
correlations to estimate and the method tends to be un-stable and over-fit the data.<br />
Diagonal l<strong>in</strong>ear discrim<strong>in</strong>ant analysis is a special case <strong>of</strong> Fisher l<strong>in</strong>ear discrim<strong>in</strong>ant<br />
analysis <strong>in</strong> which the correlation among genes is ignored. By ignor<strong>in</strong>g such correlations,<br />
one avoids hav<strong>in</strong>g to estimate many parameters, and obta<strong>in</strong>s a method which performs<br />
better when the number <strong>of</strong> samples is small. Golub’s weighted vot<strong>in</strong>g method {Golub,<br />
1999 #12} and the Compound Covariate Predictor <strong>of</strong> Radmacher et al. {Radmacher,<br />
2002 #86} are similar to diagonal l<strong>in</strong>ear discrim<strong>in</strong>ant analysis and tend to perform very<br />
well when the number <strong>of</strong> samples is small. They compute the weights based on the<br />
univariate prediction strength <strong>of</strong> <strong>in</strong>dividual genes and ignore correlations among the<br />
genes.<br />
7
Support vector mach<strong>in</strong>es are very popular <strong>in</strong> the mach<strong>in</strong>e learn<strong>in</strong>g literature. Although<br />
they sound very exotic, l<strong>in</strong>ear kernel support vector mach<strong>in</strong>es do class prediction us<strong>in</strong>g a<br />
predictor <strong>of</strong> the form <strong>of</strong> equation (1). The weights are determ<strong>in</strong>ed by optimiz<strong>in</strong>g a misclassification<br />
rate criterion, however, <strong>in</strong>stead <strong>of</strong> a least-squares criterion as <strong>in</strong> l<strong>in</strong>ear<br />
discrim<strong>in</strong>ant analysis (Ramaswamy et al. {Ramaswamy, 2001 #92}). Although there are<br />
more complex forms <strong>of</strong> support vector mach<strong>in</strong>es, they appear to be <strong>in</strong>ferior to l<strong>in</strong>ear<br />
kernel SVM’s for class prediction with large numbers <strong>of</strong> genes {Ben-Dor, 2000 #91}.<br />
In the study <strong>of</strong> Dudoit et al. {Dudoit, 2002 #42}, the simplest methods, diagonal l<strong>in</strong>ear<br />
discrim<strong>in</strong>ant analysis, and nearest neighbor classification, performed as well or better<br />
than the more complex methods. Nearest neighbor classification is def<strong>in</strong>ed as follows. It<br />
depends on a feature set F <strong>of</strong> genes selected to be useful for discrim<strong>in</strong>at<strong>in</strong>g the classes. It<br />
also depends upon a distance function d( x, y)<br />
which measures the distance between the<br />
expression pr<strong>of</strong>iles x and y <strong>of</strong> two samples. The distance function utilizes only the genes<br />
<strong>in</strong> the selected set <strong>of</strong> features F. To classify a sample with expression pr<strong>of</strong>ile y , compute<br />
d( x, y)<br />
for each sample x <strong>in</strong> the tra<strong>in</strong><strong>in</strong>g set. The predicted class <strong>of</strong> y is the class <strong>of</strong><br />
the sample <strong>in</strong> the tra<strong>in</strong><strong>in</strong>g set which is closest to y with regard to the distance function d.<br />
A variant <strong>of</strong> nearest neighbor classification is k-nearest neighbor classification. For<br />
example with 3-nearest neighbor classification, you f<strong>in</strong>d the three samples <strong>in</strong> the tra<strong>in</strong><strong>in</strong>g<br />
set which are closest to the sample y . The class which is most represented among these<br />
three samples is the predicted class for y . Tibshirani et al. ( ) developed a variant called<br />
8
shrunken centroid classification that comb<strong>in</strong>es the gene selection and nearest centroid<br />
classification components.<br />
Dudoit et al. also studied some more complex methods such a Classification Trees and<br />
aggregated classification trees. These methods did not appear to perform any better than<br />
diagonal l<strong>in</strong>ear discrim<strong>in</strong>ant analysis or nearest neighbor classification. Ben-Dor et al.<br />
{Ben-Dor, 2000 #91} also compared several methods on several public datasets and<br />
found that nearest neighbor classification generally performed as well or better than more<br />
complex methods.<br />
5. Developmental and Validation Studies<br />
It is important to dist<strong>in</strong>guish the studies which develop parmacogenomic classifiers from<br />
those which utilize such classifiers for target<strong>in</strong>g treatment selection or for evaluat<strong>in</strong>g the<br />
cl<strong>in</strong>ical utility <strong>of</strong> such classifiers. The vast majority <strong>of</strong> published prognostic marker<br />
studies are developmental. Developmental studies are <strong>of</strong>ten based on a convenience<br />
sample <strong>of</strong> patients for whom tissue is available but who are heterogeneous with regard to<br />
treatment and stage. Although there is a large literature on prognostic markers, few such<br />
factors are used <strong>in</strong> cl<strong>in</strong>ical practice. Prognostic markers are unlikely to be used unless<br />
they are therapeutically relevant and most developmental studies are not based on a<br />
cohort medically coherent enough to establish therapeutic relevance.<br />
9
The patients <strong>in</strong>cluded <strong>in</strong> a developmental study <strong>of</strong> a pharmacogenomic biomarker to be<br />
used <strong>in</strong> drug development should be appropriate to enable identification <strong>of</strong> patients who<br />
are most likely to benefit from the new drug <strong>in</strong> a pivotal study. For example, suppose that<br />
the pivotal study <strong>in</strong>volves advanced disease patients who have failed first l<strong>in</strong>e treatment<br />
and <strong>in</strong>volves compar<strong>in</strong>g survivals for patients receiv<strong>in</strong>g the new drug to survivals for<br />
patients receiv<strong>in</strong>g palliative care. Patients from s<strong>in</strong>gle arm phase II trials <strong>of</strong> the new<br />
drug could be used to develop a pharmacogenomic biomarker classifier <strong>of</strong> those patients<br />
likely to respond to the new drug. Dobb<strong>in</strong> and Simon ( ) have studied sample size<br />
considerations for developmental studies <strong>of</strong> predictive b<strong>in</strong>ary classifiers and have<br />
<strong>in</strong>dicated that generally at least 20 cases <strong>in</strong> each class are required. Consequently, a phase<br />
II database conta<strong>in</strong><strong>in</strong>g at least 20 responders and 20 non-responders would be needed for<br />
the development <strong>of</strong> a pharmacogenomic classifier to be used <strong>in</strong> the subsequent pivotal<br />
trials. This may require a larger phase II developmental program than is conventional.<br />
If the pivotal study <strong>in</strong>volves comparison <strong>of</strong> outcome for patients receiv<strong>in</strong>g a standard<br />
regimen C versus those receiv<strong>in</strong>g C plus the new drug, then development <strong>of</strong> a gene<br />
expression based classifier is more complex. The classifier could be developed based on<br />
phase II studies <strong>of</strong> patients receiv<strong>in</strong>g C plus the new drug, but unless one also studied<br />
patients receiv<strong>in</strong>g C without the new drug one would not know whether prediction was<br />
drug specific or just reflected general prognostic features <strong>of</strong> the tumors.<br />
It is possible to develop pharmacogenomic predictors <strong>of</strong> risk <strong>of</strong> tumor progression rather<br />
than tumor response. Even if the patients are receiv<strong>in</strong>g the <strong>in</strong>vestigational drug as a<br />
10
s<strong>in</strong>gle agent, however, it may not be clear to what extent the predictor reflects drug effect<br />
rather than non-specific disease pace.<br />
As <strong>in</strong>dicated <strong>in</strong> the previous paragraphs, there are limitations to the adequacy <strong>of</strong> a<br />
conventional phase II database for empirically develop<strong>in</strong>g a pharmacogenomic classifier<br />
for use <strong>in</strong> a pivotal study. In many ways the best resource for develop<strong>in</strong>g a<br />
pharmacogenomic biomarker classifier for use <strong>in</strong> a pivotal trial is a collection <strong>of</strong> pretreatment<br />
tumor specimens from patients enrolled <strong>in</strong> such a pivotal trial. For example,<br />
archived material from a “failed” pivotal trial <strong>of</strong> the drug can be used to develop a<br />
biomarker classifier <strong>of</strong> patients most likely to benefit from the drug compared to the<br />
control. The classifier can be based on the actual endpo<strong>in</strong>t used <strong>in</strong> the cl<strong>in</strong>ical trial or<br />
upon an <strong>in</strong>termediate endpo<strong>in</strong>t such as progression-free survival for which there may be<br />
more events available. By “failed” pivotal trial, I mean a trial for the same target<br />
population <strong>of</strong> patients which did not establish a statistically significant benefit for the<br />
drug for the randomized patients as a whole. The classifier developed based on archived<br />
material <strong>in</strong> a failed pivotal trial should be considered to have the same status as a<br />
classifier based on a phase II database. That is, the classifier should be used to design a<br />
new pivotal trial that establishes the cl<strong>in</strong>ical benefit <strong>of</strong> the drug <strong>in</strong> a prospectively<br />
specified subset <strong>of</strong> patients. Us<strong>in</strong>g the same pivotal trial to develop a pharmacogenomic<br />
classifier and to test treatment effects <strong>in</strong> subsets determ<strong>in</strong>ed by the classifier is generally<br />
not valid. Freidl<strong>in</strong> and Simon ( ) have shown how one pivotal trial can be potentially used<br />
for both purposes, however, if the set <strong>of</strong> patients used to develop the classifier is kept<br />
dist<strong>in</strong>ct from the set <strong>of</strong> patients used to evaluate treatment benefit. Generally, however,<br />
11
the studies should be kept separate. Developmental studies are exploratory, though they<br />
should result <strong>in</strong> completely specified b<strong>in</strong>ary classifiers. Studies on which claims <strong>of</strong> drug<br />
benefit are based should be non-exploratory, but should <strong>in</strong>stead test prospectively def<strong>in</strong>ed<br />
hypotheses about treatment effect <strong>in</strong> a pre-def<strong>in</strong>ed patient population.<br />
6. Estimates <strong>of</strong> Predictive Accuracy <strong>in</strong> Developmental Studies<br />
Developmental studies are analogous to phase 2 cl<strong>in</strong>ical trials. They should <strong>in</strong>clude an<br />
<strong>in</strong>dication <strong>of</strong> whether the pharmacogenomic classifier is promis<strong>in</strong>g and worthy <strong>of</strong> phase 3<br />
evaluation. There are special problems <strong>in</strong> evaluat<strong>in</strong>g whether classifiers based on high<br />
dimensional genomic or proteomic assays are promis<strong>in</strong>g however. The difficulty derives<br />
from the fact that the number <strong>of</strong> candidate features available for use <strong>in</strong> the classifier is<br />
much larger than the number <strong>of</strong> cases available for analysis. In such situations, it is<br />
always possible to f<strong>in</strong>d classifiers that accurately classify the data on which they were<br />
developed even if there is no relationship between expression <strong>of</strong> any <strong>of</strong> the genes and<br />
outcome {Radmacher, 2002 #15}. Consequently, even <strong>in</strong> developmental studies, some<br />
k<strong>in</strong>d <strong>of</strong> validation on data not used for develop<strong>in</strong>g the model is necessary. This “<strong>in</strong>ternal<br />
validation” is usually accomplished either by splitt<strong>in</strong>g the data <strong>in</strong>to two portions, one<br />
used for tra<strong>in</strong><strong>in</strong>g the model and the other for test<strong>in</strong>g the model, or some form <strong>of</strong> crossvalidation<br />
based on repeated model development and test<strong>in</strong>g on random data partitions.<br />
This <strong>in</strong>ternal validation should not, however, be confused with external truly <strong>in</strong>dependent<br />
validation <strong>of</strong> the classifier.<br />
12
The most straightforward method <strong>of</strong> estimat<strong>in</strong>g the prediction accuracy is the splitsample<br />
method <strong>of</strong> partition<strong>in</strong>g the set <strong>of</strong> samples <strong>in</strong>to a tra<strong>in</strong><strong>in</strong>g set and a test set.<br />
Rosenwald et al. {Rosenwald, 2002 #14} used this approach successfully <strong>in</strong> their<br />
<strong>in</strong>ternational study <strong>of</strong> prognostic prediction for large B cell lymphoma. They used two<br />
thirds <strong>of</strong> their samples as a tra<strong>in</strong><strong>in</strong>g set. Multiple k<strong>in</strong>ds <strong>of</strong> predictors were studied on the<br />
tra<strong>in</strong><strong>in</strong>g set. When the collaborators <strong>of</strong> that study agreed on a s<strong>in</strong>gle fully specified<br />
prediction model, they accessed the test set for the first time. On the test set there was no<br />
adjustment <strong>of</strong> the model or fitt<strong>in</strong>g <strong>of</strong> parameters. They merely used the samples <strong>in</strong> the test<br />
set to evaluate the predictions <strong>of</strong> the model that was completely specified us<strong>in</strong>g only the<br />
tra<strong>in</strong><strong>in</strong>g data. In addition to estimat<strong>in</strong>g the overall error rate on the test set, one can also<br />
estimate other important operat<strong>in</strong>g characteristics <strong>of</strong> the test such as sensitivity,<br />
specificity, positive and negative predictive values.<br />
The split-sample method is <strong>of</strong>ten used with so few samples <strong>in</strong> the test set, however, that<br />
the validation is almost mean<strong>in</strong>gless. One can evaluate the adequacy <strong>of</strong> the size <strong>of</strong> the test<br />
set by comput<strong>in</strong>g the statistical significance <strong>of</strong> the classification error rate on the test set<br />
or by comput<strong>in</strong>g a confidence <strong>in</strong>terval for the test set error rate. S<strong>in</strong>ce the test set is<br />
separate from the tra<strong>in</strong><strong>in</strong>g set, the number <strong>of</strong> errors on the test set has a b<strong>in</strong>omial<br />
distribution.<br />
Michiels et al. {Michiels #181} suggested that multiple tra<strong>in</strong><strong>in</strong>g-test partitions be used,<br />
rather than just one. The split sample approach is mostly useful, however, when one does<br />
not have a well def<strong>in</strong>ed algorithm for develop<strong>in</strong>g the classifier. When there is a s<strong>in</strong>gle<br />
13
tra<strong>in</strong><strong>in</strong>g set-test set partition, one can perform numerous unplanned analyses on the<br />
tra<strong>in</strong><strong>in</strong>g set to develop a classifier and then test that classifier on the test set. With<br />
multiple tra<strong>in</strong><strong>in</strong>g-test partitions however, that type <strong>of</strong> flexible approach to model<br />
development cannot be used. If one has an algorithm for classifier development, it is<br />
generally better to use one <strong>of</strong> the cross-validation or bootstrap resampl<strong>in</strong>g approaches to<br />
estimat<strong>in</strong>g error rate (see below) because the split sample approach does not provide as<br />
efficient a use <strong>of</strong> the available data {Mol<strong>in</strong>aro, 2005 #182}.<br />
Cross-validation is an alternative to the split sample method <strong>of</strong> estimat<strong>in</strong>g prediction<br />
accuracy{Radmacher, 2002 #15}. Mol<strong>in</strong>aro et al. describe and evaluate many variants <strong>of</strong><br />
cross-validation and bootstrap re-sampl<strong>in</strong>g for classification problems where the number<br />
<strong>of</strong> candidate predictors vastly exceeds the number <strong>of</strong> cases.{Mol<strong>in</strong>aro, 2005 #182} The<br />
cross-validated prediction error is an estimate <strong>of</strong> the prediction error associated with<br />
application <strong>of</strong> the algorithm for model build<strong>in</strong>g to the entire dataset.<br />
A commonly used <strong>in</strong>valid estimate is called the re-substitution estimate. You use all the<br />
samples to develop a model. Then you predict the class <strong>of</strong> each sample us<strong>in</strong>g that model.<br />
The predicted class labels are compared to the true class labels and the errors are totaled.<br />
It is well-known that the re-substitution estimate <strong>of</strong> error is highly biased for small data<br />
sets and the simulation <strong>of</strong> Simon et al.{Simon, 2003 #12} confirmed that, with a 98.2 %<br />
<strong>of</strong> the simulated data sets result<strong>in</strong>g <strong>in</strong> zero misclassifications even when no true<br />
underly<strong>in</strong>g difference existed between the two groups.<br />
14
Simon et al.{Simon, 2003 #12} also showed that cross-validat<strong>in</strong>g the prediction rule after<br />
selection <strong>of</strong> differentially expressed genes from the full data set does little to correct the<br />
bias <strong>of</strong> the re-substitution estimator: 90.2 % <strong>of</strong> simulated data sets with no true<br />
relationship between expression data and class still result <strong>in</strong> zero misclassifications.<br />
When feature selection was also re-done <strong>in</strong> each cross-validated tra<strong>in</strong><strong>in</strong>g set, however,<br />
appropriate estimates <strong>of</strong> mis-classification error were obta<strong>in</strong>ed; the median estimated<br />
misclassion rate was approximately 50%.<br />
7. Use <strong>of</strong> <strong>Pharmacogenomic</strong> <strong>Classifiers</strong> <strong>in</strong> New Drug Development<br />
With a pharmacogenomic classifier for predict<strong>in</strong>g which patients are likely to benefit<br />
from an available treatment regimen, the emphasis should be on validation <strong>of</strong> the cl<strong>in</strong>ical<br />
utility <strong>of</strong> us<strong>in</strong>g the classifier. With an experimental therapy, however, the emphasis<br />
should be on demonstrat<strong>in</strong>g effectiveness <strong>of</strong> the drug <strong>in</strong> a population identified by the<br />
classifier. Simon and Maitournam {Simon, 2004 #160; Simon, 2006 #278} demonstrated<br />
that use <strong>of</strong> a genomic classifier for focus<strong>in</strong>g a cl<strong>in</strong>ical trial <strong>in</strong> this manner can result <strong>in</strong> a<br />
dramatic reduction <strong>in</strong> required sample size, depend<strong>in</strong>g on the sensitivity and specificity <strong>of</strong><br />
the classifier for identify<strong>in</strong>g such patients. Not only can such target<strong>in</strong>g provide a huge<br />
improvement <strong>in</strong> efficiency <strong>in</strong> phase III development, it also provides an <strong>in</strong>creased<br />
therapeutic ratio <strong>of</strong> benefit to toxicity and results <strong>in</strong> a greater proportion <strong>of</strong> treated<br />
patients who benefit.<br />
15
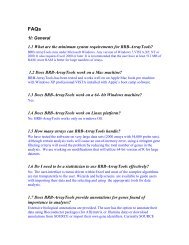
Simon and Maitournam consider use <strong>of</strong> the Targeted Design shown <strong>in</strong> Figure 1. Dur<strong>in</strong>g<br />
pre-cl<strong>in</strong>ical and phase I/II cl<strong>in</strong>ical development one identifies a fully specified classifier<br />
<strong>of</strong> which patients have a high probability <strong>of</strong> respond<strong>in</strong>g to the experimental drug. That<br />
classifier is then used to select patients for phase III trial. This is a form <strong>of</strong> enrichment<br />
design. Table 1 shows the number <strong>of</strong> events required <strong>in</strong> order to have 80% statistical<br />
power for compar<strong>in</strong>g exponential survival times us<strong>in</strong>g the design <strong>of</strong> Figure 1 if the<br />
treatment results <strong>in</strong> a halv<strong>in</strong>g <strong>of</strong> the hazard <strong>in</strong> the patients selected for study us<strong>in</strong>g the<br />
classifier. The number <strong>of</strong> events shown <strong>in</strong> Table 1 is compared to the number <strong>of</strong> events<br />
required <strong>in</strong> a standard cl<strong>in</strong>ical trial if the classifier is not used to select patients for<br />
randomization (Table 2). The table assumes that the treatment is not effective for the<br />
classifier negative patients. More extensive results on relative efficiency <strong>of</strong> the targeted<br />
and untargeted designs are described by Simon and Maitournam {Maitournam, 2005<br />
#207; Simon, 2004 #160}.<br />
For many molecularly targeted drugs, however, the appropriate assay for select<strong>in</strong>g<br />
patients is not known and development <strong>of</strong> a classifier based on compar<strong>in</strong>g expression<br />
pr<strong>of</strong>iles for phase II responders versus phase II non-responders may be the best approach.<br />
In such <strong>in</strong>stances, one may not have sufficient confidence <strong>in</strong> the genomic classifier<br />
developed <strong>in</strong> phase II to use it for exclud<strong>in</strong>g patients <strong>in</strong> phase III trials as <strong>in</strong> Figure 1. It<br />
may be better <strong>in</strong> this case to accept all conventionally eligible patients, and use the<br />
classifier <strong>in</strong> the pre-def<strong>in</strong>ed analysis plan.<br />
16
Figure 2 shows the Marker by Treatment Interaction Design discussed by Sargent et<br />
al.{Sargent, 2005 #202} and by Pusztai and Hess{Pusztai, 2004 #203}. Both marker<br />
positive and marker negative patients are randomized to the experimental treatment or<br />
control. The analysis plan either calls for separate evaluation <strong>of</strong> the treatment difference<br />
<strong>in</strong> the two marker strata or for test<strong>in</strong>g the hypothesis that the treatment effect is the same<br />
<strong>in</strong> both marker strata. When this design is used for development <strong>of</strong> an experimental drug,<br />
an appropriate analysis plan might be to utilize a prelim<strong>in</strong>ary test <strong>of</strong> <strong>in</strong>teraction; if the<br />
<strong>in</strong>teraction is not significant at a pre-specified level, then the experimental treatment is<br />
compared to the control overall. If the <strong>in</strong>teraction is significant, then the treatment is<br />
compared to the control with<strong>in</strong> the two strata determ<strong>in</strong>ed by the marker. The sample size<br />
plann<strong>in</strong>g for such a trial and determ<strong>in</strong>ation <strong>of</strong> the appropriate significance level for the<br />
prelim<strong>in</strong>ary <strong>in</strong>teraction test require further study.<br />
Freidl<strong>in</strong> and Simon{Freidl<strong>in</strong>, 2005 #208} proposed an alternative analysis plan for the<br />
design <strong>of</strong> Figure 2. They suggested that the overall null hypothesis for all randomized<br />
patients is tested at the 0.04 significance level. A portion, e.g. 0.01, <strong>of</strong> the usual 5 percent<br />
false positive rate is reserved for test<strong>in</strong>g the new treatment <strong>in</strong> the subset predicted by the<br />
classifier to be responsive. The analysis starts with a test <strong>of</strong> the overall null hypothesis,<br />
without a prelim<strong>in</strong>ary test <strong>of</strong> <strong>in</strong>teraction. If the overall null hypothesis is rejected, then<br />
one concludes that the treatment is effective for the randomized population as a whole<br />
and that the classifier is not needed. If the overall null hypothesis is not rejected at the<br />
0.04 level, then a s<strong>in</strong>gle subset analysis is conducted; compar<strong>in</strong>g the experimental<br />
treatment to the control <strong>in</strong> the subset <strong>of</strong> patients predicted by the classifier as be<strong>in</strong>g most<br />
17
likely to be responsive to the new treatment. If the null hypothesis is rejected, then the<br />
treatment is considered effective for the classifier determ<strong>in</strong>ed subset. This analysis<br />
strategy provides sponsors an <strong>in</strong>centive for develop<strong>in</strong>g genomic classifiers for target<strong>in</strong>g<br />
therapy <strong>in</strong> a manner that does not unduly deprive them <strong>of</strong> the possibility <strong>of</strong> broad label<strong>in</strong>g<br />
<strong>in</strong>dications when justified by the data.<br />
8. Conclusions<br />
Physicians need improved tools for select<strong>in</strong>g treatments for <strong>in</strong>dividual patients. The<br />
genomic technologies available today are sufficient to develop such tools. There is not<br />
broad understand<strong>in</strong>g <strong>of</strong> the steps needed to translate research f<strong>in</strong>d<strong>in</strong>gs <strong>of</strong> correlations<br />
between gene expression and prognosis <strong>in</strong>to robust diagnostics validated to be <strong>of</strong> cl<strong>in</strong>ical<br />
utility. This paper has attempted to identify some <strong>of</strong> the major steps needed for such<br />
translation.<br />
Acknowledgements<br />
Thanks to Dr. Wenyu Jiang for the comput<strong>in</strong>g <strong>of</strong> Tables 1 and 2.<br />
18
Figure Legends<br />
Figure 1. Targeted cl<strong>in</strong>ical trial design for evaluat<strong>in</strong>g a new experimental therapy. A<br />
biomarker classifier is developed for identify<strong>in</strong>g those patients most likely to respond to<br />
the new treatment (E). Only those patients are randomized to E versus the control<br />
treatment. The patients predicted less likely to respond (marker negative) are <strong>of</strong>f study.<br />
The targeted design is most useful <strong>in</strong> cases where the biomarker classifier has a strong<br />
biological rationale for identify<strong>in</strong>g responsive patients and where it may not be ethically<br />
advisable to expose marker negative patients to the new treatment.<br />
Figure 2. Stratified analysis design for evaluat<strong>in</strong>g a new experimental treatment (E)<br />
relative to a control (C). The status <strong>of</strong> a biomarker based classifier <strong>of</strong> the likelihood <strong>of</strong><br />
respond<strong>in</strong>g to E is utilized <strong>in</strong> a prospectively specified analysis plan. The biomarker<br />
classifier is not just used for stratify<strong>in</strong>g the randomization. Alternative analysis plans are<br />
described <strong>in</strong> the text.<br />
19
Hazard Ratio for Marker + Patients<br />
Number <strong>of</strong> Events Required<br />
0.5 74<br />
0.67 200<br />
Table 1: Approximate number <strong>of</strong> events required for 80% power with 5% two-sided logrank<br />
test for compar<strong>in</strong>g arms <strong>of</strong> design shown <strong>in</strong> Figure 3. Only marker + patients<br />
are randomized. Treatment hazard ratio for marker + patients is shown <strong>in</strong> first<br />
column. Time-to-event distributions are exponential and all patients are followed<br />
to failure.<br />
20
Proportion <strong>of</strong> Patients Marker + Approximate Number <strong>of</strong> Events Required<br />
20% 5200<br />
33% 1878<br />
50% 820<br />
Table 2: Approximate number <strong>of</strong> events required for 80% power with 5% two-sided logrank<br />
test for compar<strong>in</strong>g arms <strong>of</strong> design shown <strong>in</strong> Figure 1. Randomized arms are<br />
mixtures <strong>of</strong> marker – and marker + patients. Hazard ratio for marker – patients is<br />
1 for the two treatment groups and 0.67 for marker + patients. All patients are<br />
followed to failure.<br />
21
Figure 1<br />
22
Figure 2<br />
23