Learning to Rank with Partially-Labeled Data - University of ...
Learning to Rank with Partially-Labeled Data - University of ...
Learning to Rank with Partially-Labeled Data - University of ...

You also want an ePaper? Increase the reach of your titles
YUMPU automatically turns print PDFs into web optimized ePapers that Google loves.
0.55<br />
0.5<br />
0.45<br />
baseline<br />
transductive<br />
combined<br />
TREC2003<br />
0.5<br />
0.48<br />
0.46<br />
baseline<br />
transductive<br />
combined<br />
TREC2004<br />
0.58<br />
0.56<br />
baseline<br />
transductive<br />
combined<br />
OHSUMED<br />
0.4<br />
0.44<br />
0.54<br />
0.35<br />
0.42<br />
0.52<br />
0.4<br />
0.5<br />
0.3<br />
0.38<br />
0.48<br />
0.25<br />
0.36<br />
0.46<br />
0.2<br />
0.34<br />
0.44<br />
0.15<br />
0.32<br />
0.42<br />
0.1<br />
MAP NDCG@1 NDCG@3 NDCG@5 NDCG@10<br />
0.3<br />
MAP NDCG@1 NDCG@3 NDCG@5 NDCG@10<br />
0.4<br />
MAP NDCG@1 NDCG@3 NDCG@5 NDCG@10<br />
(a)<br />
(b)<br />
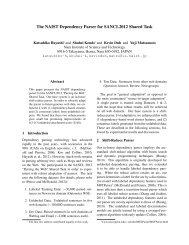
Figure 2: Main result (MAP and NDCG@n) for (a) TREC’03, (b) TREC’04, (c) OHSUMED. Both transductive<br />
and combined systems outperform baseline in all datasets and all metrics.<br />
(c)<br />
Table 2: Main result (Figure 2 in table form). All<br />
transductive/combined improve on baseline. Statistically<br />
significant improvements are bold-fonted.<br />
MAP N@1 N@3 N@5 N@10<br />
TREC’03<br />
baseline .1880 .3200 .2619 .2504 .2498<br />
transductive .3226 .5000 .4512 .4140 .4092<br />
combined .2627 .3600 .3568 .3670 .3444<br />
TREC’04<br />
baseline .3524 .4400 .4060 .4037 .4294<br />
transductive .3703 .4667 .4152 .4286 .4507<br />
combined .3829 .4933 .4544 .4397 .4638<br />
OHSUMED<br />
baseline .4427 .5252 .4707 .4479 .4274<br />
transductive .4455 .5503 .4890 .4567 .4457<br />
combined .4509 .5692 .4829 .4735 .4503<br />
3. In TREC’04 and OHSUMED, combined improves on<br />
both transductive and baseline, implying that transductive<br />
and baseline make different kinds <strong>of</strong> errors<br />
and thus benefit from system combination. In TREC’03,<br />
combined is worse than transductive–a simple averaging<br />
is less likely <strong>to</strong> work if one system (baseline) is<br />
significantly worse in performance than the other.<br />
We believe these are very promising results which demonstrate<br />
that transductive learning (and the framework we propose<br />
in Algorithm 1) has the potential <strong>to</strong> improve ranking.<br />
4. DETAILED ANALYSIS<br />
We ask several questions in order <strong>to</strong> examine the properties<br />
<strong>of</strong> the transductive framework in more detail. These<br />
questions seek <strong>to</strong> answer what is beneficial and not beneficial<br />
in the proposed framework.<br />
1. How important is it <strong>to</strong> adapt <strong>to</strong> the test query?<br />
Are we seeing gains in transductive simply because Kernel<br />
PCA extracts good features per se, or particulary because<br />
the features are extracted on the test set (i.e. the transductive<br />
aspect)? To answer this, we built a new system,<br />
KPCA on train, which runs Kernel PCA on each training<br />
list (as opposed <strong>to</strong> projecting the training lists <strong>to</strong> principal<br />
directions <strong>of</strong> the test lists). We then train <strong>Rank</strong>Boost on this<br />
data, which is the same training data as baseline except for<br />
the additional Kernel PCA features. This new <strong>Rank</strong>Boost<br />
is then evaluated on the test set. The results (Table 3) show<br />
that KPCA on train is worse than transductive (e.g. .2534<br />
vs. .3226 MAP for TREC’03), implying that transductive<br />
aspect <strong>of</strong> adapting <strong>to</strong> each test query is essential.<br />
Table 3: KPCA on test (transductive) vs. KPCA on<br />
train (inductive). KPCA on train underperforms;<br />
adapting <strong>to</strong> test queries is a useful strategy.<br />
TREC’03 TREC’04 OHSUMED<br />
Transductive .3226 .3703 .4435<br />
KPCA on train .2534 .3558 .4420<br />
Baseline .1880 .3523 .4427<br />
2. How can Kernel PCA features be interpreted?<br />
Kernel PCA features are in general difficult <strong>to</strong> interpret because<br />
they involve non-linear combinations and the α generated<br />
from the eigen-problem represents weights on samples,<br />
not features. We can only get a rough answer by computing<br />
the correlation between the values <strong>of</strong> a Kernel PCA feature<br />
and an original feature. Table 4 lists some features that correlate<br />
<strong>with</strong> particular kernel PCA features (e.g. in TREC’04<br />
query10, the Diffusion feature correlated highly <strong>with</strong> HITS).<br />
It is important <strong>to</strong> note, however, that this kind <strong>of</strong> analysis<br />
only serves as extra reference <strong>to</strong> help us understand particular<br />
test queries: most Kernel PCA features have little<br />
correlation <strong>to</strong> original features. The average correlation on<br />
TREC’04 is less than 0.15.<br />
3. What are the most useful features?<br />
What weak learners h(· ) in transductive’s multiple ranking<br />
functions (F u(· ) = P T<br />
t=1<br />
θtht(· )) achieve large |θt|? For<br />
instance, how <strong>of</strong>ten are Kernel PCA features chosen compared<br />
<strong>to</strong> the original features? To analyze this, we look at<br />
the 25 transductive ranking functions in TREC’04 that improve<br />
more than 20% over the baseline. For each ranking<br />
function, we look at the <strong>to</strong>p 5 features and note their type:<br />
{original, polynomial, rbf, diffusion, linear}. 24 <strong>of</strong><br />
25 functions have both original and Kernel PCA features in