1 Establishing a standard work sampling method for mastication ...
1 Establishing a standard work sampling method for mastication ...
1 Establishing a standard work sampling method for mastication ...

You also want an ePaper? Increase the reach of your titles
YUMPU automatically turns print PDFs into web optimized ePapers that Google loves.
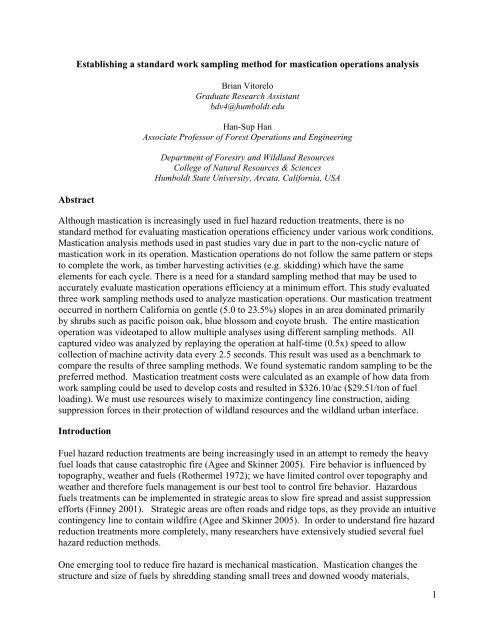
<strong>Establishing</strong> a <strong>standard</strong> <strong>work</strong> <strong>sampling</strong> <strong>method</strong> <strong>for</strong> <strong>mastication</strong> operations analysis<br />
Abstract<br />
Brian Vitorelo<br />
Graduate Research Assistant<br />
bdv4@humboldt.edu<br />
Han-Sup Han<br />
Associate Professor of Forest Operations and Engineering<br />
Department of Forestry and Wildland Resources<br />
College of Natural Resources & Sciences<br />
Humboldt State University, Arcata, Cali<strong>for</strong>nia, USA<br />
Although <strong>mastication</strong> is increasingly used in fuel hazard reduction treatments, there is no<br />
<strong>standard</strong> <strong>method</strong> <strong>for</strong> evaluating <strong>mastication</strong> operations efficiency under various <strong>work</strong> conditions.<br />
Mastication analysis <strong>method</strong>s used in past studies vary due in part to the non-cyclic nature of<br />
<strong>mastication</strong> <strong>work</strong> in its operation. Mastication operations do not follow the same pattern or steps<br />
to complete the <strong>work</strong>, as timber harvesting activities (e.g. skidding) which have the same<br />
elements <strong>for</strong> each cycle. There is a need <strong>for</strong> a <strong>standard</strong> <strong>sampling</strong> <strong>method</strong> that may be used to<br />
accurately evaluate <strong>mastication</strong> operations efficiency at a minimum ef<strong>for</strong>t. This study evaluated<br />
three <strong>work</strong> <strong>sampling</strong> <strong>method</strong>s used to analyze <strong>mastication</strong> operations. Our <strong>mastication</strong> treatment<br />
occurred in northern Cali<strong>for</strong>nia on gentle (5.0 to 23.5%) slopes in an area dominated primarily<br />
by shrubs such as pacific poison oak, blue blossom and coyote brush. The entire <strong>mastication</strong><br />
operation was videotaped to allow multiple analyses using different <strong>sampling</strong> <strong>method</strong>s. All<br />
captured video was analyzed by replaying the operation at half-time (0.5x) speed to allow<br />
collection of machine activity data every 2.5 seconds. This result was used as a benchmark to<br />
compare the results of three <strong>sampling</strong> <strong>method</strong>s. We found systematic random <strong>sampling</strong> to be the<br />
preferred <strong>method</strong>. Mastication treatment costs were calculated as an example of how data from<br />
<strong>work</strong> <strong>sampling</strong> could be used to develop costs and resulted in $326.10/ac ($29.51/ton of fuel<br />
loading). We must use resources wisely to maximize contingency line construction, aiding<br />
suppression <strong>for</strong>ces in their protection of wildland resources and the wildland urban interface.<br />
Introduction<br />
Fuel hazard reduction treatments are being increasingly used in an attempt to remedy the heavy<br />
fuel loads that cause catastrophic fire (Agee and Skinner 2005). Fire behavior is influenced by<br />
topography, weather and fuels (Rothermel 1972); we have limited control over topography and<br />
weather and there<strong>for</strong>e fuels management is our best tool to control fire behavior. Hazardous<br />
fuels treatments can be implemented in strategic areas to slow fire spread and assist suppression<br />
ef<strong>for</strong>ts (Finney 2001). Strategic areas are often roads and ridge tops, as they provide an intuitive<br />
contingency line to contain wildfire (Agee and Skinner 2005). In order to understand fire hazard<br />
reduction treatments more completely, many researchers have extensively studied several fuel<br />
hazard reduction <strong>method</strong>s.<br />
One emerging tool to reduce fire hazard is mechanical <strong>mastication</strong>. Mastication changes the<br />
structure and size of fuels by shredding standing small trees and downed woody materials,<br />
1
leaving a mat of shredded wood on the soil surface (Jain et al. 2007). Mastication is an<br />
alternative <strong>for</strong> fire hazard reduction when the treatment area cannot be burned, mechanical<br />
removal of excessive fuels is cost prohibitive, or impacts on soil and sedimentation are of<br />
concern (Coulter et al. 2002; Rummer et al. 2003; Hatchett et al. 2006; Han et al. 2006; Kane et<br />
al. 2009).<br />
There are a variety of <strong>method</strong>s that can be employed to analyze the cost and evaluate operational<br />
efficiency of <strong>for</strong>est operations. Among <strong>method</strong>s, the detailed time and motion study <strong>method</strong><br />
using a stopwatch <strong>work</strong>s well in evaluating cyclic activities where there is a repetitive defined<br />
course of events (Olsen and Kellogg 1983). The <strong>work</strong> <strong>sampling</strong> <strong>method</strong> is less commonly used,<br />
but can be effectively used to evaluate non-cyclic activity such as <strong>mastication</strong> (Pape 1992;<br />
Bolding 2009 personal comm.) Work <strong>sampling</strong> consists of a series of consecutive observations<br />
where the current activity of the machines is documented (Heiland and Richardson 1957; Miyata<br />
1981; Olsen and Kellogg 1983; Pape 1992; Liao and Pape 1996; Bolding 2006).<br />
There are certain advantages and limitations to <strong>work</strong> <strong>sampling</strong> when compared to detailed time<br />
and motion studies. Among the advantages, the most poignant include: the ability to control the<br />
accuracy by increasing the number of observations, data reduction and analysis are easier and<br />
less time consuming, and the data can often be collected by one researcher who requires less<br />
training than necessary <strong>for</strong> time and motion studies (Miyata et al. 1980). Despite the advantages,<br />
<strong>work</strong> <strong>sampling</strong> is not always correct choice as it does not record machine cycle times and may<br />
report uncharacteristic proportions if the machine cycle and observation interval coincide. Also,<br />
important events between observation times may be missed and short delays may be reported<br />
incorrectly with increase in interval length (Olsen and Kellogg 1983). Among the several <strong>work</strong><br />
<strong>sampling</strong> <strong>method</strong>s, there is ambiguity as to which <strong>method</strong> is the best to evaluate masticators.<br />
The objective of this study was to establish a <strong>standard</strong> <strong>work</strong> <strong>sampling</strong> <strong>method</strong> <strong>for</strong> <strong>mastication</strong><br />
operations analysis, allowing researchers and land managers to evaluate operations efficiency<br />
and conduct fair cost comparisons. This <strong>method</strong> should aid in making in<strong>for</strong>med decisions<br />
resulting in efficient use of masticators to accomplish fuels treatment objectives in a costeffective<br />
manner. Our main approach was to compare various <strong>work</strong> <strong>sampling</strong> <strong>method</strong>s to a<br />
reference <strong>method</strong> to identify a <strong>work</strong> <strong>sampling</strong> <strong>method</strong> that provide the most accurate details on<br />
<strong>mastication</strong> operations with a minimum ef<strong>for</strong>t and time.<br />
Methods<br />
Study sites and <strong>mastication</strong> treatments<br />
Mastication <strong>for</strong> fuel hazard reduction was implemented at Humboldt State University’s L.W.<br />
Schatz Demonstration Tree Farm, located near Maple Creek in northwestern Cali<strong>for</strong>nia. Steep<br />
topography and availability of brush fields limited the area suitable <strong>for</strong> operation to nine small<br />
units of similar slope and fuel load conditions (Table 1). The areas selected were dominated<br />
primarily by a dense cover of shrub species such as pacific poison oak (Toxicodendron<br />
diversilobum (Torr. & A. Gray) Greene), blue blossom (Ceanothus thyrsiflorus Eschsch.), and<br />
coyote brush (Baccharis pilularis DC.).<br />
2
Table 1. Site characteristics of nine units <strong>for</strong> <strong>mastication</strong> treatment.<br />
Unit #<br />
Treatment size Ground slope Fuel loading<br />
(ac)<br />
(%)<br />
(ton/ac)<br />
1 0.75 23.5 11.04<br />
2 0.35 5.0 7.42<br />
3 0.25 17.5 9.60<br />
4 0.70 22.0 18.04<br />
5 0.60 14.5 14.50<br />
6 0.72 9.8 7.64<br />
7 0.35 12.5 8.52<br />
8 0.26 15.0 10.37<br />
9 0.48 17.5 12.32<br />
A small scale masticator with an integrated horizontal drum type masticating head was employed<br />
to reduce the hazard of the fuels as our desired outcome was a mulched fuelbed; the horizontal<br />
drum masticators are more effective at producing this effect than the rotary type (Windell and<br />
Bradshaw 2000). The base machine was an ASV RC-100 rubber-tracked carrier with the<br />
masticating head (FECON Bull Hog SS) attached to the front-end of the base machine. The total<br />
weight of the carrier and head was 13,400 lbs, resulting in ground pressure of 3.5 psi. The total<br />
width of the machine was 87 in.; the total length was 148 in. with 14 in. of ground clearance; the<br />
small size of this machine makes it a viable option <strong>for</strong> small areas such as our study. Large<br />
equipment becomes cost prohibitive when treating areas of fewer than ten acres (Cubbage 1983)<br />
so we chose a small machine to conduct the treatment.<br />
Data collection<br />
Evaluation of three <strong>work</strong> <strong>sampling</strong> <strong>method</strong>s<br />
To estimate the fuel loading of the treatment areas, this study employed the use of the<br />
generalized fuelbed depth to fuel load equation <strong>for</strong> masticated fuelbeds developed by Kane et al.<br />
(2009). Slopes were measured from boundary to boundary on cardinal direction axes and<br />
averaged to obtain a mean slope. The size of each treatment unit area was measured using a<br />
Trimble GeoExplorer XT GPS unit.<br />
To compare <strong>work</strong> <strong>sampling</strong> <strong>method</strong>s, we videotaped the entire operation using a Canon XL1S<br />
digital video camcorder. After the treatment, the video was slowed and sampled (Table 2) to a<br />
nearly continuous level (2.5 second fixed interval) in order to establish a benchmark against<br />
which the different <strong>sampling</strong> procedures were compared. The operation was then sampled using<br />
three different <strong>method</strong>s of <strong>work</strong> <strong>sampling</strong> (Systematic Random Sampling, Simple Random<br />
Sampling, and Stratified Non-Continuous Sampling) to evaluate which is the most accurate and<br />
most easily implemented (Pape 1992). These <strong>method</strong>s were selected using a dichotomous key<br />
<strong>for</strong> selection of the proper industrial engineering <strong>work</strong> <strong>sampling</strong> <strong>method</strong> (Pape 1992). The<br />
translation from industrial engineering into <strong>for</strong>est operations introduced some ambiguity as to<br />
which of the three possibly appropriate <strong>method</strong>s was the best and were tested to find supporting<br />
evidence.<br />
3
Table 2. Work <strong>sampling</strong> consists of several “snapshot” observations where the activity of the<br />
machine was recorded as being one of the listed items. Productive and delay elements were the<br />
major categories of further interest as this yields the delay ratio, an important factor in<br />
determining operational efficiency. Research delay is separated from the rest as inclusion of this<br />
delay is not representative of non-research <strong>work</strong> conditions.<br />
Operations action Sub-categories of operations actions<br />
category<br />
Productive elements Masticating standing material (vertically<br />
oriented and intact vegetation)<br />
Masticating downed material (vegetation<br />
not intact and not vertically oriented)<br />
Traveling<br />
Delay elements Operational delay¹<br />
Personal delay²<br />
Mechanical delay³<br />
Research Delay Research delay<br />
¹ Delay that contributes to productivity of the operation<br />
² Delay such as resting, eating or breaks<br />
³ Delay involving machine maintenance or care<br />
The number of <strong>work</strong> sample observations required <strong>for</strong> the desired confidence limit and relative<br />
accuracy was determined from the following equation (Miyata et al. 1981):<br />
<br />
1.64 1 0.113<br />
0.10 2.38567 2111.22 2111<br />
0.113 0.00113<br />
Where:<br />
N= number of observations (sample size)<br />
Z = a normal deviation which depends on the confidence level selected (confidences of 90, 95<br />
and 99 percent yield Z values of 1.64, 1.96 and 2.57 respectively)<br />
Q = (1 – D) percentage occurrence of non-delay expressed as a decimal<br />
E = desired relative accuracy expressed as a decimal<br />
D = percentage occurrence of delay expressed as a decimal (normally estimated from prior<br />
studies, the figure used in this study is the actual calculated delay ratio from the benchmark<br />
dataset).<br />
The confidence limit and relative accuracy <strong>for</strong> this study followed Miyata et al. (1981) and were<br />
set at 90% and 10%, respectively. These values were chosen due to the variability of <strong>for</strong>est<br />
operations where confidence limits of 99 to 95% and relative accuracy of 5% require an often<br />
prohibitively large number of observations (Miyata et al. 1981).<br />
The delay ratio <strong>for</strong> the masticator was calculated from the <strong>work</strong> <strong>sampling</strong> data and provides the<br />
inverse of the utilization rate (amount of time the machine spends actually <strong>work</strong>ing, expressed as<br />
a percent). The delay ratio was calculated as follows:<br />
<br />
<br />
<br />
4
Systematic Random Sampling (SyRS) is conducted by calculating a fixed interval length with a<br />
random start time within the first interval then repeated <strong>sampling</strong> at the fixed interval length <strong>for</strong><br />
the duration of the study (Bolding 2006). The interval length is calculated as such (Pape 1992):<br />
971.96 0.46 . 27.6 <br />
2111<br />
where:<br />
t = minutes of study duration (can be estimated or calculated after the fact as in video analysis)<br />
r = the number of observation “rounds” (<strong>for</strong> a study of only one person or machine the number of<br />
“rounds” equals the number of observations, thus r = N)<br />
Simple Random Sampling (SRS) simply dictates that the researcher randomly select N times<br />
without replacement from the total population of times, t (Moder 1980). There are a number of<br />
ways to generate random times such as random number generators as well as random number<br />
tables (Heiland and Richardson 1957; Miyata et al. 1981; Pape 1992).<br />
Stratified Non-Continuous Random Sampling (StNCRS) is more complex than the prior two<br />
<strong>method</strong>s since it requires that observation times encompass different times and days as a means<br />
of reducing variance (Moder 1980; Pape 1992). Observation times are randomly selected within<br />
each of the fixed intervals (t / r, in this study 27.6 sec.). No special consideration <strong>for</strong><br />
stratification was necessary <strong>for</strong> this study as the dataset spanned several days and times.<br />
Data analysis<br />
The delay ratio resulting from the three different <strong>sampling</strong> <strong>method</strong>s was tested against the<br />
benchmark <strong>method</strong> to evaluate their accuracy. A 2-proportion test <strong>for</strong> difference (using the<br />
normal distribution to approximate the binomial distribution) was conducted three times, once<br />
<strong>for</strong> each of the selected <strong>work</strong> <strong>sampling</strong> <strong>method</strong>s. This analysis tested the null hypothesis that the<br />
difference between the benchmark and the <strong>work</strong> <strong>sampling</strong> <strong>method</strong> is equal to 0, but did not<br />
compare the different <strong>work</strong> <strong>sampling</strong> <strong>method</strong>s to each other. The tests were run using an alpha<br />
level of 0.01667 so that we could be 95% confident in all three conclusions simultaneously<br />
(0.05/3 = 0.01667). We hypothesized that at least one of the delay ratios would differ from the<br />
benchmark delay ratio.<br />
The average hourly cost of operating this machine was calculated using <strong>standard</strong> machine rate<br />
<strong>method</strong>s (Miyata 1980; Brinker et al. 2002). Work <strong>sampling</strong> provided the utilization rate used in<br />
the <strong>standard</strong> machine rate calculation to obtain cost per productive machine hour (PMH) and was<br />
then be translated into production rate and various cost expressions according to the following<br />
cost tree diagram (Figure 1).<br />
5
Figure 1. This cost tree diagram illustrates the process whereby collected data are calculated to<br />
determine the <strong>mastication</strong> cost.<br />
Results and Discussion<br />
Evaluation of three <strong>work</strong> <strong>sampling</strong> <strong>method</strong>s<br />
The <strong>mastication</strong> operation yielded 16 hours of machine operation, resulting in 23,325<br />
observations <strong>for</strong> the benchmark and 2,111 observations <strong>for</strong> each of the three <strong>work</strong><br />
<strong>sampling</strong> <strong>method</strong>s that were evaluated. There was strong evidence that none of the <strong>work</strong><br />
<strong>sampling</strong> delay ratios were significantly different from the benchmark (p >0.01667; Table<br />
3).<br />
6
Table 3. The results <strong>for</strong> the three separate 2-proportion tests <strong>for</strong> difference show that none of the<br />
<strong>work</strong> <strong>sampling</strong> <strong>method</strong>s produced a delay ratio that was significantly different from the<br />
benchmark.<br />
Sampling<br />
<strong>method</strong><br />
benchmark<br />
Delay ratio<br />
(proportion)<br />
0.113<br />
Estimate <strong>for</strong><br />
difference<br />
from<br />
benchmark<br />
98.33% CI 1 <strong>for</strong><br />
difference<br />
from<br />
benchmark<br />
p-value<br />
Different<br />
from<br />
benchmark<br />
2<br />
SyRS<br />
0.114 -0.001 (-0.018, 0.016) 0.873 No<br />
3<br />
SRS<br />
0.116 -0.003 (-0.021, 0.014) 0.625 No<br />
4<br />
StNCRS<br />
0.123 -0.010 (-0.027, 0.008) 0.180 No<br />
1 Confidence Interval, 98.33% because alpha level set at 0.01667 <strong>for</strong> 95% family-wise<br />
confidence in all three conclusions simultaneously (α = 0.05/3 = 0.01667)<br />
2 Systematic Random Sampling<br />
3 Simple Random Sampling<br />
4 Stratified Non-Continuous Sampling<br />
As there was no significant difference in the accuracy of the <strong>sampling</strong> <strong>method</strong>s, the strengths and<br />
limitations of each were evaluated to establish which is the most easily implemented. Drawing<br />
sample times was the easiest using SyRS, followed by SRS and lastly StNCRS. Our conclusion<br />
was also supported by the findings from Pape (1992).<br />
Work <strong>sampling</strong> can be mentally fatiguing (Olsen and Kellogg 1983), so it is important to select a<br />
<strong>method</strong> where collecting observations is easy. In this regard, the preferred <strong>method</strong> was SyRS,<br />
followed by StNCRS and lastly SRS (Pape 1992). SRS was judged to be the most difficult in this<br />
category because by random chance there might be a cluster of many <strong>sampling</strong> times; this may<br />
result in insufficient time between observations to realize what the machine is doing be<strong>for</strong>e the<br />
subsequent observation (Miyata et al. 1981; Olsen and Kellogg 1983; Pape 1992). By combining<br />
the outcomes of these ease of implementation measures SyRS was shown to be preferable, as<br />
was also found by Gardner and Schillings (1969). Despite this conclusion, there are dangers to<br />
SyRS.<br />
The primary caution to <strong>work</strong> <strong>sampling</strong> is that important events between observations can be<br />
missed, especially as the interval between observations becomes longer. This may be overcome<br />
with short intervals such as Bolding’s (2006) use of a 20-sec. interval or the 30-sec. interval<br />
recommended by Olsen and Kellogg (1983). However, deviating from the calculated interval<br />
length may result in unequal <strong>sampling</strong>; this may result in bias (Pape 1992).<br />
Using SRS, the sixteen hours of video were used to analyze the productivity of the masticator.<br />
The masticator’s operation yielded 11.3% delay, 85.7% productive, and 3% research delay. The<br />
7
delay and productive categories were further divided to assess how often the machine engages in<br />
the elements within these categories (Figure 2).<br />
Figure 2. Using Systematic Random Sampling, the masticator’s activities were divided into<br />
productive and delay categories as well as separating the research delay. Productive time was<br />
divided into its elements: traveling, masticating standing material and masticating downed<br />
material. Delay time was also divided into its elements: operational delay, personal delay and<br />
mechanical delay.<br />
This machine used an integrated (front-end attached) horizontal drum type masticator, review of<br />
existing literature shows similar percentages <strong>for</strong> similar machines but vastly different<br />
percentages <strong>for</strong> boom-mounted rotary type masticators. Bolding (2006) showed that these<br />
machine types differ significantly (p
of the <strong>mastication</strong> treatment operation (Figure 3). The cost <strong>for</strong> this machine appears to be more<br />
sensitive to changes in production rate and robust against changes in the utilization rate,<br />
especially at higher production rates.<br />
Figure 3. Effect of various production rates and utilization rates on the overall cost of the<br />
<strong>mastication</strong> treatment.<br />
The <strong>method</strong>s described should serve as a guide <strong>for</strong> land managers to approximate treatment<br />
costs. These estimates were developed from the treatment of areas that were dominated by<br />
relatively light fuel loading primarily comprised of shrub species. Extrapolating these figures to<br />
areas dominated by heavier fuel loading and different vegetation is not advisable as the variables<br />
that affect cost in those situations may be different. That said, the costs observed in this study<br />
were within the range of <strong>mastication</strong> costs ($100-1395/ac) and comparable to those found by<br />
other studies (Vitorelo 2009). The lower production rate of small machines is offset by low<br />
initial purchase price, yielding costs similar to that of the larger machines. For example, Bolding<br />
(2006) reported the cost <strong>for</strong> a similar machine type of $27.74/ton, and $24.97/ton <strong>for</strong> a boommounted<br />
machine.<br />
Conclusions<br />
This study of an integrated horizontal drum type masticator in northwestern Cali<strong>for</strong>nia yielded<br />
useful results. The evaluation of the three <strong>work</strong> <strong>sampling</strong> <strong>method</strong>s established systematic<br />
random <strong>sampling</strong> as the preferred <strong>method</strong> <strong>for</strong> <strong>mastication</strong> operations analysis based on ease of<br />
implementation as the lack of difference in accuracy among the three different <strong>method</strong>s. Work<br />
<strong>sampling</strong> allows calculation of productivity rate which is crucial as productivity was shown to<br />
9
have strong influence on treatment cost. Cost analysis was included in this paper to serve as an<br />
example of how <strong>work</strong> <strong>sampling</strong> data can be used to calculate the operating costs of masticators.<br />
While the presented study represents a local case study, these results are valuable in the context<br />
of existing literature as the costs are within the established range and the costs of small scale<br />
machines are poorly documented.<br />
Additional research is necessary to expand the inference of this <strong>work</strong> in both <strong>work</strong> <strong>sampling</strong><br />
<strong>method</strong> establishment and the associated cost analysis. The use of different machines, both<br />
horizontal drum and rotary masticators, across a diversity of vegetation types, slope and fuel<br />
loads will allow broader use of these results by land managers and researchers.<br />
Land managers would find greater ease in evaluating fuel hazard reduction options with<br />
increased knowledge of associated costs and consistent evaluation <strong>method</strong>s. If researchers<br />
employ the <strong>standard</strong> <strong>work</strong> <strong>sampling</strong> <strong>method</strong> established here there can be valid comparison of<br />
the cost estimates produced. Valid comparison will yield greater precision in cost estimation,<br />
ultimately leading to wiser use of finite fuel hazard reduction funding and treatment of more high<br />
risk areas. The increasing number of high severity fires and their tremendous costs dictate our<br />
call to action. We must use resources wisely to maximize the amount of area treated, aiding<br />
suppression <strong>for</strong>ces in their protection of wildland resources and the wildland urban interface.<br />
References<br />
Agee, J.K. and C.N. Skinner. 2005. Basic Principles of <strong>for</strong>est fuel reduction treatments. For.<br />
Ecol. Mgmt. 211: 83-96.<br />
Bolding, M.C. 2006. An Integrated Study of Mechanical Forest Fuels Reduction: Quantifying<br />
Multiple Factors at the Stand Level. Doctor of Philosophy Dissertation. Department of<br />
Forest Engineering, Oregon State University, Corvallis, OR. 368p.<br />
Bolding, M.C. 2009. Personal communication. Assistant Professor of Forest Operations and<br />
Engineering, Virginia Tech Department of Forestry, Blacksburg, VA.<br />
Brinker, R.W., J. Kinard, B. Rummer, and B. Lan<strong>for</strong>d. 2002. Machine rates <strong>for</strong> selected <strong>for</strong>est<br />
harvesting machines. Circular 296 (revised). Alabama Agri. Exp. Sta. 29 p.<br />
Coulter, E., K. Coulter, The Yankee Group, Inc., and T. Mason, TSS Consultants. 2002. Dry<br />
Forest Mechanized Fuels Treatment Trials Project. Final Report. 92p. Available online at:<br />
www.fs.fed.us/vegtools/techniques/mechanical.shtml.<br />
Cubbage, F.1983. Economics of <strong>for</strong>est tract size: Theory and literature, U.S. DA, Forest Service<br />
Gen. Tech. Rep. SO-GTR-41. Southern Forest Experiment Station, New Orleans, LA.<br />
21p.<br />
Finney, M.A. 2001. Design of regular landscape fuel treatment patterns <strong>for</strong> modifying fire<br />
growth and behavior. For. Sci. 47(2): 219-228.<br />
Gardner, R. and P.L. Schillings. 1969. Efficiency of tree data-gathering <strong>method</strong>s <strong>for</strong> study of log<br />
making activities. USDA Forest Service Research Note INT-100. Intermountain Forest<br />
and Range Experiment Station, Ogden, UT.<br />
10
Halbrook, J., H-S. Han, R. Graham, T. Jain, R. Denner. 2006. Mastication: A fuel reduction and<br />
site preperation alternative. Proc. July, 2006 Council On Forest Engineering (COFE)<br />
meeting, Coeur d'Alene, ID.<br />
Han, H.-S., D. Page-Dumroese, S.-K. Han, J. Tirocke. 2006. Effects of slash, machine passes,<br />
and soil moisture on penetration resistance in a cut-to-length harvesting. Int. J. For.<br />
Engin. 17(2): 11-24<br />
Hatchett, B., M. Hogan, M. Grismer. 2006. Mechanical <strong>mastication</strong> thins Lake Tahoe <strong>for</strong>est<br />
with few adverse impacts. Cali<strong>for</strong>nia Agriculture 60(2): 77-82.<br />
Heiland, R.E. and W.J. Richardson. 1957. Work Sampling. York, PA, the Maple Press Co.<br />
Jain, T., R. Graham, R. Denner, J. Sandquist, J. Evans, M. Butler, K. Brockus, D. Cobb, D.<br />
Frigard,H-S. Han, J. Halbrook. 2007. Restoration of Northern Rocky Mountain Moist<br />
Forests: Integrating Fuel Treatments From the Site to the Landscape. Published in: Deal,<br />
R.L., tech. ed. 2008. Integrated restoration of <strong>for</strong>ested ecosystems to achieve<br />
multiresource benefits: proceedings of the 2007 national silviculture <strong>work</strong>shop. Gen.<br />
Tech. Rep. PNW-GTR-733. Portland, OR: USDA Forest Service, Pacific Northwest<br />
Research Station. 306p.<br />
Kane, J.M., J.M. Varner, and E.E. Knapp. 2009. Fuel loading in mechanically masticated fuel<br />
beds in northern Cali<strong>for</strong>nia and southwestern Oregon, USA. International Journal of<br />
Wildland Fire. 18: 686-697.<br />
Liao, P.-Y., and E. Pape. 1996. Fixed-random mixture <strong>method</strong> <strong>for</strong> <strong>work</strong> <strong>sampling</strong>. IIE<br />
Transactions 28: 713-721.<br />
Miyata, E.S., 1980. Determining fixed and operating cost of logging equipment. General<br />
Technical Report NC-55. USDA Forest Service, North Central Forest Experiment<br />
Station. St. Paul, Minnesota. 16p.<br />
Miyata, E.S., H.M. Steinhilb and S.A. Winsauer. 1981. Using <strong>work</strong> <strong>sampling</strong> to analyze logging<br />
operations. USDA Forest Service, Research Paper NC-213, 8p. USDA Forest Service,<br />
North Central Forest Experimentation Station, St. Paul, MN.<br />
Moder, J.J. 1980. Selection of <strong>work</strong> <strong>sampling</strong> observation times: part I – stratified <strong>sampling</strong>.<br />
AIIE Transactions. 12(1): 23-31.<br />
Olsen, E.D., and L.D. Kellogg. 1983. Comparison of time-study techniques <strong>for</strong> evaluating<br />
logging production. Transactions of the ASAE 26(6):1665-1668, 1672.<br />
Pape, E. 1992. Work Sampling. In: Salvendy, G. 1992. Handbook of Industrial Engineering,<br />
Second Edition. New York, Wiley & Sons, Inc. p.1699-1721.<br />
Rothermel, Richard C. 1972. A mathematical model <strong>for</strong> predicting fire spread in wildland fuels.<br />
Res. Pap. INT-115. Ogden, UT: U.S. Department of Agriculture, Intermountain Forest<br />
and Range Experiment Station. 40 p.<br />
11
Rummer, B., J. Prestemon, D. May, P. Miles, J. Vissage, R. McRoberts, G. Liknes, W.D.<br />
Shepperd, D. Ferguson, W. Elliot, S. Miller, S. Reutebuch, J. Barbour, J. Fried, B.<br />
Stokes, E. Bilek and K. Skog. 2003. A strategic assessment of <strong>for</strong>est biomass and fuel<br />
reduction treatments in western states. Gen. Tech. Rep. RMRS-GTR-149. Fort Collins,<br />
CO: U.S. Department of Agriculture, Forest Service, Rocky Mountain Research Station.<br />
18 p.<br />
Vitorelo, B., H-S. Han, and J.M. Varner. 2009. Masticators <strong>for</strong> fuel reduction treatment:<br />
equipment options, effectiveness, costs, and environmental impacts. Proc. 2006 Council<br />
On Forest Engineering (COFE) meeting, Lake Tahoe, CA. 11p.<br />
Windell, K.and S. Bradshaw. 2000. Understory biomass reduction <strong>method</strong>s and equipment<br />
catalog. Tech. Rep. 0051-2826-MTDC. Missoula, MT: USDA Forest Service, Missoula<br />
Technology and Development Center. 256 p.<br />
12