Chenik Lake - Cook Inlet Aquaculture Association, Kenai, Alaska
Chenik Lake - Cook Inlet Aquaculture Association, Kenai, Alaska
Chenik Lake - Cook Inlet Aquaculture Association, Kenai, Alaska

You also want an ePaper? Increase the reach of your titles
YUMPU automatically turns print PDFs into web optimized ePapers that Google loves.
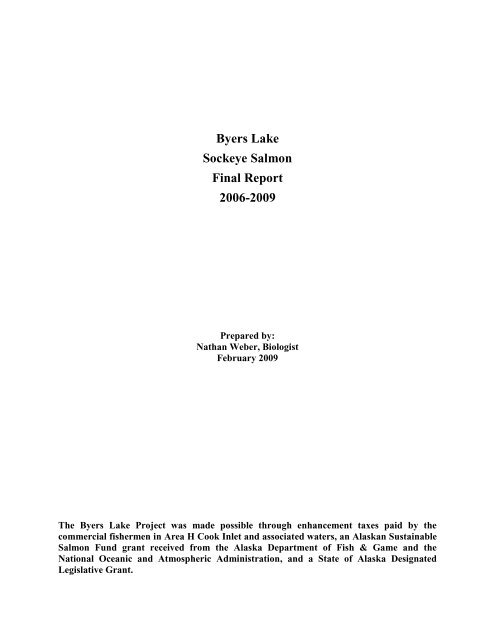
Byers <strong>Lake</strong><br />
Sockeye Salmon<br />
Final Report<br />
2006-2009<br />
Prepared by:<br />
Nathan Weber, Biologist<br />
February 2009<br />
The Byers <strong>Lake</strong> Project was made possible through enhancement taxes paid by the<br />
commercial fishermen in Area H <strong>Cook</strong> <strong>Inlet</strong> and associated waters, an <strong>Alaska</strong>n Sustainable<br />
Salmon Fund grant received from the <strong>Alaska</strong> Department of Fish & Game and the<br />
National Oceanic and Atmospheric Administration, and a State of <strong>Alaska</strong> Designated<br />
Legislative Grant.
This page was intentionally left blank
DISCLAIMER<br />
The <strong>Cook</strong> <strong>Inlet</strong> <strong>Aquaculture</strong> <strong>Association</strong> conducts salmon enhancement and restoration projects<br />
in Area H, <strong>Cook</strong> <strong>Inlet</strong> and associated waters. As an integral part of these projects a variety of<br />
monitoring and evaluation studies are conducted. The following progress report is a synopsis of<br />
the monitoring and evaluation studies conducted for Byers <strong>Lake</strong>. This Byers <strong>Lake</strong> Progress<br />
Report encompasses data collected from the 2006 adult sockeye escapement through the 2009<br />
sockeye smolt migration as it falls under the <strong>Alaska</strong>n Sustainable Salmon Fund grant.<br />
The purpose of the progress report is to provide a vehicle to distribute the information produced<br />
by the monitoring and evaluation studies. Data collected each year are presented with a<br />
summary of the information previously collected for comparative purposes. These reports are<br />
intended to provide a general description of project activity and are not an exhaustive evaluation<br />
of any restoration or enhancement project. The information presented in this report has not<br />
undergone an extensive review. As reviews are completed, the information may be updated and<br />
presented in later progress reports.<br />
The Byers <strong>Lake</strong> Progress Report was prepared by <strong>Cook</strong> <strong>Inlet</strong> <strong>Aquaculture</strong> <strong>Association</strong> under<br />
award of the <strong>Alaska</strong>n Sustainable Salmon Fund 45608 from the National Oceanic and<br />
Atmospheric Administration, U.S. Department of Commerce, administered by the <strong>Alaska</strong><br />
Department of Fish and Game. The statements, findings, conclusions, and recommendations are<br />
those of the author(s) and do not necessarily reflect the views of the National Oceanic and<br />
Atmospheric Administration, the U.S. Department of Commerce, or the <strong>Alaska</strong> Department of<br />
Fish and Game.<br />
CIAA maintains a strong policy of equal employment opportunity for all employees and<br />
applicants for employment. We hire, train, promote, and compensate employees without regard<br />
for race, color, religion, sex, sexual orientation, national origin, age, marital status, disability or<br />
citizenship, as well as other classifications protected by applicable federal, state or local laws.<br />
Our equal employment opportunity philosophy applies to all aspects of employment with CIAA<br />
including recruiting, hiring, training, transfer, promotion, job benefits, pay, dismissal, and<br />
educational assistance.<br />
i
This page was intentionally left blank<br />
ii
ACKNOWLEDGEMENTS<br />
Many individuals and agencies contributed to the success of the Byers <strong>Lake</strong> Project from 2006<br />
through 2009. Appreciation is extended to <strong>Cook</strong> <strong>Inlet</strong> <strong>Aquaculture</strong> <strong>Association</strong> 2006 Interns<br />
Josh Iamurri and Danielle DesRosier, and Seasonal Assistant Paul Blanche, the CIAA 2007<br />
Interns Jennifer Grew, Nichole McManus, and Jennifer Hillman, the CIAA 2008 Interns Andrew<br />
Smart, Trennan Dorval, Conner Mewhinney, and Jacob Miller, and Seasonal Assistants Nathan<br />
Weber and Kevin Lauscher, and the CIAA 2009 Interns Lukas Eddy and Zachary Baer, as well<br />
as all full time staff who aided in the field. Special thanks go to the <strong>Alaska</strong> Department of Fish<br />
and Game Upper <strong>Cook</strong> <strong>Inlet</strong> fisheries offices for the support they provided during this project.<br />
iii
This page was intentionally left blank<br />
iv
TABLE OF CONTENTS<br />
DISCLAIMER ................................................................................................................................. i<br />
ACKNOWLEDGEMENTS ........................................................................................................... iii<br />
TABLE OF CONTENTS ................................................................................................................ v<br />
LIST OF FIGURES ...................................................................................................................... vii<br />
LIST OF TABLES ......................................................................................................................... ix<br />
ABSTRACT ................................................................................................................................... xi<br />
INTRODUCTION AND PURPOSE .............................................................................................. 1<br />
PROJECT AREA ............................................................................................................................ 3<br />
METHODS ..................................................................................................................................... 5<br />
RESULTS AND DISCUSSION ..................................................................................................... 9<br />
RECOMMENDATIONS .............................................................................................................. 15<br />
LITERATURE CITED ................................................................................................................. 17<br />
APPENDICES .............................................................................................................................. 19<br />
v
This page was intentionally left blank<br />
vi
LIST OF FIGURES<br />
Figure 1 Byers <strong>Lake</strong> in relation to <strong>Cook</strong> <strong>Inlet</strong> and <strong>Alaska</strong> .......................................................... 3<br />
Figure 2 Hydrographic map of Byers <strong>Lake</strong> ................................................................................. 4<br />
vii
This page was intentionally left blank<br />
viii
LIST OF TABLES<br />
Table 1. Byers <strong>Lake</strong> average open water season water quality characteristics, 2006 – 2009 ..... 9<br />
Table 2. Seasonal Mean Zooplankton Density and Biomass of Byers <strong>Lake</strong> ............................... 9<br />
Table 3. Summary of Byers <strong>Lake</strong> sockeye smolt characteristics, 2006 – 2009......................... 12<br />
Table 4. Summary of Byers <strong>Lake</strong> adult sockeye salmon characteristics, 2006 – 2008 ............. 13<br />
ix
This page was intentionally left blank<br />
x
ABSTRACT<br />
The 2006 Byers <strong>Lake</strong> adult escapement was the first time CIAA monitored Byers Creek by use<br />
of weir. The adult escapement was enumerated from 13 July and continued daily until 16<br />
August when the weir became inoperable due to extreme flooding conditions. During this time<br />
3,071 adult sockeye (O. nerka) salmon returned to Byers Creek.<br />
Adult sockeye salmon characteristics were not evaluated during the 2006 field season. Field<br />
personnel collected 10 adult sockeye samples and were not sufficient to evaluate age analysis<br />
The 2007 smolt migration was enumerated from 25 May and continued daily until 25 June.<br />
During this time 15,530 sockeye (O. nerka) and 982 coho (O. kisutch) smolts migrated from the<br />
lake. The 10% sub-sampling procedure was not used and all smolt were physically counted<br />
during the monitoring period.<br />
Based on the sockeye smolt samples collected, an estimated 99% (±0.001%) were age 1 and 1%<br />
(±3.5%) were age 2. The average length and weight of age 1 sockeye smolt were 99 mm (±0.4<br />
mm) and 8.5 g (±0.2 g). The average length and weight of age 2 sockeye smolt were 102 mm<br />
(±3.5 mm) and 9.9 g (±3.1 g)<br />
The 2007 adult salmon escapement was enumerated from 16 July and continued daily until 30<br />
August. During this time, 1,701 adult sockeye (O. nerka) returned to Byers Creek.<br />
Based on adult sockeye samples collected, 2.35% were age 0.3, 7.05% were age 1.2, 85.13%<br />
were age 1.3, 2.35% were age 2.2 and 3.12% were age 2.3. Of the returning salmon population,<br />
55% were male and 45% were female. The average length of adult sockeye population was 568<br />
mm. The average length of adult sockeye males was 582 mm. The average length of adult<br />
sockeye females was 550 mm.<br />
The 2008 smolt migration was enumerated from 30 May and continued daily until 24 June.<br />
During this time 6,470 sockeye (O. nerka) and 24,287 coho (O. kisutch) smolts migrated from<br />
the lake. The 10% sub-sampling procedure was not used and all smolt were physically counted<br />
during the monitoring period.<br />
Based on the sockeye smolt samples collected, an estimated 99% (±0.002%) were age 1 and 1%<br />
(±3.2%) were age 2. The average length and weight of age 1 sockeye smolt were 90 mm (±0.8<br />
mm) and 7.1 g (±1.9 g). The average length and weight of age 2 sockeye smolt were 127 mm<br />
(±13 mm) and 18.7 g (±6.5 g).<br />
The 2008 adult salmon escapement was enumerated from 16 July and continued daily until 26<br />
August. During this time, 1,482 adult sockeye (O. nerka) salmon returned to Byers Creek.<br />
Based on adult sockeye samples collected, 2.41% were age 0.3, 6.17% were age 1.2, 84.92%<br />
were age 1.3, 0.34% were age 1.4, 0.34% were age 2.2, and 5.83% were age 2.3. Of the<br />
returning salmon population, 58% were male and 42% were female. The average length of adult<br />
xi
sockeye population was 573 mm. The average length of adult sockeye males was 582 mm. The<br />
average length of adult sockeye females was 560 mm.<br />
The 2009 smolt migration was enumerated from 28 May and continued daily until 29 June.<br />
During this time, an estimated 14,800 sockeye (O. nerka) and 17,700 coho (O. kisutch) smolts<br />
migrated from the lake. High water upon arrival on May 28 in Byers Creek prevented the field<br />
crew from completing the set-up of the smolt trap. On June 2, the stream stage decreased in<br />
Byers Creek enough to complete the smolt trap set-up. The total smolt count was not estimated<br />
using the trap efficiency procedure. The 10% sub-sampling procedure was not used and all smolt<br />
were physically counted during the monitoring period.<br />
Based on the sockeye smolt samples collected, an estimated 99% (±0.001%) were age 1 and 1%<br />
(±1.7%) were age 2. The average length and weight of age 1 sockeye smolt were 93 mm (±0.4<br />
mm) and 8.2g (±0.1 g). The average length and weight of age 2 sockeye smolt were 101 mm<br />
(±13.5 mm) and 10.5 g (±4.3 g).<br />
Water chemistry and zooplankton samples were collected twice in 2006, 4 times during 2007, 5<br />
times in 2008, and 5 times in 2009. A summary of average open water quality characteristics is<br />
listed in Table 1. ADF&G provided the analysis.<br />
xii
INTRODUCTION AND PURPOSE<br />
To better understand the recent unexpected low adult sockeye returns to Upper <strong>Cook</strong> <strong>Inlet</strong>, the<br />
<strong>Cook</strong> <strong>Inlet</strong> <strong>Aquaculture</strong> <strong>Association</strong> (CIAA) is conducting a complete enumeration of both the<br />
juvenile and adult migrations on seven lakes thought to be key sockeye salmon producers in the<br />
Upper <strong>Cook</strong> <strong>Inlet</strong> drainage. Understanding the adult to juvenile relationship will allow<br />
management biologists to analyze and evaluate the production and rearing conditions of each<br />
lake. In addition to the collection of physical data on juvenile and adult salmon, CIAA is also<br />
collecting water quality measurements to better understand the entire salmon life cycle. Our goal<br />
is to collect sound biological data to provide the foundation on which decisions for management<br />
and rehabilitation strategies will be drawn.<br />
The smolt and adult enumeration studies and water quality measurements being collected by<br />
CIAA are part of a large effort by the <strong>Alaska</strong> Department of Fish and Game (ADF&G) to assess<br />
the salmon rearing environment of the Upper <strong>Cook</strong> <strong>Inlet</strong> drainage. To assist ADF&G, CIAA<br />
collected genetic samples from adult fish for analysis and recorded adult fish marked with a<br />
Passive Integrated Transponder tag for a mark-recapture study being conducted by ADF&G.<br />
ADF&G is also conducting a fall hydroacoustic analysis to survey fry production in each lake.<br />
All information recorded by CIAA is provided to ADF&G.<br />
1
This page was intentionally left blank<br />
2
PROJECT AREA<br />
Byers <strong>Lake</strong> is located in Denali State Park approximately 50 km north of Talkeetna, <strong>Alaska</strong><br />
(Figure 1). Significant vegetation along the lake is alder (Alnus spp.), birch (Betula spp.) and<br />
cottonwood (Populus spp.). The lake covers 131.5 ha, has a maximum depth of 54.0 m, a mean<br />
depth of 20.0 m, a 6.4 km shoreline, and is located at an elevation of 248.8 m above sea level<br />
(Figure 2). Byers <strong>Lake</strong> has a discharge via Byers Creek which flows southwest into the Chulitna<br />
River.<br />
Byers<br />
<strong>Lake</strong><br />
Talkeetna<br />
Figure 1<br />
Byers <strong>Lake</strong> in relation to <strong>Cook</strong> <strong>Inlet</strong> and <strong>Alaska</strong><br />
3
Byers <strong>Lake</strong><br />
Figure 2 Hydrographic map of Byers <strong>Lake</strong><br />
4
Limnological Sampling<br />
METHODS<br />
Assessments of water quality were started during the 2006 adult escapement and continued<br />
during open water season through the 2009 adult escapement. One primary site was sampled for<br />
dissolved oxygen, temperature, light transmission profile, Secchi disk transparency, and<br />
zooplankton densities. Samples for analysis of phosphorous, carbon, chlorophyll a, phaeophytin<br />
a, nitrogen, calcium, magnesium, iron, conductivity, pH, alkalinity, turbidity, and color were also<br />
collected with a Kemmerer sampler one meter below the surface and from the midhypolimnion.<br />
One secondary site was limited to the zooplankton density and Secchi disk transparency. Water<br />
samples were collected by CIAA and water analysis completed by ADF&G. Sample collection<br />
and analysis procedures are described by Koenings, et al. (1986).<br />
Environmental Conditions<br />
Percent cloud cover was visually estimated, stream stage was measured to the nearest tenth of a<br />
foot, precipitation measured to the nearest millimeter and water and air temperatures were<br />
recorded at 5:00 PM each day. Stream stage measurements were not comparative between<br />
seasons as the staff gage location varied from year to year. Standard CIAA procedures were<br />
followed for collecting these observations (CIAA, 2006).<br />
Smolt Enumeration<br />
To enumerate the smolt migration, a smolt trap was temporarily placed in Byers Creek just<br />
below the lake outlet. The smolt trap consisted of a modified fyke net with Vexar® netting leads<br />
and a double compartment live-box. The leads and fyke net funneled migrating smolt into the<br />
live-box. A swing gate remotely controlled by the trap operators directed smolt into one of two<br />
live-box compartments where they were enumerated and a smolt sample was collected.<br />
A total count of smolt migrating from the lake was made until the migration of fish exceeded<br />
1,000 to 2,000 fish per hour. At migrations rates greater than 2,000 fish per hour, fish densities<br />
in the trap become too great and the fish become stressed. To avoid stressing the fish during<br />
periods of peak migration, a 10% sub-sampling procedure was used to enumerate the fish.<br />
5
To enumerate migrating smolt with the 10% sub-sampling procedure, the counting period was<br />
divided into 20-minute intervals. During each 20-minute interval, migrating fish were directed<br />
into the live-box for two minutes and counted. During the remaining 18 minutes, migrating<br />
smolt passed through the trap uncounted. To estimate the number of smolt migrating during the<br />
20-minute interval, the two-minute smolt count was multiplied by 10.<br />
Assuming the two-minute sub-sampling intervals were randomly distributed throughout subsampling<br />
1 and smolt moved through the weir randomly, the total smolt migration was estimated<br />
as follows:<br />
If:<br />
T<br />
c<br />
=<br />
number of fish counted with the total count procedure,<br />
Tˆ =<br />
s<br />
Tˆ =<br />
y =<br />
n =<br />
N =<br />
number of fish counted with the 10% sub-sampling procedure,<br />
the total smolt migration,<br />
the number of fish counted in each two minute sub-sampling interval,<br />
the number of two minute sub-sampling intervals sampled, and<br />
the number of possible two minute sub-sampling intervals,<br />
Then, the total smolt migration (Tˆ ) is:<br />
with a variance of:<br />
T<br />
T T<br />
c s ;<br />
v T N N n / N y y / n n<br />
s<br />
2 2<br />
i<br />
1 ;<br />
and 95% confidence limits of:<br />
Tˆ 2 v ˆ .<br />
s<br />
T s<br />
The variance about the estimated smolt migration, T , is equal to the variance about T s , because<br />
T c<br />
is a total count with 0 variance.<br />
1 Predetermined random 2-minute sampling intervals assured random distribution within each 20-minute period.<br />
6
The smolt characteristics of Byers <strong>Lake</strong> were assessed by collecting a sample of the migrating<br />
smolts to determine length and weight characteristics of the population. During the 2007, 2008,<br />
and 2009 smolt migrations, sockeye samples were collected at an interval of n=40 per day and<br />
coho samples were collected at an interval of n=20 per day. Field personnel collected samples<br />
randomly throughout each day. Each smolt collected for evaluation was first measured to the<br />
nearest millimeter for fork length 2 and then weighed to the nearest 0.1 gram. Several scales were<br />
also removed from the primary growth area 3 and mounted on a glass slide for subsequent age<br />
determination. Scale samples were read by CIAA full-time staff at headquarters in <strong>Kenai</strong>.<br />
During the 2007 smolt migration, 601 sockeye smolt scale samples were collected and read.<br />
During the 2008 smolt migration, 451 sockeye smolt scales samples were collected and read.<br />
During the 2009 smolt migration, 1,079 sockeye smolt samples were collected and read.<br />
During the 2007 smolt migration, coho juvenile samples collected were all fry. During the 2008<br />
smolt migration, 427 coho smolt scales samples were collected and read. During the 2009 smolt<br />
migration, 515 sockeye smolt samples were collected and read.<br />
Adult Enumeration<br />
The escapement enumeration includes an assessment of the sex, age, and standard fork length 4 of<br />
the returning population of fish. To enumerate returning adult salmon and facilitate data<br />
collection, a counting weir was temporarily installed in Byers Creek in 2006, 2007, and 2008.<br />
The weir was constructed of 1.9 cm galvanized pipe and 7.6 cm aluminum channel. The<br />
galvanized pipe was picketed through 1.9 cm holes in the aluminum channel spaced 2.54 cm<br />
apart.<br />
Field personnel visually counted the adult fish as they ascended Byers Creek. By removing one<br />
or two pickets fish were permitted to pass through the weir. Initially counts were made at least<br />
twice a day. As the number of fish ascending Byers Creek increased, counts were made more<br />
2 Standard fork length was measured from the tip of the snout to the fork of the tail.<br />
3 The primary growth area is located above the lateral line on a diagonal from the posterior insertion of the dorsal fin to the anterior insertion of the anal fin.<br />
7
frequently to prevent fish from accumulating behind the weir. Personnel also checked for<br />
ADF&G tags on adult sockeye passing through the weir.<br />
The adult characteristics of Byers <strong>Lake</strong> were assessed by collecting a sample of the migrating<br />
adult sockeye salmon to determine age, length, and sex characteristics of the population. During<br />
the 2006, 2007, and 2008 adult escapements, sockeye samples were randomly collected at an<br />
interval of n=40 per day. Each adult sockeye collected for evaluation was first measured to the<br />
nearest millimeter for standard fork length 4 , and estimated sex. For age evaluation, field<br />
personnel removed a scale from the primary growth area 3 . The fish were unharmed and released<br />
upstream. Scale samples were sent to the ADF&G Soldotna office for analysis.<br />
During the 2006 adult escapement, zero scale samples were analyzed for age. During the 2007<br />
adult escapement, 128 scale samples were analyzed for age. During the 2008 adult escapement,<br />
291 scale samples were analyzed for age.<br />
5<br />
3The primary growth area is located above the lateral line on a diagonal from the posterior insertion of the dorsal fin to the anterior insertion of the anal fin.<br />
4 Standard fork length was defined as the measurement from mid-eye to the fork of the tail.<br />
8
RESULTS AND DISCUSSION<br />
Limnological Conditions<br />
Limnological conditions are a key component in understanding Byers <strong>Lake</strong> productivity and<br />
rearing conditions in this monitoring study. Water chemistry and zooplankton samples were<br />
conducted 2 times in 2006. In 2007, water chemistry and zooplankton samples were collected 4<br />
times. In 2008, water chemistry and zooplankton samples were collected 5 times. In 2009,<br />
water chemistry and zooplankton samples were collected 5 times. A summary of Limnological<br />
conditions is listed in Table 1. ADF&G Soldotna Lab provided the analysis for limnological<br />
conditions.<br />
Table 1 – Average open water season water quality characteristics of Byers <strong>Lake</strong><br />
AVERAGE WATER QUALITY - 1 METER<br />
TP TFP FRP TKN NH3+NH4 NO2+NO3 RSi Org C Chla Phaeo EZD Sp. Cond pH Alk Turb Color Ca Mg Fe Secchi<br />
Year (ug/l) (ug/l) (ug/l) (ug/l) (ug/l) (ug/l) TN:TP (ug/l) (ug/l) (ug/l) (ug/l) Sta (m) (umhos/cm) (SU) (mg/l) (NTU) (Pt) (mg/l) (mg/l) (ug/l) Sta (meters)<br />
2006 7.7 4.1 3.8 145.3 12.0 447.1 170 :1 3,939 517 0.64 0.36 A - 35 6.4 11.7 1.1 15 4.9 0.2 64 A 4.1<br />
2007 7.1 3.6 3.7 123.9 12.8 293.8 130 :1 4,214 374 0.65 0.27 A 11.9 41 6.2 16.1 0.7 9 5.4 0.7 30 A 6.6<br />
2008 11.4 7.6 2.0 118.5 6.7 365.9 94 :1 3,760 143 0.50 0.26 A 11.0 38 6.7 15.6 0.4 11 4.8 0.7 46 A 5.4<br />
2009 14.6 10.7 1.5 152.1 11.9 405.7 84 :1 3,727 165 0.65 0.27 A 12.3 39 6.7 15.4 0.4 11 5.1 0.9 57 A 5.6<br />
AVERAGE WATER QUALITY - HYPOLIMNION<br />
TP TFP FRP TKN NH3+NH4 NO2+NO3 RSi Org C Chla Phaeo EZD Sp. Cond pH Alk Turb Color Ca Mg Fe Secchi<br />
Year (ug/l) (ug/l) (ug/l) (ug/l) (ug/l) (ug/l) TN:TP (ug/l) (ug/l) (ug/l) (ug/l) Sta (m) (umhos/cm) (SU) (mg/l) (NTU) (Pt) (mg/l) (mg/l) (ug/l) Sta (meters)<br />
2006 6.9 3.3 4.1 89.2 15.7 604.4 223 :1 4,419 591 0.19 0.18 B 7.5 38 6.4 13.0 0.7 13 5.0 0.3 75 B 5.1<br />
2007 7.3 3.8 4.0 118.5 21.3 401.8 158 :1 4,667 326 0.48 0.44 B 11.0 39 6.2 15.1 0.6 11 5.1 0.7 48 B 6.6<br />
2008 6.9 4.5 2.2 129.3 6.7 418.5 175 :1 3,898 123 0.61 0.41 B 10.6 38 6.7 15.4 0.5 11 5.0 0.7 48 B 5.6<br />
2009 8.8 5.0 1.5 131.8 8.2 432.1 141 :1 3,847 125 0.39 0.27 B 10.3 38 6.6 15.1 0.4 11 5.0 0.9 55 B 5.6<br />
EZD and Secchi provided by CIAA.<br />
Open water season only.<br />
Table 2 – Seasonal Mean Zooplankton Density and Biomass of Byers <strong>Lake</strong><br />
Environmental Conditions<br />
Density<br />
Biomass<br />
Seasonal Mean Seasonal Weighted Mean<br />
Year (No/m2) (mg/m2)<br />
2006 269,964 770<br />
2007 196,575 575<br />
2008 190,547 317<br />
2009 242,892 748<br />
During the 2006 adult sockeye migration environmental conditions were monitored from 13 July<br />
to 16 August. Due to a delay in delivery of environmental apparatus, data was not recorded for<br />
stream stage measurements. Partial data was recorded for water and air temperatures. None of<br />
9
the days were clear, 43% were partly cloudy, and 57% were completely overcast. Measurable<br />
rain was recorded on 22 days. A total of 1,786 mm of rain fell during this period.<br />
During the 2007 smolt migration, environmental conditions were monitored from 25 May to 25<br />
June. Stream stage measurements averaged 1.65 feet and ranged from 1.55 to 1.71 feet. Stream<br />
temperatures averaged 12 C and ranged from 7 to 18 C. Air temperatures averaged 21 C and<br />
ranged from 10 to 30 C. Three percent of the days were clear, 41% were partly cloudy, and 56%<br />
were completely overcast. Measurable rain was recorded on 20 days during the smolt migration.<br />
A total of 62 mm of rain fell during this period.<br />
During the 2007 adult escapement, environmental conditions were monitored from 16 July to 30<br />
August. Stream stage measurements averaged 1.26 feet and ranged from 1.15 to 1.90 feet.<br />
Stream temperatures averaged 20 C and ranged from 18 to 23 C. Air temperatures averaged<br />
18 C and ranged from 9 to 30 C. Four percent of the days were clear, 35% were partly cloudy,<br />
and 61% were completely overcast. Measurable rain was recorded on 25 days during the adult<br />
escapement. A total of 154 mm of rain fell during this period.<br />
During the 2008 smolt migration, environmental conditions were monitored from 30 May to 24<br />
June. Stream stage measurements averaged 1.42 feet and ranged from 1.28 to 1.63 feet. Stream<br />
temperatures averaged 9 C and ranged from 4 to 13 C. Air temperatures averaged 16 C and<br />
ranged from 10 to 21 C. Four percent of the days were clear, 23% were partly cloudy, and 23%<br />
were completely overcast. Measurable rain was recorded on 14 days during the smolt migration.<br />
A total of 39 mm of rain fell during this period.<br />
During the 2008 adult escapement, environmental conditions were monitored from 16 July to 26<br />
August. Stream stage measurements averaged 1.05 feet and ranged from 0.89 to 1.15 feet.<br />
Stream temperatures averaged 15 C and ranged from 12 to 20 C. Air temperatures averaged<br />
15 C and ranged from 10 to 21 C. None of the days were clear, 19% were partly cloudy, and<br />
52% were completely overcast. Measurable rain was recorded on 36 days during the adult<br />
escapement. A total of 188 mm of rain fell during this period.<br />
10
During the 2009 smolt migration, environmental conditions were monitored from 28 May to 29<br />
June. Stream stage measurements averaged 1.47 feet and ranged from 1.07 to 2.22 feet. Stream<br />
temperatures averaged 11 C and ranged from 5 to 14 C. Air temperatures averaged 16 C and<br />
ranged from 7 to 22 C. Nine percent of the days were clear, 18% were partly cloudy, and 45%<br />
were completely overcast. Measurable rain was recorded on 12 days during the smolt migration.<br />
A total of 42 mm of rain fell during this period.<br />
Smolt Enumeration<br />
The 2007 smolt migration was enumerated from 25 May and continued daily until 25 June.<br />
During this time 15,530 sockeye (O. nerka) and 982 coho (O. kisutch) smolts migrated from the<br />
lake. The 10% sub-sampling procedure was not used and all smolt were physically counted<br />
during the monitoring period. Based on the sockeye smolt samples collected, an estimated 99%<br />
(±0.001%) were age 1 and 1% (±3.5%) were age 2. The average length and weight of age 1<br />
sockeye smolt were 99 mm (±0.4 mm) and 8.5 g (±0.2 g). The average length and weight of age<br />
2 sockeye smolt were 102 mm (±3.5 mm) and 9.9 g (±3.1 g)<br />
The 2008 smolt migration was enumerated from 30 May and continued daily until 24 June.<br />
During this time 6,470 sockeye (O. nerka) and 24,287 coho (O. kisutch) smolts migrated from<br />
the lake. The 10% sub-sampling procedure was not used and all smolt were physically counted<br />
during the monitoring period. Based on the sockeye smolt samples collected, an estimated 99%<br />
(±0.002%) were age 1 and 1% (±3.2%) were age 2. The average length and weight of age 1<br />
sockeye smolt were 90 mm (±0.8 mm) and 7.1 g (±1.9 g). The average length and weight of age<br />
2 sockeye smolt were 127 mm (±13 mm) and 18.7 g (±6.5 g). Other fish counted was 1 chinook<br />
(O. tshawytscha) smolt salmon. Based on the reported ice-out date on 20 May, there was an<br />
unknown number of fish which migrated before monitoring began.<br />
The 2009 smolt migration was enumerated from 28 May and continued daily until 29 June.<br />
During this time, an estimated 14,800 sockeye (O. nerka) and 17,700 coho (O. kisutch) smolts<br />
migrated from the lake. The 10% sub-sampling procedure was not used and all smolt were<br />
physically counted during the monitoring period. Based on the sockeye smolt samples collected,<br />
11
an estimated 99% (±0.001%) were age 1 and 1% (±1.7%) were age 2. The average length and<br />
weight of age 1 sockeye smolt were 93 mm (±0.4 mm) and 8.2g (±0.1 g). The average length<br />
and weight of age 2 sockeye smolt were 101 mm (±13.5 mm) and 10.5 g (±4.3 g). Other fish<br />
counted were 122 chinook (O. tshawytscha) smolt salmon. High water upon arrival on May 28<br />
in Byers Creek prevented the field crew from completing the set-up of the smolt trap. On June 2,<br />
the stream stage decreased in Byers Creek to complete the smolt trap set-up.<br />
Table 3 – Summary of Byers <strong>Lake</strong> sockeye salmon smolt characteristics<br />
Age Class (%) Mean length (mm) Mean weight (g)<br />
Smolt Age 95% Age 95% Age 95% Age 95% Age 95% Age 95%<br />
Year 1.0 C.I. 2.0 C.I. 1.0 C.I. 2.0 C.I. 1.0 C.I. 2.0 C.I.<br />
2007 99% (±0.001) 1% (±3.5) 99 (±0.4) 102 (±3.5) 8.5 (±0.2) 9.9 (±3.5)<br />
2008 99% (±0.002) 1% (±3.2) 90 (±0.8) 127 (±13) 7.1 (±1.9) 18.7 (±6.5)<br />
2009 99% (±0.001) 1% (±1.7) 93 (±0.4) 101 (±13.5) 8.2 (±0.1) 10.5 (±4.3)<br />
Mean 99% 1% 94 110 7.9 13.0<br />
Adult Enumeration<br />
The 2006 adult escapement was enumerated from 13 July and continued daily until 16 August<br />
when the weir became inoperable due to extreme flooding conditions. During this time 3,071<br />
adult sockeye (O. nerka) salmon returned to Byers Creek. Other fish counted during this time<br />
were 51 chinook (O. tshawytscha), 1,280 pink (O. gorbuscha) salmon, 49 chum (O. keta)<br />
salmon, and 9 dolly varden.<br />
Adult sockeye salmon characteristics were not evaluated during the 2006 field season. Field<br />
personnel collected 10 adult sockeye samples and were not sufficient to evaluate age analysis.<br />
ADF&G Gene Conservation Lab in Anchorage conducted a Finfish DNA Analysis to determine<br />
the genetic characteristics and profile of the sockeye population at Byers <strong>Lake</strong>. CIAA crew were<br />
instructed to randomly collect up to 200 axillary processes of adult sockeye salmon returning to<br />
the lake and samples were sent to ADF&G Gene Conservation Lab in Anchorage for analysis.<br />
ADF&G Gene Conservation Lab provided CIAA with sampling procedures. CIAA also assisted<br />
ADF&G Sport Division with a Sockeye Mark-Recapture PIT tag study. Field personnel scanned<br />
12
PIT tags during the adult escapement. ADF&G Sport Division provided the procedures and<br />
analysis.<br />
The 2007 adult salmon escapement was enumerated from 16 July and continued daily until 30<br />
August. During this time, 1,701 adult sockeye (O. nerka) returned to Byers Creek. Based on<br />
adult sockeye samples collected, 2.35% were age 0.3, 7.05% were age 1.2, 85.13% were age 1.3,<br />
2.35% were age 2.2 and 3.12% were age 2.3. Of the returning salmon population, 55% were<br />
male and 45% were female. The average length of adult sockeye population was 568 mm. The<br />
average length of adult sockeye males was 582 mm. The average length of adult sockeye<br />
females was 550 mm. Other fish counted during this time were 17 adult coho (O. kisutch)<br />
salmon, 12 adult chinook (O. tshawytscha) salmon, and 12 adult rainbow trout.<br />
The 2008 adult salmon escapement was enumerated from 16 July and continued daily until 26<br />
August. During this time, 1,482 adult sockeye (O. nerka) salmon returned to Byers Creek.<br />
Based on adult sockeye samples collected, 2.41% were age 0.3, 6.17% were age 1.2, 84.92%<br />
were age 1.3, 0.34% were age 1.4, 0.34% were age 2.2, and 5.83% were age 2.3. Of the<br />
returning salmon population, 58% were male and 42% were female. The average length of adult<br />
sockeye population was 573 mm. The average length of adult sockeye males was 582 mm. The<br />
average length of adult sockeye females was 560 mm. Other fish counted during this time were<br />
46 adult coho (O. kisutch) salmon, 20 adult chinook (O. tshawytscha) salmon, 7,711 adult pink<br />
(O. gorbuscha) salmon, 3 adult chum (O. keta), and 3 rainbow trout. A summary of 2006-2008<br />
adult sockeye characteristics is listed in Table 4.<br />
Table 4 - Summary of Byers <strong>Lake</strong> adult sockeye salmon characteristics<br />
Escapement<br />
Major Age Classes<br />
Male<br />
Female<br />
0.3 1.2 1.3 2.2 1.4 2.3<br />
Year Number (%) Lth(mm) (%) Lth(mm) (%) Lth(mm) (%) Lth(mm) (%) Lth(mm) (%) Lth(mm) (%) Lth(mm) (%) Lth(mm)<br />
2006 3,071 ND ND ND ND ND ND ND ND ND ND ND ND ND ND ND ND<br />
2007 1,701 55% 582 45% 550 2.35% 564 7.05% 499 85.13% 577 2.35% 490 3.12% 550<br />
2008 1,482 58% 582 42% 560 2.41% 587 6.17% 510 84.92% 576 0.34% 518 0.34% 559 5.83% 585<br />
Mean 2,085 57% 582 44% 555 2.38% 576 6.61% 505 85.03% 577 1.35% 504 0.34% 559 4.48% 568<br />
Min 1,482 55% 582 42% 550 2.35% 564 6.17% 499 84.92% 576 0.34% 490 0.34% 559 3.12% 550<br />
Max 3,071 58% 582 45% 560 2.41% 587 7.05% 510 85.13% 577 2.35% 518 0.34% 559 5.83% 585<br />
13
This page was intentionally left blank<br />
14
RECOMMENDATIONS<br />
CIAA recommends extending the Byers <strong>Lake</strong> sockeye salmon monitoring study. The project<br />
should continue to collect data consistent with the previous study during smolt migrations and<br />
adult escapements to provide further comparative data. Based on the reported ice-out on 20 May<br />
2008, smolt migration monitoring should begin approximately 2 weeks earlier than previous<br />
monitoring years. Based on 2006-2008 adult monitoring periods, field crews could start<br />
operations approximately 2 weeks later in future years.<br />
15
This page was intentionally left blank<br />
16
LITERATURE CITED<br />
CIAA, 2006. Byers <strong>Lake</strong> Procedures Manual. <strong>Cook</strong> <strong>Inlet</strong> <strong>Aquaculture</strong> <strong>Association</strong> 40610<br />
Kalifornsky Beach Road <strong>Kenai</strong>, <strong>Alaska</strong> 99611, 20 pp.<br />
Koenings, J.P., J.A. Edmundson, J.M. Edmundson, and G.B. Kyle. 1986. Limnology Field and<br />
Laboratory Manual: Methods for Assessing Aquatic Production. <strong>Alaska</strong> Department of<br />
Fish and Game. Division of Fisheries Rehabilitation, Enhancement and Development.<br />
Soldotna, AK 222 pages.<br />
17
This page was intentionally left blank<br />
18
APPENDICES<br />
19
This page was intentionally left blank<br />
20
Appendix 1 Byers <strong>Lake</strong> 2006 – Macrozooplankton Density<br />
Site A - Depth 15 - 25 m<br />
Mean<br />
Seasonal Mean<br />
Date 1-Aug 5-Sep 22-Sep (No/m 2 ) (No/m 2 )<br />
Epischura<br />
Cyclops 13,057 2,972 6,368 7,466 7,466<br />
Ovig .Cyclops 849 283 283<br />
Bosmina 95,541 92,569 59,857 82,656 82,656<br />
Ovig. Bosmina 637 849 637 708 708<br />
Daphnia l. 7,962 15,287 3,502 8,917 8,917<br />
Ovig. Daphnia l. 4,777 1,699 1,592 2,689 2,689<br />
Daphnia g. 18,790 42,887 212,685 91,454 91,454<br />
Ovig. Daphnia g. 12,739 40,340 73,230 42,103 42,103<br />
Total: 236,275 236,275<br />
Site B - Depth 40<br />
Mean<br />
Seasonal Mean<br />
Date 1-Aug 5-Sep 22-Sep (No/m 2 ) (No/m 2 )<br />
Epischura<br />
Cyclops 75,584 33,439 7,132 38,718 38,718<br />
Ovig. Cyclops 2,123 708 708<br />
Bosmina 193,206 150,000 166,072 169,759 169,759<br />
Ovig. Bosmina 7,643 1,911 1,698 3,751 3,751<br />
Daphnia l. 12,739 16,561 11,207 13,502 13,502<br />
Ovig. Daphnia l. 12,739 1,911 5,094 6,581 6,581<br />
Daphnia g 11,465 51,274 109,696 57,478 57,478<br />
Ovig. Daphnia g. 5,520 20,701 13,245 13,155 13,155<br />
Total: 303,653 303,653<br />
21
Appendix 1 (cont’d) Byers <strong>Lake</strong> 2006 – Macrozooplankton Biomass (cont’d)<br />
Site A - Depth 15 - 25 m<br />
Body Size (mm)<br />
Biomass (mg/m 2 )<br />
Seasonal<br />
Seasonal<br />
Weighted<br />
Weighted<br />
Date 1-Aug 5-Sep 22-Sep Mean Mean Mean Mean<br />
Epischura<br />
Cyclops 1.10 1.22 1.15 1.16 1.13 48 45<br />
Ovig .Cyclops 1.22 1.22 1.22 2 2<br />
Bosmina 0.71 0.86 0.88 0.82 0.81 193 188<br />
Ovig. Bosmina 1.25 1.23 1.24 1.24 1.24 4 4<br />
Daphnia l. 0.41 0.46 0.54 0.47 0.46 18 17<br />
Ovig. Daphnia l. 0.51 0.58 0.56 0.55 0.53 8 7<br />
Daphnia g. 0.53 0.72 0.72 0.66 0.71 169 198<br />
Ovig. Daphnia g. 0.76 0.93 1.04 0.91 0.98 158 184<br />
Total: 600 646<br />
Site B - Depth 40<br />
Body Size (mm)<br />
Seasonal<br />
Biomass (mg/m 2 )<br />
Seasonal<br />
Weighted<br />
Weighted<br />
Date 1-Aug 5-Sep 22-Sep Mean Mean Mean Mean<br />
Epischura<br />
Cyclops 1.11 1.14 1.15 1.13 1.12 237 230<br />
Ovig .Cyclops 1.21 1.21 1.21 5 5<br />
Bosmina 0.80 0.81 0.85 0.82 0.82 400 399<br />
Ovig. Bosmina 1.24 1.26 1.22 1.24 1.24 21 21<br />
Daphnia l. 0.42 0.47 0.53 0.47 0.47 28 28<br />
Ovig. Daphnia l. 0.52 0.55 0.58 0.55 0.54 19 18<br />
Daphnia g. 0.58 0.66 0.79 0.68 0.74 113 137<br />
Ovig. Daphnia g. 0.81 0.95 1.01 0.92 0.95 51 54<br />
Total: 875 893<br />
22
Appendix 1 (cont’d) Byers <strong>Lake</strong> 2006 – Water Quality<br />
Date Sta Depth TP TFP FRP TKN NH3+NH4 NO2+NO3 RSi Org C Chla Phaeo EZD<br />
(m) (ug/l) (ug/l) (ug/l) (ug/l) (ug/l) (ug/l) TN:TP (ug/l) (ug/l) (ug/l) (ug/l) Sta (m)<br />
1-Aug B 1 4.5 3.4 3.5 120.2 5.9 482.6 297 :1 3,651 510 0.44 0.30 A -<br />
1-Aug B 30 4.6 3.2 4.0 78.6 10.4 648.4 350 :1 4,466 361 0.14 0.16 B 11.9<br />
6-Sep B 1 10.9 4.7 4.0 170.3 18.1 411.6 118 :1 4,227 523 0.83 0.41 A -<br />
6-Sep B 30 9.2 3.4 4.1 99.8 20.9 560.4 159 :1 4,372 821 0.23 0.20 B 3.0<br />
Mean 1 - Meter 7.7 4.1 3.8 145.3 12.0 447.1 170 :1 3,939 517 0.64 0.36 A -<br />
Min 4.5 3.4 3.5 120.2 5.9 411.6 262 :1 3,651 510 0.44 0.30 0.0<br />
Max 10.9 4.7 4.0 170.3 18.1 482.6 133 :1 4,227 523 0.83 0.41 0.0<br />
Mean Hypolimnion 6.9 3.3 4.1 89.2 15.7 604.4 223 :1 4,419 591 0.19 0.18 B 7.5<br />
Min 4.6 3.2 4.0 78.6 10.4 560.4 308 :1 4,372 361 0.14 0.16 3.0<br />
Max 9.2 3.4 4.1 99.8 20.9 648.4 180 :1 4,466 821 0.23 0.20 11.9<br />
Date Sta Depth Sp. Cond pH Alk Turb Color Ca Mg Fe Secchi<br />
(m) (umhos/cm) (SU) (mg/l) (NTU) (Pt) (mg/l) (mg/l) (ug/l) Sta (meters)<br />
1-Aug B 1 38 6.4 13.4 1.0 9 5.4 0.2 58 A 5.0<br />
1-Aug B 30 38 6.4 13.2 0.1 12 5.0 0.2 80 B 5.0<br />
6-Sep B 1 32 6.3 10.0 1.1 20 4.4 0.2 69 A 3.3<br />
6-Sep B 30 37 6.3 12.7 1.2 13 5.0 0.3 69 B 5.1<br />
Mean 1 - Meter 35 6.4 11.7 1 15 4.9 0.2 64 A 4.1<br />
Min 32 6.3 10.0 1 9 4.4 0.2 58 3.3<br />
Max 38 6.4 13.4 1 20 5.4 0.2 69 5.0<br />
Mean Hypolimnion 38 6.4 13.0 1 13 5.0 0.3 75 B 5.1<br />
Min 37 6.3 12.7 0 12 5.0 0.2 69 5.0<br />
Max 38 6.4 13.2 1 13 5.0 0.3 80 5.1<br />
23
Appendix 2 Byers <strong>Lake</strong> 2006 - Environmental Conditions<br />
Water Air<br />
Precip. Stage Temp. Temp.<br />
Date Sky (mm) (ft) Flow ( o C) ( o C)<br />
13-Jul 4 0 ND ND ND ND<br />
14-Jul 4 23 ND ND ND ND<br />
15-Jul 4 25 ND ND ND ND<br />
16-Jul 4 13 ND ND ND ND<br />
17-Jul 3 4 ND ND ND ND<br />
18-Jul 3 2 ND ND ND ND<br />
19-Jul 2 0 ND ND ND ND<br />
20-Jul 2 0 ND ND ND ND<br />
21-Jul 3 0 ND ND ND ND<br />
22-Jul 2 0 ND ND ND ND<br />
23-Jul 2 0 ND ND ND ND<br />
24-Jul 5 0 ND ND ND 19<br />
25-Jul 4 12 ND ND 18 17<br />
26-Jul 3 3 ND ND 19 21<br />
27-Jul 2 0 ND ND 19 24<br />
28-Jul 2 0 ND ND 18 23<br />
29-Jul 5 5 ND ND 18 13<br />
30-Jul 5 20 ND ND 18 11<br />
31-Jul 3 1 ND ND 18 16<br />
1-Aug 5 1 ND ND 18 13<br />
2-Aug 4 2 ND ND 16 15<br />
3-Aug 4 2 ND ND 17 16<br />
4-Aug 4 4 ND ND 18 16<br />
5-Aug 2 0 ND ND 18 22<br />
6-Aug 2 0 ND ND 19 26<br />
7-Aug 2 0 ND ND 19 25<br />
8-Aug 2 0 ND ND 18 26<br />
9-Aug 5 5 ND ND 18 14<br />
10-Aug 5 38 ND ND 17 11<br />
11-Aug 4 8 ND ND 17 12<br />
12-Aug 5 8 ND ND 17 12<br />
13-Aug 4 31 ND ND 17 13<br />
14-Aug 5 29 ND ND 16 11<br />
15-Aug 4 12 ND ND 15 13<br />
16-Aug 4 5 ND ND 16 14<br />
Total 1786<br />
Avg. 7.2 ND ND 18 17<br />
Min. 0.0 ND ND 15 11<br />
Max. 38.0 ND ND 19 26<br />
Summary of Cloud Cover - Percent of Days<br />
No. Meas.<br />
Partly<br />
Days Rain Overcast Cloudy Clear<br />
Adults 35 63% 57% 43% 0%<br />
1.0 = Clear<br />
2.0 = Cloud Cover 50%<br />
4.0 = Overcast<br />
5.0 = Rain<br />
ND = No Data<br />
24
Appendix 3 Byers <strong>Lake</strong> 2006 – Adult Escapement<br />
Sockeye<br />
Coho King Pink Chum Rainbow D.V.<br />
Daily Total Daily Daily Daily Daily Daily Daily<br />
Date Escapement Return Escapement Escapement Escapement Escapement Escapement Escapement<br />
13-Jul 0 0 0 0 0 0 0 0<br />
14-Jul 0 0 0 0 0 0 0 0<br />
15-Jul 0 0 0 0 0 0 0 0<br />
16-Jul 0 0 0 0 0 0 0 0<br />
17-Jul 0 0 0 0 0 0 0 0<br />
18-Jul 0 0 0 0 0 0 0 0<br />
19-Jul 0 0 0 0 0 0 0 0<br />
20-Jul 3 3 0 0 0 0 0 0<br />
21-Jul 0 3 0 0 0 0 0 0<br />
22-Jul 0 3 0 0 0 0 0 0<br />
23-Jul 0 3 0 2 0 0 0 0<br />
24-Jul 0 3 0 0 0 0 0 0<br />
25-Jul 0 3 0 0 0 0 0 0<br />
26-Jul 0 3 0 0 0 0 0 0<br />
27-Jul 0 3 0 0 0 0 0 0<br />
28-Jul 0 3 0 0 0 0 0 0<br />
29-Jul 0 3 0 0 0 0 0 0<br />
30-Jul 1 4 0 0 0 0 0 0<br />
31-Jul 9 13 0 0 0 0 0 0<br />
1-Aug 1 14 0 0 0 0 0 0<br />
2-Aug 14 28 0 1 0 0 0 0<br />
3-Aug 2 30 0 0 0 0 0 0<br />
4-Aug 32 62 0 0 2 0 0 0<br />
5-Aug 18 80 0 0 1 0 0 1<br />
6-Aug 49 129 0 0 0 0 0 0<br />
7-Aug 132 261 0 0 0 0 0 1<br />
8-Aug 816 1,077 0 5 3 0 0 4<br />
9-Aug 307 1,384 0 2 8 0 0 0<br />
10-Aug 811 2,195 0 6 409 33 0 0<br />
11-Aug 384 2,579 0 8 156 0 0 0<br />
12-Aug 54 2,633 0 1 22 1 0 0<br />
13-Aug 31 2,664 0 6 115 5 0 3<br />
14-Aug 148 2,812 0 9 154 6 0 0<br />
15-Aug 136 2,948 0 6 238 3 0 0<br />
16-Aug 123 3,071 0 5 172 1 0 0<br />
Total 3,071 0 51 1,280 49 0 9<br />
25
8-Jul<br />
18-Jul<br />
28-Jul<br />
7-Aug<br />
17-Aug<br />
27-Aug<br />
Sockeye<br />
Appendix 4 Byers <strong>Lake</strong> 2006 – Update<br />
Misc. Activities<br />
Adult Migration<br />
Ice-out: ND<br />
(approximate date)<br />
Dates: 13-Jul to 16-Aug<br />
Adult Crew On-site: 15-Jul<br />
No. %<br />
Adult Crew Off-site: 27-Aug<br />
Sockeyes: 3,701 100%<br />
Mortalities: 0<br />
Coho: 0<br />
King: 51<br />
Pink: 1,280<br />
Chum: 49<br />
Rainbow: 0<br />
Dolly Varden 9<br />
3500<br />
3000<br />
2500<br />
Byers <strong>Lake</strong> Adult Sockeye<br />
2000<br />
1500<br />
2006<br />
1000<br />
500<br />
0<br />
Date<br />
26
Appendix 5 Byers <strong>Lake</strong> 2007 – Macrozooplankton Density<br />
Site A<br />
Density (No/m 2 )<br />
Seasonal Mean<br />
Date 11-Jun 16-Jul 21-Aug 19-Sep 24-Sep (No/m 2 )<br />
Ergasilus<br />
Epischura 1,592 1,592<br />
Diaptomus 4,246 20,064 7,643 10,698 10,663<br />
Ovig. Diaptomus 637 891 764<br />
Cyclops 19,745 135,669 51,592 114,780 80,447<br />
Ovig. Cyclops 212 1,592 955 223 746<br />
Bosmina 29,936 3,822 446 11,401<br />
Ovig. Bosmina 955 1,274 223 817<br />
Daphnia l. 425 41,083 63,376 99,179 51,015<br />
Ovig. Daphnia l 11,783 9,554 18,944 13,427<br />
Daphnia r.<br />
Holopedium 7,643 955 4,299<br />
Ovig. Holopedium<br />
Total: 32,272 0 244,268 138,217 245,383 175,172<br />
Site B<br />
Density (No/m 2 )<br />
Seasonal Mean<br />
Date 11-Jun 16-Jul 21-Aug 19-Sep 24-Sep (No/m 2 )<br />
Ergasilus<br />
Epischura 2,229 255 1,242<br />
Diaptomus 4,061 28,662 20,382 14,570 23,434 18,222<br />
Ovig. Diaptomus 1,274 1,194 764 1,077<br />
Cyclops 120,143 97,452 228,981 83,838 163,016 138,686<br />
Ovig. Cyclops 3,583 5,016 2,866 239 509 2,443<br />
Bosmina 4,538 21,019 47,452 2,627 1,274 15,382<br />
Ovig. Bosmina 478 1,274 1,528 1,093<br />
Daphnia l. 10,987 21,975 75,239 15,537 30,935<br />
Ovig. Daphnia l 717 3,822 5,494 3,057 3,272<br />
Daphnia r.<br />
Holopedium 10,510 4,777 1,592 5,626<br />
Ovig. Holopedium<br />
Total: 142,834 169,108 331,847 183,201 209,373 217,978<br />
27
Appendix 5 (cont’d) Byers <strong>Lake</strong> 2007 – Macrozooplankton Biomass<br />
Body Size (mm) Biomass (mg/m 2 )<br />
Body Size (mm)<br />
Seasonal Seasonal<br />
Weighted Weighted<br />
Date 11-Jun 16-Jul 21-Aug 19-Sep 24-Sep Mean Mean Mean<br />
Ergasilus<br />
Epischura 13<br />
Diaptomus 0.60 1.18 1.19 1.16 1.03 0.56 65<br />
Ovig. Diaptomus 1.16 1.16 1.16 1.16 5<br />
Cyclops 0.92 0.76 0.64 0.66 0.75 0.39 163<br />
Ovig. Cyclops 1.32 1.28 1.31 1.24 1.29 1.29 4<br />
Bosmina 0.40 0.32 1.52 0.57 0.56 0.67 1.40 26<br />
Ovig. Bosmina 0.59 0.66 0.60 0.62 0.63 3<br />
Daphnia l. 0.87 0.79 0.82 0.83 0.64 148<br />
Ovig. Daphnia l 1.19 0.79 0.96 0.98 0.99 68<br />
Daphnia r.<br />
Holopedium 0.72 0.97 0.85 0.75 24<br />
Ovig. Holopedium<br />
Chydorinae<br />
Polyphemus<br />
Site A<br />
Total: 519<br />
Site B<br />
Body Size (mm) Biomass (mg/m 2 )<br />
Body Size (mm)<br />
Seasonal Seasonal<br />
Weighted Weighted<br />
Date 11-Jun 16-Jul 21-Aug 19-Sep 24-Sep Mean Mean Mean<br />
Ergasilus<br />
Epischura 1.32 1.46 1.39 1.33 16<br />
Diaptomus 0.58 1.05 1.17 1.17 1.18 1.03 1.11 106<br />
Ovig. Diaptomus 1.17 1.24 1.15 1.19 1.19 7<br />
Cyclops 0.87 0.92 0.75 0.79 0.80 0.83 0.81 314<br />
Ovig. Cyclops 1.33 1.37 1.24 1.24 1.23 1.28 1.32 15<br />
Bosmina 0.45 0.60 0.36 0.51 0.56 0.50 0.44 31<br />
Ovig. Bosmina 0.55 0.67 0.53 0.58 0.59 3<br />
Daphnia l. 1.03 0.87 0.90 0.75 0.89 0.89 82<br />
Ovig. Daphnia l 1.22 1.21 1.05 1.10 1.15 1.12 18<br />
Daphnia r.<br />
Holopedium 0.76 0.70 0.88 0.78 0.75 38<br />
Ovig. Holopedium 1.06 1.06 0.00<br />
Total: 631<br />
28
Appendix 5 (cont’d) Byers <strong>Lake</strong> 2007 – Water Quality<br />
Date Sta Depth TP TFP FRP TKN NH3+NH4 NO2+NO3 RSi Org C Chla Phaeo EZD<br />
(m) (ug/l) (ug/l) (ug/l) (ug/l) (ug/l) (ug/l) TN:TP (ug/l) (ug/l) (ug/l) (ug/l) Sta (m)<br />
11-Jun B 1 6.8 3.6 3.5 141.4 11.0 326.0 152 :1 4,024 461 1.08 0.40 A 11.5<br />
11-Jun B 14 6.8 4.0 3.9 115.0 11.0 443.0 182 :1 4,230 243 0.71 0.59 B 10.2<br />
16-Jul B 1 5.3 3.0 2.8 112.5 11.0 335.0 187 :1 3,669 259 0.34 0.13 A 11.6<br />
16-Jul B 20 7.7 3.5 3.5 106.1 17.0 407.0 148 :1 4,297 292 0.40 0.35 B 11.6<br />
21-Aug B 1 5.1 2.7 3.7 145.3 8.9 256.0 174 :1 4,275 382 0.55 0.23 A 15.9<br />
21-Aug B 10 8.1 2.6 3.6 170.5 25.7 357.0 144 :1 4,784 500 0.45 0.34 B 13.4<br />
19-Sep B 1 11.2 5.0 4.7 96.4 20.1 258.0 70 :1 4,886 394 0.62 0.33 A 8.5<br />
19-Sep B 12 6.5 5.2 5.1 82.4 31.6 400.0 164 :1 5,357 270 0.37 0.47 B 8.8<br />
Mean 1 - Meter 7.1 3.6 3.7 123.9 12.8 293.8 130 :1 4,214 374 0.65 0.27 A 11.9<br />
Min 5.1 2.7 2.8 96.4 8.9 256.0 153 :1 3,669 259 0.34 0.13 8.5<br />
Max 11.2 5.0 4.7 145.3 20.1 335.0 95 :1 4,886 461 1.08 0.40 15.9<br />
Mean Hypolimnion 7.3 3.8 4.0 118.5 21.3 401.8 158 :1 4,667 326 0.48 0.44 B 11.0<br />
Min 6.5 2.6 3.5 82.4 11.0 357.0 150 :1 4,230 243 0.37 0.34 8.8<br />
Max 8.1 5.2 5.1 170.5 31.6 443.0 168 :1 5,357 500 0.71 0.59 13.4<br />
Date Sta Depth Sp. Cond pH Alk Turb Color Ca Mg Fe Secchi<br />
(m) (umhos/cm) (SU) (mg/l) (NTU) (Pt) (mg/l) (mg/l) (ug/l) Sta (meters)<br />
11-Jun B 1 40 6.0 14.4 1.1 10 5.5 0.3 26 A 4.5<br />
11-Jun B 14 39 6.0 15.0 1.0 11 5.3 0.8 72 B 4.5<br />
16-Jul B 1 41 6.2 16.6 0.4 8 5.5 0.7 22 A 8.0<br />
16-Jul B 20 39 6.2 15.0 0.9 11 5.2 0.6 72 B 8.0<br />
21-Aug B 1 42 6.1 16.7 1.0 8 5.4 0.8 32 A 7.0<br />
21-Aug B 10 39 6.2 15.2 0.6 10 5.2 0.7 27 B 7.0<br />
19-Sep B 1 41 6.4 16.6 0.3 11 5.0 0.8 38 A 7.0<br />
19-Sep B 12 39 6.3 15.1 0.0 12 4.7 0.8 20 B 7.0<br />
Mean 1 - Meter 41 6.2 16.1 0.7 9 5.4 0.7 30 A 6.6<br />
Min 40 6.0 14.4 0.3 8 5.0 0.3 22 4.5<br />
Max 42 6.4 16.7 1.1 11 5.5 0.8 38 8.0<br />
Mean Hypolimnion 39 6.2 15.1 0.6 11.0 5.1 0.7 48 B 6.6<br />
Min 39 6.0 15.0 0.0 10.0 4.7 0.6 20 4.5<br />
Max 39 6.3 15.2 1.0 12.0 5.3 0.8 72 8.0<br />
29
Appendix 6 Byers <strong>Lake</strong> 2007- Environmental Conditions<br />
Smolt Migration<br />
Adult Migration<br />
Water Air Water Air<br />
Precip. Stage Temp. Temp. Precip. Stage Temp. Temp.<br />
Date Sky (mm) (ft) Flow ( o C) ( o C) Date Sky (mm) (ft) Flow ( o C) ( o C)<br />
25-May 2 0.0 1.61 ND 9 21 16-Jul 2 0.0 1.90 ND 22 24<br />
26-May 4 0.0 1.63 ND 9 18 17-Jul 2 0.0 1.15 ND 22 27<br />
27-May 5 5.5 1.69 ND 8 9.5 18-Jul 4 0.0 1.26 ND 22 19<br />
28-May 5 1.3 1.70 ND 7 15 19-Jul 4 0.0 1.28 ND 23 21<br />
29-May 4 7.5 1.70 ND 7 18 20-Jul 5 0.1 1.25 ND 21 15<br />
30-May 5 1.5 1.70 ND 7 17 21-Jul 5 1.0 1.23 ND 19 13<br />
31-May 4 2.5 1.70 ND 8 17 22-Jul 4 0.0 1.20 ND 20 20<br />
1-Jun 5 7.5 1.70 ND 8 19 23-Jul 3 0.0 1.19 ND 20 26<br />
2-Jun 5 1.2 1.70 ND 8 17 24-Jul 3 0.0 1.19 ND 21 25<br />
3-Jun 2 0.0 1.70 ND 10 20 25-Jul 2 0.0 1.15 ND 22 28<br />
4-Jun 5 3.3 1.71 ND 11 17 26-Jul 3 0.0 1.15 ND 22 30<br />
5-Jun 2 1.0 1.71 ND 9 21 27-Jul 4 0.0 1.15 ND 22 25<br />
6-Jun 5 2.8 1.70 ND 9 18 28-Jul 5 0.9 1.17 ND 21 15<br />
7-Jun 5 0.1 1.69 ND 9 15 29-Jul 5 20.6 1.20 ND 20 13<br />
8-Jun 2 1.1 1.69 ND 10 18 30-Jul 5 40.8 1.22 ND 19 10<br />
9-Jun 1 1.3 1.68 ND 12 24 31-Jul 5 8.2 1.22 ND 20 11<br />
10-Jun 2 0.0 1.66 ND 14 26 1-Aug 4 0.1 1.20 ND 20 20<br />
11-Jun 4 2.0 1.63 ND 12 20 2-Aug 5 0.9 1.20 ND 20 12<br />
12-Jun 5 0.5 1.66 ND 10 18 3-Aug 5 1.1 1.21 ND 19 14<br />
13-Jun 3 0.0 1.66 ND 10 23 4-Aug 5 0.6 1.21 ND 19 11<br />
14-Jun 2 0.0 1.62 ND 11 25 5-Aug 5 0.8 1.21 ND 20 10<br />
15-Jun 2 0.0 1.63 ND 16 27 6-Aug 5 30.7 1.40 ND 19 9<br />
16-Jun 2 0.0 1.60 ND 16 26 7-Aug 5 12.8 1.39 ND 19 9<br />
17-Jun 3 0.0 1.59 ND 15 27 8-Aug 4 0.4 1.25 ND 20 17<br />
18-Jun 3 0.0 1.60 ND 16 28 9-Aug 2 0.0 1.24 ND 20 23<br />
19-Jun 2 0.0 1.60 ND 17 29 10-Aug 1 0.0 1.24 ND 20 26<br />
20-Jun 2 0.0 1.55 ND 17 30 11-Aug 1 0.0 1.21 ND 20 27<br />
21-Jun 4 2.3 1.59 ND 18 23 12-Aug 5 0.3 1.23 ND 19 19<br />
22-Jun 5 6.8 1.60 ND 18 19 13-Aug 5 0.9 1.23 ND 19 20<br />
23-Jun 4 1.5 1.60 ND 17 23 14-Aug 5 0.6 1.23 ND 19 18<br />
24-Jun 5 10.0 1.60 ND 17 28 15-Aug 5 30.6 1.30 ND 19 19<br />
25-Jun 4 2.6 1.60 ND 18 25 16-Aug 2 0.3 1.30 ND 19 21<br />
Total 62 17-Aug 2 0.0 1.34 ND 19 23<br />
Avg. 1.9 1.65 ND 12 21 18-Aug 4 0.0 1.35 ND 19 16<br />
Min. 0.0 1.55 ND 7 10 19-Aug 4 0.0 1.35 ND 19 13<br />
Max. 10.0 1.71 ND 18 30 20-Aug 5 0.5 1.37 ND 18 12<br />
21-Aug 5 0.6 1.39 ND 18 14<br />
Ice out = ND<br />
22-Aug 5 0.1 1.40 ND ND 13<br />
23-Aug 3 0.3 1.27 ND ND 14<br />
Summary of Cloud Cover - Percent of Days<br />
24-Aug 5 0.0 1.29 ND ND 16<br />
No. Meas. Partly<br />
25-Aug 3 0.6 1.22 ND ND ND<br />
Days Rain Overcast Cloudy Clear 26-Aug 3 0.0 1.21 ND ND ND<br />
Smolts 32 63% 56% 41% 3% 27-Aug 2 0.2 1.20 ND ND ND<br />
Adults 46 54% 61% 35% 4% 28-Aug 2 0.0 1.20 ND ND ND<br />
29-Aug 2 0.0 1.20 ND ND ND<br />
1.0 = Clear 30-Aug 3 0.0 1.20 ND ND ND<br />
2.0 = Cloud Cover 50% Avg. 3.3 1.26 ND 20 18<br />
4.0 = Overcast Min. 0.0 1.15 ND 18 9<br />
5.0 = Rain Max. 23.4 1.90 ND 23 30<br />
ND = No Data<br />
30
Appendix 7 Byers <strong>Lake</strong> 2007 - Smolt Migration<br />
Sockeye Coho<br />
King<br />
Pink Chum Rainbow Dolly Varden<br />
Date Daily Mort. Total Daily Mort. Total Daily Total Daily Total Daily Total Daily Total Daily Total<br />
25-May 632 0 632 81 0 81 0 0 0 0 0 0 0 0 0 0<br />
26-May 721 0 1,353 65 0 65 0 0 0 0 0 0 0 0 0 0<br />
27-May 123 0 1,476 37 0 37 0 0 0 0 0 0 0 0 0 0<br />
28-May 0 0 1,476 0 0 0 0 0 0 0 0 0 0 0 0 0<br />
29-May 0 0 1,476 0 0 0 0 0 0 0 0 0 0 0 0 0<br />
30-May 0 0 1,476 0 0 0 0 0 0 0 0 0 0 0 0 0<br />
31-May 396 0 1,872 55 0 55 0 0 0 0 0 0 0 0 0 0<br />
1-Jun 0 0 1,872 0 0 0 0 0 0 0 0 0 0 0 0 0<br />
2-Jun 0 0 1,872 0 0 0 0 0 0 0 0 0 0 0 0 0<br />
3-Jun 133 0 2,005 9 0 9 0 0 0 0 0 0 0 0 0 0<br />
4-Jun 1,508 0 3,513 97 0 97 0 0 0 0 0 0 0 0 0 0<br />
5-Jun 1,129 0 4,642 416 0 416 0 0 0 0 0 0 0 0 0 0<br />
6-Jun 38 0 4,680 6 0 6 0 0 0 0 0 0 0 0 0 0<br />
7-Jun 0 0 4,680 2 0 2 0 0 0 0 0 0 0 0 0 0<br />
8-Jun 4 0 4,684 1 0 1 0 0 0 0 0 0 0 0 0 0<br />
9-Jun 2,444 0 7,128 15 0 15 0 0 0 0 0 0 0 0 0 0<br />
10-Jun 1,280 0 8,408 10 0 10 0 0 0 0 0 0 0 0 0 0<br />
11-Jun 1,429 0 9,837 5 0 5 0 0 0 0 0 0 0 0 0 0<br />
12-Jun 1,551 0 11,388 73 0 73 0 0 0 0 0 0 0 0 0 0<br />
13-Jun 1,731 0 13,119 44 0 44 0 0 0 0 0 0 0 0 0 0<br />
14-Jun 1,359 0 14,478 23 0 23 0 0 0 0 0 0 0 0 0 0<br />
15-Jun 114 0 14,592 4 0 4 0 0 0 0 0 0 0 0 0 0<br />
16-Jun 68 0 14,660 13 0 13 0 0 0 0 0 0 0 0 0 0<br />
17-Jun 414 0 15,074 0 0 0 0 0 0 0 0 0 0 0 0 0<br />
18-Jun 147 0 15,221 22 0 22 0 0 0 0 0 0 0 0 0 0<br />
19-Jun 274 0 15,495 3 0 3 0 0 0 0 0 0 0 0 0 0<br />
20-Jun 0 0 15,495 0 0 0 0 0 0 0 0 0 0 0 0 0<br />
21-Jun 31 0 15,526 1 0 1 0 0 0 0 0 0 0 0 0 0<br />
22-Jun 0 0 15,526 0 0 0 0 0 0 0 0 0 0 0 0 0<br />
23-Jun 0 0 15,526 0 0 0 0 0 0 0 0 0 0 0 0 0<br />
24-Jun 4 0 15,530 0 0 0 0 0 0 0 0 0 0 0 0 0<br />
25-Jun 0 0 15,530 0 0 0 0 0 0 0 0 0 0 0 0 0<br />
Total 15,530 982 0 0 0 0 0<br />
31
Appendix 8 Byers <strong>Lake</strong> 2007 – Adult Escapement<br />
Sockeye<br />
Coho King Pink Chum Rainbow D.V.<br />
Daily Total Daily Daily Daily Daily Daily Daily<br />
Date Escapement Return Escapement Escapement Escapement Escapement Escapement Escapement<br />
16-Jul 0 0 0 2 0 0 0 0<br />
17-Jul 0 0 0 0 0 0 0 0<br />
18-Jul 0 0 0 0 0 0 0 0<br />
19-Jul 0 0 0 0 0 0 0 0<br />
20-Jul 0 0 0 0 0 0 0 0<br />
21-Jul 0 0 0 0 0 0 0 0<br />
22-Jul 0 0 0 0 0 0 0 0<br />
23-Jul 0 0 0 0 0 0 0 0<br />
24-Jul 0 0 0 0 0 0 0 0<br />
25-Jul 0 0 0 0 0 0 0 0<br />
26-Jul 0 0 0 0 0 0 0 0<br />
27-Jul 0 0 0 0 0 0 0 0<br />
28-Jul 0 0 0 0 0 0 0 0<br />
29-Jul 0 0 0 0 0 0 0 0<br />
30-Jul 0 0 0 0 0 0 0 0<br />
31-Jul 0 0 0 0 0 0 0 0<br />
1-Aug 0 0 0 0 0 0 0 0<br />
2-Aug 0 0 0 0 0 0 0 0<br />
3-Aug 0 0 0 0 0 0 0 0<br />
4-Aug 0 0 0 0 0 0 0 0<br />
5-Aug 0 0 0 0 0 0 0 0<br />
6-Aug 0 0 0 0 0 0 0 0<br />
7-Aug 0 0 0 0 0 0 0 0<br />
8-Aug 0 0 0 0 0 0 0 0<br />
9-Aug 1 1 0 0 0 0 0 0<br />
10-Aug 155 156 0 0 0 0 0 0<br />
11-Aug 39 195 0 0 0 0 0 0<br />
12-Aug 1 196 0 0 0 0 0 0<br />
13-Aug 177 373 0 0 0 0 0 0<br />
14-Aug 53 426 0 0 0 0 0 0<br />
15-Aug 38 464 1 0 0 0 0 0<br />
16-Aug 62 526 0 0 0 0 0 0<br />
17-Aug 57 583 0 2 0 0 0 0<br />
18-Aug 42 625 0 0 0 0 0 0<br />
19-Aug 75 700 0 5 0 0 0 0<br />
20-Aug 14 714 0 1 0 0 2 0<br />
21-Aug 20 734 0 0 0 0 0 0<br />
22-Aug 32 766 0 0 0 0 0 0<br />
23-Aug 201 967 0 0 0 0 6 0<br />
24-Aug 274 1,241 0 0 0 0 4 0<br />
25-Aug 50 1,291 1 0 0 0 0 0<br />
26-Aug 45 1,336 1 0 0 0 0 0<br />
27-Aug 309 1,645 8 2 0 0 0 0<br />
28-Aug 0 1,645 0 0 0 0 0 0<br />
29-Aug 26 1,671 1 0 0 0 0 0<br />
30-Aug 30 1,701 5 0 0 0 0 0<br />
Total 1,701 17 12 0 0 12 0<br />
32
Appendix 9 Byers <strong>Lake</strong> 2007 – Adult Sockeye Age Class<br />
Age Group<br />
0.3 1.2 1.3 2.2 2.3 Total<br />
Males 13 80 825 13 13 944<br />
Percent 0.76% 4.70% 48.50% 0.76% 0.76% 55.48%<br />
Sample Size 1 6 62 1 1 71<br />
Mean Lth (mm) 550 495 592 510 610 582<br />
Std. Error 19 4 2<br />
Females 27 40 623 27 40 757<br />
Percent 1.59% 2.35% 36.63% 1.59% 2.35% 44.51%<br />
Sample Size 2 3 47 2 3 57<br />
Mean Lth (mm) 570 507 557 480 530 550<br />
Std. Error 10 13 4 20 29 3<br />
Both Sexes 40 120 1,448 40 53 1,701<br />
Percent 2.35% 7.05% 85.13% 2.35% 3.12% 100.00%<br />
Sample Size 3 9 109 3 4 128<br />
Mean Lth (mm) 564 499 577 490 550 568<br />
Std. Error 10 13 3 20 29 3<br />
33
25-May<br />
29-May<br />
2-Jun<br />
6-Jun<br />
10-Jun<br />
14-Jun<br />
18-Jun<br />
22-Jun<br />
13-Jul<br />
18-Jul<br />
23-Jul<br />
28-Jul<br />
2-Aug<br />
7-Aug<br />
12-Aug<br />
17-Aug<br />
22-Aug<br />
27-Aug<br />
Smolt<br />
Adults<br />
Appendix 10 Byers <strong>Lake</strong> 2007 – Update<br />
Misc. Activities<br />
Adult Migration<br />
Ice-out: ND<br />
(approximate date)<br />
Dates: 16-Jul to 30-Aug<br />
Smolt Crew On-site: 25-May<br />
No. %<br />
Smolt Crew Off-site: 25-Jun<br />
Sockeyes: 1,701 100%<br />
Adult Crew On-site: 13-Jul<br />
Mortalities: 0 0.0%<br />
Adult Crew Off-site: 26-Aug<br />
Age 1.2: 120 7.1%<br />
Age 1.3: 1,448 85.1%<br />
Smolt Migration Age 2.2: 40 2.4%<br />
Dates: 25-May to 25-Jun Age 2.3: 53 3.1%<br />
No. % Coho: 17<br />
Sockeyes: 15,530 100% King: 12<br />
Mortalities: 0 0% Pink: 0<br />
Age 1: 15,401 99% Chum: 0<br />
Age 2: 78 1% Rainbow: 12<br />
Coho: 982 Dolly Varden 0<br />
18,000<br />
16,000<br />
14,000<br />
Byers <strong>Lake</strong> Sockeye Smolt<br />
3,000<br />
2,500<br />
Byers <strong>Lake</strong> Sockeye Adults<br />
12,000<br />
10,000<br />
8,000<br />
6,000<br />
4,000<br />
2007<br />
2,000<br />
1,500<br />
1,000<br />
Avg<br />
2007<br />
2,000<br />
500<br />
0<br />
0<br />
34
Appendix 11 Byers <strong>Lake</strong> 2008 – Macrozooplankton Density<br />
Site A<br />
Density (No/m 2 )<br />
Seasonal Mean<br />
Date 29-May 19-Jun 15-Jul 14-Aug 17-Sep (No/m 2 )<br />
Ergasilus<br />
Epischura 637 127<br />
Diaptomus 26,752 48,408 22,081 35,244 26,497<br />
Ovig. Diaptomus 212 849 212<br />
Cyclops 68,153 230,732 129,618 52,229 176,221 131,391<br />
Ovig. Cyclops 318 3,822 5,096 2,123 425 2,357<br />
Bosmina 1,115 3,822 24,522 7,006 9,342 9,161<br />
Ovig. Bosmina 159 318 425 180<br />
Daphnia l. 159 478 2,548 9,342 177,919 38,089<br />
Ovig. Daphnia l 637 1,699 50,106 10,488<br />
Daphnia r.<br />
Holopedium 637 20,064 6,688 212 5,520<br />
Ovig. Holopedium 2,389 1,274 733<br />
Total: 70,541 288,059 219,109 95,541 450,531 224,756<br />
Site B<br />
Density (No/m 2 )<br />
Seasonal Mean<br />
Date 29-May 19-Jun 15-Jul 14-Aug 17-Sep (No/m 2 )<br />
Ergasilus<br />
Epischura 637 425 32 219<br />
Diaptomus 22,293 62,102 47,983 1,592 26,794<br />
Ovig. Diaptomus 1,274 159 287<br />
Cyclops 21,338 177,070 171,975 152,442 13,025 107,170<br />
Ovig. Cyclops 159 6,369 3,185 3,822 2,707<br />
Bosmina 318 3,185 17,197 8,917 255 5,974<br />
Ovig. Bosmina 318 32 70<br />
Daphnia l. 637 1,911 25,902 8,535 7,397<br />
Ovig. Daphnia l 637 1,699 1,369 741<br />
Daphnia r.<br />
Holopedium 159 11,783 10,828 849 4,724<br />
Ovig. Holopedium 318 955 255<br />
Total: 21,974 221,973 269,427 243,313 24,999 156,337<br />
35
Appendix 11 (cont’d) Byers <strong>Lake</strong> 2008 – Macrozooplankton Biomass<br />
Body Size (mm)<br />
Body Size (mm)<br />
Seasonal<br />
Seasonal<br />
Weighted<br />
Weighted<br />
Date 29-May 19-Jun 15-Jul 14-Aug 17-Sep Mean Mean Mean Mean<br />
Ergasilus<br />
Epischura 1.48 1.48 1.48 1 1<br />
Diaptomus 0.63 1.03 1.15 1.15 0.99 1.00 64 66<br />
Ovig. Diaptomus 1.29 1.22 1.26 1.23 1 1<br />
Cyclops 0.87 0.90 0.86 0.81 0.79 0.85 0.85 189 194<br />
Ovig. Cyclops 1.14 1.20 1.18 1.31 1.22 1.21 1.21 11 11<br />
Bosmina 0.46 0.39 0.49 0.43 0.54 0.46 0.48 2 2<br />
Ovig. Bosmina 0.48 0.82 0.60 0.63 0.66 0 0<br />
Daphnia l. 0.60 0.63 0.80 0.80 0.83 0.73 0.83 34 51<br />
Ovig. Daphnia l 1.07 1.11 1.12 1.10 1.12 36 38<br />
Daphnia r.<br />
Holopedium 0.34 0.98 0.81 0.84 0.74 0.92 5 11<br />
Ovig. Holopedium 1.28 1.01 1.15 1.19 3 3<br />
Chydorinae<br />
Polyphemus<br />
Site A<br />
Total: 346 378<br />
Site B<br />
Biomass (mg/m 2 )<br />
Body Size (mm)<br />
Body Size (mm)<br />
Seasonal<br />
Biomass (mg/m 2 )<br />
Seasonal<br />
Weighted<br />
Weighted<br />
Date 26-May 20-Jun 20-Aug 27-Sep Mean Mean Mean Mean<br />
Ergasilus<br />
Epischura 1.26 1.67 1.74 1.56 1.43 2 2<br />
Diaptomus 0.68 1.03 1.19 1.17 1.02 1.03 71 74<br />
Ovig. Diaptomus 1.25 1.20 1.23 1.24 1 1<br />
Cyclops 0.98 0.81 0.86 0.80 0.73 0.84 0.83 148 143<br />
Ovig. Cyclops 1.24 1.21 1.17 1.31 1.23 1.23 14 13<br />
Bosmina 0.40 0.39 0.49 0.43 0.56 0.45 0.46 1 1<br />
Ovig. Bosmina 0.55 0.62 0.59 0.56 0 0<br />
Daphnia l. 0.97 0.89 0.84 0.87 0.89 0.85 13 11<br />
Ovig. Daphnia l 1.41 0.94 1.05 1.13 1.06 3 2<br />
Daphnia r.<br />
Holopedium 0.38 0.99 0.69 0.71 0.69 0.84 3 7<br />
Ovig. Holopedium 1.24 1.00 1.12 1.06 1 1<br />
Total: 257 256<br />
36
Appendix 11 (cont’d) Byers <strong>Lake</strong> - Water Quality<br />
Date Sta Depth TP TFP FRP TKN NH3+NH4 NO2+NO3 RSi Org C Chla Phaeo EZD<br />
(m) (ug/l) (ug/l) (ug/l) (ug/l) (ug/l) (ug/l) TN:TP (ug/l) (ug/l) (ug/l) (ug/l) Sta (m)<br />
29-May B 1 6.1 3.4 2.5 129.5 10.1 490.5 225 :1 4,178 134 0.43 0.21 A 9.1<br />
29-May B 10 6.7 3.2 2.5 197.0 10.5 478.6 223 :1 4,036 98 0.37 0.17 B 8.2<br />
19-Jun B 1 14.6 7.5 2.1 116.1 6.9 425.7 82 :1 3,679 183 0.44 0.24 A -<br />
19-Jun B 10 7.5 4.0 2.5 96.0 9.5 499.0 176 :1 3,959 134 0.83 0.52 B 10.2<br />
15-Jul B 1 14.6 7.5 2.1 116.1 6.9 425.7 82 :1 3,577 139 0.37 0.24 A -<br />
15-Jul B 9 9.0 6.3 2.2 116.1 7.0 434.4 135 :1 3,745 160 0.73 0.59 B 11.2<br />
14-Aug B 1 11.9 11.3 1.6 124.9 5.4 258.3 71 :1 3,550 115 0.46 0.19 A 12.8<br />
14-Aug B 10 5.5 5.5 1.9 123.6 4.3 310.0 175 :1 3,705 106 0.64 0.37 B 12.1<br />
17-Sep B 1 9.9 8.1 1.9 106.0 4.4 229.2 75 :1 3,814 144 0.80 0.42 A -<br />
17-Sep B 10 6.0 3.5 2.1 113.6 2.2 370.7 179 :1 4,047 118 0.49 0.38 B 11.1<br />
Mean 1 - Meter 11.4 7.6 2.0 118.5 6.7 365.9 94 :1 3,760 143 0.50 0.26 A 11.0<br />
Min 6.1 3.4 1.6 106.0 4.4 229.2 122 :1 3,550 115 0.37 0.19 9.1<br />
Max 14.6 11.3 2.5 129.5 10.1 490.5 94 :1 4,178 183 0.80 0.42 12.8<br />
Mean Hypolimnion 6.9 4.5 2.2 129.3 6.7 418.5 175 :1 3,898 123 0.61 0.41 B 10.6<br />
Min 5.5 3.2 1.9 96.0 2.2 310.0 163 :1 3,705 98 0.37 0.17 8.2<br />
Max 9.0 6.3 2.5 197.0 10.5 499.0 171 :1 4,047 160 0.83 0.59 12.1<br />
Date Sta Depth Sp. Cond pH Alk Turb Color Ca Mg Fe Secchi<br />
(m) (umhos/cm) (SU) (mg/l) (NTU) (Pt) (mg/l) (mg/l) (ug/l) Sta (meters)<br />
29-May B 1 37 6.5 14.8 0.5 13 4.9 0.4 38 A 5.0<br />
29-May B 10 38 6.5 15.2 0.8 13 4.9 0.7 56 B 6.0<br />
19-Jun B 1 35 6.8 14.3 0.5 11 4.7 0.6 39 A 5.0<br />
19-Jun B 10 38 6.7 14.5 0.8 12 4.9 0.6 46 B 6.0<br />
15-Jul B 1 38 6.8 16.5 0.8 10 4.7 0.8 40 A 6.0<br />
15-Jul B 9 38 6.8 15.6 0.4 11 5.0 0.6 33 B 6.0<br />
14-Aug B 1 39 6.8 15.5 0.2 10 4.8 1.0 58 A 6.0<br />
14-Aug B 10 39 6.8 15.5 0.2 10 5.2 0.9 58 B 6.0<br />
17-Sep B 1 40 6.8 16.8 0.2 10 5.0 0.9 56 A 5.0<br />
17-Sep B 10 39 6.7 16.2 0.3 11 4.9 0.9 49 B 4.0<br />
Mean 1 - Meter 38 6.7 15.6 0.4 11 4.8 0.7 46 A 5.4<br />
Min 35 6.5 14.3 0.2 10 4.7 0.4 38 5.0<br />
Max 40 6.8 16.8 0.8 13 5.0 1.0 58 6.0<br />
Mean Hypolimnion 38 6.7 15.4 0.5 11 5.0 0.7 48 B 5.6<br />
Min 38 6.5 14.5 0.2 10 4.9 0.6 33 4.0<br />
Max 39 6.8 16.2 0.8 13 5.2 0.9 58 6.0<br />
37
Appendix 12 Byers <strong>Lake</strong> 2008 – Environmental Conditions<br />
Smolt Migration<br />
Adult Migration<br />
Water Air Water Air<br />
Precip. Stage Temp. Temp. Precip. Stage Temp. Temp.<br />
Date Sky (mm) (ft) Flow ( o C) ( o C) Date Sky (mm) (ft) Flow ( o C) ( o C)<br />
30-May 3 0.0 1.50 ND 4 14 16-Jul 4 2.5 0.89 ND 15 16<br />
31-May 3 0.5 1.54 ND 5 15 17-Jul 5 15.5 0.93 ND 15 12<br />
1-Jun 2 0.0 1.59 ND 5 15 18-Jul 4 11.7 1.04 ND 15 12<br />
2-Jun 4 0.0 1.58 ND 6 16 19-Jul 3 0.3 1.03 ND 20 17<br />
3-Jun 5 0.5 1.63 ND 6 10 20-Jul 5 2.0 0.96 ND 15 12<br />
4-Jun 4 3.8 1.60 ND 7 12 21-Jul 5 13.0 1.00 ND 15 10<br />
5-Jun 3 3.3 1.58 ND 7 13 22-Jul 4 16.5 1.08 ND 15 12<br />
6-Jun 3 0.5 1.50 ND 8 16 23-Jul 5 17.8 1.16 ND 15 11<br />
7-Jun 3 0.0 1.49 ND 9 17 24-Jul 3 3.6 1.19 ND 15 17<br />
8-Jun 4 0.0 1.46 ND 7 13 25-Jul 3 0.3 1.10 ND 17 21<br />
9-Jun 3 0.0 1.47 ND 8 16 26-Jul 5 4.8 1.06 ND 15 11<br />
10-Jun 3 0.0 1.46 ND 8 15 27-Jul 4 5.1 1.06 ND 14 14<br />
11-Jun 3 0.0 1.40 ND 8 14 28-Jul 4 0.8 1.04 ND 15 17<br />
12-Jun 2 0.0 1.40 ND 8 17 29-Jul 3 0.0 1.00 ND 17 20<br />
13-Jun 3 0.3 1.37 ND 11 21 30-Jul 4 0.3 1.00 ND 14 14<br />
14-Jun 3 1.0 1.34 ND 10 16 31-Jul 4 0.0 0.98 ND 14 13<br />
15-Jun 2 0.3 1.34 ND 10 15 1-Aug 4 0.4 1.00 ND 14 15<br />
16-Jun 3 0.0 1.34 ND 12 18 2-Aug 4 1.0 0.99 ND 12 13<br />
17-Jun 2 3.8 1.33 ND 12 20 3-Aug 3 4.3 1.03 ND 15 15<br />
18-Jun 2 0.0 1.34 ND 12 17 4-Aug 4 3.3 1.04 ND 14 11<br />
19-Jun 3 1.3 1.32 ND 11 17 5-Aug 5 15.2 1.10 ND 13 11<br />
20-Jun 3 0.0 1.28 ND 13 19 6-Aug 3 4.8 1.16 ND 15 18<br />
21-Jun 1 1.0 1.30 ND 13 18 7-Aug 2 0.8 1.13 ND 14 15<br />
22-Jun 5 9.1 1.29 ND 12 15 8-Aug 4 0.3 1.07 ND 15 14<br />
23-Jun 5 1.3 1.28 ND 12 14 9-Aug 4 6.6 1.10 ND 15 12<br />
24-Jun 2 12.7 1.29 ND 13 15 10-Aug 5 3.6 1.14 ND 14 13<br />
Total 39 11-Aug 2 2.5 1.13 ND 15 14<br />
Avg. 1.5 1.42 ND 9 16 12-Aug 3 0.1 1.11 ND 16 19<br />
Min. 0.0 1.28 ND 4 10 13-Aug 3 0.0 1.12 ND 15 19<br />
Max. 12.7 1.63 ND 13 21 14-Aug 3 2.0 1.12 ND 15 15<br />
15-Aug 3 2.5 1.10 ND 15 17<br />
Ice out = ND<br />
16-Aug 2 3.3 1.05 ND 15 15<br />
17-Aug 2 4.3 1.07 ND 14 14<br />
Summary of Cloud Cover - Percent of Days<br />
18-Aug 3 0.1 1.06 ND 16 17<br />
No. Meas. Partly<br />
19-Aug 2 0.0 1.03 ND 16 19<br />
Days Rain Overcast Cloudy Clear 20-Aug 2 0.0 1.01 ND 17 18<br />
Smolts 26 54% 23% 23% 4% 21-Aug 4 10.2 1.05 ND 16 14<br />
Adults 42 86% 52% 19% 0% 22-Aug 2 0.0 1.04 ND 16 17<br />
23-Aug 3 0.3 1.02 ND 16 15<br />
1.0 = Clear 24-Aug 2 20.3 1.03 ND 20 15<br />
2.0 = Cloud Cover 50% 26-Aug 4 6.4 1.00 ND 15 15<br />
4.0 = Overcast Total 188<br />
5.0 = Rain Avg. 4.5 1.05 ND 15 15<br />
Min. 0.0 0.89 ND 12 10<br />
ND = No Data<br />
Max. 20.3 1.19 ND 20 21<br />
38
Appendix 13 Byers <strong>Lake</strong> 2008 – Smolt Migration<br />
Sockeye Coho King<br />
Pink Chum Rainbow Dolly Varden<br />
Date Daily Mort. Total Daily Mort. Total Daily Total Daily Total Daily Total Daily Total Daily Total<br />
30-May 1,048 0 1,048 80 0 80 0 0 0 0 0 0 0 0 0 0<br />
31-May 868 0 1,916 83 0 163 0 0 0 0 0 0 0 0 0 0<br />
1-Jun 252 0 2,168 32 0 195 0 0 0 0 0 0 0 0 0 0<br />
2-Jun 212 0 2,380 193 0 388 0 0 0 0 0 0 0 0 0 0<br />
3-Jun 58 0 2,438 67 0 455 0 0 0 0 0 0 0 0 0 0<br />
4-Jun 33 0 2,471 61 0 516 0 0 0 0 0 0 0 0 0 0<br />
5-Jun 184 0 2,655 136 0 652 0 0 0 0 0 0 0 0 0 0<br />
6-Jun 214 0 2,869 44 0 696 0 0 0 0 0 0 0 0 0 0<br />
7-Jun 50 0 2,919 60 0 756 1 1 0 0 0 0 0 0 0 0<br />
8-Jun 26 0 2,945 123 0 879 0 1 0 0 0 0 0 0 0 0<br />
9-Jun 45 0 2,990 1,407 0 2,286 0 1 0 0 0 0 0 0 0 0<br />
10-Jun 70 0 3,060 671 0 2,957 0 1 0 0 0 0 0 0 0 0<br />
11-Jun 39 0 3,099 179 0 3,136 0 1 0 0 0 0 0 0 0 0<br />
12-Jun 31 0 3,130 185 0 3,321 0 1 0 0 0 0 0 0 0 0<br />
13-Jun 37 0 3,167 662 0 3,983 0 1 0 0 0 0 0 0 0 0<br />
14-Jun 165 0 3,332 1,770 0 5,753 0 1 0 0 0 0 0 0 0 0<br />
15-Jun 150 0 3,482 3,447 0 9,200 0 1 0 0 0 0 0 0 0 0<br />
16-Jun 160 0 3,642 2,694 0 11,894 0 1 0 0 0 0 0 0 0 0<br />
17-Jun 123 0 3,765 1,947 0 13,841 0 1 0 0 0 0 0 0 0 0<br />
18-Jun 120 0 3,885 1,324 0 15,165 0 1 0 0 0 0 0 0 0 0<br />
19-Jun 43 0 3,928 363 0 15,528 0 1 0 0 0 0 0 0 0 0<br />
20-Jun 26 0 3,954 234 0 15,762 0 1 0 0 0 0 0 0 0 0<br />
21-Jun 220 0 4,174 986 0 16,748 0 1 0 0 0 0 0 0 0 0<br />
22-Jun 1,577 0 5,751 5,972 0 22,720 0 1 0 0 0 0 0 0 0 0<br />
23-Jun 436 0 6,187 919 0 23,639 0 1 0 0 0 0 0 0 0 0<br />
24-Jun 283 0 6,470 648 0 24,287 0 1 0 0 0 0 0 0 0 0<br />
Total 6,470 0 6,470 24,287 0 24,287 1 0 0 0 0<br />
39
Appendix 14 Byers <strong>Lake</strong> 2008 – Adult Escapement<br />
Sockeye<br />
Coho King Pink Chum Rainbow D.V.<br />
Daily Total Daily Daily Daily Daily Daily Daily<br />
Date Escapement Return Escapement Escapement Escapement Escapement Escapement Escapement<br />
16-Jul 0 0 0 2 0 0 0 0<br />
17-Jul 0 0 0 1 0 0 0 0<br />
18-Jul 0 0 0 0 0 0 0 0<br />
19-Jul 0 0 0 0 0 0 0 0<br />
20-Jul 0 0 0 3 0 0 0 0<br />
21-Jul 0 0 0 0 0 0 0 0<br />
22-Jul 0 0 0 0 0 0 0 0<br />
23-Jul 0 0 0 2 0 0 0 0<br />
24-Jul 0 0 0 0 0 0 0 0<br />
25-Jul 0 0 0 0 0 0 0 0<br />
26-Jul 0 0 0 0 0 0 0 0<br />
27-Jul 0 0 0 1 0 0 0 0<br />
28-Jul 0 0 0 0 0 0 0 0<br />
29-Jul 2 2 0 0 0 0 0 0<br />
30-Jul 0 2 0 0 0 0 0 0<br />
31-Jul 6 8 0 0 0 0 0 0<br />
1-Aug 0 8 0 0 0 0 0 0<br />
2-Aug 129 137 0 0 0 0 0 0<br />
3-Aug 47 184 0 0 0 0 0 0<br />
4-Aug 259 443 0 0 17 0 0 0<br />
5-Aug 50 493 0 0 5 0 0 0<br />
6-Aug 43 536 0 0 29 0 0 0<br />
7-Aug 222 758 0 0 96 0 1 0<br />
8-Aug 29 787 0 2 312 0 0 0<br />
9-Aug 33 820 0 1 223 0 0 0<br />
10-Aug 189 1,009 0 0 652 0 0 0<br />
11-Aug 54 1,063 0 0 579 0 0 0<br />
12-Aug 79 1,142 0 3 629 1 1 0<br />
13-Aug 64 1,206 1 1 1032 0 0 0<br />
14-Aug 30 1,236 2 2 983 0 1 0<br />
15-Aug 14 1,250 1 2 580 1 0 0<br />
16-Aug 26 1,276 0 0 880 1 0 0<br />
17-Aug 19 1,295 2 0 366 0 0 0<br />
18-Aug 16 1,311 1 0 130 0 0 0<br />
19-Aug 89 1,400 6 0 729 0 0 0<br />
20-Aug 9 1,409 0 0 23 0 0 0<br />
21-Aug 29 1,438 20 0 410 0 0 0<br />
22-Aug 6 1,444 2 0 20 0 0 0<br />
23-Aug 14 1,458 1 0 10 0 0 0<br />
24-Aug 7 1,465 3 0 4 0 0 0<br />
25-Aug 2 1,467 0 0 2 0 0 0<br />
26-Aug 15 1,482 7 0 0 0 0 0<br />
Total 1,482 46 20 7,711 3 3 0<br />
40
Appendix 15 Byers <strong>Lake</strong> 2008 – Adult Sockeye Age Class<br />
Age Group<br />
0.3 1.2 1.3 2.2 1.4 2.3 Total<br />
Males 26 41 733 5 0 56 860<br />
Percent 1.74% 2.75% 49.46% 0.34% 0.00% 3.75% 58.04%<br />
Sample Size 5 8 144 1 0 11 169<br />
Mean Lth (mm) 602 515 585 518 0 593 582<br />
Std. Error 6 8 2 0 8 2<br />
Females 10 51 526 0 5 31 622<br />
Percent 0.67% 3.42% 35.46% 0.00% 0.34% 2.08% 41.97%<br />
Sample Size 2 10 103 0 1 6 122<br />
Mean Lth (mm) 548 507 564 0 559 570 560<br />
Std. Error 15 7 2 0 4 2<br />
Both Sexes 36 91 1,259 5 5 86 1,482<br />
Percent 2.41% 6.17% 84.92% 0.34% 0.34% 5.83% 100.01%<br />
Sample Size 7 18 247 1 1 17 291<br />
Mean Lth (mm) 587 510 576 518 559 585 573<br />
Std. Error 6 5 1 5 1<br />
41
25-May<br />
29-May<br />
2-Jun<br />
6-Jun<br />
10-Jun<br />
14-Jun<br />
18-Jun<br />
22-Jun<br />
10-Jul<br />
15-Jul<br />
20-Jul<br />
25-Jul<br />
30-Jul<br />
4-Aug<br />
9-Aug<br />
14-Aug<br />
19-Aug<br />
24-Aug<br />
29-Aug<br />
Smolt<br />
Adults<br />
Appendix 16 Byers <strong>Lake</strong> 2008 – Update<br />
Misc. Activities<br />
Adult Migration<br />
Ice-out: 20-May (approximate date)<br />
Dates: 16-Jul to 26-Aug<br />
Smolt Crew On-site: 28-May<br />
No. %<br />
Smolt Crew Off-site: 26-Jun<br />
Sockeyes: 1,482<br />
Adult Crew On-site: 15-Jul<br />
Mortalities: 0<br />
Adult Crew Off-site: 27-Aug<br />
Age 1.2: 91 6.2%<br />
Age 1.3: 1,259 84.9%<br />
Smolt Migration Age 2.2: 5 0.3%<br />
Dates: 30-May to 24-Jun Age 2.3: 86 5.8%<br />
No. % Coho: 46<br />
Sockeyes: 6,470 100% King: 20<br />
Mortalities: 0 0.0% Pink: 7,711<br />
Age 1: 6,410 99% Chum: 3<br />
Age 2: 60 1% Rainbow: 3<br />
Coho: 24,287 Dolly Varden 0<br />
12,000<br />
Byers <strong>Lake</strong> Sockeye Smolt<br />
2,500<br />
Byers <strong>Lake</strong> Sockeye Adults<br />
10,000<br />
8,000<br />
6,000<br />
4,000<br />
Avg 2008<br />
2,000<br />
1,500<br />
1,000<br />
Avg 2008<br />
2,000<br />
500<br />
0<br />
0<br />
42
Appendix 17 Byers <strong>Lake</strong> 2009 - Macrozooplankton Density<br />
Site A<br />
Density (No/m 2 )<br />
Seasonal Mean<br />
Date 29-May 23-Jun 29-Jul 24-Aug 2-Sep 17-Sep (No/m 2 )<br />
Holopedium 1,051 20,764 8,280 764 611 6,294<br />
Cyclops 56,369 80,000 104,459 86,369 164,442 98,726 98,394<br />
Bosmina 860 6,115 46,178 23,312 28,579 2,654 17,950<br />
Daphnia l. 382 1,147 31,847 118,280 125,624 184,713 76,999<br />
Diaptomus 20,382 44,586 17,771 19,562 16,720 23,804<br />
Other Copes 2,038 153 1,858 1,350<br />
Total: 218,497<br />
Site B<br />
Density (No/m 2 )<br />
Seasonal Mean<br />
Date 29-May 23-Jun 29-Jul 24-Aug 2-Sep 17-Sep (No/m 2 )<br />
Holopedium 1,529 37,070 15,032 15,032 204 318 11,531<br />
Cyclops 51,879 214,777 185,732 151,083 216,811 115,127 155,902<br />
Bosmina 1,911 16,815 64,459 38,217 44,422 3,662 28,248<br />
Daphnia l. 191 1,911 20,382 22,166 127,967 114,968 47,931<br />
Diaptomus 46,624 45,096 32,866 33,418 8,917 33,384<br />
Other Copes 4,586 408 478 1,824<br />
Total: 267,288<br />
43
Appendix 17 (cont’d) Byers <strong>Lake</strong> 2009 - Macrozooplankton Body Size & Biomass<br />
Site A<br />
Body Size (mm)<br />
Body Size (mm)<br />
Seasonal<br />
Weighted<br />
Date 29-May 23-Jun 29-Jul 24-Aug 2-Sep 17-Sep Mean<br />
Holopedium 0.38 2.21 1.90 1.06 0.65 1.24<br />
Cyclops 0.99 2.04 1.99 1.91 1.95 2.26 1.86<br />
Bosmina 0.82 0.45 1.01 1.08 1.08 1.12 0.93<br />
Daphnia l. 0.73 0.83 1.68 1.96 1.98 0.88 1.34<br />
Diaptomus 0.78 2.23 2.38 2.21 2.35 1.99<br />
Other Copes 0.50 1.74 1.57 1.27<br />
Site B<br />
Body Size (mm)<br />
Body Size (mm)<br />
Seasonal<br />
Weighted<br />
Date 29-May 23-Jun 29-Jul 24-Aug 2-Sep 17-Sep Mean<br />
Holopedium 0.35 2.16 0.77 0.40 0.44 0.82<br />
Cyclops 2.21 1.98 1.93 2.00 1.99 2.09 2.03<br />
Bosmina 0.88421 0.442 0.92 1.09 1.06 1.08 0.91<br />
Daphnia l. 1.34 0.73 1.82 1.88 2.01 2.84 1.77<br />
Diaptomus 0.82 2.28 1.15 2.33 1.14 1.54<br />
Other Copes 0.52 2.10 0.99 1.20<br />
Site A & B<br />
Biomass (mg/m2)<br />
Biomass (mg/m2)<br />
Seasonal<br />
Weighted<br />
Date 29-May 23-Jun 29-Jul 24-Aug 2-Sep 17-Sep Mean<br />
Holopedium 0.21 63.88 12.18 1.67 0.22 0.08 78<br />
Cyclops 30.31 60.39 53.36 40.70 60.62 38.65 284<br />
Bosmina 0.40 3.37 15.91 11.14 14.61 1.37 47<br />
Daphnia l. 0.10 0.63 11.17 38.06 78.69 83.69 212<br />
Diaptomus 0.00 12.88 44.30 26.22 27.07 13.03 123<br />
Other Copes 0.00 0.48 0.00 0.00 0.55 2.53 4<br />
Total: 748<br />
Appendix 17 (cont’d) Byers <strong>Lake</strong> 2009 - Water Quality<br />
44
Date Sta Depth TP TFP FRP TKN NH3+NH4 NO2+NO3 RSi Org C Chla Phaeo EZD<br />
(m) (ug/l) (ug/l) (ug/l) (ug/l) (ug/l) (ug/l) TN:TP (ug/l) (ug/l) (ug/l) (ug/l) Sta (m)<br />
29-May B 1 11.8 7.0 1.2 160.9 4.6 520.1 128 :1 3,650 218 0.99 0.46 A 12.3<br />
29-May B 30 8.7 5.2 1.1 145.3 5.0 494.6 163 :1 4,066 108 0.20 0.11 B 11.3<br />
23-Jun B 1 11.0 7.1 1.4 155.7 24.3 453.5 123 :1 3,679 139 0.59 0.24 A -<br />
23-Jun B 30 7.0 3.8 1.7 149.2 10.7 541.8 219 :1 3,970 117 0.18 0.16 B 9.5<br />
29-Jul B 1 16.1 11.5 1.3 157.5 9.9 456.9 85 :1 3,969 167 0.39 0.19 A -<br />
29-Jul B 8 9.3 5.1 1.2 122.5 7.7 431.7 132 :1 3,766 146 0.48 0.38 B 11.4<br />
24-Aug B 1 12.8 9.8 1.6 138.0 8.4 301.7 76 :1 3,608 176 0.55 0.20 A -<br />
24-Aug B 10 9.1 5.1 1.5 124.5 7.4 423.3 133 :1 3,671 134 0.54 0.30 B 8.8<br />
17-Sep B 1 21.4 18.0 2.0 148.4 12.2 296.5 46 :1 3,727 125 0.74 0.25<br />
17-Sep B 10 10.1 5.8 2.2 117.3 10.3 268.9 85 :1 3,763 119 0.56 0.41<br />
Mean 1 - Meter 14.6 10.7 1.5 152.1 11.9 405.7 84 :1 3,727 165 0.65 0.27 A 12.3<br />
Min 11.0 7.0 1.2 138.0 4.6 296.5 87 :1 3,608 125 0.39 0.19 12.3<br />
Max 21.4 18.0 2.0 160.9 24.3 520.1 70 :1 3,969 218 0.99 0.46 12.3<br />
Mean Hypolimnion 8.8 5.0 1.5 131.8 8.2 432.1 141 :1 3,847 125 0.39 0.27 B 10.3<br />
Min 7.0 3.8 1.1 117.3 5.0 268.9 122 :1 3,671 108 0.18 0.11 8.8<br />
Max 10.1 5.8 2.2 149.2 10.7 541.8 151 :1 4,066 146 0.56 0.41 11.4<br />
Date Sta Depth Sp. Cond pH Alk Turb Color Ca Mg Fe Secchi<br />
(m) (umhos/cm) (SU) (mg/l) (NTU) (Pt) (mg/l) (mg/l) (ug/l) Sta (meters)<br />
29-May B 1 33 6.7 13.9 0.6 13 4.9 1.0 64 A 3.5<br />
29-May B 30 36 6.6 14.4 0.4 12 5.0 0.9 66 B 4.0<br />
23-Jun B 1 38 6.6 14.4 0.2 11 4.6 0.9 49 A 7.5<br />
23-Jun B 30 38 6.6 14.2 0.4 12 5.2 0.7 60 B 7.0<br />
29-Jul B 1 41 6.7 15.6 0.3 9 5.2 0.9 51 A 6.5<br />
29-Jul B 8 39 6.6 14.8 0.3 10 4.9 0.9 40 B 6.5<br />
24-Aug B 1 42 6.8 16.9 0.5 10 5.1 0.9 64 A 5.0<br />
24-Aug B 10 40 6.7 16.2 0.5 11 5.0 0.9 56 B 5.0<br />
17-Sep B 1 41 6.7 16.2 0.4 11 5.5 0.9 55<br />
17-Sep B 10 39 6.5 15.7 0.3 11 5.1 0.9 55<br />
Mean 1 - Meter 39 6.7 15.4 0.4 11 5.1 0.9 57 A 5.6<br />
Min 33 6.6 13.9 0.2 9 4.6 0.9 49 3.5<br />
Max 42 6.8 16.9 0.6 13 5.5 1.0 64 7.5<br />
Mean Hypolimnion 38 6.6 15.1 0.4 11 5.0 0.9 55 B 5.6<br />
Min 36 6.5 14.2 0.3 10 4.9 0.7 40 4.0<br />
Max 40 6.7 16.2 0.5 12 5.2 0.9 66 7.0<br />
Appendix 18 Byers <strong>Lake</strong> 2009 – Environmental Conditions<br />
45
Water Air<br />
Precip. Stage Temp. Temp.<br />
Date Sky (mm) (ft) Flow ( o C) ( o C)<br />
28-May 5 ND 2.22 ND ND ND<br />
29-May 4 0 2.11 ND ND ND<br />
30-May 4 14 1.88 ND 5 10<br />
31-May 4 10 1.81 ND 7 7<br />
1-Jun 3 0 1.75 ND 6 14<br />
2-Jun 3 0 1.70 ND 8 14<br />
3-Jun 1 0 1.74 ND 9 22<br />
4-Jun 4 0 1.79 ND 9 21<br />
5-Jun 4 0 1.74 ND 9 16<br />
6-Jun 3 0 1.70 ND 10 18<br />
7-Jun 1 0 1.69 ND 12 21<br />
8-Jun 4 0 1.62 ND 9 21<br />
9-Jun 1 0 1.62 ND 13 21<br />
10-Jun 2 0 1.56 ND 14 20<br />
11-Jun 2 0 1.57 ND 9 16<br />
12-Jun 4 0 1.52 ND 11 13<br />
13-Jun 4 2 1.44 ND 12 13<br />
14-Jun 2 1 1.41 ND 12 18<br />
15-Jun 3 0 1.35 ND 14 17<br />
16-Jun 3 0 1.33 ND 12 19<br />
17-Jun 4 0 1.25 ND 11 12<br />
18-Jun 2 0 1.23 ND 13 17<br />
19-Jun 2 0 1.18 ND 13 19<br />
20-Jun 5 2 1.18 ND 12 9<br />
21-Jun 4 1 1.18 ND 13 11<br />
22-Jun 4 0 1.15 ND 12 12<br />
23-Jun 4 10 1.18 ND 11 8<br />
24-Jun 4 1 1.16 ND 11 10<br />
25-Jun 2 0 1.14 ND 12 16<br />
26-Jun 3 0 1.10 ND 12 16<br />
27-Jun 3 0 1.08 ND 14 20<br />
28-Jun 3 0 1.07 ND 14 19<br />
29-Jun 3 0 1.06 ND 14 19<br />
Total 42<br />
Avg. 1.3 1.47 ND 11 16<br />
Min. 0.0 1.06 ND 5 7<br />
Max. 13.5 2.22 ND 14 22<br />
Ice out = ND<br />
Summary of Cloud Cover - Percent of Days<br />
No. Meas.<br />
Partly<br />
Days Rain Overcast Cloudy Clear<br />
Smolts 33 36% 45% 18% 9%<br />
1.0 = Clear<br />
2.0 = Cloud Cover 50%<br />
4.0 = Overcast<br />
5.0 = Rain<br />
ND = No Data<br />
Appendix 19 Byers <strong>Lake</strong> 2009 - Smolt Migration<br />
46
Sockeye Coho King Pink Chum Rainbow<br />
Date Daily Mort. Total Daily Mort. Total Daily Total Daily Total Daily Total Daily Total<br />
28-May 105 0 105 4 0 4 28 28 0 0 0 0 0 0<br />
29-May 3 0 108 14 0 18 8 36 0 0 0 0 0 0<br />
30-May 1 0 109 7 0 25 4 40 0 0 0 0 0 0<br />
31-May 1 0 110 2 0 27 3 43 0 0 0 0 0 0<br />
1-Jun 2 0 112 4 0 31 9 52 0 0 0 0 0 0<br />
2-Jun 335 0 447 193 0 224 69 121 0 0 0 0 0 0<br />
3-Jun 184 0 631 149 0 373 0 121 0 0 0 0 0 0<br />
4-Jun 326 0 957 516 0 889 1 122 0 0 0 0 0 0<br />
5-Jun 178 0 1,135 584 0 1,473 0 122 0 0 0 0 0 0<br />
6-Jun 214 0 1,349 796 0 2,269 0 122 0 0 0 0 0 0<br />
7-Jun 227 0 1,576 274 0 2,543 0 122 0 0 0 0 0 0<br />
8-Jun 404 0 1,980 1,377 0 3,920 0 122 0 0 0 0 0 0<br />
9-Jun 848 0 2,828 1,164 0 5,084 0 122 0 0 0 0 0 0<br />
10-Jun 629 0 3,457 744 0 5,828 0 122 0 0 0 0 0 0<br />
11-Jun 970 0 4,427 1,935 0 7,763 0 122 0 0 0 0 0 0<br />
12-Jun 223 0 4,650 1,317 0 9,080 0 122 0 0 0 0 0 0<br />
13-Jun 115 0 4,765 662 0 9,742 0 122 0 0 0 0 0 0<br />
14-Jun 1,427 0 6,192 1,381 0 11,123 0 122 0 0 0 0 0 0<br />
15-Jun 2,292 0 8,484 1,084 0 12,207 0 122 0 0 0 0 0 0<br />
16-Jun 382 0 8,866 504 0 12,711 0 122 0 0 0 0 0 0<br />
17-Jun 992 0 9,858 585 0 13,296 0 122 0 0 0 0 0 0<br />
18-Jun 778 0 10,636 960 0 14,256 0 122 0 0 0 0 0 0<br />
19-Jun 547 0 11,183 445 0 14,701 0 122 0 0 0 0 0 0<br />
20-Jun 485 0 11,668 396 0 15,097 0 122 0 0 0 0 0 0<br />
21-Jun 452 0 12,120 203 0 15,300 0 122 0 0 0 0 0 0<br />
22-Jun 464 0 12,584 387 0 15,687 0 122 0 0 0 0 0 0<br />
23-Jun 604 0 13,188 632 0 16,319 0 122 0 0 0 0 0 0<br />
24-Jun 752 0 13,940 642 0 16,961 0 122 0 0 0 0 0 0<br />
25-Jun 529 0 14,469 360 0 17,321 0 122 0 0 0 0 0 0<br />
26-Jun 126 0 14,595 104 0 17,425 0 122 0 0 0 0 0 0<br />
27-Jun 48 0 14,643 77 0 17,502 0 122 0 0 0 0 0 0<br />
28-Jun 16 0 14,659 28 0 17,530 0 122 0 0 0 0 0 0<br />
29-Jun 141 0 14,800 170 0 17,700 0 122 0 0 0 0 0 0<br />
Total 14,800 0 14,800 17,700 0 17,700 122 0 0 0<br />
Appendix 20 Byers <strong>Lake</strong> 2009 – Update<br />
47
19-May<br />
23-May<br />
27-May<br />
31-May<br />
4-Jun<br />
8-Jun<br />
12-Jun<br />
16-Jun<br />
20-Jun<br />
24-Jun<br />
28-Jun<br />
Smolt<br />
Misc. Activities<br />
Smolt Migration<br />
Ice-out: ND<br />
(approximate date)<br />
Dates: 28-May to 29-Jun<br />
Smolt Crew On-site: 28-May<br />
No. %<br />
Smolt Crew Off-site: 30-Jun<br />
Sockeyes: 14,800 100%<br />
Mortalities: 0 0%<br />
Age 1: 14,648 99%<br />
Age 2: 138 1%<br />
Coho: 17,700<br />
16,000<br />
14,000<br />
Byers <strong>Lake</strong> Sockeye Smolt<br />
12,000<br />
10,000<br />
Avg 2009<br />
8,000<br />
6,000<br />
4,000<br />
2,000<br />
0<br />
Appendix 21 Byers <strong>Lake</strong> – Historical sockeye smolt migrations<br />
48
Date 2007 2008 2009<br />
19-May 0 0 0<br />
20-May 2 0 0<br />
21-May 7 0 0<br />
22-May 9 0 0<br />
23-May 10 0 0<br />
24-May 12 0 0<br />
25-May 632 0 0<br />
26-May 1,353 0 0<br />
27-May 1,476 0 0<br />
28-May 1,476 0 0<br />
29-May 1,476 0 0<br />
30-May 1,476 1,048 109<br />
31-May 1,872 1,916 110<br />
1-Jun 1,872 2,168 112<br />
2-Jun 1,872 2,380 447<br />
3-Jun 2,005 2,438 631<br />
4-Jun 3,513 2,471 957<br />
5-Jun 4,642 2,655 1,135<br />
6-Jun 4,680 2,869 1,349<br />
7-Jun 4,680 2,919 1,576<br />
8-Jun 4,684 2,945 1,980<br />
9-Jun 7,128 2,990 2,828<br />
10-Jun 8,408 3,060 3,457<br />
11-Jun 9,837 3,099 4,427<br />
12-Jun 11,388 3,130 4,650<br />
13-Jun 13,119 3,167 4,765<br />
14-Jun 14,478 3,332 6,192<br />
15-Jun 14,592 3,482 8,484<br />
16-Jun 14,660 3,642 8,866<br />
17-Jun 15,074 3,765 9,858<br />
18-Jun 15,221 3,885 10,636<br />
19-Jun 15,495 3,928 11,183<br />
20-Jun 15,495 3,954 11,668<br />
21-Jun 15,526 4,174 12,120<br />
22-Jun 15,526 5,751 12,584<br />
23-Jun 15,526 6,187 13,188<br />
24-Jun 15,530 6,470 13,940<br />
25-Jun 14,469<br />
26-Jun 14,595<br />
27-Jun 14,643<br />
28-Jun 14,659<br />
29-Jun 14,841<br />
Total 15,530 6,470 14,841<br />
Avg 12,280<br />
Appendix 22 Byers <strong>Lake</strong> – Historical adult sockeye migrations<br />
49
Date 2006 2007 2008<br />
10-Jul<br />
11-Jul<br />
12-Jul<br />
13-Jul 0<br />
14-Jul 0<br />
15-Jul 0<br />
16-Jul 0 0 0<br />
17-Jul 0 0 0<br />
18-Jul 0 0 0<br />
19-Jul 0 0 0<br />
20-Jul 3 0 0<br />
21-Jul 3 0 0<br />
22-Jul 3 0 0<br />
23-Jul 3 0 0<br />
24-Jul 3 0 0<br />
25-Jul 3 0 0<br />
26-Jul 3 0 0<br />
27-Jul 3 0 0<br />
28-Jul 3 0 0<br />
29-Jul 3 0 2<br />
30-Jul 4 0 2<br />
31-Jul 13 0 8<br />
01-Aug 14 0 8<br />
02-Aug 28 0 137<br />
03-Aug 30 0 184<br />
04-Aug 62 0 443<br />
05-Aug 80 0 493<br />
06-Aug 129 0 536<br />
07-Aug 261 0 758<br />
08-Aug 1,077 0 787<br />
09-Aug 1,384 1 820<br />
10-Aug 2,195 156 1,009<br />
11-Aug 2,579 195 1,063<br />
12-Aug 2,633 196 1,142<br />
13-Aug 2,664 373 1,206<br />
14-Aug 2,812 426 1,236<br />
15-Aug 2,948 464 1,250<br />
16-Aug 3,071 526 1,276<br />
17-Aug 583 1,295<br />
18-Aug 625 1,311<br />
19-Aug 700 1,400<br />
20-Aug 714 1,409<br />
21-Aug 734 1,438<br />
22-Aug 766 1,444<br />
23-Aug 967 1,458<br />
24-Aug 1,241 1,465<br />
25-Aug 1,291 1,467<br />
26-Aug 1,336 1,482<br />
27-Aug 1,645<br />
28-Aug 1,645<br />
29-Aug 1,671<br />
30-Aug 1,701<br />
Total 3,071 1,701 1,482<br />
Avg 2,085<br />
50
This page was intentionally left blank<br />
51