Guggenheim StylePlus Large Core A - Security Benefit
Guggenheim StylePlus Large Core A - Security Benefit
Guggenheim StylePlus Large Core A - Security Benefit

You also want an ePaper? Increase the reach of your titles
YUMPU automatically turns print PDFs into web optimized ePapers that Google loves.
®<br />
Fact Sheet as of 12/31/2013<br />
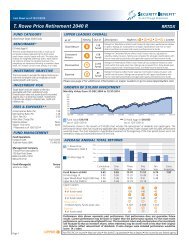
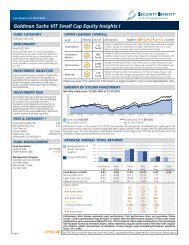
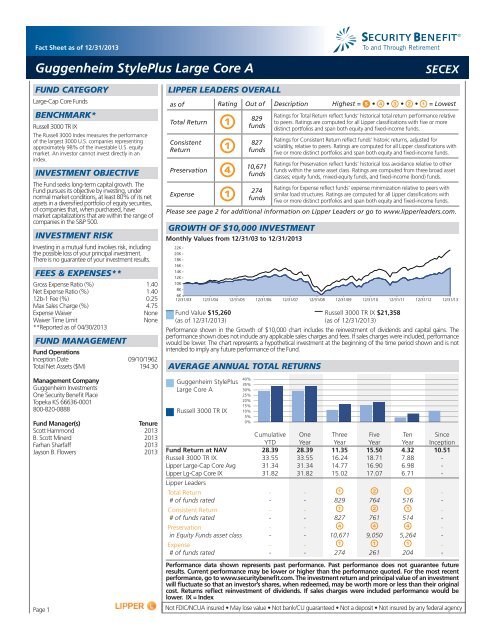
<strong>Guggenheim</strong> <strong>StylePlus</strong> <strong>Large</strong> <strong>Core</strong> A<br />
To and Through Retirement<br />
SECEX<br />
FUND CATEGORY<br />
<strong>Large</strong>-Cap <strong>Core</strong> Funds<br />
BENCHMARK*<br />
Russell 3000 TR IX<br />
The Russell 3000 Index measures the performance<br />
of the largest 3000 U.S. companies representing<br />
approximately 98% of the investable U.S. equity<br />
market. An investor cannot invest directly in an<br />
index.<br />
INVESTMENT OBJECTIVE<br />
The Fund seeks long-term capital growth. The<br />
Fund pursues its objective by investing, under<br />
normal market conditions, at least 80% of its net<br />
assets in a diversified portfolio of equity securities,<br />
of companies that, when purchased, have<br />
market capitalizations that are within the range of<br />
companies in the S&P 500.<br />
INVESTMENT RISK<br />
Investing in a mutual fund involves risk, including<br />
the possible loss of your principal investment.<br />
There is no guarantee of your investment results.<br />
FEES & EXPENSES**<br />
Gross Expense Ratio (%) 1.40<br />
Net Expense Ratio (%) 1.40<br />
12b-1 Fee (%) 0.25<br />
Max Sales Charge (%) 4.75<br />
Expense Waiver<br />
None<br />
Waiver Time Limit<br />
None<br />
**Reported as of 04/30/2013<br />
FUND MANAGEMENT<br />
Fund Operations<br />
Inception Date 09/10/1962<br />
Total Net Assets ($M) 194.30<br />
Management Company<br />
<strong>Guggenheim</strong> Investments<br />
One <strong>Security</strong> <strong>Benefit</strong> Place<br />
Topeka KS 66636-0001<br />
800-820-0888<br />
Fund Manager(s)<br />
Tenure<br />
Scott Hammond 2013<br />
B. Scott Minerd 2013<br />
Farhan Sharfaff 2013<br />
Jayson B. Flowers 2013<br />
Page 1<br />
LIPPER LEADERS OVERALL<br />
as of Rating Out of Description<br />
Total Return<br />
1 829<br />
funds<br />
Consistent<br />
Return 1 827<br />
funds<br />
Preservation<br />
4 10,671<br />
funds<br />
Expense<br />
1 274<br />
funds<br />
GROWTH OF $10,000 INVESTMENT<br />
Monthly Values from 12/31/03 to 12/31/2013<br />
22K<br />
20K<br />
18K<br />
16K<br />
14K<br />
12K<br />
10K<br />
8K<br />
6K<br />
12/31/03 12/31/04 12/31/05 12/31/06 12/31/07 12/31/08 12/31/09 12/31/10 12/31/11 12/31/12 12/31/13<br />
Fund Value $15,260<br />
(as of 12/31/2013)<br />
AVERAGE ANNUAL TOTAL RETURNS<br />
<strong>Guggenheim</strong> <strong>StylePlus</strong><br />
<strong>Large</strong> <strong>Core</strong> A<br />
Russell 3000 TR IX<br />
Cumulative One Three Five Ten Since<br />
YTD Year Year Year Year Inception<br />
Fund Return at NAV 28.39 28.39 11.35 15.50 4.32 10.51<br />
Russell 3000 TR IX 33.55 33.55 16.24 18.71 7.88 -<br />
Lipper <strong>Large</strong>-Cap <strong>Core</strong> Avg 31.34 31.34 14.77 16.90 6.98 -<br />
Lipper Lg-Cap <strong>Core</strong> IX 31.82 31.82 15.02 17.07 6.71 -<br />
Lipper Leaders<br />
40%<br />
35%<br />
30%<br />
25%<br />
20%<br />
15%<br />
10%<br />
5%<br />
0%<br />
Highest = 5 • 4 • 3 • 2 • 1 = Lowest<br />
Ratings for Total Return reflect funds’ historical total return performance relative<br />
to peers. Ratings are computed for all Lipper classifications with five or more<br />
distinct portfolios and span both equity and fixed-income funds.<br />
Ratings for Consistent Return reflect funds’ historic returns, adjusted for<br />
volatility, relative to peers. Ratings are computed for all Lipper classifications with<br />
five or more distinct portfolios and span both equity and fixed-income funds.<br />
Ratings for Preservation reflect funds’ historical loss avoidance relative to other<br />
funds within the same asset class. Ratings are computed from three broad asset<br />
classes; equity funds, mixed-equity funds, and fixed-income (bond) funds.<br />
Ratings for Expense reflect funds’ expense minimization relative to peers with<br />
similar load structures. Ratings are computed for all Lipper classifications with<br />
five or more distinct portfolios and span both equity and fixed-income funds.<br />
Please see page 2 for additional information on Lipper Leaders or go to www.lipperleaders.com.<br />
Russell 3000 TR IX $21,358<br />
(as of 12/31/2013)<br />
Performance shown in the Growth of $10,000 chart includes the reinvestment of dividends and capital gains. The<br />
performance shown does not include any applicable sales charges and fees. If sales charges were included, performance<br />
would be lower. The chart represents a hypothetical investment at the beginning of the time period shown and is not<br />
intended to imply any future performance of the Fund.<br />
Total Return - - 1 2 1 -<br />
# of funds rated - - 829 764 516 -<br />
Consistent Return - - 1 2 1 -<br />
# of funds rated - - 827 761 514 -<br />
Preservation - - 4 4 4 -<br />
in Equity Funds asset class - - 10,671 9,050 5,264 -<br />
Expense - - 1 1 1 -<br />
# of funds rated - - 274 261 204 -<br />
Performance data shown represents past performance. Past performance does not guarantee future<br />
results. Current performance may be lower or higher than the performance quoted. For the most recent<br />
performance, go to www.securitybenefit.com. The investment return and principal value of an investment<br />
will fluctuate so that an investor’s shares, when redeemed, may be worth more or less than their original<br />
cost. Returns reflect reinvestment of dividends. If sales charges were included performance would be<br />
lower. IX = Index<br />
Not FDIC/NCUA insured • May lose value • Not bank/CU guaranteed • Not a deposit • Not insured by any federal agency
<strong>Guggenheim</strong> <strong>StylePlus</strong> <strong>Large</strong> <strong>Core</strong> A<br />
RISK MEASURES - 3 YEAR<br />
Standard<br />
Deviation<br />
Sharpe<br />
Ratio<br />
13.56<br />
0.85<br />
Alpha 1 -0.45<br />
Standard deviation is a measure of risk that gauges the variability of actual returns from<br />
their expected values and the dispersion of these variations over time.<br />
Sharpe ratio is a measure that uses standard deviation and excess return to determine<br />
reward per unit of risk. The greater a portfolio’s Sharpe ratio, the better its risk-adjusted<br />
performance has been.<br />
Alpha measures a manager’s contribution to performance due to security selection or<br />
market timing relative to the benchmark.<br />
Beta 1 1.07 Beta measures a portfolio’s sensitivity to market movements relative to the benchmark.<br />
R-Squared 1 0.97<br />
R-squared is a measure that indicates the extent to which fluctuations in portfolio<br />
returns are correlated with those of the benchmark.<br />
1<br />
Statistics are measured against the Fund’s benchmark: Russell 3000 TR IX.<br />
TOP INDUSTRIES 2<br />
as of 11/30/13<br />
Industry Sector . . . . . . . . . . . . . . . . . . . . . .% of TNA<br />
Industrials. . . . . . . . . . . . . . . . . . . . . . . . . . . . . . . . . 3.64<br />
Health Care . . . . . . . . . . . . . . . . . . . . . . . . . . . . . . . 3.59<br />
Technology. . . . . . . . . . . . . . . . . . . . . . . . . . . . . . . . 3.52<br />
Consumer Services . . . . . . . . . . . . . . . . . . . . . . . . . 3.05<br />
Oil & Gas . . . . . . . . . . . . . . . . . . . . . . . . . . . . . . . . . 2.67<br />
Consumer Goods . . . . . . . . . . . . . . . . . . . . . . . . . . 1.87<br />
Financials . . . . . . . . . . . . . . . . . . . . . . . . . . . . . . . . . 1.84<br />
Utilities . . . . . . . . . . . . . . . . . . . . . . . . . . . . . . . . . . . 0.53<br />
Telecommunications . . . . . . . . . . . . . . . . . . . . . . . . 0.07<br />
Basic Materials. . . . . . . . . . . . . . . . . . . . . . . . . . . . . 0.06<br />
2<br />
Sector weightings are based on ICB Industries.<br />
TOP TEN HOLDINGS<br />
as of 11/30/13<br />
Fund Holdings. . . . . . . . . . . . . . . . . . . . . . . % of TNA<br />
GEER MTN FING LTD / GEER MTN FING CORP 0 . 2.06<br />
<strong>Guggenheim</strong> Floating Rate Strategies Fund . . . . . 1.74<br />
<strong>Guggenheim</strong> Macro Opportunities Fund;Inst . . . . 1.69<br />
<strong>Guggenheim</strong> Invest BulletShares 2015 HY C . . . . 1.67<br />
<strong>Guggenheim</strong> Invest BulletShares 2016 HY C . . . . 1.67<br />
<strong>Guggenheim</strong> Invest BulletShares 2014 HY C . . . . 1.65<br />
Other Assets and Liabilities . . . . . . . . . . . . . . . . . . . 1.52<br />
NEW YORK N Y CITY MUN WTR FIN AUTH WTR & . .<br />
1.35<br />
DUANE STREET CLO, LTD FRN 14-Nov-2021 4. . . 1.31<br />
HSI ASSET SECURITIZATION CORPORATION TRU. 1.27<br />
PORTFOLIO CHARACTERISTICS<br />
as of 11/30/13<br />
Number of Holdings . . . . . . . . . . . . . . . . . . . . . . . .228<br />
Portfolio Turnover (%) . . . . . . . . . . . . . . . . . . . . . .217<br />
Avg Market Capitalization ($M) . . . . . . . . . . 122791.2<br />
Price to Earnings . . . . . . . . . . . . . . . . . . . . . . . . . 18.78<br />
Price to Book. . . . . . . . . . . . . . . . . . . . . . . . . . . . . 3.31<br />
Top Holdings, Asset Allocation, and Sector Weightings<br />
data is based on information collected from the investment<br />
company, is updated as of the date shown in the section’s<br />
title, and will vary over time. Asset Allocation may equal<br />
less than or greater than 100% due to hedged funds or<br />
leveraged cash positions by the fund.<br />
ASSET ALLOCATION<br />
as of 11/30/13<br />
Fixed Income 66.22<br />
Equity 20.84<br />
Cash 11.62<br />
Other 1.31<br />
Lipper Leaders Overall ratings DO NOT take into account the effects of sales charges.<br />
The Lipper Leader Overall ratings are subject to change every month and are based<br />
on an equal-weighted average of percentile ranks for the Total Return, Consistent<br />
Return, Preservation, and Expense metrics over three-, five-, and ten-year periods (if<br />
applicable). The highest 20% of funds in each peer group are named Lipper Leaders<br />
or a 5, the next 20% receive a rating of 4, the middle 20% receive a rating of 3, the<br />
next 20% receive a rating of 2, and the lowest 20% receive a rating of 1. For more<br />
information on Lipper Leaders, go to www.lipperleaders.com.<br />
*Lipper Best Fit Index - A variety of market indices are available to benchmark fund<br />
performance. The Lipper Best-Fit Index is the market index that best correlates to a<br />
fund’s performance. Lipper Best-Fit indices are not available for funds with less than 3<br />
years of performance history.<br />
Lipper Services are not affiliated with <strong>Security</strong> Distributors, Inc. its subsidiaries and<br />
affiliates (<strong>Security</strong> <strong>Benefit</strong>). <strong>Security</strong> <strong>Benefit</strong> has no responsibility for the management<br />
operations of Lipper Services or any of its affiliates.<br />
This investment option may be available to you through the purchase of a variable<br />
annuity OR through a retirement plan or individual retirement account.<br />
Variable Annuity Contract Disclosures<br />
This fact sheet must be accompanied by the variable annuity performance report<br />
for the most recent calendar quarter end which contains standardized performance<br />
information at the variable annuity contract level.<br />
Certain of these annual returns pre-date the offering of the fund as an underlying<br />
investment option in the variable annuity. Pre-dated performance is hypothetical.<br />
Annuities are long-term investments suitable for retirement planning. Investing in<br />
variable annuities involves risk and there is no guarantee of investment results.<br />
Variable annuities are issued by <strong>Security</strong> <strong>Benefit</strong> Life Insurance Company (SBL) in all<br />
states except New York. In New York, variable annuities are issued by First <strong>Security</strong><br />
<strong>Benefit</strong> Life Insurance and Annuity Company of New York (FSBL), Rye Brook, New<br />
York. SBL is not authorized in the state of New York and does not transact insurance<br />
business in New York.<br />
Retirement Plan or Individual Retirement Account Disclosures (Retirement<br />
Program)<br />
Sales loads are waived by the funds for purchases made through such programs. If<br />
you purchased the fund outside your Retirement Program, you may be subject to<br />
these charges. Sales charges would reduce the performance quoted.<br />
You may also be subject to certain account level charges. The performance numbers<br />
quoted do not reflect the account charges of your Retirement Program, and would be<br />
lower if such charges were deducted. Refer to your retirement plan documentation or<br />
your individual account agreement for account level charges.<br />
Investing in mutual funds involves risk, including loss of principal, and there is no<br />
guarantee of investment results.<br />
General Disclosures<br />
Triple-digit or high double-digit performance is attributable, in part, to unusually<br />
favorable market conditions and may not be repeated or consistently achieved in the<br />
future. Recent market volatility may affect performance so that current performance<br />
may be lower. Performance, especially for short time periods, should not be the sole<br />
factor in making your investment decisions.<br />
You should carefully consider the investment objectives, risks, and charges<br />
and expenses of the Variable Annuity and its underlying investment options<br />
before investing. You may obtain a prospectus for the variable annuity and<br />
prospectuses or summary prospectuses (if available) for the underlying<br />
investment options by calling our Service Center at 1-800-888-2461. You<br />
should read the prospectuses carefully before investing. Investing in variable<br />
annuities involves risk and there is no guarantee of investment results.<br />
Securities are distributed by <strong>Security</strong> Distributors, Inc. (SDI). SDI is a wholly-owned<br />
subsidiary of SBL. SBL and FSBL are affiliates and wholly-owned subsidiaries of <strong>Security</strong><br />
<strong>Benefit</strong> Corporation (<strong>Security</strong> <strong>Benefit</strong>).<br />
Lipper Fund Fact Sheet Service a Lipper, a Thomson Reuters Company. Copyright<br />
2014 Thomson Reuters. All rights reserved. Any copying, republication or<br />
redistribution of Lipper content is expressly prohibited without the prior written<br />
consent of Lipper. Lipper Fund Fact Sheets Service; Product ID: SBEQOE<br />
<strong>Security</strong> Distributors, Inc.<br />
Page 2