Nellore Vulnerability Report - Sicom
Nellore Vulnerability Report - Sicom
Nellore Vulnerability Report - Sicom

Create successful ePaper yourself
Turn your PDF publications into a flip-book with our unique Google optimized e-Paper software.
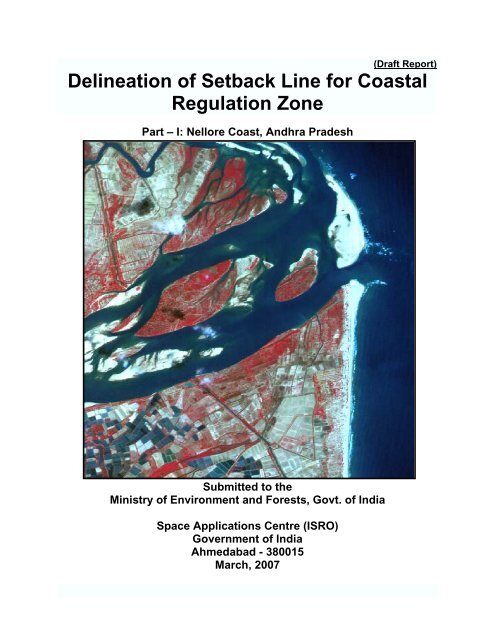
(Draft <strong>Report</strong>)<br />
Delineation of Setback Line for Coastal<br />
Regulation Zone<br />
Part – I: <strong>Nellore</strong> Coast, Andhra Pradesh<br />
Submitted to the<br />
Ministry of Environment and Forests, Govt. of India<br />
Space Applications Centre (ISRO)<br />
Government of India<br />
Ahmedabad - 380015<br />
March, 2007
Scientific <strong>Report</strong><br />
(Draft <strong>Report</strong>)<br />
SAC/RESIPA/MESG/ESHD/CP/SR/60/2007<br />
Delineation of Setback Line for Coastal<br />
Regulation Zone<br />
Part – I: <strong>Nellore</strong> Coast, Andhra Pradesh<br />
Submitted to the<br />
Ministry of Environment and Forests, Govt. of India<br />
Space Applications Centre (ISRO)<br />
Government of India<br />
Ahmedabad - 380015<br />
March, 2007<br />
1
SPACE APPLICATIONS CENTRE<br />
AHMEDABAD<br />
1. <strong>Report</strong> No. and Publication<br />
Date<br />
SAC/RESIPA/MESG/ESHD/CP/SR/60/2007<br />
March, 2007<br />
2. Title and Subtitle Delineation of Setback Line for Coastal Regulation Zone,<br />
Part I, <strong>Nellore</strong> Coast, Andhra Pradesh<br />
3. Type of <strong>Report</strong> Scientific <strong>Report</strong><br />
4. Pages 65<br />
5. Number of references 36<br />
6. Author (s) Project teams at SAC, CESS and SOI<br />
7. Originating Unit Earth Sciences and Hydrology Division, Marine and Earth<br />
Sciences Group, Remote Sensing Applications and<br />
Image Processing Area<br />
8. Abstract The report describes the methodology adopted and<br />
salient results obtained for delineating setback line as per<br />
Swaminathan Committee’s recommendations for<br />
redefining existing Coastal Regulation Zone (CRZ)<br />
boundary. Out of six selected areas details of <strong>Nellore</strong><br />
coast, Andhra Pradesh have been described in the<br />
present report. Shoreline changes using old topographical<br />
maps and recent Resourcesat-1 LISS IV and<br />
CARTOSAT-1 PAN data of 2006 have been brought out.<br />
Annual rate of shoreline changes are computed and<br />
projected for the year 2025, 2050 and 2106 and projected<br />
line has been identified and mapped as hazard line for<br />
respective periods. Flood line has been delineated based<br />
on wave run up elevation, highest high tide elevation and<br />
Intergovernmental Panel on Climate Change (IPCC)<br />
projected rate of Sea Level Rise (SLR) for the above<br />
periods. DEM has been generated using 0.5 m contour<br />
data supplied by the Survey of India. Flood inundation<br />
has been simulated for the year 2025, 2050 and 2106.<br />
<strong>Vulnerability</strong> line has been delineated by integrating<br />
hazard line and flood line by considering most landward<br />
segments of flood line or hazard line. Flood inundation<br />
scenarios have been generated for the year 2025, 2050<br />
and 2106 and in such cases vulnerability line is<br />
demarcated as union of flood and hazard line<br />
(considering landward segments only).<br />
9. Key words Coastal Regulation Zone, Setback line, Shore line<br />
changes, Hazard line, Flood line, <strong>Vulnerability</strong> line, Digital<br />
Elevation Model (DEM), Resourcesat-1 LISS-IV,<br />
Cartosat-1 PAN<br />
10. Distribution Restricted<br />
2
Project Team<br />
Project Coordination and Management<br />
Dr. Ajai, (SAC)<br />
Space Applications Centre, Ahmedabad<br />
Shri Satadru Bhattacharya<br />
Ms. Suchita Jain<br />
Dr. A.S. Rajawat<br />
Centre for Earth Science Studies, Thiruvananthapurm<br />
Dr. M. Baba<br />
Dr. N.P. Kurian<br />
Dr. Shahul Hameed<br />
Survey of India, Dehradun<br />
Names awaited from SOI<br />
3
ACKNOWLEDGEMENTS<br />
Ministry of Environment and Forests (MoEF), New Delhi had set up an<br />
Expert Committee under the Chairmanship of Prof. M. S. Swaminathan to<br />
review the criterion of demarcating existing Coastal Regulation Zone<br />
boundary. The Swaminathan Committee recommended that use of<br />
vulnerability of coastline should be considered to fix the setback line. In<br />
order to implement the recommendations of the Swaminathan Committee,<br />
Ms. Meena Gupta, then Special Secretary, MoEF initiated the work on<br />
“<strong>Vulnerability</strong> line demarcation”, and put efforts to involve Survey of India,<br />
Dehradun, Centre for Earth Sciences, Thiruvananthapurm, Department of<br />
Ocean Development, Chennai and Space Applications Centre, Ahmedabad<br />
(as nodal agency) for demonstrative pilot project study to assess the<br />
feasibility of vulnerability line demarcation for selected parts of the Indian<br />
coast.<br />
We are thankful to Dr. R.R. Navalgund, Director, SAC and Dr. K.L.<br />
Majumder (then Deputy Director, RESIPA, SAC) for providing overall<br />
guidance and encouragement. We are grateful to Major General M. Gopal<br />
Rao, Surveyor General of India for providing institutional support. The pilot<br />
project has been taken up at SAC on the basis of approach suggested by<br />
an advisory group formed by MoEF. We are thankful to members of the<br />
advisory group constituting of Prof. John Pethick, UK, Dr. Shailesh Nayak,<br />
Director, Indian National Centre for Ocean Information Services (INCOIS),<br />
Hyderabad (then Group Director, MWRG, at SAC), Dr. M. Baba, Director,<br />
Centre for Earth Science Studies (CESS), Thiruvananthapuram and Dr. R.<br />
4
Chandramohan , (then Joint Secretary, MoEF), New Delhi for guidelines<br />
provided by them.<br />
Dr. N.H. Hosabettu, Director, MoEF and Shri A. Senthil Vel, Additional<br />
Director, MoEF have coordinated the work from MoEF. We are thankful to<br />
them. We are thankful to Dr. T.J. Majumdar, Head, ESHD/SAC for<br />
encouragement, going through the manuscript of the report and providing<br />
critical comments. We are thankful to Shri V. Tamilarasan, Scientist SG<br />
and Project Coordinator for Coastal Zone Studies Project, SAC for useful<br />
discussions. We are thankful to Shri Sashi Kant Sharma and Shri Ritesh<br />
Aggarwal, Scientists, SAC for help in preparing Digital Elevation model<br />
(DEM) and creating animation of flood inundation. We thank ICMAM<br />
Project Directorate, Chennai for providing bathymetry data. Dr. M.V.<br />
Ramana Murthy, Scientist, ICMAM is thanked for useful discussions.<br />
Thanks are due to NIO, Goa and NIOT, Chennai for providing the wave<br />
data for this work.<br />
5
Contents<br />
Page No.<br />
Summary 7<br />
List of Figures 9<br />
List of Tables 11<br />
1. Background and Introduction 12<br />
2. Objectives 16<br />
3. Participating Agencies 16<br />
4. Study Area 16<br />
5. Materials and methods 18<br />
5.1 Delineation of hazard line 19<br />
5.2 Delineation of flood line 23<br />
5.3 Delineation of vulnerability line 32<br />
6. Results and Discussions 32<br />
6.1 Salient characteristics and landforms 32<br />
6.2 Hazard line 38<br />
6.3 Flood line 53<br />
6.4 <strong>Vulnerability</strong> line 56<br />
7. Conclusions 59<br />
References 60<br />
6
SUMMARY<br />
Ministry of Environment and Forests (MoEF) had issued a notification<br />
in 1991 under the Environment (Protection) Act, 1986 to regulate<br />
activities along the Indian coast. Under this Notification, the Coastal<br />
Regulation Zone (CRZ) has been defined as the area between low<br />
tide line and high tide line (HTL) and area up to 500 m from the HTL.<br />
The distance of 500 m has been defined arbitrarily. CRZ Notification<br />
led to large number of representations for exemption from its<br />
provisions. The present report describes the approach followed and<br />
salient results for delineating setback line on the basis of vulnerability<br />
assessment of the coast as per Swaminathan Committee’s<br />
recommendations for redefining existing Coastal Regulation Zone<br />
boundary. The recommendations of the Swaminathan Committee<br />
included: I) integrated coastal zone management; ii) Ocean part to be<br />
included; iii) a participatory approach to management; iv) safety of<br />
people and property; v) a scientific basis needed for coastal zone<br />
planning and landuse and; vi) <strong>Vulnerability</strong> mapping as a possible<br />
method. Six study areas have been identified. These are Dahej<br />
(Gujarat), Navi Mumbai (Maharashtra), Mangalore (Karnataka), along<br />
west coast and Paradip (Orissa), <strong>Nellore</strong> (A.P.) and Nagapattinam<br />
(Tamil Nadu) along east coast. Out of six selected areas details of<br />
<strong>Nellore</strong> coast, Andhra Pradesh have been described in the present<br />
report. Shoreline changes using old SOI topographical maps and<br />
recent Resourcesat-1 LISS IV and CARTOSAT-1 PAN data of 2006<br />
have been brought out. Annual rate of shoreline changes are<br />
7
computed and projected for the year 2025, 2050 and 2106. Hazard<br />
line has been delineated for these periods. Flood line has been<br />
delineated based on wave run up elevation; highest high tide<br />
elevation and Intergovernmental Panel on Climate Change (IPCC)<br />
projected Sea Level Rise (SLR) for the above periods. DEM has been<br />
generated using 0.5 m contour data supplied by the Survey of India.<br />
Flood inundation maps have been simulated for the year 2025, 2050<br />
and 2106. <strong>Vulnerability</strong> line has been delineated by integrating<br />
hazard line and flood line by considering most landward segments of<br />
flood line or hazard line. Flood inundation scenarios have been<br />
generated for the year 2025, 2050 and 2106 and in such cases<br />
vulnerability line is demarcated as union of flood and hazard line<br />
(considering landward segments only). The approach has been<br />
applied to demarcate vulnerability line for the year 2025, 2050 and<br />
2106.<br />
8
LIST OF FIGURES<br />
Fig. 1: Location map of the study area (modified after Chandramohan et al.,<br />
2001)<br />
Fig.2: Typical examples of computed wave heights in the nearshore off<br />
Mangalore.<br />
Fig. 3: Typical examples of computed wave heights in the nearshore off<br />
Mumbai<br />
Fig.4: Future projections of sea level (after IPCC, 2001)<br />
Fig. 5: Digital Elevation Model (DEM) generated using 0.5 m contour data<br />
covering the <strong>Nellore</strong> test site (Andhra Pradesh)<br />
Fig. 6: Study area coverage for <strong>Nellore</strong> coast shown on georeferenced<br />
Cartosat-1 data (Geomorphological features for A, B and C boxes<br />
are shown in Figs. 9a, 9b and 9c)<br />
Fig. 7a: Geomorphological features along the <strong>Nellore</strong> coast (northern part<br />
of the study area) shown on georeferenced Cartosat-1 data<br />
Fig. 7b: Geomorphological features along the <strong>Nellore</strong> coast (central part of<br />
the study area) shown on georeferenced Cartosat-1 data<br />
Fig. 7c: Geomorphological features along the <strong>Nellore</strong> coast (southern part<br />
of the study area) shown on georeferenced Cartosat-1 data<br />
9
Fig. 8: Shoreline changes for the <strong>Nellore</strong> coast for the period 1991 to 2006.<br />
Fig. 9: Hazard line for <strong>Nellore</strong> coast (northern area) predicted for next 100<br />
years (shown as red line) on Resourcesat-1 LISS-IV FCC image<br />
Fig. 10: Hazard line for <strong>Nellore</strong> coast (southern area) predicted for next 100<br />
years (shown as red line) on Resourcesat-1 LISS-IV FCC image<br />
Fig. 11: Flood line (seen as yellow) of <strong>Nellore</strong> coast for the period 2025<br />
(A), 2050 (B) and 2106 (C) considering Flood heights for 2025,<br />
2050 and 2106 as 3.74 m, 3.86 m and 4.13 m respectively shown<br />
on Resourcesat-1 LlSS-IV + Cartosat-1 PAN merged FCC draped<br />
on DEM prepared using 0.5 m contour data. Present CRZ line is<br />
shown in red colour.<br />
Fig. 12: Inundation scenarios combining IPCC predicted SLR and local<br />
highest high tide level for <strong>Nellore</strong> coast (A) 0.96 m (2025); (B) 1.08<br />
m (2050); (C) 1.35 m (2106). Inundation is shown in blue colour<br />
inland on Resourcesat-1 LlSS-IV + Cartosat-1 PAN merged FCC<br />
draped on DEM prepared using 0.5 m contour data.<br />
Fig. 13: <strong>Vulnerability</strong> line for the year 2106 for the <strong>Nellore</strong> coast mapped by<br />
integrating hazard line and flood line under normal situation.<br />
Fig. 14: <strong>Vulnerability</strong> line of <strong>Nellore</strong> coast for the period 2025 (A), 2050 (B)<br />
and 2106 (C) under normal situation.<br />
10
LIST OF TABLES<br />
Table 1: Location of the study areas<br />
Table 2: SOI maps utilised for the study<br />
Table 3: Satellite data utilised for the study<br />
Table 4: The probable maximum breaker wave heights at the different<br />
locations<br />
Table 5: The Highest High Water Level at different locations<br />
Table 6: Flooding at different locations<br />
Table 7: Shoreline displacement for <strong>Nellore</strong> coast for hazard line<br />
delineation (in meters)<br />
11
1. Background and Introduction<br />
The Ministry of Environment and Forest (MoEF), Govt. of India issued<br />
a notification in February 1991 under the Environment (Protection)<br />
Act, 1986 to regulate activities along the Indian coast. Under this<br />
notification, the coastal regulation zone has been defined as the area<br />
between Low Tide Line (LTL) and High Tide Line (HTL) and area up<br />
to 500 m from the HTL. Coastal stretches of seas, bays, estuaries,<br />
creek, rivers and backwaters, which are influenced by tidal action, are<br />
included in the Coastal Regulation Zone (CRZ). The distance of 500<br />
m has been defined arbitrarily. The CRZ notification led to large<br />
number of representations for exemption from its provisions and<br />
therefore, MoEF had set up an Expert Committee under the<br />
Chairmanship of Prof. M. S. Swaminathan. The Swaminathan<br />
Committee suggested that holistic approach should be developed for<br />
managing the coast in the form of Integrated Coastal Zone<br />
Management (ICZM). The recommendations of the Swaminathan<br />
Committee included: I) integrated coastal zone management; ii)<br />
Ocean part to be included; iii) a participatory approach to<br />
management; iv) safety of people and property; v) a scientific basis<br />
needed for coastal zone planning and landuse and; vi) <strong>Vulnerability</strong><br />
mapping as a possible method (Ministry of Environment and Forests,<br />
2005). Within ICZM framework, the Swaminathan Committee<br />
recommended that the use of vulnerability of coastline should be<br />
considered to fix the setback line, which depends upon the physical<br />
response of coastal environments to water level changes and<br />
changes in the shoreline over a period of time. In order to implement<br />
12
this recommendation, MoEF requested the Space Applications<br />
Centre (ISRO) to develop and implement methodology for the Indian<br />
coast on a pilot scale for demarcating the vulnerability line.<br />
<strong>Vulnerability</strong> of the coast is essentially an assessment of coastal<br />
landform vulnerability to various natural and human induced coastal<br />
hazards including those due to climate change and sea level rise.<br />
<strong>Vulnerability</strong> is the degree of exposure of things, such as coastal<br />
landform features, to the impacts of the hazards. Hazard is a physical<br />
process or event – such as sea level rise or storm surge event. The<br />
term risk refers to the combination of hazard and vulnerability. The<br />
use of vulnerability assessment to assess the risks to valued socioeconomic<br />
or vital ecological habitats assets is a further addition to the<br />
work. Under natural conditions, the morphology of a coastline, be it<br />
estuarine, deltaic or open shore, reflects a responsive and dynamic<br />
equilibrium between the material form of the coast and the<br />
hydrodynamic forcing factors of waves and tidal currents. Coastal<br />
landforms act to attenuate wave and tidal energy and respond to<br />
changing energy conditions at a range of spatial and temporal scales<br />
(Pethick, 1996; Pethick and Crooks 2000). For instance, beach<br />
morphology responds to seasonal wave climate whereas adjacent<br />
dune complex may respond over longer (decadal) timescales to<br />
larger storm events. As water depths increase at the shore, there are<br />
enhanced wave and tidal energy resulting along the coast. In<br />
response, coastal landforms migrate; both normal to (orthogonal with<br />
the coast) and parallel with the shore in order to maintain their<br />
position within the energy gradient. In this way, as coastal energy<br />
13
levels increase, mudflats migrate landwards to a lower energy level<br />
and could be replaced by sand beaches, which have similarly<br />
migrated landwards from exposed situations (Pethick, 1996). Largescale<br />
coastal landforms, such as estuaries, respond to environmental<br />
changes in the same way, as do the smaller-scale landforms. The<br />
difference in spatial scale is reflected in the temporal scale of<br />
adjustment. A nested response means that, given adequate space,<br />
landward migration might not affect the wider shoreline or estuarine<br />
system directly other than by internal translocation of smaller<br />
landforms. The anticipated Sea Level Rise (SLR) due to global<br />
warming (Gormitz, et al., 1982; Hekstra, 1988; Church and Gregory,<br />
2001; IPCC, 2001; Houghton et al., 2001; Lambeck and Chappell,<br />
2001; Hunter et al., 2003), is expected to flood the coastal zones, as<br />
the coastal zones are predominantly low lying flat lands and packed<br />
with river mouths, creeks, estuaries, backwaters, mangrove systems,<br />
deltas, swales, mudflats, saltpans etc. A large number of geological<br />
and geomorphic evidences show that changes in sea level result in<br />
significant physical changes to shorelines - particularly softer sandy<br />
shores – as the coast adjusts to changing water levels. These<br />
physical changes – including shoreline erosion and increased<br />
flooding - may expose coastal buildings, roads and other<br />
infrastructure to damage; hence there is a need to identify coastal<br />
areas vulnerable to such changes in order to be able to effectively<br />
plan coastal developments. Changes in the mean level of the sea<br />
relative to the land, in particular a rise in relative sea level, may result<br />
in the initiation or acceleration of significant geomorphic (landform)<br />
changes in coastal areas. A number of models describing coastal<br />
14
ehaviour have been developed to describe and predict the response<br />
of various types of shorelines to sea level rise (Zhang et al. 2004;<br />
Stive, 2004). A SLR of 0.48 - 1.0 m by 2100 AD has been widely<br />
accepted and is ascribed to combination of thermal expansion of<br />
ocean water and melting of glaciers and ice sheets on land. On the<br />
Indian coast, SLR during last 25 years was of the order of 0.5 to 11.0<br />
mm/year as per records of the Survey of India. It has been estimated<br />
that (assuming no adaptation and no change in existing population) a<br />
1-m rise in sea level could displace nearly 7 million people from their<br />
homes in India. The vulnerability mapping provides indicative<br />
identification of shorelines potentially susceptible to two key coastal<br />
vulnerabilities related to sea level rise and climate change, namely<br />
increased storm surge flooding and the erosion and recession of<br />
sandy shorelines. It provides indicative mapping of a class of<br />
shorelines likely to be at minimal risk of significant physical impacts<br />
over the next century or so. It is the purpose of the indicative coastal<br />
vulnerability mapping to provide an initial or "precautionary" guide for<br />
coastal planning and management responses to sea level rise.<br />
Several case studies have developed methods for vulnerability<br />
mapping (Dutrieux et al., 2000; Harvey et al., 1999a; 1999b; Hammer<br />
Klose et al., 2001; Morton, 2002; Thieler et al., 2001; Pendleton et al.,<br />
2004; Sharples, 2004). Remote sensing and geoinformation<br />
techniques for the Indian coast have proved to be extremely useful to<br />
understand coastal processes and mitigate coastal zone hazards<br />
(Desai et al., 1991; Nayak, 1996; Nayak et al., 1996; Navalgund et<br />
al., 1998; Nayak et al., 2001; Rajawat and Nayak, 2000; 2004; SAC,<br />
2003; Rajawat et al., 2005; 2006). The approach adopted in the<br />
15
present work is as per the project proposal (SAC, 2005) submitted to<br />
MoEF as per suggestions of the advisory group constituted by MoEF.<br />
This approach has been followed for identified test areas as a<br />
demonstrative or feasibility study.<br />
2. Objectives<br />
The major objective is to develop and demonstrate methodology for<br />
delineating coastal vulnerability line/construction setback line on the<br />
basis of vulnerability assessment of the coast as per Swaminathan<br />
Committee’s recommendations for redefining existing Coastal<br />
Regulation Zone boundary.<br />
3. Participating Agencies<br />
i) Space Applications Centre (ISRO), Ahmedabad (Nodal<br />
Agency)<br />
ii) Centre for Earth Science Studies, Thiruvananthapurm<br />
iii) Survey of India, Dehradun<br />
4. Study Area<br />
Six study areas namely Dahej (Gujarat), Navi Mumbai (Maharashtra)<br />
and Mangalore (Karnataka) along west coast and Paradip (Orissa),<br />
<strong>Nellore</strong> (Andhra Pradesh) and Nagapattinam (Tamilnadu) along east<br />
coast of India have been taken up. Locations are shown in Fig. 1 and<br />
Table 1.<br />
16
Fig. 1: Location map of the study areas (modified after Chandramohan et<br />
al., 2001)<br />
The study areas represent diversity of the Indian coast and are selected as<br />
one representing high tidal range (Dahej, Gujarat), highly populated and<br />
developed coast (Navi Mumbai), Open wave dominated coast (Mangalore),<br />
deltaic coasts frequently affected by flooding and cyclones (Paradip),<br />
(<strong>Nellore</strong>) and tsunami affected (Nagapattinam).<br />
17
Table 1: Location of the study areas<br />
Sr. Study Area<br />
No.<br />
1. Dahej<br />
(Gujarat)<br />
2. Navi Mumbai<br />
(Maharastra)<br />
3. Mangalore<br />
(Karnataka)<br />
4. Paradip<br />
(Orissa)<br />
5. <strong>Nellore</strong> (Andhra<br />
Pradesh)<br />
6. Nagapattinam<br />
(Tamil Nadu)<br />
Geographic Location<br />
72 0 30’00”E to 73 0 00’00”E<br />
21 0 30’00”N to21 0 45’00”N<br />
73 0 00’00”E to 73 0 15’00”E<br />
18 0 45’00”N to19 0 15’00”N<br />
74 0 45’00”E to 74 0 52’30”E<br />
12 0 45’00”N to12 0 52’30”N<br />
86 0 30’00”E to 87 0 00’00”E<br />
20 0 30’00”N to20 0 30’00”N<br />
80 0 00’00”E to 80 0 15’00”E<br />
14 0 15’00”N to14 0 45’00”N<br />
79 0 45’00”E to 80 0 00’00”E<br />
10 0 30’00”N to11 0 00’00”N<br />
5. Materials and Methods<br />
A broad approach being followed includes i) Preparing shoreline<br />
change maps using old topographical maps and recent satellite data<br />
(Resourcesat-1/Cartosat-1 data); ii) Delineation of hazard line using<br />
shoreline change data; iii) Analysis of past wave/tidal data for flood<br />
height computations; iv) Generation of DEM from available data sets<br />
(topographical maps with 0.5 m contour interval); v) Utilisation of<br />
inundation models for simulating inundation patterns and delineation<br />
18
of flood line; vi) <strong>Vulnerability</strong>/Setback line delineation using integrated<br />
analysis in GIS.<br />
The major components of the methodology are as follows:<br />
5.1 Delineation of the Hazard Line<br />
High Tide Line (HTL) has been considered as shoreline. Shoreline<br />
change is the horizontal movement of a specific shoreline. Old SOI<br />
topographical maps (Table 2) (Total 25 maps pertaining to the period<br />
1872-1991; 10 maps at 1:25, 000 scale and 15 maps at 1:50, 000<br />
scale) were used to delineate HTL. Shoreline change maps<br />
corresponding to the test sites for the period 1975-80 and 1986-90<br />
prepared earlier at SAC were also utilised to get shoreline of different<br />
periods. Resourcesat-1 LISS-IV and Cartosat-1 PAN data of period<br />
2005-06 (Table 3) were also geo-referenced and interpreted to<br />
delineate shoreline. The horizontal displacement of shoreline has<br />
been measured based on HTL of 2005-06. Shoreline changes were<br />
used to compute an annual rate of displacement. Line topology has<br />
been built for all the shoreline vector files (Arc Info Coverage) and<br />
two attribute fields have been created viz. “YEAR” and “TRANSECT”.<br />
The “YEAR” attribute field for all the shorelines was filled with<br />
corresponding year of survey of topographical map or year of<br />
acquisition of the satellite images. All the shorelines of a particular<br />
study area were then appended and transect have been generated at<br />
50 meter spacing. Transect-wise analyses of the distance between<br />
shorelines of two or more years have been carried out. Finally,<br />
19
transect-wise annual rates have been calculated and future projection<br />
of shoreline (i.e. shoreline position for the year 2025, 2050 and 2106)<br />
from the latest shoreline (2006) has been carried out. The 100-year<br />
displacement line is designated as the Hazard Line.<br />
Table 2: SOI maps utilised for the study<br />
Sr. Study Area<br />
SOI Topographic Maps<br />
No.<br />
Scale 1:<br />
50,000/1:<br />
Year of<br />
Survey<br />
Scale 1:<br />
25,000<br />
Year of<br />
Survey<br />
63, 360<br />
1. Dahej<br />
46 C/10 1871-72 ------ -----<br />
(Gujarat)<br />
46 C/14<br />
1955-56<br />
1947-48<br />
2. Navi Mumbai<br />
(Maharastra)<br />
47 E/4<br />
47 F/1<br />
1924-25<br />
1924-25<br />
1943-44<br />
1924-25<br />
NW<br />
SW<br />
NE<br />
NW<br />
SW<br />
1975-76<br />
1974-75<br />
1990-91<br />
1990-91<br />
1990-91<br />
3. Mangalore<br />
(Karnataka)<br />
48 L/13 1910-12<br />
1944-45<br />
NW<br />
SW<br />
1982-83<br />
1982-83<br />
4. Paradip (Orissa) 73 L/11<br />
& 15<br />
73 L/12<br />
1928-29<br />
1928-29<br />
------<br />
NW&NE<br />
-------<br />
1982-83<br />
5. <strong>Nellore</strong> (Andhra<br />
Pradesh)<br />
66 B/2<br />
66 B/3<br />
1917-18<br />
1916-17<br />
SE<br />
NE<br />
1990-91<br />
1990-91<br />
20
6. Nagapattinam<br />
58 N/13<br />
1929-30<br />
------- -------<br />
(Tamil Nadu)<br />
58 N/14<br />
1929-30<br />
Table 3: Satellite data utilised for the study<br />
Study Area Satellite Sesnsor Path/<br />
Row/<br />
Date<br />
Product<br />
Orbit-<br />
Segm<br />
Scene<br />
Type<br />
ent-<br />
Strip<br />
<strong>Nellore</strong><br />
CARTOSAT-1 PAN 557 328 18/07/2006 Stereo-<br />
Ortho<br />
Kit, CD<br />
Resourcesat-1 LISS-IV 12149<br />
-1-2<br />
091 18/02/2006 LISS-IV<br />
MX, CD<br />
Resourcesat-1 LISS-IV 12149<br />
-1-2<br />
090<br />
shift<br />
60 %<br />
18/02/2006 LISS-IV<br />
MX, CD<br />
Resourcesat-1 LISS-IV 12149<br />
-1-2<br />
092 18/02/2006 LISS-IV<br />
MX, CD<br />
Nagapattinam<br />
CARTOSAT-1 PAN 559 344 20/02/2006 Stereo-<br />
Ortho<br />
Kit, CD<br />
CARTOSAT-1 PAN 559 345 20/02/2006 Stereo-<br />
Ortho<br />
Kit, CD<br />
21
Resourcesat-1 LISS-IV 14337<br />
-1-1<br />
147,<br />
shift<br />
40 %<br />
22/07/2006 LISS-IV<br />
MX, CD<br />
Paradip CARTOSAT-1 PAN 583 303 08/02/2006 Stereo-<br />
Ortho<br />
Kit, CD<br />
CARTOSAT-1 PAN 584 303 28/01/2006 Stereo-<br />
Ortho<br />
Kit, CD<br />
CARTOSAT-1 PAN 584 302 28/01/2006 Stereo-<br />
Ortho<br />
Kit, CD<br />
Resourcesat-1 LISS-IV 7801-<br />
1-2<br />
70 18/04/2005 LISS-IV<br />
MX, CD<br />
Mangalore<br />
CARTOSAT-1 PAN 531 336 17/04/2006 Stereo-<br />
Ortho<br />
Kit, CD<br />
Resourcesat-1 LISS-IV 11524<br />
-1-2<br />
120<br />
shift<br />
20 %<br />
05/01/2006 LISS-IV<br />
MX, CD<br />
Navi Mumbai<br />
CARTOSAT-1 PAN 514 309 11/02/2006 Stereo-<br />
Ortho<br />
Kit, CD<br />
CARTOSAT-1 PAN 514 308 11/02/2006 Stereo-<br />
Ortho<br />
Kit, CD<br />
Resourcesat-1 LISS-IV 6466-<br />
1-3<br />
24<br />
shift<br />
30 %<br />
14/01/2005 LISS-IV<br />
MX, CD<br />
22
Dahej<br />
Resourcesat-1 LISS-IV 6466-<br />
1-3<br />
25<br />
shift<br />
20 %<br />
14/01/2005 LISS-IV<br />
MX, CD<br />
CARTOSAT-1 PAN 509 297 07/04/2006 Stereo-<br />
Ortho<br />
Kit, CD<br />
CARTOSAT-1 PAN 510 297 27/03/2006 Stereo-<br />
Ortho<br />
Kit, CD<br />
Resourcesat-1 LISS-IV 7148-<br />
2-2<br />
79<br />
shift<br />
70 %<br />
03/03/2005 LISS-IV<br />
MX, CD<br />
5.2 Delineation of the Flood Line<br />
This component requires analysis of historic data on waves and tides<br />
to determine the maximum elevation using past trend of the data sets<br />
along with rate of sea level rise and prediction for next 100 years.<br />
Wave run up elevation for maximum near shore breaker wave height<br />
(computed using beach profiles), highest high tide level and IPCC<br />
projected SLR are computed for different periods (2025, 2050,<br />
2106). The flood height is then superimposed on digital elevation<br />
model for delineating flood line for different scenarios.<br />
Predicted tidal data are used to get maximum elevation due to<br />
highest of high tide. NIOT data buoy and available wave atlases<br />
provide deep-water wave heights. Wave heights near the shore (10 m<br />
depth) are generated using available bathymetry data and wave<br />
23
transformation models. The IPCC predicted rate of 0.48 cm per year<br />
rise for next 100 years (IPCC, 2001) has been utilised along with<br />
corresponding high tide levels and wave run up elevations. The<br />
combined height is projected on the elevation map to delineate flood<br />
line.<br />
Waves<br />
Apart from the data available at CESS, the recorded data on highest<br />
wave height is collected from NIO, Goa and NIOT, Chennai for the six<br />
study areas. The waves are recorded at different depths ranging from<br />
2300 m to 15 m. The highest wave reported at each location is taken<br />
and transformed to the breaking zone using the MIKE-21 Nearshore<br />
Spectral Waves (NSW) model. This model is a wind-wave model,<br />
which describes the growth, decay and transformation of windgenerated<br />
waves and swells in nearshore areas. The model takes<br />
into account the effects of refraction and shoaling due to varying<br />
depth, local wind generation and energy dissipation due to bottom<br />
friction and wave breaking. The model also takes into account the<br />
effect of wave-current interaction, if present. The bathymetry data are<br />
essential to compute the breaker wave heights using the MIKE-21<br />
model. The hydrographic charts, with maximum resolution, available<br />
in C-MAP for the locations, with an alongshore range of ± 0.750<br />
latitude, are selected for computation of bathymetric grids and in turn<br />
for the wave transformations. Since the bathymetry is not very fine,<br />
the wave heights computed around 10 m water depth are taken as<br />
the breaker wave height. The probable maximum wave heights<br />
24
around 10 m depth as obtained by computation are presented in<br />
Table 4.<br />
Table 4: The probable maximum breaker wave heights at different<br />
locations<br />
Location<br />
Height of Highest Wave<br />
(m)<br />
Dahej 3.7<br />
Mumbai 3.8<br />
Mangalore 4.0<br />
Nagapattinam 3.8<br />
<strong>Nellore</strong> 4.8<br />
Paradip 5.3<br />
Typical examples of the computed wave heights off Mangalore and<br />
Mumbai are depicted in Figs. 2 and 3.<br />
25
Fig. 2: Typical examples of computed wave heights in the nearshore off<br />
Mangalore<br />
26
Fig. 3: Typical examples of computed wave heights in the nearshore off<br />
Mumbai<br />
Wave Run Up Elevation<br />
Beach profiles for the <strong>Nellore</strong> coast were studied and an average<br />
foreshore slope of 0.04 was obtained. Wave run up for the maximum<br />
breaker wave height of 4.8 m was computed. The wave run up<br />
elevation comes to be 2.78 m for the <strong>Nellore</strong> coast.<br />
Tide<br />
The tide data used for calculations are taken from the Indian Tide<br />
Tables from 1979 to 2006. The highest tidal height was noted from<br />
the daily heights given in the tide table. These data are reduced to<br />
Mean Sea Level (MSL) from the datum levels provided in the tables.<br />
The Highest High Water heights with respect to MSL are given in<br />
Table 5.<br />
27
Table 5: The Highest High Water Level at different locations<br />
Location<br />
Highest high water level<br />
(m)<br />
Dahej 5.61<br />
Mumbai 2.65<br />
Mangalore 0.96<br />
Nagapattinam 0.71<br />
<strong>Nellore</strong> 0.84<br />
Paradip 1.41<br />
Sea Level<br />
The past sea level changes and its future projections for a century<br />
are noted from the website of Intergovernmental Panel on Climate<br />
Change (IPCC). The sea level change in the past 100 years for the<br />
Indian coasts have shown only 10-20 cm sea level rise<br />
(Unnikrishnan, et. al., 2006). IPCC (IPCC, 2001) has given<br />
projections for the period up to 2100 (Fig. 4). It is observed that, on<br />
an average 48 cm of sea level rise can be expected on a global level<br />
by the year 2100. Since Indian coasts fall in the average/below<br />
average category (of the global) maximum sea level rise that can be<br />
expected along our coasts shall be well within the 48 cm rise in 100<br />
years. So this value is considered for computation of flooding.<br />
28
Fig. 4: Future projections of sea level (after IPCC, 2001)<br />
Flooding Level<br />
The flooding elevation has been obtained by considering the wave<br />
run up elevation for maximum breaker wave height, highest high tide<br />
elevation and elevation due to SLR. With the above data sets,<br />
possible flooding height for the year 2106 is calculated. The accuracy<br />
of the computation is subject to the limitations arising from data<br />
availability for different parameters. This height is projected on the<br />
elevation map to delineate flood line. Table 6 gives the projected<br />
flooding levels at six locations for the next 100 years. However, we<br />
have also considered different scenarios due to flooding for the year<br />
2025, 2050 along with that for the year 2106.<br />
29
Table 6: Flooding at different locations<br />
Location<br />
Flooding (m)<br />
Dahej 8.57<br />
Mumbai -<br />
Mangalore -<br />
Nagapattinam -<br />
<strong>Nellore</strong> 4.13<br />
Paradip 5.43<br />
Generation of Digital Elevation Model (DEM)<br />
A contour map having 0.5-1 m contour (up to 5 m) interval is required<br />
for the coastal area (Area up to 20 m contour). The Survey of India<br />
provided this data for <strong>Nellore</strong>, Paradip and Dahej test sites. Fig. 5<br />
shows the DEM generated for the <strong>Nellore</strong> test site.<br />
Flood inundation scenarios<br />
Resourcesat-1 LISS-IV and Cartosat-1 merged images have been<br />
draped over the DEM and flood modeling has been done for different<br />
scenarios of flooding levels using Water Layer sub-module of ERDAS<br />
Imagine 9.0 Virtual GIS module. An animation has been made<br />
showing the flood inundation pattern in the <strong>Nellore</strong> area with rise in<br />
sea level using DEM generated from 0.5 m contour data.<br />
30
Fig. 5: Digital Elevation Model (DEM) generated using 0.5 m<br />
contour data covering the <strong>Nellore</strong> test site (Andhra Pradesh)<br />
31
5.3 Delineation of the <strong>Vulnerability</strong> Line<br />
<strong>Vulnerability</strong> line has been delineated by integrating hazard line and<br />
flood line by considering landward extent of flood line or hazard line<br />
(whichever is maximum towards land).<br />
6. Results and discussions<br />
6.1 Salient characteristics and landforms<br />
<strong>Nellore</strong> coast stretching for around 29.80 km in length and 7.80 km<br />
maximum width (from the mouth of the Penneru river) comprises the<br />
study area extending from south of Ramatirtham covering<br />
Utukurupattampupalem in north to Kotta Koderu in south (Fig. 6).<br />
Penneru river forms its delta in the northern part of the study area.<br />
Villages such as Utukuru and Kuditipalem fall along the northern and<br />
southern banks of the Penneru river. The entire region is low-lying<br />
coastal tract with a maximum elevation of 6 m. Tropical cyclones<br />
frequently affect this coastal tract. A number of cyclone shelters are<br />
present in this area such as those at Kancharapalem, Ramudupalem,<br />
Pattapupalem, Utukurupattapupalem, Venkattareddipalem,<br />
Krishnapuram, Venkannapalem, Patapattapupalem,<br />
Venkateshwarapalem, Mutyalatapupattapupalem, Pamudiruvu<br />
Khandrika, Bata and Kattapattapupalem etc. Buckingham canal<br />
traverses through the entire coastal tract parallel to the shore. The<br />
major landforms observed in the study area have developed due to<br />
fluvio-deltaic and marine processes (Figs. 7a, 7b and 7c). The entire<br />
32
coastal segment is linear with a bulge near the mouth of the Penneru<br />
river. The coast consists of soft sandy material highly vulnerable to<br />
erosion. Coast comprises of narrow sandy beaches backed by sand<br />
dunes and rolling plain at places. The southern part of the study area<br />
do not show sand dunes and forms discontinuous segment of dune<br />
ridges. Casuarinas plantation at some locations along such segments<br />
has been done to protect the storm fury. The Penneru river forms its<br />
delta in the northern part of the study area and the associated<br />
landforms observed are flood plain, channel bars, islands, deltaic<br />
plain, palaeochannels, mudflats with mangroves and barrier bars<br />
near the mouth of the Penneru river. The area near the northern part<br />
of Penneru river mouth shows severe erosion (Figs. 8 & 9). Spit<br />
observed on the southern bank of the Penneru river during 1991 has<br />
been completely eroded along with some other islands near the<br />
mouth of the Penneru river (Fig. 9). The area north of Penneru river<br />
shows mudflats and a wide strip comprising of rolling plain. The other<br />
parts of the study area comprises predominantly of low coastal plain.<br />
At many places casuarina/coconut plantation are observed. Absence<br />
of landforms formed due to longshore transport, which indicates wave<br />
action to be dominating in this region, and the entire coastal segment<br />
is vulnerable to erosion as observed by shoreline changes mapped<br />
for the period 1991 to 2006 (Figs. 8, 9 and 10) with negligible<br />
accretion at few locations.<br />
33
A<br />
B<br />
C<br />
Fig. 6: Study area coverage for <strong>Nellore</strong> coast shown on georeferenced<br />
Cartosat-1 data (Geomorphological features for A, B and C<br />
boxes are shown in Figs. 9a, 9b and 9c).<br />
34
Barrier<br />
bar<br />
Coastal<br />
plain Fig. 7a: Geomorphological features along the <strong>Nellore</strong> coast (northern<br />
part of the study area) shown on<br />
data<br />
georeferenced Cartosat-1<br />
35
Fig. 7b: Geomorphological features along the <strong>Nellore</strong> coast (central<br />
part of the study area) shown on georeferenced Cartosat-1<br />
data<br />
36
Fig.7c: Geomorphological features along the <strong>Nellore</strong> coast (southern part of<br />
6.2 Hazard<br />
the study<br />
line<br />
area) shown on georeferenced Cartosat-1 data<br />
37
Shoreline covering the <strong>Nellore</strong> coast is compared for the period 1991<br />
– 2006 at 1:25, 000 scale. Shoreline has been interpreted from the<br />
topographical maps 66 B/2 SE and 66 B/3 NE for the year 1991.<br />
Corresponding Resourcesat-1 LISS-IV data of February 18, 2006 has<br />
been interpreted for delineating shoreline. Transects at 50 m spacing<br />
have been generated (total 538 transects) and transect-wise<br />
analyses of the displacement of shorelines for the period between<br />
1991 and 2006 have been carried out. Result of the shoreline change<br />
for this period is shown graphically in Fig. 8. Transect-wise annual<br />
rates of shoreline change have been calculated and future projections<br />
of shoreline (i.e. shoreline position for 2025, 2050, 2100 and 2106<br />
years) are shown in Table 7. Transects 59-107 covers the Penneru<br />
river mouth and are not considered for the shoreline change<br />
calculation. The displacement of shoreline as projected for next 100<br />
years has been plotted and demarcated as hazard line (Figs. 9 and<br />
10).<br />
Table 7: Shoreline displacement for <strong>Nellore</strong> coast for hazard line<br />
delineation (in meters)<br />
Transect<br />
Nos.<br />
Shoreline<br />
changes<br />
during the<br />
period<br />
1991-2006<br />
Annual<br />
Rate of<br />
Shore<br />
line<br />
changes<br />
Shoreline<br />
changes<br />
after<br />
19 years<br />
(2025)<br />
Shoreline<br />
changes<br />
after<br />
44 years<br />
(2050)<br />
Shoreline<br />
changes<br />
after<br />
94 years<br />
(2100)<br />
Shoreline<br />
changes<br />
after<br />
100 years<br />
(2106)<br />
1 0.00 0.00 0.00 0.00 0.00 0.00<br />
2 -59.41 -3.96 -75.25 -174.26 -372.28 -396.04<br />
3 -43.50 -2.90 -55.10 -127.60 -272.60 -290.00<br />
4 -36.25 -2.42 -45.92 -106.33 -227.17 -241.67<br />
5 -32.97 -2.20 -41.76 -96.71 -206.60 -219.79<br />
6 -31.03 -2.07 -39.31 -91.03 -194.46 -206.88<br />
7 -32.56 -2.17 -41.25 -95.52 -204.06 -217.08<br />
38
8 -32.13 -2.14 -40.69 -94.23 -201.32 -214.17<br />
9 -27.53 -1.84 -34.87 -80.76 -172.53 -183.54<br />
10 -25.16 -1.68 -31.86 -73.79 -157.65 -167.71<br />
11 -35.44 -2.36 -44.89 -103.95 -222.08 -236.25<br />
12 -32.75 -2.18 -41.48 -96.07 -205.23 -218.33<br />
13 -38.22 -2.55 -48.41 -112.11 -239.50 -254.79<br />
14 -45.53 -3.04 -57.67 -133.56 -285.33 -303.54<br />
15 -37.97 -2.53 -48.09 -111.38 -237.94 -253.13<br />
16 -42.25 -2.82 -53.52 -123.93 -264.77 -281.67<br />
17 -42.03 -2.80 -53.24 -123.29 -263.40 -280.21<br />
18 -33.41 -2.23 -42.31 -97.99 -209.35 -222.71<br />
19 -32.44 -2.16 -41.09 -95.15 -203.28 -216.25<br />
20 -31.34 -2.09 -39.70 -91.94 -196.42 -208.96<br />
21 -27.91 -1.86 -35.35 -81.86 -174.88 -186.04<br />
22 -18.94 -1.26 -23.99 -55.55 -118.68 -126.25<br />
23 -10.19 -0.68 -12.90 -29.88 -63.84 -67.92<br />
24 -4.72 -0.31 -5.98 -13.84 -29.57 -31.46<br />
25 -4.19 -0.28 -5.30 -12.28 -26.24 -27.92<br />
26 -5.66 -0.38 -7.16 -16.59 -35.45 -37.71<br />
27 -12.19 -0.81 -15.44 -35.75 -76.38 -81.25<br />
28 -18.53 -1.24 -23.47 -54.36 -116.13 -123.54<br />
29 -21.50 -1.43 -27.23 -63.07 -134.73 -143.33<br />
30 -24.13 -1.61 -30.56 -70.77 -151.18 -160.83<br />
31 -27.72 -1.85 -35.11 -81.31 -173.70 -184.79<br />
32 -32.41 -2.16 -41.05 -95.06 -203.08 -216.04<br />
33 -49.56 -3.30 -62.78 -145.38 -310.59 -330.42<br />
34 -60.81 -4.05 -77.03 -178.38 -381.09 -405.42<br />
35 -76.88 -5.13 -97.38 -225.50 -481.75 -512.50<br />
36 -101.16 -6.74 -128.13 -296.73 -633.91 -674.38<br />
37 -532.41 -35.49 -674.38 -1561.73 -3336.41 -3549.38<br />
38 -597.28 -39.82 -756.56 -1752.03 -3742.96 -3981.88<br />
39 -608.59 -40.57 -770.89 -1785.21 -3813.85 -4057.29<br />
40 -621.72 -41.45 -787.51 -1823.71 -3896.10 -4144.79<br />
41 -628.13 -41.88 -795.63 -1842.50 -3936.25 -4187.50<br />
42 -631.28 -42.09 -799.62 -1851.76 -3956.03 -4208.54<br />
43 -643.44 -42.90 -815.02 -1887.42 -4032.21 -4289.58<br />
44 -655.47 -43.70 -830.26 -1922.71 -4107.60 -4369.79<br />
45 -658.19 -43.88 -833.70 -1930.68 -4124.64 -4387.92<br />
46 -666.84 -44.46 -844.67 -1956.08 -4178.89 -4445.63<br />
47 -676.66 -45.11 -857.10 -1984.86 -4240.38 -4511.04<br />
48 -675.94 -45.06 -856.19 -1982.75 -4235.88 -4506.25<br />
49 -664.34 -44.29 -841.50 -1948.74 -4163.22 -4428.96<br />
50 -630.88 -42.06 -799.11 -1850.57 -3953.48 -4205.83<br />
51 -587.66 -39.18 -744.36 -1723.79 -3682.65 -3917.71<br />
52 -380.28 -25.35 -481.69 -1115.49 -2383.10 -2535.21<br />
53 -319.50 -21.30 -404.70 -937.20 -2002.20 -2130.00<br />
39
54 -331.50 -22.10 -419.90 -972.40 -2077.40 -2210.00<br />
55 -327.88 -21.86 -415.31 -961.77 -2054.68 -2185.83<br />
56 -315.75 -21.05 -399.95 -926.20 -1978.70 -2105.00<br />
57 -284.75 -18.98 -360.68 -835.27 -1784.43 -1898.33<br />
58 -91.53 -6.10 -115.94 -268.49 -573.60 -610.21<br />
Transects 59 – 107 cover Penneru river mouth and are not included<br />
108 -2.72 -0.18 -3.44 -7.98 -17.04 -18.13<br />
109 41.97 2.80 53.16 123.11 263.00 279.79<br />
110 82.69 5.51 104.74 242.55 518.18 551.25<br />
111 80.69 5.38 102.20 236.68 505.64 537.92<br />
112 53.25 3.55 67.45 156.20 333.70 355.00<br />
113 25.25 1.68 31.98 74.07 158.23 168.33<br />
114 0.97 0.06 1.23 2.84 6.07 6.46<br />
115 -10.50 -0.70 -13.30 -30.80 -65.80 -70.00<br />
116 -21.91 -1.46 -27.75 -64.26 -137.28 -146.04<br />
117 -33.31 -2.22 -42.20 -97.72 -208.76 -222.08<br />
118 -42.69 -2.85 -54.07 -125.22 -267.51 -284.58<br />
119 -51.56 -3.44 -65.31 -151.25 -323.13 -343.75<br />
120 -57.19 -3.81 -72.44 -167.75 -358.38 -381.25<br />
121 -59.03 -3.94 -74.77 -173.16 -369.93 -393.54<br />
122 -54.19 -3.61 -68.64 -158.95 -339.58 -361.25<br />
123 -52.03 -3.47 -65.91 -152.63 -326.06 -346.88<br />
124 -50.81 -3.39 -64.36 -149.05 -318.43 -338.75<br />
125 -51.66 -3.44 -65.43 -151.53 -323.71 -344.38<br />
126 -47.09 -3.14 -59.65 -138.14 -295.12 -313.96<br />
127 -47.44 -3.16 -60.09 -139.15 -297.28 -316.25<br />
128 -46.53 -3.10 -58.94 -136.49 -291.60 -310.21<br />
129 -49.00 -3.27 -62.07 -143.73 -307.07 -326.67<br />
130 -58.06 -3.87 -73.55 -170.32 -363.86 -387.08<br />
131 -64.25 -4.28 -81.38 -188.47 -402.63 -428.33<br />
132 -67.97 -4.53 -86.09 -199.38 -425.94 -453.13<br />
133 -70.84 -4.72 -89.74 -207.81 -443.95 -472.29<br />
134 -73.38 -4.89 -92.94 -215.23 -459.82 -489.17<br />
135 -75.59 -5.04 -95.75 -221.74 -473.72 -503.96<br />
136 -77.91 -5.19 -98.68 -228.53 -488.21 -519.38<br />
137 -77.50 -5.17 -98.17 -227.33 -485.67 -516.67<br />
138 -75.09 -5.01 -95.12 -220.28 -470.59 -500.63<br />
139 -70.84 -4.72 -89.74 -207.81 -443.95 -472.29<br />
140 -66.84 -4.46 -84.67 -196.08 -418.89 -445.63<br />
141 -62.88 -4.19 -79.64 -184.43 -394.02 -419.17<br />
142 -53.56 -3.57 -67.85 -157.12 -335.66 -357.08<br />
143 -46.00 -3.07 -58.27 -134.93 -288.27 -306.67<br />
144 -42.31 -2.82 -53.60 -124.12 -265.16 -282.08<br />
145 -41.91 -2.79 -53.08 -122.93 -262.61 -279.38<br />
146 -41.38 -2.76 -52.41 -121.37 -259.28 -275.83<br />
147 -42.63 -2.84 -53.99 -125.03 -267.12 -284.17<br />
40
148 -51.47 -3.43 -65.19 -150.98 -322.54 -343.13<br />
149 -52.41 -3.49 -66.38 -153.73 -328.41 -349.38<br />
150 -55.13 -3.68 -69.83 -161.70 -345.45 -367.50<br />
151 -60.13 -4.01 -76.16 -176.37 -376.78 -400.83<br />
152 -65.25 -4.35 -82.65 -191.40 -408.90 -435.00<br />
153 -68.31 -4.55 -86.53 -200.38 -428.09 -455.42<br />
154 -73.44 -4.90 -93.02 -215.42 -460.21 -489.58<br />
155 -78.41 -5.23 -99.31 -229.99 -491.35 -522.71<br />
156 -81.56 -5.44 -103.31 -239.25 -511.13 -543.75<br />
157 -78.50 -5.23 -99.43 -230.27 -491.93 -523.33<br />
158 -82.72 -5.51 -104.78 -242.64 -518.37 -551.46<br />
159 -87.44 -5.83 -110.75 -256.48 -547.94 -582.92<br />
160 -87.63 -5.84 -110.99 -257.03 -549.12 -584.17<br />
161 -88.19 -5.88 -111.70 -258.68 -552.64 -587.92<br />
162 -82.41 -5.49 -104.38 -241.73 -516.41 -549.38<br />
163 -77.94 -5.20 -98.72 -228.62 -488.41 -519.58<br />
164 -74.56 -4.97 -94.45 -218.72 -467.26 -497.08<br />
165 -72.13 -4.81 -91.36 -211.57 -451.98 -480.83<br />
166 -68.88 -4.59 -87.24 -202.03 -431.62 -459.17<br />
167 -66.19 -4.41 -83.84 -194.15 -414.78 -441.25<br />
168 -67.91 -4.53 -86.01 -199.19 -425.55 -452.71<br />
169 -67.81 -4.52 -85.90 -198.92 -424.96 -452.08<br />
170 -67.38 -4.49 -85.34 -197.63 -422.22 -449.17<br />
171 -69.78 -4.65 -88.39 -204.69 -437.30 -465.21<br />
172 -69.84 -4.66 -88.47 -204.88 -437.69 -465.63<br />
173 -72.47 -4.83 -91.79 -212.58 -454.14 -483.13<br />
174 -74.91 -4.99 -94.88 -219.73 -469.41 -499.38<br />
175 -68.81 -4.59 -87.16 -201.85 -431.23 -458.75<br />
176 -62.06 -4.14 -78.61 -182.05 -388.93 -413.75<br />
177 -63.38 -4.23 -80.28 -185.90 -397.15 -422.50<br />
178 -72.22 -4.81 -91.48 -211.84 -452.57 -481.46<br />
179 -70.50 -4.70 -89.30 -206.80 -441.80 -470.00<br />
180 -72.56 -4.84 -91.91 -212.85 -454.73 -483.75<br />
181 -82.78 -5.52 -104.86 -242.83 -518.76 -551.88<br />
182 -94.47 -6.30 -119.66 -277.11 -592.00 -629.79<br />
183 -93.00 -6.20 -117.80 -272.80 -582.80 -620.00<br />
184 -91.38 -6.09 -115.74 -268.03 -572.62 -609.17<br />
185 -90.91 -6.06 -115.15 -266.66 -569.68 -606.04<br />
186 -91.25 -6.08 -115.58 -267.67 -571.83 -608.33<br />
187 -94.94 -6.33 -120.25 -278.48 -594.94 -632.92<br />
188 -89.19 -5.95 -112.97 -261.62 -558.91 -594.58<br />
189 -82.72 -5.51 -104.78 -242.64 -518.37 -551.46<br />
190 -83.22 -5.55 -105.41 -244.11 -521.50 -554.79<br />
191 -83.81 -5.59 -106.16 -245.85 -525.23 -558.75<br />
192 -84.00 -5.60 -106.40 -246.40 -526.40 -560.00<br />
193 -83.97 -5.60 -106.36 -246.31 -526.20 -559.79<br />
41
194 -87.84 -5.86 -111.27 -257.68 -550.49 -585.63<br />
195 -89.47 -5.96 -113.33 -262.44 -560.67 -596.46<br />
196 -89.75 -5.98 -113.68 -263.27 -562.43 -598.33<br />
197 -87.44 -5.83 -110.75 -256.48 -547.94 -582.92<br />
198 -79.91 -5.33 -101.21 -234.39 -500.75 -532.71<br />
199 -72.50 -4.83 -91.83 -212.67 -454.33 -483.33<br />
200 -65.31 -4.35 -82.73 -191.58 -409.29 -435.42<br />
201 -64.06 -4.27 -81.15 -187.92 -401.46 -427.08<br />
202 -66.38 -4.43 -84.08 -194.70 -415.95 -442.50<br />
203 -68.81 -4.59 -87.16 -201.85 -431.23 -458.75<br />
204 -7.84 -0.52 -9.94 -23.01 -49.15 -52.29<br />
205 -52.63 -3.51 -66.66 -154.37 -329.78 -350.83<br />
206 -74.69 -4.98 -94.60 -219.08 -468.04 -497.92<br />
207 -85.53 -5.70 -108.34 -250.89 -536.00 -570.21<br />
208 -123.94 -8.26 -156.99 -363.55 -776.68 -826.25<br />
209 -71.22 -4.75 -90.21 -208.91 -446.30 -474.79<br />
210 -63.56 -4.24 -80.51 -186.45 -398.33 -423.75<br />
211 -58.69 -3.91 -74.34 -172.15 -367.78 -391.25<br />
212 -61.91 -4.13 -78.41 -181.59 -387.95 -412.71<br />
213 -66.28 -4.42 -83.96 -194.43 -415.36 -441.88<br />
214 -64.69 -4.31 -81.94 -189.75 -405.38 -431.25<br />
215 -62.50 -4.17 -79.17 -183.33 -391.67 -416.67<br />
216 -63.34 -4.22 -80.24 -185.81 -396.95 -422.29<br />
217 -21.91 -1.46 -27.75 -64.26 -137.28 -146.04<br />
218 -29.28 -1.95 -37.09 -85.89 -183.50 -195.21<br />
219 -30.88 -2.06 -39.11 -90.57 -193.48 -205.83<br />
220 -33.53 -2.24 -42.47 -98.36 -210.13 -223.54<br />
221 -40.44 -2.70 -51.22 -118.62 -253.41 -269.58<br />
222 -47.38 -3.16 -60.01 -138.97 -296.88 -315.83<br />
223 -53.63 -3.58 -67.93 -157.30 -336.05 -357.50<br />
224 -49.72 -3.31 -62.98 -145.84 -311.57 -331.46<br />
225 -46.44 -3.10 -58.82 -136.22 -291.01 -309.58<br />
226 -37.19 -2.48 -47.10 -109.08 -233.04 -247.92<br />
227 -40.16 -2.68 -50.86 -117.79 -251.65 -267.71<br />
228 -44.56 -2.97 -56.45 -130.72 -279.26 -297.08<br />
229 -47.22 -3.15 -59.81 -138.51 -295.90 -314.79<br />
230 -44.81 -2.99 -56.76 -131.45 -280.83 -298.75<br />
231 -45.47 -3.03 -57.59 -133.38 -284.94 -303.13<br />
232 -47.22 -3.15 -59.81 -138.51 -295.90 -314.79<br />
233 -44.81 -2.99 -56.76 -131.45 -280.83 -298.75<br />
234 -24.44 -1.63 -30.95 -71.68 -153.14 -162.92<br />
235 -20.38 -1.36 -25.81 -59.77 -127.68 -135.83<br />
236 -35.50 -2.37 -44.97 -104.13 -222.47 -236.67<br />
237 -35.03 -2.34 -44.37 -102.76 -219.53 -233.54<br />
238 -41.16 -2.74 -52.13 -120.73 -257.91 -274.38<br />
239 -46.50 -3.10 -58.90 -136.40 -291.40 -310.00<br />
42
240 -48.41 -3.23 -61.31 -141.99 -303.35 -322.71<br />
241 -41.47 -2.76 -52.53 -121.64 -259.87 -276.46<br />
242 -37.81 -2.52 -47.90 -110.92 -236.96 -252.08<br />
243 -39.47 -2.63 -49.99 -115.78 -247.34 -263.13<br />
244 -43.38 -2.89 -54.94 -127.23 -271.82 -289.17<br />
245 -43.91 -2.93 -55.61 -128.79 -275.15 -292.71<br />
246 -41.34 -2.76 -52.37 -121.28 -259.09 -275.63<br />
247 -38.91 -2.59 -49.28 -114.13 -243.81 -259.38<br />
248 -39.19 -2.61 -49.64 -114.95 -245.58 -261.25<br />
249 -42.88 -2.86 -54.31 -125.77 -268.68 -285.83<br />
250 -45.88 -3.06 -58.11 -134.57 -287.48 -305.83<br />
251 -44.47 -2.96 -56.33 -130.44 -278.67 -296.46<br />
252 -44.19 -2.95 -55.97 -129.62 -276.91 -294.58<br />
253 -44.69 -2.98 -56.60 -131.08 -280.04 -297.92<br />
254 -47.97 -3.20 -60.76 -140.71 -300.60 -319.79<br />
255 -53.00 -3.53 -67.13 -155.47 -332.13 -353.33<br />
256 -57.25 -3.82 -72.52 -167.93 -358.77 -381.67<br />
257 -61.53 -4.10 -77.94 -180.49 -385.60 -410.21<br />
258 -64.19 -4.28 -81.30 -188.28 -402.24 -427.92<br />
259 -61.44 -4.10 -77.82 -180.22 -385.01 -409.58<br />
260 -57.81 -3.85 -73.23 -169.58 -362.29 -385.42<br />
261 -55.75 -3.72 -70.62 -163.53 -349.37 -371.67<br />
262 -55.47 -3.70 -70.26 -162.71 -347.61 -369.79<br />
263 -56.16 -3.74 -71.13 -164.73 -351.91 -374.38<br />
264 -55.66 -3.71 -70.50 -163.26 -348.78 -371.04<br />
265 -56.00 -3.73 -70.93 -164.27 -350.93 -373.33<br />
266 -54.56 -3.64 -69.11 -160.05 -341.93 -363.75<br />
267 -55.19 -3.68 -69.90 -161.88 -345.84 -367.92<br />
268 -57.59 -3.84 -72.95 -168.94 -360.92 -383.96<br />
269 -60.88 -4.06 -77.11 -178.57 -381.48 -405.83<br />
270 -61.59 -4.11 -78.02 -180.68 -385.99 -410.63<br />
271 -58.91 -3.93 -74.61 -172.79 -369.15 -392.71<br />
272 -56.34 -3.76 -71.37 -165.28 -353.09 -375.63<br />
273 -54.84 -3.66 -69.47 -160.88 -343.69 -365.63<br />
274 -52.78 -3.52 -66.86 -154.83 -330.76 -351.88<br />
275 -49.91 -3.33 -63.21 -146.39 -312.75 -332.71<br />
276 -44.59 -2.97 -56.49 -130.81 -279.45 -297.29<br />
277 -39.53 -2.64 -50.07 -115.96 -247.73 -263.54<br />
278 -28.38 -1.89 -35.94 -83.23 -177.82 -189.17<br />
279 -27.22 -1.81 -34.48 -79.84 -170.57 -181.46<br />
280 -26.47 -1.76 -33.53 -77.64 -165.87 -176.46<br />
281 -28.41 -1.89 -35.98 -83.33 -178.01 -189.38<br />
282 -28.78 -1.92 -36.46 -84.43 -180.36 -191.88<br />
283 -24.16 -1.61 -30.60 -70.86 -151.38 -161.04<br />
284 -19.72 -1.31 -24.98 -57.84 -123.57 -131.46<br />
285 -16.84 -1.12 -21.34 -49.41 -105.55 -112.29<br />
43
286 -15.81 -1.05 -20.03 -46.38 -99.09 -105.42<br />
287 -16.59 -1.11 -21.02 -48.68 -103.99 -110.63<br />
288 -12.03 -0.80 -15.24 -35.29 -75.40 -80.21<br />
289 -3.03 -0.20 -3.84 -8.89 -19.00 -20.21<br />
290 128.78 8.59 163.12 377.76 807.03 858.54<br />
291 45.97 3.06 58.23 134.84 288.07 306.46<br />
292 -11.13 -0.74 -14.09 -32.63 -69.72 -74.17<br />
293 -21.91 -1.46 -27.75 -64.26 -137.28 -146.04<br />
294 -22.66 -1.51 -28.70 -66.46 -141.98 -151.04<br />
295 -25.13 -1.68 -31.83 -73.70 -157.45 -167.50<br />
296 -23.75 -1.58 -30.08 -69.67 -148.83 -158.33<br />
297 -27.75 -1.85 -35.15 -81.40 -173.90 -185.00<br />
298 -29.47 -1.96 -37.33 -86.44 -184.67 -196.46<br />
299 -25.34 -1.69 -32.10 -74.34 -158.82 -168.96<br />
300 -22.03 -1.47 -27.91 -64.63 -138.06 -146.88<br />
301 -17.84 -1.19 -22.60 -52.34 -111.82 -118.96<br />
302 -20.59 -1.37 -26.09 -60.41 -129.05 -137.29<br />
303 -18.50 -1.23 -23.43 -54.27 -115.93 -123.33<br />
304 -11.16 -0.74 -14.13 -32.73 -69.91 -74.38<br />
305 -2.03 -0.14 -2.57 -5.96 -12.73 -13.54<br />
306 -3.72 -0.25 -4.71 -10.91 -23.30 -24.79<br />
307 -10.38 -0.69 -13.14 -30.43 -65.02 -69.17<br />
308 -14.69 -0.98 -18.60 -43.08 -92.04 -97.92<br />
309 -23.16 -1.54 -29.33 -67.93 -145.11 -154.38<br />
310 -28.66 -1.91 -36.30 -84.06 -179.58 -191.04<br />
311 -30.94 -2.06 -39.19 -90.75 -193.88 -206.25<br />
312 -23.81 -1.59 -30.16 -69.85 -149.23 -158.75<br />
313 -19.78 -1.32 -25.06 -58.03 -123.96 -131.88<br />
314 -16.03 -1.07 -20.31 -47.03 -100.46 -106.88<br />
315 -12.06 -0.80 -15.28 -35.38 -75.59 -80.42<br />
316 -14.16 -0.94 -17.93 -41.53 -88.71 -94.38<br />
317 -15.69 -1.05 -19.87 -46.02 -98.31 -104.58<br />
318 -11.59 -0.77 -14.69 -34.01 -72.65 -77.29<br />
319 -8.72 -0.58 -11.04 -25.58 -54.64 -58.13<br />
320 -11.44 -0.76 -14.49 -33.55 -71.68 -76.25<br />
321 -10.44 -0.70 -13.22 -30.62 -65.41 -69.58<br />
322 -5.22 -0.35 -6.61 -15.31 -32.70 -34.79<br />
323 -3.16 -0.21 -4.00 -9.26 -19.78 -21.04<br />
324 -0.91 -0.06 -1.15 -2.66 -5.68 -6.04<br />
325 0.47 0.03 0.59 1.38 2.94 3.13<br />
326 0.72 0.05 0.91 2.11 4.50 4.79<br />
327 -3.34 -0.22 -4.24 -9.81 -20.95 -22.29<br />
328 -15.91 -1.06 -20.15 -46.66 -99.68 -106.04<br />
329 -17.78 -1.19 -22.52 -52.16 -111.43 -118.54<br />
330 -16.78 -1.12 -21.26 -49.23 -105.16 -111.88<br />
331 -15.81 -1.05 -20.03 -46.38 -99.09 -105.42<br />
44
332 -11.88 -0.79 -15.04 -34.83 -74.42 -79.17<br />
333 -7.00 -0.47 -8.87 -20.53 -43.87 -46.67<br />
334 5.28 0.35 6.69 15.49 33.10 35.21<br />
335 116.75 7.78 147.88 342.47 731.63 778.33<br />
336 54.28 3.62 68.76 159.23 340.16 361.88<br />
337 20.91 1.39 26.48 61.33 131.01 139.38<br />
338 13.84 0.92 17.54 40.61 86.75 92.29<br />
339 13.63 0.91 17.26 39.97 85.38 90.83<br />
340 14.22 0.95 18.01 41.71 89.10 94.79<br />
341 16.47 1.10 20.86 48.31 103.20 109.79<br />
342 17.56 1.17 22.25 51.52 110.06 117.08<br />
343 14.31 0.95 18.13 41.98 89.69 95.42<br />
344 9.56 0.64 12.11 28.05 59.93 63.75<br />
345 6.19 0.41 7.84 18.15 38.78 41.25<br />
346 2.81 0.19 3.56 8.25 17.63 18.75<br />
347 2.16 0.14 2.73 6.33 13.51 14.38<br />
348 2.47 0.16 3.13 7.24 15.47 16.46<br />
349 2.38 0.16 3.01 6.97 14.88 15.83<br />
350 11.38 0.76 14.41 33.37 71.28 75.83<br />
351 59.19 3.95 74.97 173.62 370.91 394.58<br />
352 50.81 3.39 64.36 149.05 318.43 338.75<br />
353 5.50 0.37 6.97 16.13 34.47 36.67<br />
354 -1.19 -0.08 -1.50 -3.48 -7.44 -7.92<br />
355 -0.91 -0.06 -1.15 -2.66 -5.68 -6.04<br />
356 0.94 0.06 1.19 2.75 5.88 6.25<br />
357 3.22 0.21 4.08 9.44 20.17 21.46<br />
358 7.63 0.51 9.66 22.37 47.78 50.83<br />
359 5.84 0.39 7.40 17.14 36.62 38.96<br />
360 10.13 0.68 12.83 29.70 63.45 67.50<br />
361 101.34 6.76 128.37 297.28 635.09 675.63<br />
362 8.25 0.55 10.45 24.20 51.70 55.00<br />
363 -8.66 -0.58 -10.96 -25.39 -54.25 -57.71<br />
364 0.41 0.03 0.51 1.19 2.55 2.71<br />
365 2.50 0.17 3.17 7.33 15.67 16.67<br />
366 7.16 0.48 9.06 20.99 44.85 47.71<br />
367 14.00 0.93 17.73 41.07 87.73 93.33<br />
368 9.75 0.65 12.35 28.60 61.10 65.00<br />
369 7.66 0.51 9.70 22.46 47.98 51.04<br />
370 5.84 0.39 7.40 17.14 36.62 38.96<br />
371 6.47 0.43 8.19 18.98 40.54 43.13<br />
372 8.91 0.59 11.28 26.13 55.81 59.38<br />
373 9.78 0.65 12.39 28.69 61.30 65.21<br />
374 5.38 0.36 6.81 15.77 33.68 35.83<br />
375 1.22 0.08 1.54 3.58 7.64 8.13<br />
376 -4.72 -0.31 -5.98 -13.84 -29.57 -31.46<br />
377 0.97 0.06 1.23 2.84 6.07 6.46<br />
45
378 7.81 0.52 9.90 22.92 48.96 52.08<br />
379 6.22 0.41 7.88 18.24 38.97 41.46<br />
380 2.59 0.17 3.29 7.61 16.25 17.29<br />
381 -2.34 -0.16 -2.97 -6.88 -14.69 -15.63<br />
382 -2.50 -0.17 -3.17 -7.33 -15.67 -16.67<br />
383 1.44 0.10 1.82 4.22 9.01 9.58<br />
384 6.38 0.43 8.08 18.70 39.95 42.50<br />
385 5.56 0.37 7.05 16.32 34.86 37.08<br />
386 1.53 0.10 1.94 4.49 9.60 10.21<br />
387 -5.97 -0.40 -7.56 -17.51 -37.40 -39.79<br />
388 -6.63 -0.44 -8.39 -19.43 -41.52 -44.17<br />
389 -5.03 -0.34 -6.37 -14.76 -31.53 -33.54<br />
390 -0.78 -0.05 -0.99 -2.29 -4.90 -5.21<br />
391 80.63 5.38 102.13 236.50 505.25 537.50<br />
392 8.53 0.57 10.81 25.03 53.46 56.88<br />
393 -1.47 -0.10 -1.86 -4.31 -9.20 -9.79<br />
394 -1.25 -0.08 -1.58 -3.67 -7.83 -8.33<br />
395 0.56 0.04 0.71 1.65 3.53 3.75<br />
396 1.00 0.07 1.27 2.93 6.27 6.67<br />
397 -1.75 -0.12 -2.22 -5.13 -10.97 -11.67<br />
398 -1.22 -0.08 -1.54 -3.58 -7.64 -8.13<br />
399 3.84 0.26 4.87 11.28 24.09 25.63<br />
400 -1.16 -0.08 -1.46 -3.39 -7.25 -7.71<br />
401 3.22 0.21 4.08 9.44 20.17 21.46<br />
402 30.84 2.06 39.07 90.48 193.29 205.63<br />
403 -2.28 -0.15 -2.89 -6.69 -14.30 -15.21<br />
404 -3.44 -0.23 -4.35 -10.08 -21.54 -22.92<br />
405 -1.81 -0.12 -2.30 -5.32 -11.36 -12.08<br />
406 -3.38 -0.23 -4.28 -9.90 -21.15 -22.50<br />
407 -5.59 -0.37 -7.09 -16.41 -35.05 -37.29<br />
408 -9.03 -0.60 -11.44 -26.49 -56.60 -60.21<br />
409 -13.91 -0.93 -17.61 -40.79 -87.15 -92.71<br />
410 -15.03 -1.00 -19.04 -44.09 -94.20 -100.21<br />
411 -14.63 -0.98 -18.53 -42.90 -91.65 -97.50<br />
412 -11.72 -0.78 -14.84 -34.38 -73.44 -78.13<br />
413 -14.66 -0.98 -18.56 -42.99 -91.85 -97.71<br />
414 -11.72 -0.78 -14.84 -34.38 -73.44 -78.13<br />
415 -10.44 -0.70 -13.22 -30.62 -65.41 -69.58<br />
416 -10.72 -0.71 -13.58 -31.44 -67.17 -71.46<br />
417 -12.09 -0.81 -15.32 -35.48 -75.79 -80.63<br />
418 -8.06 -0.54 -10.21 -23.65 -50.53 -53.75<br />
419 -4.25 -0.28 -5.38 -12.47 -26.63 -28.33<br />
420 -0.94 -0.06 -1.19 -2.75 -5.88 -6.25<br />
421 9.31 0.62 11.80 27.32 58.36 62.08<br />
422 10.09 0.67 12.79 29.61 63.25 67.29<br />
423 5.75 0.38 7.28 16.87 36.03 38.33<br />
46
424 7.00 0.47 8.87 20.53 43.87 46.67<br />
425 14.53 0.97 18.41 42.63 91.06 96.88<br />
426 14.28 0.95 18.09 41.89 89.50 95.21<br />
427 12.13 0.81 15.36 35.57 75.98 80.83<br />
428 4.22 0.28 5.34 12.38 26.44 28.13<br />
429 0.66 0.04 0.83 1.93 4.11 4.38<br />
430 2.84 0.19 3.60 8.34 17.82 18.96<br />
431 0.41 0.03 0.51 1.19 2.55 2.71<br />
432 -2.97 -0.20 -3.76 -8.71 -18.60 -19.79<br />
433 -3.88 -0.26 -4.91 -11.37 -24.28 -25.83<br />
434 -1.03 -0.07 -1.31 -3.03 -6.46 -6.88<br />
435 -3.06 -0.20 -3.88 -8.98 -19.19 -20.42<br />
436 -9.38 -0.63 -11.88 -27.50 -58.75 -62.50<br />
437 -8.84 -0.59 -11.20 -25.94 -55.42 -58.96<br />
438 -9.41 -0.63 -11.91 -27.59 -58.95 -62.71<br />
439 -6.75 -0.45 -8.55 -19.80 -42.30 -45.00<br />
440 -8.25 -0.55 -10.45 -24.20 -51.70 -55.00<br />
441 -8.94 -0.60 -11.32 -26.22 -56.01 -59.58<br />
442 -4.72 -0.31 -5.98 -13.84 -29.57 -31.46<br />
443 -3.22 -0.21 -4.08 -9.44 -20.17 -21.46<br />
444 -2.81 -0.19 -3.56 -8.25 -17.63 -18.75<br />
445 -2.41 -0.16 -3.05 -7.06 -15.08 -16.04<br />
446 -1.78 -0.12 -2.26 -5.23 -11.16 -11.88<br />
447 -6.81 -0.45 -8.63 -19.98 -42.69 -45.42<br />
448 -5.69 -0.38 -7.20 -16.68 -35.64 -37.92<br />
449 -3.63 -0.24 -4.59 -10.63 -22.72 -24.17<br />
450 -7.91 -0.53 -10.01 -23.19 -49.55 -52.71<br />
451 -12.72 -0.85 -16.11 -37.31 -79.70 -84.79<br />
452 -15.81 -1.05 -20.03 -46.38 -99.09 -105.42<br />
453 -18.63 -1.24 -23.59 -54.63 -116.72 -124.17<br />
454 -23.66 -1.58 -29.96 -69.39 -148.25 -157.71<br />
455 -21.72 -1.45 -27.51 -63.71 -136.10 -144.79<br />
456 -21.44 -1.43 -27.15 -62.88 -134.34 -142.92<br />
457 -24.72 -1.65 -31.31 -72.51 -154.90 -164.79<br />
458 -30.56 -2.04 -38.71 -89.65 -191.53 -203.75<br />
459 -29.44 -1.96 -37.29 -86.35 -184.48 -196.25<br />
460 -27.38 -1.83 -34.68 -80.30 -171.55 -182.50<br />
461 -22.69 -1.51 -28.74 -66.55 -142.18 -151.25<br />
462 -16.41 -1.09 -20.78 -48.13 -102.81 -109.38<br />
463 -10.47 -0.70 -13.26 -30.71 -65.60 -69.79<br />
464 -12.22 -0.81 -15.48 -35.84 -76.57 -81.46<br />
465 -9.16 -0.61 -11.60 -26.86 -57.38 -61.04<br />
466 -2.09 -0.14 -2.65 -6.14 -13.12 -13.96<br />
467 -10.69 -0.71 -13.54 -31.35 -66.98 -71.25<br />
468 -6.44 -0.43 -8.15 -18.88 -40.34 -42.92<br />
469 -2.63 -0.18 -3.33 -7.70 -16.45 -17.50<br />
47
470 -4.63 -0.31 -5.86 -13.57 -28.98 -30.83<br />
471 -14.34 -0.96 -18.17 -42.08 -89.89 -95.63<br />
472 -15.59 -1.04 -19.75 -45.74 -97.72 -103.96<br />
473 -17.91 -1.19 -22.68 -52.53 -112.21 -119.38<br />
474 -21.06 -1.40 -26.68 -61.78 -131.99 -140.42<br />
475 -20.75 -1.38 -26.28 -60.87 -130.03 -138.33<br />
476 -14.88 -0.99 -18.84 -43.63 -93.22 -99.17<br />
477 -9.00 -0.60 -11.40 -26.40 -56.40 -60.00<br />
478 -12.50 -0.83 -15.83 -36.67 -78.33 -83.33<br />
479 -21.31 -1.42 -27.00 -62.52 -133.56 -142.08<br />
480 -26.13 -1.74 -33.09 -76.63 -163.72 -174.17<br />
481 -29.00 -1.93 -36.73 -85.07 -181.73 -193.33<br />
482 -32.13 -2.14 -40.69 -94.23 -201.32 -214.17<br />
483 -34.13 -2.28 -43.23 -100.10 -213.85 -227.50<br />
484 -33.53 -2.24 -42.47 -98.36 -210.13 -223.54<br />
485 -19.94 -1.33 -25.25 -58.48 -124.94 -132.92<br />
486 -20.00 -1.33 -25.33 -58.67 -125.33 -133.33<br />
487 -30.59 -2.04 -38.75 -89.74 -191.72 -203.96<br />
488 -27.84 -1.86 -35.27 -81.68 -174.49 -185.63<br />
489 -29.41 -1.96 -37.25 -86.26 -184.28 -196.04<br />
490 -29.06 -1.94 -36.81 -85.25 -182.13 -193.75<br />
491 -30.59 -2.04 -38.75 -89.74 -191.72 -203.96<br />
492 -36.47 -2.43 -46.19 -106.98 -228.54 -243.13<br />
493 -41.19 -2.75 -52.17 -120.82 -258.11 -274.58<br />
494 -42.44 -2.83 -53.75 -124.48 -265.94 -282.92<br />
495 -42.31 -2.82 -53.60 -124.12 -265.16 -282.08<br />
496 -40.91 -2.73 -51.81 -119.99 -256.35 -272.71<br />
497 -46.00 -3.07 -58.27 -134.93 -288.27 -306.67<br />
498 -52.22 -3.48 -66.14 -153.18 -327.24 -348.13<br />
499 -56.34 -3.76 -71.37 -165.28 -353.09 -375.63<br />
500 -55.13 -3.68 -69.83 -161.70 -345.45 -367.50<br />
501 -52.63 -3.51 -66.66 -154.37 -329.78 -350.83<br />
502 -48.13 -3.21 -60.96 -141.17 -301.58 -320.83<br />
503 -43.78 -2.92 -55.46 -128.43 -274.36 -291.88<br />
504 -40.19 -2.68 -50.90 -117.88 -251.84 -267.92<br />
505 -28.34 -1.89 -35.90 -83.14 -177.62 -188.96<br />
506 -8.44 -0.56 -10.69 -24.75 -52.88 -56.25<br />
507 -1.81 -0.12 -2.30 -5.32 -11.36 -12.08<br />
508 5.94 0.40 7.52 17.42 37.21 39.58<br />
509 6.78 0.45 8.59 19.89 42.50 45.21<br />
510 5.06 0.34 6.41 14.85 31.73 33.75<br />
511 6.00 0.40 7.60 17.60 37.60 40.00<br />
512 5.44 0.36 6.89 15.95 34.08 36.25<br />
513 5.09 0.34 6.45 14.94 31.92 33.96<br />
514 10.72 0.71 13.58 31.44 67.17 71.46<br />
515 -0.75 -0.05 -0.95 -2.20 -4.70 -5.00<br />
48
516 -4.03 -0.27 -5.11 -11.83 -25.26 -26.88<br />
517 9.22 0.61 11.68 27.04 57.77 61.46<br />
518 6.66 0.44 8.43 19.53 41.71 44.38<br />
519 4.97 0.33 6.29 14.58 31.14 33.13<br />
520 4.81 0.32 6.10 14.12 30.16 32.08<br />
521 0.78 0.05 0.99 2.29 4.90 5.21<br />
522 -17.88 -1.19 -22.64 -52.43 -112.02 -119.17<br />
523 -17.22 -1.15 -21.81 -50.51 -107.90 -114.79<br />
524 -23.25 -1.55 -29.45 -68.20 -145.70 -155.00<br />
525 -22.63 -1.51 -28.66 -66.37 -141.78 -150.83<br />
526 -23.22 -1.55 -29.41 -68.11 -145.50 -154.79<br />
527 -21.03 -1.40 -26.64 -61.69 -131.80 -140.21<br />
528 -19.94 -1.33 -25.25 -58.48 -124.94 -132.92<br />
529 -20.28 -1.35 -25.69 -59.49 -127.10 -135.21<br />
530 -20.06 -1.34 -25.41 -58.85 -125.73 -133.75<br />
531 -15.28 -1.02 -19.36 -44.83 -95.76 -101.88<br />
532 -16.34 -1.09 -20.70 -47.94 -102.42 -108.96<br />
533 -15.78 -1.05 -19.99 -46.29 -98.90 -105.21<br />
534 -5.09 -0.34 -6.45 -14.94 -31.92 -33.96<br />
535 -4.38 -0.29 -5.54 -12.83 -27.42 -29.17<br />
536 -8.13 -0.54 -10.29 -23.83 -50.92 -54.17<br />
537 -13.19 -0.88 -16.70 -38.68 -82.64 -87.92<br />
538 -21.16 -1.41 -26.80 -62.06 -132.58 -141.04<br />
539 0.00 0.00 0.00 0.00 0.00<br />
49
20<br />
10<br />
0<br />
-10<br />
-20<br />
-30<br />
-40<br />
-50<br />
Shoreline changes for <strong>Nellore</strong> coast for the period 1991 to 2006 period<br />
Penner<br />
Rive r<br />
Mouth<br />
1<br />
11<br />
21<br />
31<br />
41<br />
51<br />
61<br />
71<br />
81<br />
91<br />
101<br />
111<br />
121<br />
131<br />
141<br />
151<br />
161<br />
171<br />
181<br />
191<br />
201<br />
211<br />
221<br />
231<br />
241<br />
251<br />
261<br />
271<br />
281<br />
291<br />
301<br />
311<br />
321<br />
331<br />
341<br />
351<br />
361<br />
371<br />
381<br />
391<br />
401<br />
411<br />
421<br />
431<br />
441<br />
451<br />
461<br />
471<br />
481<br />
491<br />
501<br />
511<br />
521<br />
531<br />
Transects<br />
Fig. 8: Shoreline changes for the <strong>Nellore</strong> coast for the period between 1991 and 2006.<br />
1991-2006<br />
50<br />
Shoreline change rate in m/yr
Predicted for 100 years<br />
Resourcesat-1 LISS IV<br />
FCC (Year 2006)<br />
Fig. 9: Shoreline changes during the period 1991 – 2006 and Hazard line for <strong>Nellore</strong> coast<br />
(northern area) predicted for next 100 years (shown as red line) on Resourcesat-1<br />
LISS-IV FCC image 51
Resourcesat-1 LISS IV<br />
FCC (Year 2006)<br />
Fig. 10: Shoreline changes during the period 1991 – 2006 and Hazard line for <strong>Nellore</strong> coast<br />
(southern area) predicted for next 100 years (shown as red line) on Resourcesat-1<br />
LISS-IV + Cartosat PAN merged FCC image<br />
52
6.2 Flood line<br />
Digital elevation model (DEM) has been primarily utilised as a base<br />
for delineating flood line. Inundated area (seen as blue) and flood line<br />
(seen as yellow line) of <strong>Nellore</strong> coast for the period 2025 (A), 2050<br />
(B) and 2106 (C) considering flood heights for 2025, 2050 and 2106<br />
as 3.74 m, 3.86 m and 4.13 m respectively are shown in Fig. 11. In<br />
this case we have considered wave run up elevation for highest<br />
breaker wave height and highest tidal level and corresponding<br />
elevation due to predicted sea level rise. Red line shows present CRZ<br />
line. Inundation is shown on Resourcesat-1 LlSS-IV + Cartosat-1<br />
PAN merged FCC draped over DEM. It is observed that flood line<br />
exceeds the hazard line and present CRZ line at all places and forms<br />
the vulnerability line.<br />
Inundation scenarios combining IPCC predicted SLR rate and local<br />
highest high tide level for <strong>Nellore</strong> coast (A) 0.96 m (2025); (B) 1.08 m<br />
(2050); (C) 1.35 m (2106) were generated and are shown in Fig. 12.<br />
Inundation is shown in blue colour inland on Resourcesat-1 LlSS-IV +<br />
Cartosat-1 PAN merged FCC draped on DEM prepared using 0.5 m<br />
contour data. It has been possible to delineate the flood line for the<br />
year 2106 as shown in Fig. 14 (C). It is observed that area north of<br />
the Penneru river and mouth of the Penneru river show inundation.<br />
The inundation is upto Pattepalem along the Penneru river. Similarly,<br />
area around Pallepalem (south of the Penneru river) and area<br />
adjoining the Buckingham canal in the southern parts of the study<br />
area also show flood inundation.<br />
54
2025 2106<br />
2050<br />
A<br />
B<br />
C<br />
Fig. 11: Flood line (seen as yellow) of <strong>Nellore</strong> coast for the period<br />
2025 (A), 2050 (B) and 2106 (C) considering Flood heights for<br />
2025, 2050 and 2106 as 3.74 m, 3.86 m and 4.13 m<br />
respectively shown on Resourcesat-1 LlSS-IV + Cartosat-1<br />
PAN merged FCC draped on DEM prepared using 0.5 m<br />
contour data. Present CRZ line is shown in red colour.<br />
55
2025<br />
2050<br />
2106<br />
Fig. 12: Inundation scenarios combining IPCC predicted SLR and<br />
local highest high tide level for <strong>Nellore</strong> coast (A) 0.96 m<br />
(2025); (B) 1.08 m (2050); (C) 1.35 m (2106). Inundation is<br />
shown in blue colour inland on Resourcesat-1 LlSS-IV +<br />
Cartosat-1 PAN merged FCC draped on DEM prepared<br />
using 0.5 m contour data.<br />
56
6.3 <strong>Vulnerability</strong> line<br />
The work includes integration of hazard line and flood line for<br />
demarcating vulnerability line. The landward side of the union of two<br />
lines is demarcated as vulnerability line. <strong>Vulnerability</strong> line for the year<br />
2106 is shown in Fig. 13. Here hazard line for the year 2106 is<br />
integrated with flood line for the year 2106. <strong>Vulnerability</strong> line for the<br />
year 2025, 2050 and 2106 is shown in Fig. 14.<br />
57
Hazard line<br />
Flood line<br />
<strong>Vulnerability</strong><br />
line<br />
<strong>Vulnerability</strong> line: Hazard line<br />
CRZ line<br />
Flood line<br />
Fig. 13: <strong>Vulnerability</strong> line for the year 2106 for the <strong>Nellore</strong> coast<br />
mapped by integrating hazard line and flood line under<br />
normal situation.<br />
58
2025<br />
2050<br />
2106<br />
A B C<br />
<strong>Vulnerability</strong> line: Hazard line<br />
CRZ line<br />
Flood line<br />
Fig. 14: <strong>Vulnerability</strong> line of <strong>Nellore</strong> coast for the period 2025 (A), 2050 (B) and<br />
2106 (C) under normal situation.<br />
59
7. Conclusions<br />
The present study has demonstrated an approach to map hazard and<br />
flood line for the <strong>Nellore</strong> coast of Andhra Pradesh and demarcation of<br />
vulnerability line has been carried out by considering union of hazard<br />
and flood line. The approach has been applied to demarcate<br />
vulnerability line for the year 2025, 2050 and 2106.<br />
60
References<br />
Chandramohan, P., Jena, B.K. and Sanil Kumar, V., 2001. Littoral sources<br />
and sinks along the Indian coast. Current Science, Vol. 81, No. 3, pp. 292-<br />
297.<br />
Church, J.A. and Gregory, J.M., 2001. Changes In Sea Level; In: J.T.<br />
Houghton Et Al. (Eds), Climate Change 2001: The 81 Explanatory <strong>Report</strong> –<br />
Indicative Coastal <strong>Vulnerability</strong> Maps Of Tasmania Scientific Basis,<br />
Intergovernmental Panel on Climate Change, Cambridge University Press,<br />
pp. 639-693.<br />
Desai, P.S., Narain, A., Nayak, S. R., Manikiam, B., Adiga, S. and Nath, A.<br />
N., 1991. IRS 1A applications for coastal and marine resources. Current<br />
Science, Vol. 61, Nos. 3 & 4, pp. 204-208.<br />
Dutrieux, E., Canovas, C., Denis, J., Henocque, Y., Quod J.P. and Bigot,<br />
L., 2000. Guidelines for vulnerability mapping of coastal zones in the Indian<br />
Ocean, UNESCO, IOC, Manuals and Guides No. 38.<br />
Gormitz, V., Lebedeff, S. and Hansen, J., 1982. Global sea level trend in<br />
the past century. Science, Vol. 215, pp. 1612 - 1614.<br />
Hammar-Klose, E. S., Thieler, E. R. and Williams, S. J., 2001. Mapping<br />
relative coastal vulnerability to future sea-level rise in the national<br />
seashores. GSA Annual Meeting, November 5-8, 2001.<br />
61
Harvey, N., Clouston, B. and Carvalho, P., 1999 a. Improving coastal<br />
vulnerability assessment methodologies for integrated coastal<br />
management: an approach from south Australia. Australian Geographical<br />
Studies, Vol. 37, No. 1, pp. 50-69.<br />
Harvey, N., Belperio, A.P., Bourman, R.P. and Bryan, B., 1999 b. Coastal<br />
vulnerability and GIS. Asia Pacific Journal on Environment and<br />
Development, Vol. 6, No. 2, pp. 1-25.<br />
Hekstra, G.P., 1988. Global warming and rising sea levels: the policy<br />
implications. The Ecologist, Vol. 19, pp. 4 -15.<br />
Houghton, J.T., Jenkins, G.J. and Ephraums, J.J., 1991. Climatic Change.<br />
The IPCC Scientific Assessment, Cambridge University Press, Cambridge.<br />
Houghton, J.T., Ding, Y., Griggs, D.J., Noguer, M., Van Der Linden, P.J.<br />
and Xiaosu, D. (Eds.), 2001. Climate Change 2001: The Scientific Basis,<br />
Contribution of Working Group I to the Third Assessment <strong>Report</strong> of the<br />
Intergovernmental Panel on Climate Change (IPCC), Cambridge University<br />
Press, New York.<br />
Hunter, J., Coleman, R. and Pugh, D., 2003. The sea level at Port Arthur,<br />
Tasmania, from 1841 to the present. Geophysical Research Letters, Vol.<br />
30, No. 7, pp. 54-1 to 54-4.<br />
62
IPCC, 1993. Climate Change 92 – The Supplementary <strong>Report</strong> to the IPCC<br />
Impacts Assessment; Intergovernmental Panel on Climate Change,<br />
Canberra, 112 p.<br />
IPCC, 2001. Climate Change 2001: IPCC Third Assessment <strong>Report</strong> - The<br />
Scientific Basis. The IPCC Secretariat, c/o World Meteorological<br />
Organization, Switzerland.<br />
Lambeck, K. and Chappell, J., 2001. Sea level change through the last<br />
glacial cycle. Science, Vol. 292, pp. 679-685.<br />
Ministry of Environment and Forests (2005). <strong>Report</strong> of the Committee<br />
Chaired by Prof. M.S. Swaminathan to review the coastal regulation zone<br />
notification 1991. MoEF, New Delhi, February 2005, 127 p.<br />
Morton, R. A., 2002. Factors controlling storm impacts on coastal barriers<br />
and beaches - a preliminary basis for real time forecasting. Journal of<br />
Coastal Research, Vol. 18, pp. 486-501.<br />
Navalgund, R.R., Nayak, S.R., Thakker, P.S., Rajawat, A.S., Chauhan,<br />
H.B., Ray, S.S., Chaudhary, K.N., Bhanumurthy, V., Singh, T.P., and<br />
Mehta, R.L, 1998. An assessment of the Gujarat cyclone damage through<br />
IRS-1C/1D data. SAC Scientific <strong>Report</strong> No. SAC/RESA/MWRD/SN/03/98.<br />
Nayak, S.R., 1994. Application of remote sensing data for estimation of<br />
impact of sea level rise along the Gujarat coast. In Global Change Studies:<br />
63
Scientific Results from ISRO Geosphere Biosphere Programme, ISRO<br />
Scientific <strong>Report</strong> No. ISRO-GBP-SR-42-94, pp. 337-348.<br />
Nayak. S. R., 1996. Monitoring the coastal environment of India using<br />
satellite data. Science, Technology and Development, Vol. 14, No. 2, pp.<br />
100-120.<br />
Nayak, S., Chauhan, P., Chauhan, H. B., Bahuguna, A., and Narendra<br />
Nath, A., 1996. IRS-1C applications for coastal zone management. Current<br />
Science, Vol. 70, No. 7, pp. 614-618.<br />
Nayak, S.R., Sarangi, R.K. and Rajawat, A.S., 2001. Application of IRS-P4<br />
OCM data to study the impact of cyclone on coastal environment of Orissa.<br />
Current Science, Vol. 80, No. 9, pp. 1209-1213.<br />
Pendleton, E.A., Thieler, E.R. and Williams, S.J., 2004. Coastal<br />
vulnerability assessment of Cape Hatteras national seashore (CAHA) to<br />
sea level rise. Open-File <strong>Report</strong> 2004-1064, US Department of Interior, US<br />
Geological Survey.<br />
Pethick, J.S., 1996. The geomorphology of mudflat. In Nordstrom, K.F. and<br />
Roman, C.T. (Eds) Estuarine Shores: Evolution, Environment and Human<br />
Health: Cambridge: Cambridge University Press, pp. 41-62.<br />
Pethick, J.S. and Crooks, S., 2000. Development of a coastal vulnerability<br />
index: a geomorphological perspective. Environment Conservation, Vol. 27,<br />
pp. 359–367.<br />
64
Rajawat, A.S., Bhattacharya, S., Jain, S., Gupta, M., Jayaprasad, P.,<br />
Tamilarasan, V., Ajai and Nayak, S., 2006. Coastal vulnerability mapping of<br />
the Indian coast. Proc. Second International Symposium on Geoinformation<br />
for Disaster Management (Gi4DM), 25-26 September 2006,<br />
Goa, India.<br />
Rajawat, A.S., Gupta M., Pradhan, Y., Thomaskutty, A.V. and Nayak, S.,<br />
2005. Coastal processes along the Indian coast – case studies based on<br />
synergistic use of IRS-P4 OCM and IRS-1C/1D data. Indian Journal of<br />
Marine Sciences, Vol. 34, No. 4, pp. 459-472.<br />
Rajawat, A.S. and Nayak, S., 2000. Remote sensing applications in coastal<br />
zone hazards. In: Natural Disasters and their Mitigation, Remote Sensing<br />
and Geographic Information System Perspectives, Indian Institute of<br />
Remote Sensing (NRSA), Dehradun, pp. 58 - 174.<br />
Rajawat, A.S. and Nayak, S., 2004, Applications of satellite survey in<br />
coastal disasters. In “Coping with Natural Hazards: Indian Context (Ed.:<br />
Valdiya, K.S.)”; The National Academy of Sciences, Allahabad, pp. 204-<br />
215.<br />
SAC, 2005. Project Execution Document on Delineation of Setback Line for<br />
Coastal Regulation Zone, 7 p.<br />
SAC, 2003. IRS-P4 OCM/SATCORE Project <strong>Report</strong>, Volume – III, Coastal<br />
Processes. SAC Scientific <strong>Report</strong>, No. IRS-P4/SATCORE/SAC/RESIPA/<br />
MWRG/SR/24 /2003, 134 p.<br />
65
Sharples, C., 2004. Indicative mapping of Tasmanian coastal vulnerability<br />
to climate change and sea level rise: explanatory report, Department of<br />
Primary Industries, Water & Environment (Tasmania), Australia.<br />
Stive, M. J. F., 2004. How important is global warming for coastal erosion?.<br />
Climatic Change, No. 64, pp. 27-39.<br />
Thieler, E. R., Williams, J., Hammar-Klose, E.S. and Booma, G., 2001.<br />
Mapping coastal vulnerability to future sea-level rise within the national<br />
parks. Sound Waves, Monthly Newsletter of USGS.<br />
Unnikrishnan, A.S., Rupa Kumar, K., Sharon E. F., Michael, G.S. and<br />
Patwardhan, S.K., 2006. Sea level changes along the Indian coast:<br />
Observation and projections. Current Science, Vol. 90, No.3, pp. 362-368.<br />
Zhang, K., Douglas, B.C. and Leatherman, S.P., 2004. Global warming and<br />
coastal erosion. Climatic Change, No. 64, pp. 41-58.<br />
66