crisil report - Diamines And Chemicals Limited
crisil report - Diamines And Chemicals Limited
crisil report - Diamines And Chemicals Limited

You also want an ePaper? Increase the reach of your titles
YUMPU automatically turns print PDFs into web optimized ePapers that Google loves.
<strong>Diamines</strong> and <strong>Chemicals</strong> Ltd<br />
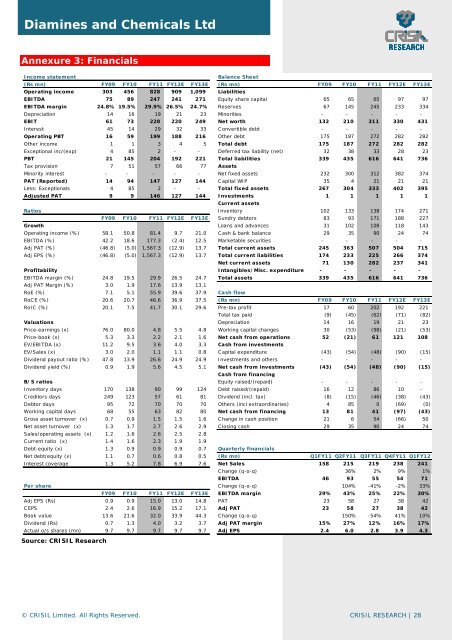
Annexure 3: Financials<br />
Income statement<br />
Balance Sheet<br />
(Rs mn) FY09 FY10 FY11 FY12E FY13E (Rs mn) FY09 FY10 FY11 FY12E FY13E<br />
Operating income 303 456 828 909 1,099 Liabilities<br />
EBITDA 75 89 247 241 271 Equity share capital 65 65 65 97 97<br />
EBITDA margin 24.8% 19.5% 29.9% 26.5% 24.7% Reserves 67 145 245 233 334<br />
Depreciation 14 16 19 21 23 Minorities - - - - -<br />
EBIT 61 73 228 220 249 Net worth 132 210 311 330 431<br />
Interest 45 14 29 32 33 Convertible debt - - - - -<br />
Operating PBT 16 59 199 188 216 Other debt 175 187 272 282 282<br />
Other income 1 1 3 4 5 Total debt 175 187 272 282 282<br />
Exceptional inc/(exp) 4 85 2 - - Deferred tax liability (net) 32 38 33 28 23<br />
PBT 21 145 204 192 221 Total liabilities 339 435 616 641 736<br />
Tax provision 7 51 57 66 77 Assets<br />
Minority interest - - - - - Net fixed assets 232 300 312 382 374<br />
PAT (Reported) 14 94 147 127 144 Capital WIP 35 4 21 21 21<br />
Less: Exceptionals 4 85 2 - - Total fixed assets 267 304 333 402 395<br />
Adjusted PAT 9 9 146 127 144 Investments 1 1 1 1 1<br />
Current assets<br />
Ratios Inventory 102 133 138 174 271<br />
FY09 FY10 FY11 FY12E FY13E Sundry debtors 83 93 171 188 227<br />
Growth Loans and advances 31 102 108 118 143<br />
Operating income (%) 58.1 50.8 81.4 9.7 21.0 Cash & bank balance 29 35 90 24 74<br />
EBITDA (%) 42.2 18.6 177.3 (2.4) 12.5 Marketable securities - - - - -<br />
Adj PAT (%) (46.8) (5.0) 1,567.3 (12.9) 13.7 Total current assets 245 363 507 504 715<br />
Adj EPS (%) (46.8) (5.0) 1,567.3 (12.9) 13.7 Total current liabilities 174 233 225 266 374<br />
Net current assets 71 130 282 237 341<br />
Profitability Intangibles/Misc. expenditure - - - - -<br />
EBITDA margin (%) 24.8 19.5 29.9 26.5 24.7 Total assets 339 435 616 641 736<br />
Adj PAT Margin (%) 3.0 1.9 17.6 13.9 13.1<br />
RoE (%) 7.1 5.1 55.9 39.6 37.9 Cash flow<br />
RoCE (%) 20.6 20.7 46.6 36.9 37.5 (Rs mn) FY09 FY10 FY11 FY12E FY13E<br />
RoIC (%) 20.1 7.5 41.7 30.1 29.6 Pre-tax profit 17 60 202 192 221<br />
Total tax paid (9) (45) (62) (71) (82)<br />
Valuations Depreciation 14 16 19 21 23<br />
Price-earnings (x) 76.0 80.0 4.8 5.5 4.8 Working capital changes 30 (53) (98) (21) (53)<br />
Price-book (x) 5.3 3.3 2.2 2.1 1.6 Net cash from operations 52 (21) 61 121 108<br />
EV/EBITDA (x) 11.2 9.5 3.6 4.0 3.3 Cash from investments<br />
EV/Sales (x) 3.0 2.0 1.1 1.1 0.8 C apital expenditure (43) (54) (48) (90) (15)<br />
Dividend payout ratio (%) 47.8 13.9 26.6 24.9 24.9 Investments and others - - - - -<br />
Dividend yield (%) 0.9 1.9 5.6 4.5 5.1 Net cash from investments (43) (54) (48) (90) (15)<br />
Cash from financing<br />
B/S ratios Equity raised/(repaid) - - - - -<br />
Inventory days 170 138 90 99 124 Debt raised/(repaid) 16 12 86 10 -<br />
C reditors days 249 123 57 61 81 Dividend (incl. tax) (8) (15) (46) (38) (43)<br />
Debtor days 95 72 70 70 70 Others (incl extraordinaries) 4 85 0 (69) (0)<br />
Working capital days 68 55 63 82 80 Net cash from financing 13 81 41 (97) (43)<br />
Gross asset turnover (x) 0.7 0.9 1.5 1.5 1.6 Change in cash position 21 6 54 (66) 50<br />
Net asset turnover (x) 1.3 1.7 2.7 2.6 2.9 Closing cash 29 35 90 24 74<br />
Sales/operating assets (x) 1.2 1.6 2.6 2.5 2.8<br />
Current ratio (x) 1.4 1.6 2.3 1.9 1.9<br />
Debt-equity (x) 1.3 0.9 0.9 0.9 0.7 Quarterly financials<br />
Net debt/equity (x) 1.1 0.7 0.6 0.8 0.5 (Rs mn) Q1FY11 Q2FY11 Q3FY11 Q4FY11 Q1FY12<br />
Interest coverage 1.3 5.2 7.8 6.9 7.6 Net Sales 158 215 219 238 241<br />
C hange (q-o-q) 36% 2% 9% 1%<br />
EBITDA 46 93 55 54 71<br />
Per share C hange (q-o-q) 104% -41% -2% 33%<br />
FY09 FY10 FY11 FY12E FY13E EBITDA margin 29% 43% 25% 22% 30%<br />
Adj EPS (Rs) 0.9 0.9 15.0 13.0 14.8 PAT 23 58 27 38 42<br />
CEPS 2.4 2.6 16.9 15.2 17.1 Adj PAT 23 58 27 38 42<br />
Book value 13.6 21.6 32.0 33.9 44.3 C hange (q-o-q) 150% -54% 41% 10%<br />
Dividend (Rs) 0.7 1.3 4.0 3.2 3.7 Adj PAT margin 15% 27% 12% 16% 17%<br />
Actual o/s shares (mn) 9.7 9.7 9.7 9.7 9.7 Adj EPS 2.4 6.0 2.8 3.9 4.3<br />
Source: CRISIL Research<br />
© CRISIL <strong>Limited</strong>. All Rights Reserved. CRISIL RESEARCH | 28