

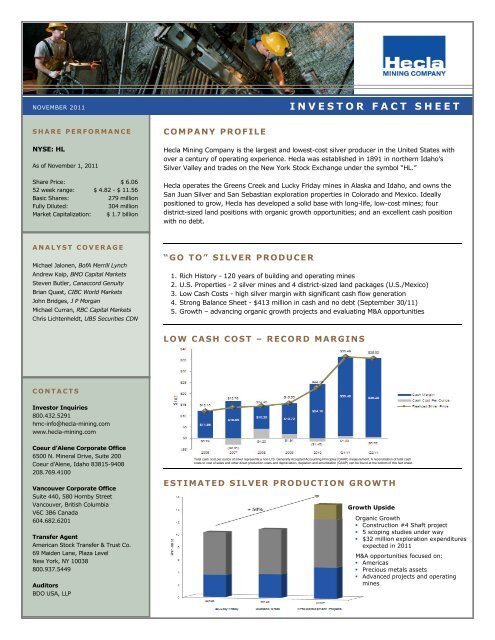
INVESTOR FACT SHEET - Hecla Mining Company
INVESTOR FACT SHEET - Hecla Mining Company
INVESTOR FACT SHEET - Hecla Mining Company

You also want an ePaper? Increase the reach of your titles
YUMPU automatically turns print PDFs into web optimized ePapers that Google loves.
NOVEMBER 2011<br />
I N V E S T O R F A C T S H E E T<br />
S H A R E P E R F O R M A N C E<br />
NYSE: HL<br />
As of November 1, 2011<br />
Share Price: $ 6.06<br />
52 week range: $ 4.82 - $ 11.56<br />
Basic Shares:<br />
279 million<br />
Fully Diluted:<br />
304 million<br />
Market Capitalization: $ 1.7 billion<br />
C O M PANY PROFILE<br />
<strong>Hecla</strong> <strong>Mining</strong> <strong>Company</strong> is the largest and lowest-cost silver producer in the United States with<br />
over a century of operating experience. <strong>Hecla</strong> was established in 1891 in northern Idaho’s<br />
Silver Valley and trades on the New York Stock Exchange under the symbol “HL.”<br />
<strong>Hecla</strong> operates the Greens Creek and Lucky Friday mines in Alaska and Idaho, and owns the<br />
San Juan Silver and San Sebastian exploration properties in Colorado and Mexico. Ideally<br />
positioned to grow, <strong>Hecla</strong> has developed a solid base with long-life, low-cost mines; four<br />
district-sized land positions with organic growth opportunities; and an excellent cash position<br />
with no debt.<br />
A N A L Y S T C O V E R A G E<br />
Michael Jalonen, BofA Merrill Lynch<br />
Andrew Kaip, BMO Capital Markets<br />
Steven Butler, Canaccord Genuity<br />
Brian Quast, CIBC World Markets<br />
John Bridges, J P Morgan<br />
Michael Curran, RBC Capital Markets<br />
Chris Lichtenheldt, UBS Securities CDN<br />
“ G O T O ” S I LVER P R O D U C E R<br />
1. Rich History - 120 years of building and operating mines<br />
2. U.S. Properties - 2 silver mines and 4 district-sized land packages (U.S./Mexico)<br />
3. Low Cash Costs - high silver margin with significant cash flow generation<br />
4. Strong Balance Sheet - $413 million in cash and no debt (September 30/11)<br />
5. Growth – advancing organic growth projects and evaluating M&A opportunities<br />
L O W C A S H C O S T – R E C O R D MARGINS<br />
C O N T A C T S<br />
Investor Inquiries<br />
800.432.5291<br />
hmc-info@hecla-mining.com<br />
www.hecla-mining.com<br />
Coeur d’Alene Corporate Office<br />
6500 N. Mineral Drive, Suite 200<br />
Coeur d’Alene, Idaho 83815-9408<br />
208.769.4100<br />
Vancouver Corporate Office<br />
Suite 440, 580 Hornby Street<br />
Vancouver, British Columbia<br />
V6C 3B6 Canada<br />
604.682.6201<br />
Transfer Agent<br />
American Stock Transfer & Trust Co.<br />
69 Maiden Lane, Plaza Level<br />
New York, NY 10038<br />
800.937.5449<br />
Auditors<br />
BDO USA, LLP<br />
Total cash cost per ounce of silver represents a non-U.S. Generally Accepted Accounting Principles (GAAP) measurement. A reconciliation of total cash<br />
costs to cost of sales and other direct production costs and depreciation, depletion and amortization (GAAP) can be found at the bottom of this fact sheet.<br />
E S T I MATED S I LVER PRODUCTION G R O WTH<br />
Growth Upside<br />
Organic Growth<br />
• Construction #4 Shaft project<br />
• 5 scoping studies under way<br />
• $32 million exploration expenditures<br />
expected in 2011<br />
M&A opportunities focused on:<br />
• Americas<br />
• Precious metals assets<br />
• Advanced projects and operating<br />
mines
O P E R A T I N G P R O P E R T I E S<br />
Greens Creek Admiralty Island, Alaska<br />
Silver Reserves – 100 million ounces<br />
The 100%-owned Greens Creek silver, gold, lead, and zinc underground mining operation is located in<br />
Southeast Alaska. Since 2008, when the company acquired Rio Tinto's remaining 70% interest in the<br />
operation, <strong>Hecla</strong> nearly doubled its silver reserves and metals production. In the first six months of 2011,<br />
Greens Creek produced 3.2 million ounces of silver with an average ore grade of 11.49 ounces of silver per<br />
ton. Greens Creek is one of the world’s largest high-grade, low-cost silver mines, with more than 200<br />
million ounces produced in the last 20 years.<br />
Lucky Friday Mullan, Idaho<br />
Silver Reserves – 42 million ounces<br />
The Lucky Friday silver mine is located in one of the world’s most prolific silver-producing districts: northern<br />
Idaho’s Silver Valley. It is the deepest operating mine in the United States and has been in commercial<br />
production since 1942. Over the past 69 years, 147 million ounces of silver have been mined. Construction<br />
of the #4 Shaft project continues and final Board approval was received and the detailed engineering<br />
completed in the second quarter 2011. Completion of the #4 Shaft project is expected in H2/2014 with<br />
potential to increase production by 60% to 5 million ounces of silver annually.<br />
E X P L O R A T I O N P R O P E R T I E S<br />
San Juan Silver JV Creede, Colorado<br />
In 2008, <strong>Hecla</strong> acquired the right to earn into a 70% joint-venture interest in a roughly 21-square-mile<br />
consolidated land package in one of Colorado’s most prolific silver-producing districts. The exploration<br />
property has an identified resource of approximately 26 million ounces of silver, with potential for more<br />
resources through a targeted exploration program. A scoping study is under way to look at potentially reopening<br />
the Bulldog mine.<br />
San Sebastian Durango, Mexico<br />
The San Sebastian mine is located approximately 56 miles northeast of the city of Durango, Mexico. <strong>Hecla</strong> is<br />
engaged in an exploration program on this 300-square-mile property, which is on trend with major mines<br />
and deposits in central Mexico. A scoping study is under way to look at potentially re-opening the Hugh<br />
zone.<br />
D I R E C T O R S<br />
Ted Crumley, Chairman<br />
Phillips S. Baker, Jr.<br />
John H. Bowles<br />
George R. Nethercutt, Jr.<br />
Terry V. Rogers<br />
Charles B. Stanley<br />
Dr. Anthony P. Taylor<br />
F I N A N C I A L H I G H L I G H T S<br />
(dollars in thousands for the year ended Dec. 31)<br />
2008 2009 2010 H2/2011<br />
Sales of products $ 204,665 $ 312,548 $ 418,813 $ 254,224<br />
Net income (loss) (66,563) 67,826 48,983 76,674<br />
Cash flow provided by operating activities 14,785 119,165 197,809 127,217<br />
Cash and cash equivalents at year end 36,470 104,678 283,606 377,436<br />
Reconciliation of Cash Costs per Ounce to Generally Accepted Accounting Principles (GAAP) (1)<br />
(dollars and ounces in thousands, except per ounce – unaudited)<br />
2006 2007 2008 2009 2010 Q1/2011 Q2/2011<br />
Total cash costs $ 1,329 $ (15,873) $ 36,621 $ 20,958 $ (15,435) $ 2,530 $ 1,169<br />
Divided by silver ounces produced 5,510 5,643 8,709 10,989 10,566 2,455 2,250<br />
Total cash cost per ounce<br />
produced $ 0.24 $ (2.81) $ 4.20 $ 1.91 $ (1.46) $ 1.03 $ 0.52<br />
Reconciliation to GAAP:<br />
Total cash costs $ 1,329 $ (15,873) $ 36,621 $ 20,958 $ (15,435) $ 2,530 $ 1,169<br />
Depreciation, depletion and<br />
amortization 11,757 12,323 35,207 62,837 60,011 16,069 11,204<br />
Treatment costs (33,523) (27,617) (70,776) (80,830) (92,144) (24,236) (25,948)<br />
By-product credits 86,216 112,079 164,963 206,608 267,272 64,511 66,931<br />
Change in product inventory (2) 1,278 (1,261) 20,254 310 3,660 1,533 (4,164)<br />
Reclamation, severance and other<br />
costs 190 203 537 1,596 630 191 877<br />
Costs of sales and other direct<br />
production costs and<br />
depreciation, depletion and<br />
amortization (GAAP) $ 67,247 $ 79,854 $ 186,806 $ 211,479 $ 223,994 $ 56,791 $ 50,069<br />
(1) Cash cost per ounce of silver represents a non-U.S. Generally Accepted Accounting Principles (GAAP) measurement that the <strong>Company</strong> believes provides management and investors an indication<br />
of net cash flow, after consideration of the realized price received for production sold. Management also uses this measurement for the comparative monitoring of performance of mining<br />
operations period-to-period from a cash flow perspective. “Total cash cost per ounce” is a measure developed by gold companies in an effort to provide a comparable standard; however, there<br />
can be no assurance that our reporting of this non-GAAP measure is similar to that reported by other mining companies. Cost of sales and other direct production costs and depreciation,<br />
depletion and amortization, was the most comparable financial measures calculated in accordance with GAAP to total cash costs.<br />
(2) The change in product inventory for the twelve months ended December 31, 2006, includes approximately $905,000 related to San Sebastian cost of sales during the first quarter of 2006 for<br />
prior period doré shipments.<br />
O F F I C E R S<br />
Phillips S. Baker, Jr.<br />
President & CEO<br />
Mélanie Hennessey<br />
VP – Investor Relations<br />
Dean W. McDonald<br />
VP – Exploration<br />
Don Poirier<br />
VP – Corporate Development<br />
Larry Radford<br />
VP – Operations<br />
James A. Sabala<br />
Sr. VP – Chief Financial Officer<br />
David C. Sienko<br />
VP – General Counsel<br />
Cautionary Statements<br />
Statements made which are not historical facts, such as<br />
strategies, plans, anticipated payments, litigation outcome<br />
(including settlement negotiations), production, sales of<br />
assets, exploration results and plans, costs, and prices or sales<br />
performance are “forward-looking statements” within the<br />
meaning of the Private Securities Litigation Reform Act of<br />
1995. Words such as “may”, “will”, “should”, “expects”,<br />
“intends”, “projects”, “believes”, “estimates”, “targets”,<br />
“anticipates” and similar expressions are used to identify these<br />
forward-looking statements. Forward-looking statements<br />
involve a number of risks and uncertainties that could cause<br />
actual results to differ materially from those projected,<br />
anticipated, expected or implied. These risks and uncertainties<br />
include, but are not limited to, metals price volatility, volatility<br />
of metals production and costs, environmental and litigation<br />
risks, operating risks, project development risks, political risks,<br />
labor issues, ability to raise financing, and exploration risks<br />
and results. Refer to the company’s Form 10-K and 10-Q<br />
reports for a more detailed discussion of factors that may<br />
impact expected future results. The company undertakes no<br />
obligation and has no intention of updating forward-looking<br />
statements other than as may be required by law.<br />
Printed on recycled paper.<br />
©2011 <strong>Hecla</strong> <strong>Mining</strong> <strong>Company</strong>


