Notes to Financial Statements - Ministry of Finance and Planning
Notes to Financial Statements - Ministry of Finance and Planning
Notes to Financial Statements - Ministry of Finance and Planning

Create successful ePaper yourself
Turn your PDF publications into a flip-book with our unique Google optimized e-Paper software.
<strong>Ministry</strong> <strong>of</strong> <strong>Finance</strong> <strong>and</strong> <strong>Planning</strong>, Sri Lanka > Annual Report 2012<br />
<strong>Notes</strong> <strong>to</strong> <strong>Financial</strong> <strong>Statements</strong> contd...<br />
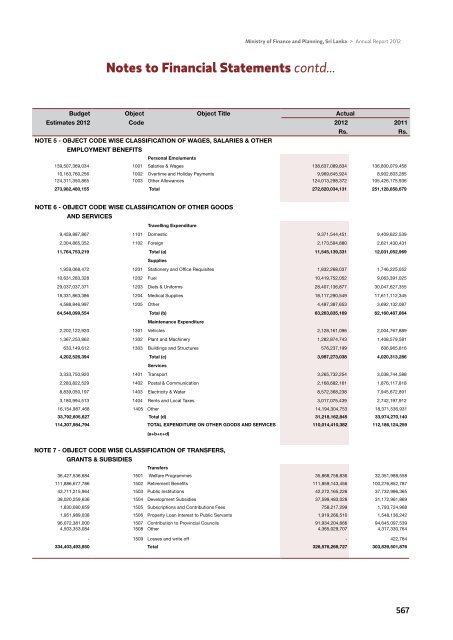
Budget<br />
Object<br />
Object Title<br />
Actual<br />
Estimates 2012<br />
Code<br />
2012<br />
2011<br />
Rs.<br />
Rs.<br />
NOTE 5 - OBJECT CODE WISE CLASSIFICATION OF WAGES, SALARIES & OTHER<br />
EMPLOYMENT BENEFITS<br />
Personal Emoluments<br />
139,507,369,034 1001 Salaries & Wages 138,637,089,834 136,800,079,458<br />
10,163,760,256 1002 Overtime <strong>and</strong> Holiday Payments 9,969,645,924 8,902,603,285<br />
124,311,350,865 1003 Other Allowances 124,013,298,372 105,426,175,936<br />
273,982,480,155 Total 272,620,034,131 251,128,858,679<br />
NOTE 6 - OBJECT CODE WISE CLASSIFICATION OF OTHER GOODS<br />
AND SERVICES<br />
Travelling Expenditure<br />
9,459,887,867 1101 Domestic 9,371,544,451 9,409,622,539<br />
2,304,865,352 1102 Foreign 2,173,594,880 2,621,430,431<br />
11,764,753,219 Total (a) 11,545,139,331 12,031,052,969<br />
Supplies<br />
1,959,068,472 1201 Stationery <strong>and</strong> Office Requisites 1,832,268,037 1,746,225,052<br />
10,631,283,328 1202 Fuel 10,419,752,052 9,063,391,025<br />
29,037,037,371 1203 Diets & Uniforms 28,407,136,877 30,047,627,355<br />
18,331,863,386 1204 Medical Supplies 18,117,290,549 17,611,112,345<br />
4,588,846,997 1205 Other 4,487,387,653 3,692,132,087<br />
64,548,099,554 Total (b) 63,263,835,169 62,160,487,864<br />
Maintenance Expenditure<br />
2,202,122,920 1301 Vehicles 2,128,161,096 2,004,767,889<br />
1,367,253,862 1302 Plant <strong>and</strong> Machinery 1,282,874,743 1,408,579,581<br />
633,149,612 1303 Buildings <strong>and</strong> Structures 576,237,199 606,965,816<br />
4,202,526,394 Total (c) 3,987,273,038 4,020,313,286<br />
Services<br />
3,333,750,920 1401 Transport 3,265,732,254 3,038,744,588<br />
2,283,822,529 1402 Postal & Communication 2,168,682,161 1,876,117,818<br />
8,839,050,197 1403 Electricity & Water 8,572,368,238 7,945,672,891<br />
3,180,994,513 1404 Rents <strong>and</strong> Local Taxes 3,017,075,439 2,742,197,912<br />
16,154,987,468 1405 Other 14,194,304,753 18,371,536,931<br />
33,792,605,627 Total (d) 31,218,162,845 33,974,270,140<br />
114,307,984,794 TOTAL EXPENDITURE ON OTHER GOODS AND SERVICES<br />
(a+b+c+d)<br />
110,014,410,382 112,186,124,259<br />
NOTE 7 - OBJECT CODE WISE CLASSIFICATION OF TRANSFERS,<br />
GRANTS & SUBSIDIES<br />
Transfers<br />
36,427,536,684 1501 Welfare Programmes 35,868,758,836 32,351,988,558<br />
111,886,677,786 1502 Retirement Benefits 111,859,143,456 100,276,852,787<br />
43,711,215,964 1503 Public Institutions 42,272,165,226 37,732,986,365<br />
38,020,259,636 1504 Development Subsidies 37,599,483,028 31,172,961,869<br />
1,830,080,659 1505 Subscriptions <strong>and</strong> Contributions Fees 758,217,299 1,793,724,968<br />
1,951,989,038 1506 Property Loan Interest <strong>to</strong> Public Servants 1,919,266,510 1,548,136,242<br />
96,072,381,000 1507 Contribution <strong>to</strong> Provincial Councils 91,934,204,666 94,645,097,539<br />
4,503,353,084 1508 Other 4,365,029,707 4,317,330,764<br />
- 1509 Losses <strong>and</strong> write <strong>of</strong>f - 422,784<br />
334,403,493,850 Total 326,576,268,727 303,839,501,876<br />
567