

rynek mieszkaniowy residential market - Tabelaofert.pl
rynek mieszkaniowy residential market - Tabelaofert.pl
rynek mieszkaniowy residential market - Tabelaofert.pl

Create successful ePaper yourself
Turn your PDF publications into a flip-book with our unique Google optimized e-Paper software.
a p o r t : r y n e k m i e s z k a n i o w y r e p o r t : r e s i d e n t i a l m a r k e t<br />
14,0<br />
12,0<br />
10,0<br />
8,0<br />
6,0<br />
4,0<br />
2,0<br />
0,0<br />
I II III I II III IV I II III IV I II III IV I II III<br />
2000 2001 2002 2003<br />
2004<br />
3 000<br />
2 500<br />
2 000<br />
1 500<br />
1 000<br />
500<br />
0<br />
I II III IV I II III IV I II III IV I II III IV I II III IV I II III<br />
1999 2000 2001 2002 2003 2004<br />
250<br />
200<br />
150<br />
100<br />
50<br />
0<br />
I kwartał<br />
1 st quarter<br />
1998 1999 2000 2001 2002 2003 2004<br />
II kwartał<br />
2 nd quarter<br />
III kwartał<br />
3 rd quarter<br />
IV kwartał<br />
4 th quarter<br />
okres<br />
period<br />
I kwartał<br />
1 st quarter<br />
II kwartał<br />
2 nd quarter<br />
III kwartał<br />
3 rd quarter<br />
IV kwartał<br />
4 th quarter<br />
suma<br />
total<br />
1998 1999 2000 2001 2002 2003 2004<br />
suma<br />
total<br />
4 5 1 7 6 2 43 68*<br />
3 0 7 4 46 5 7 65*<br />
198 6 22 21 29 90 366<br />
8 85 101 11 95 206 506<br />
213 96 131 43 176 303 1 005<br />
wykres 39. Stopa bezrobocia w Sopocie<br />
graph 39. The un<strong>pl</strong>oyment rate in Sopot<br />
źródło: Biuletyn Statystyczny woj. pomorskiego (wyd. miesięczne i kwartalne z lat 2000-2004)<br />
source: Statistical Bulletin of the Pomorskie Voiv. (month. and quart. editions, 2000-2004)<br />
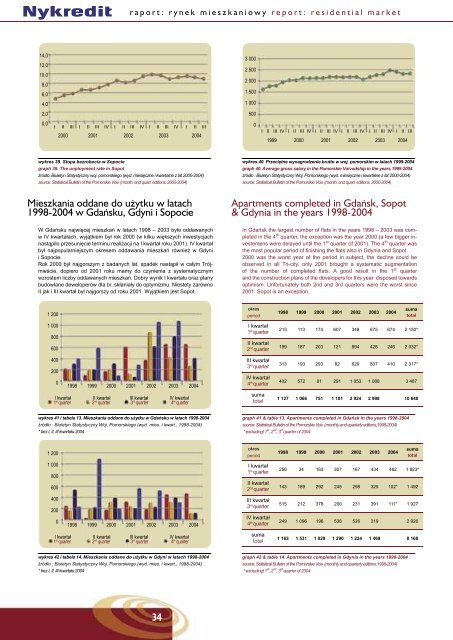
Mieszkania oddane do u¿ytku w latach<br />
1998-2004 w Gdañsku, Gdyni i Sopocie<br />
W Gdańsku najwięcej mieszkań w latach 1998 – 2003 było oddawanych<br />
w IV kwartałach, wyjątkiem był rok 2000 (w kilku większych inwestycjach<br />
nastąpiło przesunięcie terminu realizacji na I kwartał roku 2001). IV kwartał<br />
był najpopularniejszym okresem oddawania mieszkań również w Gdyni<br />
i Sopocie.<br />
Rok 2000 był najgorszym z badanych lat, spadek nastąpił w całym Trójmieście,<br />
dopiero od 2001 roku mamy do czynienia z systematycznym<br />
wzrostem liczby oddawanych mieszkań. Dobry wynik I kwartału oraz <strong>pl</strong>any<br />
budowlane deweloperów dla br. skłaniały do optymizmu. Niestety zarówno<br />
II jak i III kwartał był najgorszy od roku 2001. Wyjątkiem jest Sopot.<br />
wykres 40. Przeciętne wynagrodzenie brutto w woj. pomorskim w latach 1999-2004<br />
graph 40. Average gross salary in the Pomorskie Voivodship in the years 1999-2004<br />
źródło : Biuletyn Statystyczny Woj. Pomorskiego (wyd. miesięczne i kwartalne z lat 2000-2004)<br />
source: Statistical Bulletin of the Pomorskie Voiv. (month. and quart. editions, 2000-2004)<br />
Apartments com<strong>pl</strong>eted in Gdañsk, Sopot<br />
& Gdynia in the years 1998-2004<br />
In Gdańsk the largest number of fl ats in the years 1998 – 2003 was com<strong>pl</strong>eted<br />
in the 4 th quarter, the exception was the year 2000 (a few bigger investemens<br />
were delayed until the 1 st quarter of 2001). The 4 th quarter was<br />
the most popular period of fi nishing the fl ats also in Gdynia and Sopot.<br />
2000 was the worst year of the period in subject, the decline could be<br />
observed in all Tri-city, only 2001 brought a systematic augmentation<br />
of the number of com<strong>pl</strong>eted fl ats. A good result in the 1 st quarter<br />
and the construction <strong>pl</strong>ans of the developers for this year disposed towards<br />
optimism. Unfortunately both 2nd and 3rd quarters were the worst since<br />
2001. Sopot is an exception.<br />
wykres 43 i tabela 15. Mieszkania oddane do użytku w Sopocie w latach 1998-2004<br />
źródło : Biuletyn Statystyczny Woj. Pomorskiego (wyd. mies. i kwart., 1998-2004)<br />
* bez I, II kwartału 2004<br />
Zmiana œredniej powierzchni mieszkania<br />
w I, II i III kwartale 2004<br />
Średnia powierzchnia oferowanych mieszkań w III kwartale wzrosła<br />
w stosunku do II kwartału i wynosi obecnie 65,02 mkw.<br />
II kwartał 2004<br />
3 rd quarter 2004<br />
II kwartał 2004<br />
2 nd quarter 2004<br />
I kwartał 2004<br />
1 st quarter 2004<br />
graph 43 & table 15. Apartments com<strong>pl</strong>eted in Sopot in the years 1998-2004<br />
source: Statistical Bulletin of the Pomorskie Voiv. (monthly and quarterly editions,1998-2004)<br />
* excludingt 1 st , 2 nd quarter of 2004<br />
Evolution of average apartment metric area<br />
in 1 st , 2 nd , 3 rd quarter of 2004<br />
The average living area of the fl ats in offer in 3 rd quarter is larger in comparison<br />
to the one of 2 nd quarter and is now 65,02 sqm.<br />
65,02<br />
62,95<br />
58,30<br />
0,00 20,00 40,00 60,00 80,00<br />
1 200<br />
okres<br />
period<br />
1998 1999 2000 2001 2002 2003 2004<br />
suma<br />
total<br />
wykres 44. Zmiana średniej powierzchni mieszkania w I, II, III kwartale 2004<br />
źródło / source: www.tabelaofert.<strong>pl</strong><br />
graph 44. Evolution of average apartment metric area in 1 st , 2 nd , 3 rd quarter of 2004<br />
1 000<br />
800<br />
600<br />
400<br />
200<br />
0<br />
I kwartał<br />
1 st quarter<br />
wykres 41 i tabela 13. Mieszkania oddane do użytku w Gdańsku w latach 1998-2004<br />
źródło : Biuletyn Statystyczny Woj. Pomorskiego (wyd. mies. i kwart., 1998-2004)<br />
* bez I, II, III kwartału 2004<br />
1 200<br />
1998 1999 2000 2001 2002 2003 2004<br />
II kwartał<br />
2 nd quarter<br />
III kwartał<br />
3 rd quarter<br />
IV kwartał<br />
4 th quarter<br />
I kwartał<br />
1 st quarter<br />
II kwartał<br />
2 nd quarter<br />
III kwartał<br />
3 rd quarter<br />
IV kwartał<br />
4 th quarter<br />
suma<br />
total<br />
213 113 174 607 348 675 674 2 130*<br />
199 187 203 121 894 428 246 2 032*<br />
313 193 293 82 629 807 410 2 317*<br />
402 572 81 291 1 053 1 088 3 487<br />
1 127 1 066 751 1 101 2 924 2 998 10 640<br />
graph 41 & table 13. Apartments com<strong>pl</strong>eted in Gdańsk in the years 1998-2004<br />
source: Statistical Bulletin of the Pomorskie Voiv. (monthly and quarterly editions,1998-2004)<br />
* excludingt 1 st , 2 nd , 3 rd quarter of 2004<br />
okres<br />
period<br />
1998 1999 2000 2001 2002 2003 2004<br />
suma<br />
total<br />
Cena metra kwadratowego<br />
W III kwartale 2004 roku średnia cena mkw. w Trójmieście wynosiła 2 963 zł,<br />
co oznacza spadek w stosunku do II kwartału średnio o ponad 150 zł na<br />
metrze kwadratowym.<br />
Dwie najliczniejsze grupy stanowią mieszkania w cenie mkw. od 2 000<br />
do 2 500 zł oraz od 2 500 do 3 000 zł (odpowiednio ponad 30% i ponad 31%<br />
oferowanych lokali), są to najtańsze z oferowanych mieszkań i cieszą się<br />
największym zainteresowaniem „Kowalskich” (odpowiednio 43,6% i 38,1%<br />
udziału w popycie).<br />
Na trzecim miejscu popytowym <strong>pl</strong>asują się mieszkania najdroższe (apartamenty),<br />
w cenie powyżej 6 000 zł/mkw. W porównaniu z II kwartałem, udział<br />
mieszkań luksusowych w ofercie sprzedaży zmniejszył się o ok. 10% i obecnie<br />
w tej grupie lokali mamy do czynienia z nadpopytem.<br />
Oferta sprzedaży mieszkań w cenie mkw. od 3 000 do 4 000 zł (niemal 30%<br />
podaży) wydaje się przekraczać możliwości finansowe zainteresowanych<br />
zakupem – w tym przedziale cenowym notujemy jedynie 7,7% popytu.<br />
Price per square metre<br />
In the 3 rd quarter of 2004 the average price of a sqm in Tri-city was 2 963<br />
zł, which means a drop in comparison to the 2 nd quarter on avearage by<br />
over 150 zł per sqm.<br />
The two most numerous groups comprise of the fl ats where a price of<br />
a square metre is between 2 000 and 2 500 zł and between 2 500<br />
and 3 000 zł (over 30% and over 31% of the fl ats in offer respectively),<br />
these are the cheapest of the fl ats in offer and they enjoy the greatest<br />
interest of “the Smiths” (43,6% i 38,1% of the share of the demand respectiverly).<br />
The third position in the demand is held by the most expensive fl ats (condominiums),<br />
with a price over 6 000 zł/sqm. In comparison with the 2 nd<br />
quarter the share of the luxury fl ats in the sales dropped by ca. 10% and at<br />
the moment this group of fl ats shows over-demand.<br />
The sales offer of fl ats where the price of a square metre is between 3 000<br />
and 4 000 zł (almost 30% of the sup<strong>pl</strong>y) seems to be exceed the fi nancial<br />
possibilities of the prospective buyers – this price division shows only 7,7%<br />
of the demand.<br />
1 000<br />
800<br />
600<br />
400<br />
200<br />
0<br />
1998 1999 2000 2001 2002 2003 2004<br />
I kwartał<br />
1 st quarter<br />
II kwartał<br />
2 nd quarter<br />
III kwartał<br />
3 rd quarter<br />
IV kwartał<br />
4 th quarter<br />
256 34 163 307 167 434 462 1 823*<br />
143 189 292 245 298 325 102* 1 492<br />
515 212 378 200 231 391 111* 1 927<br />
249 1 096 196 538 526 319 2 926<br />
II kwartał 2004<br />
3 rd quarter 2004<br />
II kwartał 2004<br />
2 nd quarter 2004<br />
2 963<br />
3 117<br />
cena mkw. (PLN)<br />
price per sqm (PLN)<br />
udział w popycie<br />
share in demand<br />
udział w ofercie<br />
sprzedaży<br />
share in sales offer<br />
do/to 2 000 0,5% 0,5%<br />
od/from 2000 do/to 2 500 43,6% 30,6%<br />
od/from 2 500 do/to 3 000 38,1% 31,2%<br />
od/from 3 000 do/to 3 500 5,0% 21,2%<br />
I kwartał<br />
1 st quarter<br />
wykres 42 i tabela 14. Mieszkania oddane do użytku w Gdyni w latach 1998-2004<br />
źródło : Biuletyn Statystyczny Woj. Pomorskiego (wyd. mies. i kwart., 1998-2004)<br />
* bez I, II, III kwartału 2004<br />
II kwartał<br />
2 nd quarter<br />
III kwartał<br />
3 rd quarter<br />
IV kwartał<br />
4 th quarter<br />
suma<br />
total<br />
1 163 1 531 1 029 1 290 1 224 1 469 8 168<br />
graph 42 & table 14. Apartments com<strong>pl</strong>eted in Gdynia in the years 1998-2004<br />
source: Statistical Bulletin of the Pomorskie Voiv. (monthly and quarterly editions,1998-2004)<br />
* excludingt 1 st , 2 nd , 3 rd quarter of 2004<br />
I kwartał 2004<br />
1 st quarter 2004<br />
2 948<br />
0 1 000 2 000 3 000 4 000<br />
od/from 3 500 do/to 4 000 2,7% 8,6%<br />
od/from 4 000 do/to 4 500 1,6% 3,9%<br />
od/from 4 500 do/to 5 000 1,0% 1,0%<br />
od/from 5000 do/to 6 000 1,9% 1,3%<br />
powyżej/over 6 000 5,6% 1,6%<br />
wykres 45. Zmiana średniej ceny mkw. mieszkania w I i II kwartale 2004<br />
graph 45. Evolution of average apartment price per sqm in 1 st & 2 nd quarter of 2004<br />
źródło / source: www.tabelaofert.<strong>pl</strong><br />
tabela 16. Popyt i podaż w poszczególnych przedziałach ceny mkw.<br />
table 16. Demand and sup<strong>pl</strong>y by price per sqm sections<br />
źródło / source: www.tabelaofert.<strong>pl</strong><br />
34 35