o_19l9j223vvmv2drsq2158817sia.pdf

You also want an ePaper? Increase the reach of your titles
YUMPU automatically turns print PDFs into web optimized ePapers that Google loves.
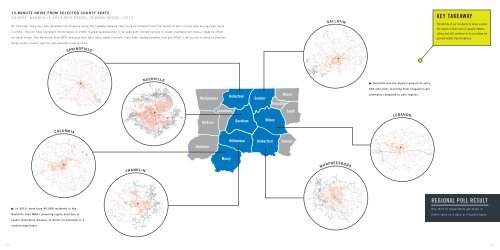
15-MINUTE DRIVE FROM SELECTED COUNTY SEATS<br />
SOURCE: NASHVILLE AREA MPO TRAVEL DEMAND MODEL, 2014<br />
On this map, the gray lines represent the distance along the roadway network that could be traveled from the center of each county seat during peak hours<br />
in 2010. The red lines represent the distance in 2040. A growing population in an area with limited options to widen roadways will have a negative effect<br />
on travel times. The Nashville Area MPO forecasts that total daily travel time will more than double between now and 2040 if we do not do more to provide<br />
better public transit options and walkable communities.<br />
GALLATIN<br />
KEY TAKEAWAY<br />
The ability of our residents to move around<br />
the region in their cars is quickly deteriorating<br />
and will continue to do so unless we<br />
provide better transit options.<br />
SPRINGFIELD<br />
NASHVILLE<br />
Nashville has the highest amount of extra<br />
C02 emissions resulting from congestion per<br />
Montgomery<br />
Robertson<br />
Sumner<br />
Trousdale<br />
Macon<br />
commuter compared to peer regions.<br />
Dickson<br />
Cheatham<br />
Davidson<br />
Wilson<br />
Smith<br />
LEBANON<br />
COLUMBIA<br />
Hickman<br />
Williamson<br />
Rutherford<br />
Cannon<br />
Maury<br />
FRANKLIN<br />
MURFREESBORO<br />
REGIONAL POLL RESULT<br />
In 2010, more than 96,000 residents in the<br />
Nashville Area MPO’s planning region died due to<br />
One-third of respondents get stuck in<br />
traffic jams on a daily or frequent basis.<br />
cardio-respiratory disease, to which air pollution is a<br />
contributing factor.<br />
10<br />
11