Eigenplaces for Segmenting Exhibition Space
Eigenplaces for Segmenting Exhibition Space
Eigenplaces for Segmenting Exhibition Space

You also want an ePaper? Increase the reach of your titles
YUMPU automatically turns print PDFs into web optimized ePapers that Google loves.
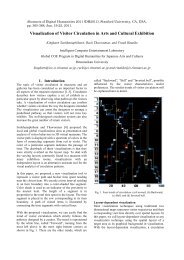
<strong>Eigenplaces</strong> <strong>for</strong> <strong>Segmenting</strong> <strong>Exhibition</strong> <strong>Space</strong><br />
Kingkarn Sookhanaphibarn, Ruck Thawonmas, and Frank Rinaldo<br />
Department of Human and Computer Intelligence<br />
Ritsumeikan University<br />
1-1-1, Noji-higashi, Kusatsu, Shiga, 525-8577, Japan<br />
email: kingkarn@ice.ci.ritsumei.ac.jp, ruck@ci.ritsumei.ac.jp, rinaldo@is.ritsumei.ac.jp<br />
KEYWORDS<br />
Visitor Circulation; Eigendecomposition; Museum Environment;<br />
Virtual Worlds;<br />
ABSTRACT<br />
In this paper, we aim at segmenting exhibition space inherent<br />
in circulation behavior of visitors in a museumlike<br />
environment such as a virtual gallery in Second Life<br />
or even a real museum at MIT. The segmentation of exhibition<br />
space can be achieved with eigenplaces, which is<br />
the eigendecomposition of the covariance matrix of the<br />
characteristic vectors obtained from visitor dwell time<br />
<strong>for</strong> each time slot. <strong>Eigenplaces</strong> take advantage of the<br />
capability of showing the (first, second, third, and <strong>for</strong>th)<br />
most important circulation behavior of visitors as well<br />
as examining the degree of dominance of their corresponding.<br />
We, then, adopted the theory of graph spectra<br />
<strong>for</strong> partitioning the exhibit spaces. In experiments,<br />
we applied the segmentation approach to the data set<br />
obtained from the virtual and real museums: 36 avatars<br />
at the Ritsumeikan gallery in Second Life and 45 real visitors<br />
at the MIT museum in order to discovering groups<br />
of strongly coherent exhibits.<br />
INTRODUCTION<br />
In museums and galleries, the arrangement of their<br />
collections is one of the most important key factors<br />
that affect visitor impression and satisfaction. The<br />
curators, who are in charge of the collections, decide<br />
how the objects will be displayed and arranged. They<br />
present the collections in an exhibit based on the<br />
coherence between objects so that the well-arranged<br />
exhibit can tell the story to the visitors. Consequently,<br />
the efficiency of the exhibit arrangement has depended<br />
upon curators’ experience.<br />
The visitor circulation through museums and galleries<br />
will determine what visitors will see, where they focus<br />
their attention, and, ultimately, what they learn and/or<br />
experience Hillier and Tzortzi [1976], Penn [2003].<br />
The move of visitors is not dominated by exhibits but<br />
implicitly driven by the space syntax as investigated<br />
by Penn [2003]. However, the observation time that<br />
a visitors spends on a particular exhibit corresponds<br />
to the visitor attention and interest. A number of<br />
researches have been published on how people move<br />
through museums <strong>for</strong> many years but none of them<br />
addressed the exhibit arrangement correlating to the<br />
observation time of visitors.<br />
Related to location-based games, people plays the<br />
games related to their location via their GPS-based<br />
device Yiannoutsou et al. [2009], Dini et al. [2007].<br />
Such games have a purpose to improve museum visits<br />
and entertain visitors especially school kids. The<br />
visitor records during their museum trip are also useful<br />
<strong>for</strong> enhancing the the functionalities of exhibitions<br />
including collecting, organizing, displaying, etc. On<br />
the other words, the byproduct of these games is an<br />
implicit indicator reflecting to the engagement and<br />
enjoyment of visitors.<br />
In this paper, we introduce how to apply eigenplaces<br />
to a problem of exhibit arrangement. <strong>Eigenplaces</strong> are<br />
derived from the covariance matrix of visitor circulation.<br />
We can partition off the exhibit space by grouping<br />
together similar objects in the same partition. The<br />
objects in the exhibit judged as the same or different<br />
groups are determined by the set of primary behaviors<br />
of the visitors. The primary behaviors are derived from<br />
the repeating and common movements of visitors in<br />
the same space. For example, in a museum, the most<br />
popular objects where a number of visitors spend more<br />
time are a potential factor to construct the common<br />
behavior structures.<br />
To validate our proposed approach, we tested the approach<br />
against the synthesized data of 36 visitors following<br />
the four characteristics of visitor styles as well as<br />
the real visitor data from a MIT museum.<br />
PREVIOUS WORK<br />
In our previous works in [Sookhanaphibarn and Thawonmas,<br />
2010], the analysis of the visitor circulation in<br />
museums and galleries has been investigated in a virtual<br />
world. Their findings can take advantage of classifying<br />
and identifying the visitor types <strong>for</strong> a guide system
Table 1: Eigenvalues and the corresponding eigenvectors <strong>for</strong> the MIT exhibition space<br />
<strong>Eigenplaces</strong> (exhibits)<br />
Score(%) Eigenvalues ξ 1 ξ 2 ξ 3 ξ 4 ξ 5 ξ 6 ξ 7 ξ 8 ξ 9 ξ 10 ξ 11 ξ 12<br />
55.91 35.80 v 1 -0.2 -0.3 -0.3 -0.2 -0.4 -0.3 -0.2 -0.2 -0.3 -0.3 -0.3 -0.3<br />
64.11 13.70 v 2 -0.6 -0.4 0.0 -0.1 0.2 0.2 -0.1 0.2 0.4 0.3 0.0 -0.1<br />
71.31 12.85 v 3 0.2 -0.3 -0.4 -0.4 0.4 0.3 0.4 -0.2 -0.2 -0.2 0.0 0.2<br />
78.08 12.45 v 4 -0.2 0.1 0.3 0.2 0.4 0.2 0.3 -0.1 -0.2 -0.2 -0.4 -0.6<br />
84.18 11.82 v 5 0.1 -0.1 0.1 0.0 -0.2 -0.2 0.5 0.3 0.2 0.1 -0.7 0.3<br />
88.52 9.97 v 6 -0.3 -0.1 0.1 0.3 0.0 0.2 -0.1 -0.4 -0.5 0.3 -0.2 0.5<br />
in museums and exhibitions. In terms of in<strong>for</strong>mation<br />
visualization, that paper introduced the visualization<br />
<strong>for</strong> guiding curators to rotate the museum items and<br />
arrange the sequence of items. The approach indicated<br />
the interesting or skipped items associated with the<br />
visiting styles.<br />
Eigendecomposition is adapted in many applications as<br />
follows: As Eagle and Pentland [Eagle and Pentland,<br />
2009] concluded, the behavior structures become more<br />
apparent when the behavior is temporally, spatially,<br />
and socially contextualized, the visitor circulation in<br />
the museum space will be dominated by a set of primary<br />
structures. Sookhanaphibarn et al. [2010] introduced<br />
an eigenbehavior-based approach to determine the<br />
primary behaviors of players’ movements by extracting<br />
their repeating structures. The repeating and common<br />
structures are identifiable movement directions of players<br />
in the same virtual space. Their proposed technique<br />
is employed in a Massively Multiplayer Online Game<br />
(MMOG). This is because the locations where players<br />
go to receive a service, such as, a quest or assistance,<br />
are a potential factor to construct the common behavior<br />
structures.<br />
<strong>Eigenplaces</strong> are named by Calabrese et al. [2010] who<br />
applied eigendecomposition to extract the discriminant<br />
features from the time-series data (the aggregated network<br />
usage). They analyzed and categorized wireless<br />
access points based on common usage characteristics<br />
that reflect real-world, place-based behaviors. The resulting<br />
eigenplaces have implications <strong>for</strong> research across<br />
arrange of wireless technologies as well as potential<br />
applications in network planning, traffic an tourism<br />
management, and even marketing.<br />
PURPOSED APPROACH<br />
<strong>Eigenplaces</strong><br />
For segmenting a museum-like space, we represented<br />
the dwell time of visitors proximity to an exhibit as a<br />
vector and assembled the observations from all visitors<br />
into a single covariance matrix. Applying eigendecomposition<br />
to visitor circulation data yields many<br />
eigenvector and coefficient pairs; the latter’s magnitude<br />
establishes the vectors’s ranking according to their<br />
value in reconstituting the original data. Using the<br />
mean-square-error test, we can determine the number<br />
of pairs that is required to lower this error.<br />
Theory of Graph Spectra<br />
According to the Rayleigh-Ritz theorem Merris [1998],<br />
the components of the eigenvector with the second<br />
largest eigenvalue give a cluster weight assignment<br />
which is orthogonal to the cluster weight assignment<br />
(eigenvector) with the largest eigenvalue. Thus, we<br />
can use this orthogonality constraint to define disjoint<br />
clusters.<br />
Any two exhibits (ξ i , ξ j ) are in the same cluster by<br />
considering the components of an eigenplace that denotes<br />
the exhibit ξ i in the associate cluster. Following<br />
the a<strong>for</strong>ementioned definition, the function of testing<br />
whether two exhibits are in the same cluster, Ψ(ξ i , ξ j ),<br />
is written below where the considering set of eigenplaces<br />
is denoted by V ′ .<br />
{<br />
1 ; ∀k∈V ′(sign(v<br />
Ψ(ξ i , ξ j ) =<br />
kξi ) = sign(v kξj ))<br />
0 ; otherwise<br />
(1)<br />
Let us describe how to employ Equation (1) by example.<br />
Suppose that we have already obtained a set of eigenplaces<br />
of the visitor circulation at the MIT museum as<br />
shown in Table 1. Given V ′ = {v 1 , v 2 , v 3 }, we will have<br />
four resulting clusters as follows: [1,7,12],[2,3,4],[5,6,11],<br />
and [8,9,10].<br />
<strong>Segmenting</strong> Exhibit <strong>Space</strong> Algorithm(SESA)<br />
Given a set of visitor dwell time associated with various<br />
exhibits, our segmentation algorithm consists of the<br />
following steps:<br />
1. Compute a visitor association with each exhibit<br />
by using the Logarithmic trans<strong>for</strong>mation of visitor<br />
dwell time.<br />
2. Construct an association matrix representation, X,
where each row referred to as a summary of a visitor’s<br />
association with various exhibits during a<br />
given time slot.<br />
3. Per<strong>for</strong>m Singular Value Decomposition (SVD) of<br />
the association matrix X.<br />
X = U · Σ · V T (2)<br />
Number of Exhibits<br />
500<br />
400<br />
300<br />
200<br />
100<br />
0<br />
9 27 45 63 81 99 117 135 153 171<br />
Dwell Time (sec)<br />
4. Compute the significance score (score) that is correlated<br />
with the percentage of power in the original<br />
matrix X captured in the rank-k reconstruction by<br />
using the equation below:<br />
∑ k<br />
i=1<br />
Score(%) = 100 ×<br />
σ2 i<br />
∑ Rank(X)<br />
(3)<br />
i=1<br />
σi<br />
2<br />
5. Indicate a set of primary <strong>Eigenplaces</strong> v i with a desired<br />
significance score.<br />
6. Partition the exhibits with the set of primary eigenplaces.<br />
Note that the SESA algorithm uses the natural Log<br />
trans<strong>for</strong>mation of the visitor dwell time because there is<br />
evidence of substantial skew in the raw data as shown<br />
in Fig. 1 (a) and Fig. 2 (a) . After applying the data<br />
trans<strong>for</strong>mation, the logarithm of the dwell time is called<br />
the visitor association and its histogram is shown in<br />
Fig. 1 (b) and Fig. 2 (b).<br />
For Step 2, the association matrix is X = {x ij } where<br />
an entry represents the dwell time of i th visitor stopping<br />
at the j th object. In other words, each column vector<br />
corresponds to the popularity <strong>for</strong> an object across<br />
time as well as each row vector corresponding to an<br />
association vector <strong>for</strong> a time slot.<br />
EXPERIMENTS ON TWO USE CASES<br />
For validating the effectiveness of the SESA, we use two<br />
data sets:<br />
1. The data set obtained from [Sookhanaphibarn and<br />
Thawonmas, 2010] and based on the four animal<br />
metaphors.<br />
2. The data set obtained by Sparacino as addressed<br />
in [Sparacino, 2001] <strong>for</strong> developing ”The Museum<br />
Wearable project.”<br />
We describe the data set and its representation following<br />
the obtained findings with implications.<br />
Ritsumeikan Digital Archiving Pavilion (RDAP)<br />
in Second Life<br />
We synthesized the visitor trajectories based on the<br />
metaphor of four animals – Ant, Fish, Grasshopper, and<br />
Number of Exhibits<br />
300<br />
250<br />
200<br />
150<br />
100<br />
50<br />
0<br />
0 1 2 3 4 5 6<br />
Log [ Dwell Time (sec) ]<br />
e<br />
Figure 1: Histogram of visitor dwell time at a set of<br />
exhibits in the MIT museum.<br />
Number of Exhibits<br />
Number of Exhibits<br />
300<br />
250<br />
200<br />
150<br />
100<br />
50<br />
0<br />
0 50 100 150<br />
Dwell Time (sec)<br />
200<br />
150<br />
100<br />
50<br />
0<br />
0 0.5 1 1.5 2 2.5 3 3.5 4 4.5 5<br />
Log e<br />
[ Dwell Time (sec) ]<br />
Figure 2: Histogram of visitor dwell time at a set of<br />
exhibits in the virtual Ritsuemikan gallery (RDAP).<br />
Eigenvector value<br />
0.6<br />
0.4<br />
0.2<br />
0<br />
−0.2<br />
−0.4<br />
−0.6<br />
−0.8<br />
V1<br />
V2<br />
V3<br />
V4<br />
1 2 3 4 5 6 7 8 9 10 11 12 13 14<br />
<strong>Exhibition</strong> Number<br />
Figure 3: <strong>Eigenplaces</strong> of the exhibit space in the MIT<br />
museum of 12 exhibits where the four symbols (dot, diamond,<br />
square shape and asterisk) are used to represent<br />
v 1 , v 2 , v 3 , and v 4 .
Eigenvector value<br />
0.5<br />
0.4<br />
0.3<br />
0.2<br />
0.1<br />
0<br />
−0.1<br />
−0.2<br />
−0.3<br />
V1<br />
V2<br />
V3<br />
V4<br />
when the significance score was initially set to 78.08%<br />
and 93.48%, respectively. Four eigenplaces of the<br />
associated matrix of the MIT and RDAP exhibitions<br />
are shown in Figures 3 and 4, respectively. Basically,<br />
the first eigenplace cannot be used <strong>for</strong> partition because<br />
its components are all negative (even or all positive).<br />
When increasing the size of set V ′ , we can obtain more<br />
number of cluster where the size of clusters will be<br />
smaller. The resulting segmentation of exhibit space<br />
according to both MIT and RDAP is shown in Figures 5<br />
and 6, respectively.<br />
−0.4<br />
−0.5<br />
1 2 3 4 5 6 7 8 9 10 11 12 13 14 15 16 17 18 19<br />
<strong>Exhibition</strong> Number<br />
Figure 4: <strong>Eigenplaces</strong> of the exhibit space in the RDAP<br />
of 19 exhibits where the four symbols (dot, diamond,<br />
square shape and asterisk) are used to represent v 1 , v 2 ,<br />
v 3 , and v 4 .<br />
Butterfly visiting styles– as defined in [Sookhanaphibarn<br />
and Thawonmas, 2010]. These styles are as follows:<br />
1. The ant visitors spend quite a long time to observe<br />
all exhibits and walk close to exhibits, but avoid<br />
empty spaces.<br />
2. The fish visitors prefer to move to and stop over at<br />
empty spaces, but avoid areas near exhibits.<br />
3. The grasshopper visitors spend a long time to see<br />
selected exhibits, but ignore the rest of exhibits.<br />
4. The butterfly visitors observe almost all exhibits,<br />
but spend varied times to observe each exhibit.<br />
The total number of synthesized trajectories is 36 where<br />
each visiting style has nine trajectories in the 3D virtual<br />
museum, named RDAP. RDAP, owned by the Global<br />
Center of Excellent in Digital Humanities Center <strong>for</strong><br />
Japanese Arts and Cultures, of Ritsumeikan University,<br />
was created in Second Life. An objective of RDAP is<br />
to disseminate Japanese costumes, Kimonos, preserved<br />
them in a digital achieving system.<br />
The MIT museum<br />
We applied our approach to the visitor tracking in<strong>for</strong>mation<br />
from 45 visitors. The visitor in<strong>for</strong>mation is raw<br />
data, that is the number of seconds that visitors stayed<br />
in front of the corresponding objects. All these objects<br />
were visited in a linear sequence, that is one after the<br />
next, with no repetitions or change of path. The total<br />
number of objects is 12.<br />
Results and Their Implications<br />
We found that the segmentation of the exhibit space of<br />
MIT and RDAP can be achieved with four eigenplaces<br />
For the MIT exhibition space, the following implications<br />
will be beneficial <strong>for</strong> the designers and curators.<br />
There are some groups of exhibits [1,12], [2,4], [8,9,10]<br />
with the strong relevance as shown by their scores of<br />
greater than 84.18%. In some situations such as the<br />
re-arrangement of exhibits, the designers should not<br />
disperse groups [2,4] or [8,9,10], but replace a group of<br />
them with another. The resulting segmentation also<br />
reveals that the first and last exhibits as analogous<br />
to the introduction and conclusion parts because the<br />
group [1,12] has the strong relevance.<br />
Since we used the synthesized data set of visitors in the<br />
RDAP exhibition space, the clusters would be rather<br />
related to the four visiting styles (ant, fish, grasshopper,<br />
and butterfly). To understand the implications, we must<br />
interpret the result based on the visiting styles as well<br />
as the gallery layout and the segmenting space. They<br />
are as shown in Figures 7. The findings are summarized<br />
below.<br />
1. By V ′ = {v 1 , v 2 }, two clusters [1-9,17-19] and [10-<br />
16] correspond to the common visited items and the<br />
rarely visited items, respectively. This results from<br />
the butterfly visitors who likely skip only a few.<br />
2. By V ′ = {v 1 , v 2 , v 3 }, two interesting clusters are<br />
[1,8-9,17-19] and [15-16].<br />
(a) The <strong>for</strong>mer is fragmented from the common<br />
visited items because they are arranged at the<br />
entrance of hallway and the end. This group of<br />
[1,8-9,17-19] has received more attention than<br />
group of [2-7]. Although the fish visitors preferred<br />
to observe the atmosphere, they often<br />
stopped near the entrance of hallway and the<br />
end. This is a reason of segmenting [1,8-9,17-<br />
19] into [1,8-9,17-19] and [2-7].<br />
(b) The latter is fragmented from the rarely visited<br />
items because they are placed near T-<br />
junction that a small number of visitors would<br />
stop at them. If they stopped at 15, they<br />
would be stop at 16 but not further continue<br />
13, 14. This might causes from the butterfly<br />
and grasshopper visitors.
CONCLUSIONS<br />
This paper introduces how to use eigenplaces with theory<br />
of graph spectra as potentially valuable applications<br />
<strong>for</strong> designing exhibition space and arranging exhibit<br />
items. The dwell time during their trip in exhibition<br />
is used <strong>for</strong> identifying a degree of visitor attention<br />
and exhibit interesting. To validate our approach, two<br />
use cases shows that our approach is practical <strong>for</strong> a real<br />
application in both real and virtual worlds.<br />
REFERENCES<br />
F. Calabrese, J. Reades, and C. Ratti. <strong>Eigenplaces</strong>: segmenting<br />
space through digital signatures. Pervasive<br />
Computing, IEEE, 9(1):78–84, 2010.<br />
Figure 5: Cluster tree of exhibits in the MIT.<br />
R. Dini, F. Paternò, and C. Santoro. An environment<br />
to support multi-user interaction and cooperation <strong>for</strong><br />
improving museum visits through games. In Proceedings<br />
of the 9th international conference on Human<br />
computer interaction with mobile devices and services,<br />
pages 515–521. ACM, 2007.<br />
N. Eagle and A. Pentland. Eigenbehaviors: identifying<br />
structure in routine. Behavioral Ecology and Sociobiology,<br />
63:1057–1066(10), 2009.<br />
B. Hillier and K. Tzortzi. <strong>Space</strong> syntax. A Companion<br />
to Museum Studies, pages 282–301, 1976.<br />
R. Merris. Laplacian graph eigenvectors. Linear algebra<br />
and its applications, 278(1-3):221–236, 1998.<br />
A. Penn. <strong>Space</strong> syntax and spatial cognition. Environment<br />
and Behavior, 35(1):30–65, 2003.<br />
Figure 6: Cluster tree of exhibits in the RDAP.<br />
K. Sookhanaphibarn and R. Thawonmas. Visualization<br />
and analysis of visiting styles in 3d virtual museums.<br />
In Digital Humanities 2010, Conference Abstracts<br />
Book. London UK, 2010.<br />
K. Sookhanaphibarn, R. Thawonmas, F. Rinaldo, and<br />
K. Chen. Spatiotemporal analysis in virtual environments<br />
using eigenbehaviors. In Proceedings of the 7th<br />
International Conference on Advances in Computer<br />
Entertainment Technology, pages 62–65. ACM, 2010.<br />
F. Sparacino. Sto(ry)chastics: a Bayesian network architecture<br />
<strong>for</strong> combined user modeling, sensor fusion,<br />
and computational storytelling <strong>for</strong> interactive spaces.<br />
PhD thesis, School of Architecture and Planning,<br />
MIT, USA, 2001.<br />
Figure 7: Resulting segmentation of RDAP: (a) Gallery<br />
layout of exhibits in the RDAP and (b)Segmentation<br />
of the exhibit space by using V ′ = {v 1 , v 2 , v 3 , v 4 } in<br />
the RDAP museum of 19 exhibits where areas with the<br />
same color belong to the same cluster .<br />
N. Yiannoutsou, I. Papadimitriou, V. Komis, and<br />
N. Avouris. Playing with museum exhibits: designing<br />
educational games mediated by mobile technology. In<br />
Proceedings of the 8th International Conference on Interaction<br />
Design and Children, pages 230–233. ACM,<br />
2009.