China's Telecommunications Universal Service in ... - Is.me.titech.ac.jp
China's Telecommunications Universal Service in ... - Is.me.titech.ac.jp
China's Telecommunications Universal Service in ... - Is.me.titech.ac.jp
Create successful ePaper yourself
Turn your PDF publications into a flip-book with our unique Google optimized e-Paper software.
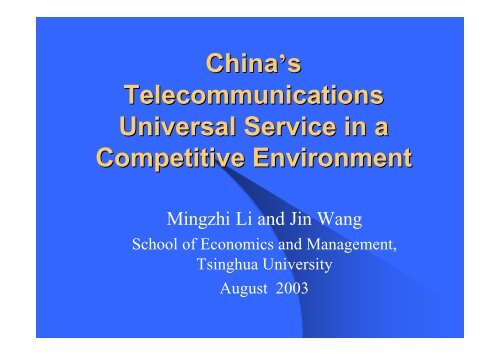
Ch<strong>in</strong>a’s<br />
<strong>Telecommunications</strong><br />
<strong>Universal</strong> <strong>Service</strong> <strong>in</strong> a<br />
Competitive Environ<strong>me</strong>nt<br />
M<strong>in</strong>gzhi Li and J<strong>in</strong> Wang<br />
School of Economics and Manage<strong>me</strong>nt,<br />
Ts<strong>in</strong>ghua University<br />
August 2003
Outl<strong>in</strong>e of the paper<br />
• Introduction<br />
• History of Telecom Deregulation and <strong>Universal</strong><br />
<strong>Service</strong> <strong>in</strong> Ch<strong>in</strong>a<br />
• Provision of <strong>Universal</strong> <strong>Service</strong> <strong>in</strong> a Competitive<br />
Environ<strong>me</strong>nt: Recipes from Economic Theory<br />
• International experience <strong>in</strong> telecommunications<br />
universal service<br />
• Conclusions: Steps for Provid<strong>in</strong>g Ch<strong>in</strong>a’s<br />
<strong>Universal</strong> <strong>Service</strong>s <strong>in</strong> <strong>Telecommunications</strong>
1. Introduction<br />
Why should we provide universal<br />
service <strong>in</strong> telecommunications
1. Introduction<br />
Reasons for Telecom <strong>Universal</strong> <strong>Service</strong>:<br />
• Necessity/Merit Goods<br />
• Network Externality<br />
• the concern for economic develop<strong>me</strong>nt and<br />
spatial <strong>in</strong>equality
Table 2 The GDP per Capita <strong>in</strong> The Three<br />
Regions (RMB yuan)<br />
1997<br />
1998<br />
1999<br />
Eastern<br />
region<br />
9298.877<br />
10032.02<br />
10693.4<br />
Central<br />
region<br />
4852.37<br />
5136.056<br />
5285.528<br />
Western<br />
region<br />
3810.008<br />
4051.929<br />
4216.937
Table 3 Level of Ch<strong>in</strong>a’s s <strong>Telecommunications</strong><br />
<strong>Service</strong> <strong>in</strong> 2001<br />
Telephone<br />
Penetration<br />
Rate<br />
Ma<strong>in</strong> L<strong>in</strong>e<br />
Ma<strong>in</strong><br />
L<strong>in</strong>es <strong>in</strong><br />
City<br />
Household<br />
Penetration<br />
Rate<br />
Public<br />
Phone Per<br />
Hundred<br />
Citizens<br />
Cell Phone<br />
Penetration<br />
Rate<br />
The whole<br />
nation<br />
(per hundred<br />
people)<br />
25.90<br />
(per<br />
hundred<br />
people)<br />
13.90<br />
(per<br />
hundred<br />
people)<br />
20.40<br />
(per<br />
hundred<br />
people)<br />
11.55<br />
(per<br />
hundred<br />
people)<br />
0.27<br />
(per hundred<br />
people)<br />
11.20<br />
Eastern<br />
41.47<br />
20.81<br />
21.24<br />
16.76<br />
0.40<br />
19.30<br />
Central<br />
20.35<br />
12.02<br />
18.14<br />
10.25<br />
0.20<br />
7.75<br />
Western<br />
16.97<br />
9.22<br />
21.68<br />
7.21<br />
0.23<br />
7.20
Table 1 Telephones per 100 people VS. GDP per capita<br />
<strong>in</strong> the year-end of 2001<br />
GDP per<br />
capita (? )<br />
Telephones l<strong>in</strong>es per 100<br />
people<br />
Western 5006.843 16.97<br />
Middle 6658.61 20.35<br />
Eastern 13539.87 41.47
Figure 1 <strong>Telecommunications</strong> f<strong>ac</strong>ilities per capita<br />
at the year-end of 2001<br />
GDP per capital<br />
15000<br />
10000<br />
5000<br />
0<br />
0 0.1 0.2 0.3 0.4 0.5<br />
telephones/people<br />
Source:
2. History of Telecom<br />
Deregualation and <strong>Universal</strong><br />
<strong>Service</strong> <strong>in</strong> Ch<strong>in</strong>a<br />
• History of <strong>Universal</strong> <strong>Service</strong> <strong>in</strong> Ch<strong>in</strong>a<br />
• Regional Disparity <strong>in</strong> Economic<br />
Develop<strong>me</strong>nt and <strong>Universal</strong> <strong>Service</strong> <strong>in</strong><br />
Ch<strong>in</strong>a
History of <strong>Universal</strong> <strong>Service</strong><br />
<strong>in</strong> Ch<strong>in</strong>a<br />
In the early 1990s, the monopoly provider<br />
of Ch<strong>in</strong>a’s telecommunications <strong>in</strong>dustry——<br />
Ch<strong>in</strong>a Telecom <strong>in</strong>itiated the massive project<br />
“telephone connection to every<br />
adm<strong>in</strong>istrative village <strong>in</strong> the rural districts”.
Percentage of Villages<br />
with Telephone Connection<br />
100.00%<br />
80.00%<br />
79.80%<br />
67.10%<br />
60.00% 53.50% 55.60%<br />
40.00%<br />
20.00%<br />
0.00%<br />
1996 1997 1998 1999
History of <strong>Universal</strong> <strong>Service</strong><br />
<strong>in</strong> Ch<strong>in</strong>a<br />
In 1999, Ch<strong>in</strong>a Telecom was broken up .<br />
The entire telecommunication <strong>in</strong>dustry was<br />
made up of seven operat<strong>in</strong>g companies ——<br />
Ch<strong>in</strong>a Telecom, Ch<strong>in</strong>a Unicom, Ch<strong>in</strong>a<br />
Netcom, Ch<strong>in</strong>a Jitong, Ch<strong>in</strong>a Railcom and<br />
Ch<strong>in</strong>a Satellite. However, the universal<br />
service was still born by “Ch<strong>in</strong>a Telecom”.
History of <strong>Universal</strong> <strong>Service</strong><br />
In 2002, ch<strong>in</strong>a’s<br />
telecommunications<br />
<strong>in</strong>dustry experienced a<br />
second round of reform.<br />
The market of<br />
telecommunication is now<br />
made up of six operat<strong>in</strong>g<br />
companies——Ch<strong>in</strong>a<br />
Telecom, Ch<strong>in</strong>a Netcom,<br />
Ch<strong>in</strong>a Mobile, Ch<strong>in</strong>a<br />
Unicom, Ch<strong>in</strong>a Satellite<br />
and Ch<strong>in</strong>a Railcom .<br />
<strong>in</strong> Ch<strong>in</strong>a<br />
Figure 2 the market share of ch<strong>in</strong>a's<br />
telecommunication <strong>in</strong>dustry <strong>in</strong> 2002<br />
17.20%<br />
11.30% 1.10%<br />
33.80%<br />
ch<strong>in</strong>a mobile<br />
ch<strong>in</strong>a telecom<br />
ch<strong>in</strong>a netcom<br />
ch<strong>in</strong>a unicom<br />
ch<strong>in</strong>a sat and ch<strong>in</strong>arailcom<br />
36.60%
<strong>Universal</strong> <strong>Service</strong> Process Slowed<br />
down after Deregulation<br />
Increase of Telephone Connection <strong>in</strong> <strong>Ch<strong>in</strong>a's</strong><br />
Rural Areas<br />
10 thousand<br />
2000<br />
1763 1630<br />
1000<br />
1003<br />
0<br />
2000 2001 2002
Percentage of Villiages with Telephone Connection<br />
150.00%<br />
100.00%<br />
50.00%<br />
0.00%<br />
85.30% 96%<br />
Whole<br />
nation<br />
East<br />
73%<br />
40%<br />
West Q<strong>in</strong>ghai<br />
Prov<strong>in</strong>ce<br />
55%<br />
Gansu<br />
Prov<strong>in</strong>ce
History of <strong>Universal</strong> <strong>Service</strong> <strong>in</strong><br />
Ch<strong>in</strong>a<br />
Market Monopoly Competition<br />
<strong>Universal</strong><br />
<strong>Service</strong> Ch<strong>in</strong>a telecom ????<br />
Provider
3. Provision of <strong>Universal</strong><br />
<strong>Service</strong> <strong>in</strong> a Competitive<br />
Environ<strong>me</strong>nt: Recipes from<br />
Economic Theory
Monopoly: Cross-Subsidy
In a Competitive Environ<strong>me</strong>nt<br />
Case 1: Sym<strong>me</strong>tric Entrance
In a Competitive Environ<strong>me</strong>nt<br />
Case 1: Asym<strong>me</strong>tric Entrance
Provision of <strong>Universal</strong> <strong>Service</strong> <strong>in</strong> a<br />
Competitive Environ<strong>me</strong>nt: Recipes<br />
from Economic Theory<br />
monopoly<br />
competition<br />
Fund<strong>in</strong>g:<br />
cross-subsidy<br />
• general tax system<br />
• universal service fund<br />
Provision: the monopoly<br />
the w<strong>in</strong>ner <strong>in</strong> auction
4. International Experience<br />
<strong>in</strong> <strong>Telecommunications</strong><br />
<strong>Universal</strong> <strong>Service</strong><br />
• the United States<br />
• Peru
5. Conclusions: Steps for<br />
Provid<strong>in</strong>g Ch<strong>in</strong>a’s s <strong>Universal</strong><br />
<strong>Service</strong>s <strong>in</strong><br />
<strong>Telecommunications</strong><br />
First, sett<strong>in</strong>g the goals and scopes of<br />
universal service <strong>in</strong> telecommunications
Table 4: Five Stages of <strong>Universal</strong> <strong>Service</strong> <strong>in</strong><br />
<strong>Telecommunications</strong>
Second, determ<strong>in</strong><strong>in</strong>g quality require<strong>me</strong>nt<br />
and pric<strong>in</strong>g policy
Third, choose the source of fund<strong>in</strong>g for<br />
universal service.
Fourth, choos<strong>in</strong>g the provider of universal<br />
service


