1 FUNCTIONS AND MODELS
1 FUNCTIONS AND MODELS
1 FUNCTIONS AND MODELS

You also want an ePaper? Increase the reach of your titles
YUMPU automatically turns print PDFs into web optimized ePapers that Google loves.
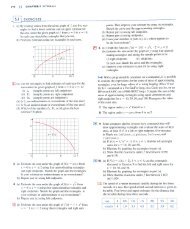
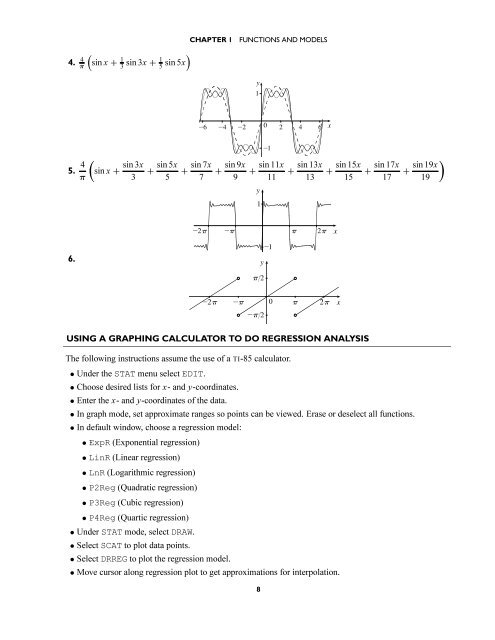
4.<br />
)<br />
4<br />
π<br />
(sin x + 1 3 sin 3x + 1 5 sin 5x<br />
CHAPTER 1<br />
<strong>FUNCTIONS</strong> <strong>AND</strong> <strong>MODELS</strong><br />
y<br />
1<br />
_6 _4 _2 0 2 4 6 x<br />
5.<br />
(<br />
4 sin 3x<br />
sin x +<br />
π<br />
3<br />
+<br />
sin 5x<br />
5<br />
+<br />
sin 7x<br />
7<br />
+<br />
sin 9x<br />
9<br />
+<br />
_1<br />
sin 11x<br />
11<br />
+<br />
sin 13x<br />
13<br />
+<br />
sin 15x<br />
15<br />
+<br />
sin 17x<br />
17<br />
+<br />
)<br />
sin 19x<br />
19<br />
y<br />
1<br />
_2¹<br />
_¹<br />
¹ 2¹<br />
x<br />
_1<br />
6. y<br />
¹/2<br />
_2¹ _¹ 0<br />
_¹/2<br />
¹ 2¹<br />
x<br />
USING A GRAPHING CALCULATOR TO DO REGRESSION ANALYSIS<br />
The following instructions assume the use of a TI-85 calculator.<br />
• Under the STAT menu select EDIT.<br />
• Choose desired lists for x-andy-coordinates.<br />
• Enter the x-andy-coordinates of the data.<br />
• In graph mode, set approximate ranges so points can be viewed. Erase or deselect all functions.<br />
• In default window, choose a regression model:<br />
• ExpR (Exponential regression)<br />
• LinR (Linear regression)<br />
• LnR (Logarithmic regression)<br />
• P2Reg (Quadratic regression)<br />
• P3Reg (Cubic regression)<br />
• P4Reg (Quartic regression)<br />
• Under STAT mode, select DRAW.<br />
• Select SCAT to plot data points.<br />
• Select DRREG to plot the regression model.<br />
• Move cursor along regression plot to get approximations for interpolation.<br />
8