2012 IPEDS Data Feedback Report - Trinity Valley Community ...
2012 IPEDS Data Feedback Report - Trinity Valley Community ...
2012 IPEDS Data Feedback Report - Trinity Valley Community ...

Create successful ePaper yourself
Turn your PDF publications into a flip-book with our unique Google optimized e-Paper software.
Image description. Cover Image End of image description.<br />
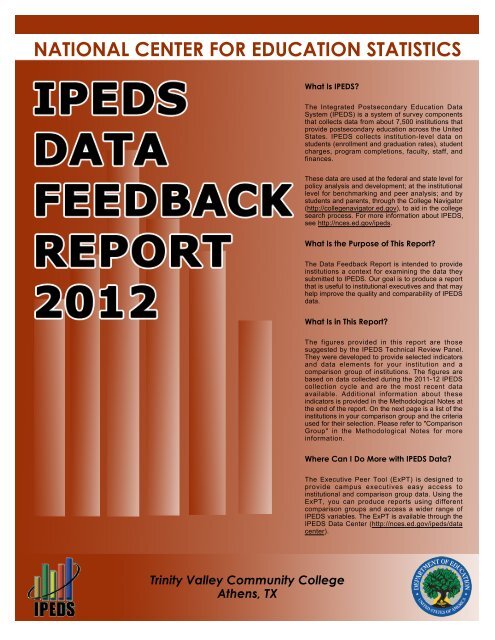
NATIONAL CENTER FOR EDUCATION STATISTICS<br />
What Is <strong>IPEDS</strong>?<br />
The Integrated Postsecondary Education <strong>Data</strong><br />
System (<strong>IPEDS</strong>) is a system of survey components<br />
that collects data from about 7,500 institutions that<br />
provide postsecondary education across the United<br />
States. <strong>IPEDS</strong> collects institution-level data on<br />
students (enrollment and graduation rates), student<br />
charges, program completions, faculty, staff, and<br />
finances.<br />
These data are used at the federal and state level for<br />
policy analysis and development; at the institutional<br />
level for benchmarking and peer analysis; and by<br />
students and parents, through the College Navigator<br />
(http://collegenavigator.ed.gov), to aid in the college<br />
search process. For more information about <strong>IPEDS</strong>,<br />
see http://nces.ed.gov/ipeds.<br />
What Is the Purpose of This <strong>Report</strong>?<br />
The <strong>Data</strong> <strong>Feedback</strong> <strong>Report</strong> is intended to provide<br />
institutions a context for examining the data they<br />
submitted to <strong>IPEDS</strong>. Our goal is to produce a report<br />
that is useful to institutional executives and that may<br />
help improve the quality and comparability of <strong>IPEDS</strong><br />
data.<br />
What Is in This <strong>Report</strong>?<br />
The figures provided in this report are those<br />
suggested by the <strong>IPEDS</strong> Technical Review Panel.<br />
They were developed to provide selected indicators<br />
and data elements for your institution and a<br />
comparison group of institutions. The figures are<br />
based on data collected during the 2011-12 <strong>IPEDS</strong><br />
collection cycle and are the most recent data<br />
available. Additional information about these<br />
indicators is provided in the Methodological Notes at<br />
the end of the report. On the next page is a list of the<br />
institutions in your comparison group and the criteria<br />
used for their selection. Please refer to "Comparison<br />
Group" in the Methodological Notes for more<br />
information.<br />
Where Can I Do More with <strong>IPEDS</strong> <strong>Data</strong>?<br />
The Executive Peer Tool (ExPT) is designed to<br />
provide campus executives easy access to<br />
institutional and comparison group data. Using the<br />
ExPT, you can produce reports using different<br />
comparison groups and access a wider range of<br />
<strong>IPEDS</strong> variables. The ExPT is available through the<br />
<strong>IPEDS</strong> <strong>Data</strong> Center (http://nces.ed.gov/ipeds/data<br />
center).<br />
<strong>Trinity</strong> <strong>Valley</strong> <strong>Community</strong> College<br />
Athens, TX
<strong>IPEDS</strong> DATA FEEDBACK REPORT<br />
COMPARISON GROUP<br />
Comparison group data are included to provide a context for interpreting your institution’s statistics. If your institution did not define a Custom<br />
Comparison Group for this report by July 15, NCES selected a comparison group for you. (In this case, the characteristics used to define the<br />
comparison group appears below.) The Executive Peer Tool (ExPT)(http://nces.ed.gov/ipeds/datacenter/) can be used to reproduce the<br />
figures in this report using different peer groups.<br />
Using some of your institution's characteristics, a group of comparison institutions was selected for you. The characteristics include medium,<br />
public, 2-year colleges, in the western states, town locale. This comparison group includes the following 31 institutions:<br />
Angelina College (Lufkin, TX)<br />
Arizona Western College (Yuma, AZ)<br />
Barstow <strong>Community</strong> College (Barstow, CA)<br />
Blue Mountain <strong>Community</strong> College (Pendleton, OR)<br />
Centralia College (Centralia, WA)<br />
Coastal Bend College (Beeville, TX)<br />
College of Southern Idaho (Twin Falls, ID)<br />
Eastern Arizona College (Thatcher, AZ)<br />
Eastern New Mexico University-Roswell Campus (Roswell, NM)<br />
Hawaii <strong>Community</strong> College (Hilo, HI)<br />
Hill College (Hillsboro, TX)<br />
Howard College (Big Spring, TX)<br />
Kilgore College (Kilgore, TX)<br />
Klamath <strong>Community</strong> College (Klamath Falls, OR)<br />
Lamar State College-Orange (Orange, TX)<br />
Linn-Benton <strong>Community</strong> College (Albany, OR)<br />
New Mexico Junior College (Hobbs, NM)<br />
North Central Texas College (Gainesville, TX)<br />
Northeastern Oklahoma A&M College (Miami, OK)<br />
Northern Oklahoma College (Tonkawa, OK)<br />
Northwest College (Powell, WY)<br />
Paris Junior College (Paris, TX)<br />
Sheridan College (Sheridan, WY)<br />
Snow College (Ephraim, UT)<br />
Taft College (Taft, CA)<br />
Treasure <strong>Valley</strong> <strong>Community</strong> College (Ontario, OR)<br />
Vernon College (Vernon, TX)<br />
Weatherford College (Weatherford, TX)<br />
West Hills College Coalinga (Coalinga, CA)<br />
Western Wyoming <strong>Community</strong> College (Rock Springs, WY)<br />
Wharton County Junior College (Wharton, TX)<br />
<strong>Trinity</strong> <strong>Valley</strong> <strong>Community</strong> College<br />
2
Image description.<br />
Figure 1. Percent of all students enrolled, by race/ethnicity and percent of students who are women: Fall 2011<br />
<strong>IPEDS</strong> DATA FEEDBACK REPORT<br />
Bar Y scale chart titled with Percent. 10 groups with 2 items per group.<br />
Group 1, 1, Your American institution Indian 0.01, or hover Alaska text Native.<br />
Item 2, Comparison Group Median (N=31) on image.<br />
Group 2, Asian.<br />
1, hover text on image.<br />
Item 1, 2, Your Comparison institution Group 1, hover Median text (N=31) on image.<br />
Group 3, Black or African American. 1, hover text on image.<br />
Item 1, 2, Your Comparison institution Group 15, hover Median text (N=31) on image.<br />
Group 4, Hispanic/Latino.<br />
3, hover text on image.<br />
Item 1, 2, Your Comparison institution Group 3, hover Median text (N=31) on image.<br />
Group 5, Native Hawaiian or other Pacific Islander. 13, hover text on image.<br />
Item 1, 2, Your Comparison institution Group 0.01, Median hover text (N=31) on image.<br />
Group 6, White.<br />
0.01, hover text on image.<br />
Item 1, 2, Your Comparison institution Group 66, hover Median text (N=31) on image.<br />
Group 7, Two or more races.<br />
69, hover text on image.<br />
Item 1, 2, Your Comparison institution Group 13, hover Median text (N=31) on image.<br />
Group 8, Race/ethnicity unknown. 2, hover text on image.<br />
Item 1, 2, Your Comparison institution Group 1, hover Median text (N=31) on image.<br />
Group 9, Nonresident alien.<br />
2, hover text on image.<br />
Item 1, 2, Your Comparison institution Group 0.01, Median hover text (N=31) on image.<br />
Group 10, Women.<br />
1, hover text on image.<br />
1, Your<br />
100<br />
Item 2, Comparison institution Group 61, hover Median text (N=31) on image. 60, hover text on image.<br />
Race/ethnicity Shape or gender<br />
line, Shape Label:<br />
InstitutionLegend, Shape<br />
Label: Your institution<br />
ComparisonGroupLegend, Shape<br />
Label: Comparison Group Median (N=31)<br />
ComparisonGroupLegendLine1, Shape<br />
Label:<br />
ComparisonGroupLegendLine2, End of image description. Label:<br />
90<br />
Percent<br />
80<br />
70<br />
60<br />
50<br />
40<br />
66<br />
69<br />
61 60<br />
30<br />
20<br />
15<br />
13<br />
13<br />
10<br />
0<br />
0 1 1 1<br />
American Indian or<br />
Alaska Native<br />
Asian<br />
Black or<br />
African American<br />
3 3<br />
Hispanic/Latino<br />
0 0<br />
Native Hawaiian<br />
or other<br />
Pacific Islander<br />
2 1 2<br />
White Two or more races Race/ethnicity<br />
unknown<br />
0 1<br />
Nonresident alien<br />
Women<br />
Your institution<br />
Comparison Group Median (N=31)<br />
Race/ethnicity or gender<br />
NOTE: For more information about disaggregation of data by race and ethnicity, please see the Methodological Notes at the end of this report. Median values for the comparison group<br />
will not add to 100 percent. See "Use of Median Values for Comparison Group" in the Methodological Notes at the end of this report for how median values are determined. N is the<br />
number of institutions in the comparison group.<br />
SOURCE: U.S. Department of Education, National Center for Education Statistics, Integrated Postsecondary Education <strong>Data</strong> System (<strong>IPEDS</strong>): Spring <strong>2012</strong>, Fall Enrollment component.<br />
Figure 2.<br />
Unduplicated 12-month headcount (2010-11), total FTE<br />
enrollment (2010-11), and full- and part-time fall<br />
enrollment (Fall 2011)<br />
Figure 3.<br />
Number of subbaccalaureate degrees and certificates<br />
awarded, by level: 2010-11<br />
Image description.<br />
Enrollment Horizontal Bar measure<br />
X scale titled Number chart with of students. 4 groups with 2 items per group.<br />
Group 1, 1, Your Unduplicated institution 11851. headcount - total.<br />
Item Group 2, 2, Comparison Total FTE enrollment. Group Median (N=31) 6371.<br />
Item 1, 2, Your Comparison institution Group 5726.<br />
Group 3, Full-time fall enrollment. Median (N=31) 2814.<br />
Item 1, 2, Your Comparison institution Group 2696.<br />
Group 4, Part-time fall enrollment. Median (N=31) 1724.<br />
Item 1, 2, Your Comparison institution Group 2625. Median (N=31) 2587.<br />
line, Shape<br />
Shape Label:<br />
InstitutionLegend, Shape<br />
Label: Your institution<br />
ComparisonGroupLegend, Shape<br />
Label: Comparison Group Median (N=31)<br />
ComparisonGroupLegendLine1, Shape<br />
Label:<br />
ComparisonGroupLegendLine2, End of image description. Label:<br />
Enrollment measure<br />
Image description.<br />
Level Horizontal of award<br />
X scale titled Bar Number chart with of awards. 4 groups with 2 items per group.<br />
Group 1, 1, Your Associate's.<br />
Item 2, Comparison institution Group 675.<br />
Group 2, Certificates of at least Median 2 but (N=31) less than 343.<br />
1, Your institution 0.01.<br />
4 years.<br />
Item Group 2, 3, Comparison Certificates Group of at least Median 1 but (N=31) less than 0.01.<br />
1, Your institution 214.<br />
2 years.<br />
Item Group 2, 4, Comparison Certificates Group of less Median than 1 (N=31) year. 96.<br />
Item 1, 2, Your Comparison institution Group 507. Median (N=31) 33.<br />
line, Shape<br />
Shape Label:<br />
InstitutionLegend, Shape<br />
Label: Your institution<br />
ComparisonGroupLegend, Shape<br />
Label: Comparison Group Median (N=31)<br />
ComparisonGroupLegendLine1, Shape<br />
Label:<br />
ComparisonGroupLegendLine2, End of image description. Label:<br />
Level of award<br />
Unduplicated<br />
headcount - total<br />
6,371<br />
11,851<br />
Associate's<br />
343<br />
675<br />
Total FTE<br />
enrollment<br />
2,814<br />
5,726<br />
Certificates of at least 2<br />
but less than 4 years<br />
0<br />
0<br />
Full-time<br />
fall enrollment<br />
1,724<br />
2,696<br />
Certificates of at least 1<br />
but less than 2 years<br />
96<br />
214<br />
Part-time<br />
fall enrollment<br />
2,625<br />
2,587<br />
Certificates of less<br />
than 1 year<br />
33<br />
507<br />
Your institution<br />
0 2,000 4,000 6,000 8,000 10,000 12,000<br />
Number of students<br />
Comparison Group Median (N=31)<br />
NOTE: For details on calculating full-time equivalent (FTE) enrollment, see Calculating<br />
FTE in the Methodological Notes at the end of this report. N is the number of institutions in<br />
the comparison group.<br />
SOURCE: U.S. Department of Education, National Center for Education Statistics,<br />
Integrated Postsecondary Education <strong>Data</strong> System (<strong>IPEDS</strong>): Fall 2011, 12-month<br />
Enrollment component and Spring <strong>2012</strong>, Fall Enrollment component.<br />
Your institution<br />
0 200 400 600 800<br />
Number of awards<br />
Comparison Group Median (N=31)<br />
NOTE: N is the number of institutions in the comparison group.<br />
SOURCE: U.S. Department of Education, National Center for Education Statistics,<br />
Integrated Postsecondary Education <strong>Data</strong> System (<strong>IPEDS</strong>): Fall 2011, Completions<br />
component.<br />
3<br />
<strong>Trinity</strong> <strong>Valley</strong> <strong>Community</strong> College
Image description.<br />
<strong>IPEDS</strong> DATA FEEDBACK REPORT<br />
Figure 4.<br />
Academic year tuition and required fees for full-time,<br />
first-time, degree/certificate-seeking undergraduates:<br />
2008-09--2011-12<br />
Figure 5.<br />
Average net price of attendance for full-time, first-time,<br />
degree/certificate-seeking undergraduate students<br />
receiving grant or scholarship aid: 2008-09--2010-11<br />
Academic Horizontal year<br />
X scale titled Bar Tuition chart with and 4 fees. groups with 2 items per group.<br />
Group 1, 1, Your 2011-12.<br />
Item 2, Comparison institution Group $1920.<br />
Group 2, 2010-11. Median (N=31) $2300.<br />
Item 1, 2, Your Comparison institution Group $1600.<br />
Group 3, 2009-10. Median (N=31) $2000.<br />
Item 1, 2, Your Comparison institution Group $1344.<br />
Group 4, 2008-09. Median (N=31) $2000.<br />
Item 1, 2, Your Comparison institution Academic<br />
Group $1200. Median (N=31) $1880.<br />
year<br />
line, Shape<br />
Shape Label:<br />
InstitutionLegend, Shape<br />
Label: Your institution<br />
ComparisonGroupLegend, Shape<br />
Label: Comparison Group Median (N=31)<br />
ComparisonGroupLegendLine1, Shape<br />
Label:<br />
ComparisonGroupLegendLine2, End of image description. Label:<br />
Image description.<br />
Academic Horizontal year<br />
X scale titled Bar Net chart price. with 3 groups with 2 items per group.<br />
Group 1, 1, Your 2010-11.<br />
Item 2, Comparison institution Group $5793.<br />
Group 2, 2009-10. Median (N=31) $5993.<br />
Item 1, 2, Your Comparison institution Group $6259.<br />
Group 3, 2008-09. Median (N=31) $5501.<br />
Item 1, 2, Your Comparison institution Group $5499. Median (N=31) $5449.<br />
line, Shape<br />
Shape Label:<br />
Academic year<br />
InstitutionLegend, Shape<br />
Label: Your institution<br />
ComparisonGroupLegend, Shape<br />
Label: Comparison Group Median (N=31)<br />
ComparisonGroupLegendLine1, Shape<br />
Label:<br />
ComparisonGroupLegendLine2, End of image description. Label:<br />
2011-12<br />
$1,920<br />
$2,300<br />
2010-11<br />
$5,793<br />
$5,993<br />
2010-11<br />
2009-10<br />
$1,344<br />
$1,600<br />
$2,000<br />
$2,000<br />
2009-10<br />
$5,501<br />
$6,259<br />
2008-09<br />
$1,200<br />
$1,880<br />
2008-09<br />
$5,499<br />
$5,449<br />
$0 $500 $1,000 $1,500 $2,000 $2,500<br />
Tuition and fees<br />
Your institution<br />
Comparison Group Median (N=31)<br />
NOTE: The tuition and required fees shown here are the lowest reported from the<br />
categories of in-district, in-state, and out-of-state. N is the number of institutions in the<br />
comparison group.<br />
SOURCE: U.S. Department of Education, National Center for Education Statistics,<br />
Integrated Postsecondary Education <strong>Data</strong> System (<strong>IPEDS</strong>): Fall 2011, Institutional<br />
Characteristics component.<br />
$0 $2,000 $4,000 $6,000 $8,000<br />
Net price<br />
Your institution<br />
Comparison Group Median (N=31)<br />
NOTE: Average net price is for full-time, first-time, degree/certificate-seeking<br />
undergraduate students and is generated by subtracting the average amount of federal,<br />
state/local government, and institutional grant and scholarship aid from the total cost of<br />
attendance. For public institutions, this includes only students who paid the in-state or indistrict<br />
tuition rate. Total cost of attendance is the sum of published tuition and required<br />
fees, books and supplies, and the average room and board and other expenses. For more<br />
information, see the Methodological Notes at the end of this report. N is the number of<br />
institutions in the comparison group.<br />
SOURCE: U.S. Department of Education, National Center for Education Statistics,<br />
Integrated Postsecondary Education <strong>Data</strong> System (<strong>IPEDS</strong>): Fall 2011, Institutional<br />
Characteristics component; Winter 2011-12, Student Financial Aid component.<br />
Figure 6.<br />
Percent of full-time, first-time degree/certificate-seeking<br />
undergraduate students who received grant or<br />
scholarship aid from the federal government, state/local<br />
government, or the institution, or loans, by type of aid:<br />
2010-11<br />
Figure 7.<br />
Average amounts of grant or scholarship aid from the<br />
federal government, state/local government, or the<br />
institution, or loans received, by full-time, first-time<br />
degree/certificate-seeking undergraduate students, by<br />
type of aid: 2010-11<br />
Image description.<br />
Type Horizontal of aid<br />
X scale titled Bar Percent chart with of students. 8 groups with 2 items per group.<br />
Group 1, 1, Your Any institution grant aid.<br />
Item 2, Comparison Group 77.<br />
Group 2, Federal grants. Median (N=31) 79.<br />
Item 1, 2, Your Comparison institution Group 66.<br />
Group 3, Pell grants. Median (N=31) 60.<br />
Item 1, 2, Your Comparison institution Group 66.<br />
Group 4, State/local grants. Median (N=31) 60.<br />
Item 1, 2, Your Comparison institution Group 19. Median<br />
Type<br />
Group 5, Institutional grants. (N=31) 23.<br />
of aid<br />
Item 1, 2, Your Comparison institution Group 29.<br />
Group 6, Any loans. Median (N=31) 21.<br />
Item 1, 2, Your Comparison institution Group 28.<br />
Group 7, Federal loans. Median (N=31) 25.<br />
Item 1, 2, Your Comparison institution Group 28.<br />
Group 8, Other loans. Median (N=31) 25.<br />
Item 1, 2, Your Comparison institution Group 0.01. Median (N=31) 0.01.<br />
line, Shape<br />
Shape Label:<br />
InstitutionLegend, Shape<br />
Label: Your institution<br />
ComparisonGroupLegend, Shape<br />
Label: Comparison Group Median (N=31)<br />
ComparisonGroupLegendLine1, Any grant<br />
Shape<br />
Label:<br />
ComparisonGroupLegendLine2, End of image description. Label:<br />
aid<br />
77<br />
79<br />
Image description.<br />
Type Horizontal of aid<br />
X scale titled Bar Aid chart dollars. with 8 groups with 2 items per group.<br />
Group 1, 1, Your Any institution grant aid $5102. (N=31).<br />
Item Group 2, 2, Comparison Federal grants Group (N=31). Median $4759.<br />
Item 1, 2, Your Comparison institution Group $4735.<br />
Group 3, Pell grants (N=31). Median $4570.<br />
Item 1, 2, Your Comparison institution Group $4475.<br />
Group 4, State/local grants Median (N=31). $4442.<br />
Item 1, 2, Your Comparison institution Group $1469.<br />
Group 5, Institutional grants Median (N=31). $1573.<br />
Item 1, 2, Your Comparison institution Group $1985.<br />
Group 6, Any loans (N=27). Median $2000.<br />
Item 1, 2, Your Comparison institution Group $4298.<br />
Group 7, Federal loans (N=26). Median $4702.<br />
Item 1, 2, Your Comparison institution Group $4298.<br />
Group 8, Other loans (N=4). Median $4684.<br />
Item 1, 2, Your Comparison institution Group No data. Median $6102.<br />
line, Shape<br />
Shape Label:<br />
InstitutionLegend, Shape<br />
Label: Your institution<br />
ComparisonGroupLegend, Shape<br />
Label: Comparison Group Median<br />
ComparisonGroupLegendLine1, Any grant<br />
Shape<br />
Label:<br />
ComparisonGroupLegendLine2, End of image description. Label:<br />
aid (N=31)<br />
Type of aid<br />
$5,102<br />
$4,759<br />
Federal<br />
grants<br />
60<br />
66<br />
Federal<br />
grants (N=31)<br />
$4,735<br />
$4,570<br />
Pell<br />
grants<br />
60<br />
66<br />
Pell<br />
grants (N=31)<br />
$4,475<br />
$4,442<br />
State/local<br />
grants<br />
19<br />
23<br />
State/local<br />
grants (N=31)<br />
$1,469<br />
$1,573<br />
Institutional<br />
grants<br />
21<br />
29<br />
Institutional<br />
grants (N=31)<br />
$1,985<br />
$2,000<br />
Any loans<br />
25 28<br />
Any loans<br />
(N=27)<br />
$4,298<br />
$4,702<br />
Federal<br />
loans<br />
28<br />
25<br />
Federal<br />
loans (N=26)<br />
$4,298<br />
$4,684<br />
Other loans<br />
0<br />
0<br />
Other loans<br />
(N=4)<br />
$6,102<br />
0 10 20 30 40 50 60 70 80 90 100<br />
Percent of students<br />
Your institution<br />
Comparison Group Median (N=31)<br />
NOTE: Any grant aid above includes grant or scholarship aid from the federal government,<br />
state/local government, or the institution. Federal grants includes Pell grants and other<br />
federal grants. Any loans includes federal loans and other loans to students. For details on<br />
how students are counted for financial aid reporting, see Cohort Determination in the<br />
Methodological Notes at the end of this report. N is the number of institutions in the<br />
comparison group.<br />
SOURCE: U.S. Department of Education, National Center for Education Statistics,<br />
Integrated Postsecondary Education <strong>Data</strong> System (<strong>IPEDS</strong>): Winter 2011-12, Student<br />
Financial Aid component.<br />
$0 $2,000 $4,000 $6,000 $8,000<br />
Aid dollars<br />
Your institution<br />
Comparison Group Median<br />
NOTE: Any grant aid above includes grant or scholarship aid from the federal government,<br />
state/local government, or the institution. Federal grants includes Pell grants and other<br />
federal grants. Any loans includes federal loans and other loans to students. Average<br />
amounts of aid were calculated by dividing the total aid awarded by the total number of<br />
recipients in each institution. N is the number of institutions in the comparison group.<br />
SOURCE: U.S. Department of Education, National Center for Education Statistics,<br />
Integrated Postsecondary Education <strong>Data</strong> System (<strong>IPEDS</strong>): Winter 2011-12, Student<br />
Financial Aid component.<br />
<strong>Trinity</strong> <strong>Valley</strong> <strong>Community</strong> College<br />
4
Image description.<br />
<strong>IPEDS</strong> DATA FEEDBACK REPORT<br />
Figure 8.<br />
Percent of all undergraduates receiving aid by type of<br />
aid: 2010-11<br />
Figure 9.<br />
Average amount of aid received by all undergraduates,<br />
by type of aid: 2010-11<br />
Type Horizontal of aid<br />
X scale titled Bar Percent chart with of students. 3 groups with 2 items per group.<br />
Group 1, 1, Your Any institution grant aid.<br />
Item 2, Comparison Group 78.<br />
Group 2, Pell grants. Median (N=31) 56.<br />
Item 1, 2, Your Comparison institution Group 43.<br />
Group 3, Federal loans. Median (N=31) 38.<br />
Item 1, 2, Your Comparison institution Group 20. Median (N=31) 18.<br />
line, Shape<br />
Shape Label:<br />
Type of aid<br />
InstitutionLegend, Shape<br />
Label: Your institution<br />
ComparisonGroupLegend, Shape<br />
Label: Comparison Group Median (N=31)<br />
ComparisonGroupLegendLine1, Shape<br />
Label:<br />
ComparisonGroupLegendLine2, End of image description. Label:<br />
Image description.<br />
Type Horizontal of aid<br />
X scale titled Bar Aid chart dollars. with 3 groups with 2 items per group.<br />
Group 1, 1, Your Any institution grant aid $2606. (N=31).<br />
Item Group 2, 2, Comparison Pell grants Group (N=31). Median $4155.<br />
Item 1, 2, Your Comparison institution Group $3523.<br />
Group 3, Federal loans (N=26). Median $4168.<br />
Item 1, 2, Your Comparison institution Group $5117. Median $4994.<br />
line, Shape<br />
Shape Label:<br />
Type of aid<br />
InstitutionLegend, Shape<br />
Label: Your institution<br />
ComparisonGroupLegend, Shape<br />
Label: Comparison Group Median<br />
ComparisonGroupLegendLine1, Shape<br />
Label:<br />
ComparisonGroupLegendLine2, End of image description. Label:<br />
Any grant aid<br />
56<br />
78<br />
Any grant aid (N=31)<br />
$2,606<br />
$4,155<br />
Pell grants<br />
38<br />
43<br />
Pell grants (N=31)<br />
$3,523<br />
$4,168<br />
Federal<br />
loans<br />
18<br />
20<br />
Federal<br />
loans (N=26)<br />
$5,117<br />
$4,994<br />
0 10 20 30 40 50 60 70 80 90 100<br />
Percent of students<br />
Your institution<br />
Comparison Group Median (N=31)<br />
NOTE: Any grant aid above includes grant or scholarship aid from the federal government,<br />
state/local government, the institution, or other sources. Federal loans includes only<br />
federal loans to students. N is the number of institutions in the comparison group.<br />
SOURCE: U.S. Department of Education, National Center for Education Statistics,<br />
Integrated Postsecondary Education <strong>Data</strong> System (<strong>IPEDS</strong>): Winter 2011-12, Student<br />
Financial Aid component.<br />
Your institution<br />
$0 $1,000 $2,000 $3,000 $4,000 $5,000 $6,000<br />
Aid dollars<br />
Comparison Group Median<br />
NOTE: Any grant aid above includes grant or scholarship aid from the federal government,<br />
state/local government, the institution, or other sources. Federal loans includes federal<br />
loans to students. Average amounts of aid were calculated by dividing the total aid<br />
awarded by the total number of recipients in each institution. N is the number of<br />
institutions in the comparison group.<br />
SOURCE: U.S. Department of Education, National Center for Education Statistics,<br />
Integrated Postsecondary Education <strong>Data</strong> System (<strong>IPEDS</strong>): Winter 2011-12, Student<br />
Financial Aid component.<br />
Figure 10. Graduation rate and transfer-out rate (2008 cohort);<br />
graduation rate cohort as a percent of total entering<br />
students, and retention rates of first-time students (Fall<br />
2011)<br />
Figure 11. Graduation rates of full-time, first-time, degree/<br />
certificate-seeking undergraduates within<br />
normal time, and 150% and 200% of normal time to<br />
completion: 2007 cohort<br />
Image description.<br />
Measure Horizontal X scale titled Bar Percent. chart with 5 groups with 2 items per group.<br />
Group 1, 1, Your Graduation institution rate, 23. overall (N=31).<br />
Item Group 2, 2, Comparison Transfer-out Group rate Median (N=30). 19.<br />
Item 1, 2, Your Comparison institution Group 25.<br />
Group 3, Graduation rate cohort Median as 19.<br />
1, Your institution 43. a percent of total entering students (N=31).<br />
Item Group 2, 4, Comparison Full-time retention Group Median rate (N=31). 31.<br />
Item 1, 2, Your Comparison institution Group 54.<br />
Group 5, Part-time retention Median rate (N=31). 54.<br />
Item 1, 2, Your Comparison institution Group 79. Median 41.<br />
line, Shape<br />
Shape Label:<br />
InstitutionLegend, Shape<br />
Label: Your institution<br />
ComparisonGroupLegend, Shape<br />
Label: Comparison Group Median<br />
ComparisonGroupLegendLine1, Shape<br />
Label:<br />
ComparisonGroupLegendLine2, End of image description. Label:<br />
Measure<br />
Graduation rate,<br />
overall (N=31)<br />
Transfer-out rate<br />
(N=30)<br />
23<br />
19<br />
25<br />
19<br />
Image description.<br />
Time Horizontal to program Bar chart completion<br />
X scale titled Graduation with 3 rate. groups with 2 items per group.<br />
Group 1, 1, Your Normal institution time.<br />
Item 2, Comparison Group 22.<br />
Group 2, 150% of normal time. Median (N=31) 11.<br />
Item 1, 2, Your Comparison institution Group 22.<br />
Group 3, 200% of normal time. Median (N=31) 21.<br />
Item 1, 2, Your Comparison institution Group 23. Median (N=31) 25.<br />
line, Shape<br />
Shape Label:<br />
InstitutionLegend, Shape<br />
Label: Your institution<br />
ComparisonGroupLegend, Shape<br />
Label: Comparison Group Median (N=31)<br />
ComparisonGroupLegendLine1, Shape<br />
Label:<br />
ComparisonGroupLegendLine2, End of image description. Label:<br />
Time to program completion<br />
Normal time<br />
11<br />
22<br />
Graduation rate cohort<br />
as a percent of total<br />
entering students (N=31)<br />
31<br />
43<br />
150% of normal time<br />
22<br />
21<br />
Full-time retention<br />
rate (N=31)<br />
Part-time retention<br />
rate (N=31)<br />
41<br />
54<br />
54<br />
79<br />
200% of normal time<br />
23<br />
25<br />
Your institution<br />
0 10 20 30 40 50 60 70 80 90 100<br />
Percent<br />
Comparison Group Median<br />
NOTE: Graduation rate cohort includes all full-time, first-time, degree/certificate-seeking<br />
undergraduate students. Entering class includes all students coming to the institution for<br />
the first time. Graduation and transfer-out rates are the Student Right-to-Know rates. Only<br />
institutions with a mission to prepare students to transfer are required to report transfers<br />
out. Retention rates are measured from the fall of first enrollment to the following fall. For<br />
more information, see the Methodological Notes. N is the number of institutions in the<br />
comparison group.<br />
SOURCE: U.S. Department of Education, National Center for Education Statistics,<br />
Integrated Postsecondary Education <strong>Data</strong> System (<strong>IPEDS</strong>): Spring <strong>2012</strong>, Graduation<br />
Rates component and Fall Enrollment component.<br />
Your institution<br />
0 10 20 30 40 50 60 70 80 90 100<br />
Graduation rate<br />
Comparison Group Median (N=31)<br />
NOTE: The 150% graduation rate is the Student Right-to-Know (SRK) rates; the Normal<br />
time and 200% rates are calculated using the same methodology. For more information<br />
see the Methodological Notes at the end of the report. N is the number of institutions in the<br />
comparison group.<br />
SOURCE: U.S. Department of Education, National Center for Education Statistics,<br />
Integrated Postsecondary Education <strong>Data</strong> System (<strong>IPEDS</strong>): Spring <strong>2012</strong>, 200%<br />
Graduation Rates component.<br />
5<br />
<strong>Trinity</strong> <strong>Valley</strong> <strong>Community</strong> College
Image description.<br />
<strong>IPEDS</strong> DATA FEEDBACK REPORT<br />
Figure 12. Full-time equivalent staff, by assigned position: Fall 2011<br />
Figure 13. Average salaries of full-time instructional staff equated<br />
to 9-month contracts, by academic rank: Academic year<br />
2011-12<br />
Staff Horizontal category<br />
X scale titled Bar Number chart with of staff. 4 groups with 2 items per group.<br />
Group 1, 1, Your Instruction/ institution research/ 189. public service.<br />
Item Group 2, 2, Comparison Executive/ Group administrative/ Median (N=31) managerial. 138.<br />
Item 1, 2, Your Comparison institution Group 45.<br />
Group 3, Other professional Median (support/service). (N=31) 22.<br />
Item 1, 2, Your Comparison institution Group 7.<br />
Group 4, Non-professional. Median (N=31) 45.<br />
Item 1, 2, Your Comparison institution Group 165. Median (N=31) 102.<br />
line, Shape<br />
Shape Label:<br />
InstitutionLegend, Shape<br />
Label: Your institution<br />
ComparisonGroupLegend, Shape<br />
Label: Comparison Group Median (N=31)<br />
ComparisonGroupLegendLine1, Shape<br />
Label:<br />
ComparisonGroupLegendLine2, End of image description. Label:<br />
Instruction/<br />
research/<br />
public service<br />
Staff category<br />
138<br />
189<br />
Image description.<br />
Academic Horizontal rank<br />
X scale titled Bar Average chart with salary. 7 groups with 2 items per group.<br />
Group 1, 1, Your All ranks institution (N=31).<br />
Item 2, Comparison Group $51729.<br />
Group 2, Professor (N=9). Median $50942.<br />
Item 1, 2, Your Comparison institution Group No data.<br />
Group 3, Associate professor Median (N=8). $62262.<br />
Item 1, 2, Your Comparison institution Group No data.<br />
Group 4, Assistant professor Median (N=7). $60586.<br />
Item 1, 2, Your Comparison institution Group No data.<br />
Group 5, Instructor (N=18). Median $53407.<br />
Item 1, 2, Your Comparison institution Group No data.<br />
Group 6, Lecturer (N=0). Median $47328.<br />
Item 1, 2, Your Comparison institution Group No data.<br />
Group 7, No academic rank Median (N=13). No data.<br />
Item 1, 2, Your Comparison institution Group $51729. Median $50942.<br />
line, Shape<br />
Shape Label:<br />
InstitutionLegend, Shape<br />
Label: Your institution<br />
ComparisonGroupLegend, Shape<br />
Label: Comparison Group Median<br />
ComparisonGroupLegendLine1, Shape<br />
Label:<br />
ComparisonGroupLegendLine2, End of image description. Label:<br />
Professor (N=9)<br />
Academic rank<br />
All ranks<br />
(N=31)<br />
$51,729<br />
$50,942<br />
$62,262<br />
Executive/<br />
administrative/<br />
managerial<br />
22<br />
45<br />
Associate professor<br />
(N=8)<br />
Assistant professor<br />
(N=7)<br />
$53,407<br />
$60,586<br />
Other professional<br />
(support/service)<br />
7<br />
45<br />
Instructor<br />
(N=18)<br />
$47,328<br />
Non-professional<br />
102<br />
165<br />
Lecturer<br />
(N=0)<br />
No academic rank<br />
(N=13)<br />
$51,729<br />
$50,942<br />
Your institution<br />
0 50 100 150 200<br />
Number of staff<br />
Comparison Group Median (N=31)<br />
NOTE: Graduate assistants are not included in this figure. For information on the<br />
calculation of FTE of staff, see the Methodological Notes. N is the number of institutions in<br />
the comparison group.<br />
SOURCE: U.S. Department of Education, National Center for Education Statistics,<br />
Integrated Postsecondary Education <strong>Data</strong> System (<strong>IPEDS</strong>): Winter 2011-12, Human<br />
Resources component.<br />
Your institution<br />
$0 $20,000 $40,000 $60,000 $80,000<br />
Average salary<br />
Comparison Group Median<br />
NOTE: Average full-time instructional staff salaries for 11/12-month contracts were<br />
equated to 9-month average salaries by multiplying the 11/12-month salary by .8182.<br />
Salaries based on less than 9-month contracts are not included. Medical school salaries<br />
are not included. N is the number of institutions in the comparison group. Medians are not<br />
reported for comparison groups with less than three values.<br />
SOURCE: U.S. Department of Education, National Center for Education Statistics,<br />
Integrated Postsecondary Education <strong>Data</strong> System (<strong>IPEDS</strong>): Winter 2011-12, Human<br />
Resources component.<br />
Figure 14. Percent distribution of core revenues, by source: Fiscal<br />
year 2011<br />
Figure 15. Core expenses per FTE enrollment, by function: Fiscal<br />
year 2011<br />
Image description.<br />
Revenue Horizontal source<br />
X scale titled Bar Percent. chart with 7 groups with 2 items per group.<br />
Group 1, 1, Your Tuition institution and fees.<br />
Item 2, Comparison Group 14.<br />
Group 2, State appropriations. Median (N=31) 12.<br />
Item 1, 2, Your Comparison institution Group 29.<br />
Group 3, Local appropriations. Median (N=31) 29.<br />
Item 1, 2, Your Comparison institution Group 17.<br />
Group 4, Government grants Median and contracts. (N=31) 9.<br />
Item 1, 2, Your Comparison institution Group 35.<br />
Group 5, Private gifts, grants, Median and contracts. (N=31) 35.<br />
Item 1, 2, Your Comparison institution Group 0.01.<br />
Group 6, Investment return. Median (N=31) 0.01.<br />
Item 1, 2, Your Comparison institution Group 0.01.<br />
Group 7, Other core revenues. Median (N=31) 0.01.<br />
Item 1, 2, Your Comparison institution Group 5. Median (N=31) 5.<br />
line, Shape<br />
Shape Label:<br />
InstitutionLegend, Shape<br />
Label: Your institution<br />
ComparisonGroupLegend, Shape<br />
Label: Comparison Group Median (N=31)<br />
ComparisonGroupLegendLine1, Shape<br />
Label:<br />
ComparisonGroupLegendLine2, End of image description. Label:<br />
Tuition and fees<br />
Revenue source<br />
12 14<br />
Image description.<br />
Expense Horizontal function<br />
X scale titled Bar Dollars chart with per FTE. 7 groups with 2 items per group.<br />
Group 1, 1, Your Instruction.<br />
Item 2, Comparison institution Group $3534.<br />
Group 2, Research. Median (N=31) $4443.<br />
Item 1, 2, Your Comparison institution Group $0.01.<br />
Group 3, Public service. Median (N=31) $0.01.<br />
Item 1, 2, Your Comparison institution Group $141.<br />
Group 4, Academic support. Median (N=31) $119.<br />
Item 1, 2, Your Comparison institution Group $796.<br />
Group 5, Institutional support. Median (N=31) $597.<br />
Item 1, 2, Your Comparison institution Group $717.<br />
Group 6, Student services. Median (N=31) $1532.<br />
Item 1, 2, Your Comparison institution Group $678.<br />
Group 7, Other core expenses. Median (N=31) $997.<br />
Item 1, 2, Your Comparison institution Group $1521. Median (N=31) $2084.<br />
line, Shape<br />
Shape Label:<br />
InstitutionLegend, Shape<br />
Label: Your institution<br />
ComparisonGroupLegend, Shape<br />
Label: Comparison Group Median (N=31)<br />
ComparisonGroupLegendLine1, Shape<br />
Label:<br />
ComparisonGroupLegendLine2, End of image description. Label:<br />
Instruction<br />
Expense function<br />
$3,534<br />
$4,443<br />
State<br />
appropriations<br />
29<br />
29<br />
Research<br />
$0<br />
$0<br />
Local<br />
appropriations<br />
9<br />
17<br />
Public service<br />
$141<br />
$119<br />
Government grants<br />
and contracts<br />
35<br />
35<br />
Academic support<br />
$796<br />
$597<br />
Private gifts, grants,<br />
and contracts<br />
0<br />
0<br />
Institutional support<br />
$717<br />
$1,532<br />
Investment return<br />
0<br />
Student services<br />
$678<br />
$997<br />
Other core<br />
revenues<br />
5<br />
5<br />
Other core<br />
expenses<br />
$1,521<br />
$2,084<br />
Your institution<br />
0 10 20 30 40 50 60 70 80 90 100<br />
Percent<br />
Comparison Group Median (N=31)<br />
NOTE: The comparison group median is based on those members of the comparison<br />
group that report finance data using the same accounting standards as the comparison<br />
institution. For a detailed definition of core revenues, see the Methodological Notes. N is<br />
the number of institutions in the comparison group.<br />
SOURCE: U.S. Department of Education, National Center for Education Statistics,<br />
Integrated Postsecondary Education <strong>Data</strong> System (<strong>IPEDS</strong>): Spring <strong>2012</strong>, Finance<br />
component.<br />
Your institution<br />
$0 $1,000 $2,000 $3,000 $4,000 $5,000<br />
Dollars per FTE<br />
Comparison Group Median (N=31)<br />
NOTE: Expenses per full-time equivalent (FTE) enrollment, particularly instruction, may be<br />
inflated because finance data includes all core expenses while FTE reflects credit activity<br />
only. For details on calculating FTE enrollment and a detailed definition of core expenses,<br />
see the Methodological Notes. N is the number of institutions in the comparison group.<br />
SOURCE: U.S. Department of Education, National Center for Education Statistics,<br />
Integrated Postsecondary Education <strong>Data</strong> System (<strong>IPEDS</strong>): Fall 2011, 12-month<br />
Enrollment component and Spring <strong>2012</strong>, Finance component.<br />
<strong>Trinity</strong> <strong>Valley</strong> <strong>Community</strong> College<br />
6
<strong>IPEDS</strong> DATA FEEDBACK REPORT<br />
METHODOLOGICAL NOTES<br />
Overview<br />
This report is based on data supplied by institutions to <strong>IPEDS</strong> during the<br />
2011-12 survey year. Response rates exceeded 99 percent for most<br />
surveys. Detailed response tables are included in <strong>IPEDS</strong> First Look reports,<br />
which can be found at<br />
http://nces.ed.gov/pubsearch/getpubcats.asp?sid=010.<br />
Use of Median Values for Comparison Group<br />
The value for the comparison institution is compared to the median value<br />
for the comparison group for each statistic included in the figure. If more<br />
than one statistic is presented in a figure, the median values are<br />
determined separately for each indicator or statistic. Medians are not<br />
reported for comparison groups with less than three values. Where<br />
percentage distributions are presented, median values may not add to 100<br />
percent. Through the ExPT, users have access to all of the data used to<br />
create the figures included in this report.<br />
Missing Statistics<br />
If a statistic is not reported for your institution, the omission indicates that<br />
the statistic is not relevant to your institution and the data were not<br />
collected. As such, not all notes listed below may be applicable to your<br />
report.<br />
Use of Imputed <strong>Data</strong><br />
All <strong>IPEDS</strong> data are subject to imputation for total (institutional) and partial<br />
(item) nonresponse. If necessary, imputed values were used to prepare<br />
your report.<br />
<strong>Data</strong> Confidentiality<br />
<strong>IPEDS</strong> data are not collected under a pledge of confidentiality.<br />
Disaggregation of <strong>Data</strong> by Race/Ethnicity<br />
When applicable, some statistics are disaggregated by race/ethnicity. <strong>Data</strong><br />
disaggregated by race/ethnicity have been reported using the 1997 (new)<br />
Office of Management and Budget categories. Detailed information about<br />
the recent race/ethnicity changes can be found at<br />
http://nces.ed.gov/ipeds/reic/resource.asp.<br />
Postbaccalaureate Degree Categories<br />
The use of new postbaccalaureate degree categories was mandatory in the<br />
2011-12 collection year. These categories are: doctor’s degreeresearch/scholarship,<br />
doctor’s degree-professional practice, and doctor’s<br />
degree-other. (The first-professional degree and certificate categories and<br />
the single doctor’s degree category have been eliminated.)<br />
Cohort Determination for <strong>Report</strong>ing Student Financial Aid and<br />
Graduation Rates<br />
Student cohorts for reporting Student Financial Aid and Graduation Rates<br />
data are based on the reporting type of the institution. For institutions that<br />
report based on an academic year (those operating on standard academic<br />
terms), student counts and cohorts are based on fall term data. Student<br />
counts and cohorts for program reporters (those that do not operate on<br />
standard academic terms) are based on unduplicated counts of students<br />
enrolled during a full 12-month period.<br />
Description of Statistics Used in the Figures<br />
Average Institutional Net Price<br />
Average net price is calculated for full-time, first-time degree/certificateseeking<br />
undergraduates who were awarded grant or scholarship aid from<br />
the federal government, state/local government, or the institution anytime<br />
during the full aid year. For public institutions, this includes only students<br />
who paid the in-state or in-district tuition rate. Other sources of grant aid<br />
are excluded. Average net price is generated by subtracting the average<br />
amount of federal, state/local government, and institutional grant and<br />
scholarship aid from the total cost of attendance. Total cost of attendance<br />
is the sum of published tuition and required fees, books and supplies, and<br />
the average room and board and other expenses.<br />
For the purpose of the <strong>IPEDS</strong> reporting, aid received refers to financial aid<br />
that was awarded to, and accepted by, a student. This amount may differ<br />
from the aid amount that is disbursed to a student.<br />
Core Revenues<br />
Core revenues for public institutions reporting under GASB standards<br />
include tuition and fees; state and local appropriations; government grants<br />
and contracts; private gifts, grants, and contracts; sales and services of<br />
educational activities; investment income; other operating and nonoperating<br />
sources; and other revenues and additions (federal and capital<br />
appropriations and grants and additions to permanent endowments). Core<br />
revenues for private, not-for-profit institutions (and a small number of public<br />
institutions) reporting under FASB standards include tuition and fees;<br />
government appropriations (federal, state, and local); government grants<br />
and contracts; private gifts, grants, and contracts (including contributions<br />
from affiliated entities); investment return; sales and services of<br />
educational activities; and other sources. Core revenues for private, forprofit<br />
institutions reporting under FASB standards include tuition and fees;<br />
government appropriations, grants, and contracts (federal, state, and<br />
local); private grants and contracts; investment income; sales and services<br />
of educational activities; and other sources. At degree-granting institutions,<br />
core revenues exclude revenues from auxiliary enterprises (e.g.,<br />
bookstores, dormitories), hospitals, and independent operations.<br />
Nondegree-granting instituions do no report revenue from auxiliary<br />
enterprises in a separate category. These amounts may be included in the<br />
core revenues from other sources.<br />
Core Expenses<br />
Core expenses include expenses for instruction, research, public service,<br />
academic support, institutional support, student services, scholarships and<br />
fellowships (net of discounts and allowances), and other expenses.<br />
Expenses for operation and maintenance of plant, depreciation, and<br />
interest are allocated to each of the other functions. Core expenses at<br />
degree-granting institutions exclude expenses for auxiliary enterprises<br />
(e.g., bookstores, dormitories), hospitals, and independent operations.<br />
Nondegree-granting institutions do not report expenses for auxiliary<br />
enterprises in a separate category. These amounts may be included in the<br />
core expenses as other expenses.<br />
7<br />
<strong>Trinity</strong> <strong>Valley</strong> <strong>Community</strong> College
<strong>IPEDS</strong> DATA FEEDBACK REPORT<br />
Equated Instructional Staff Salaries<br />
Total salary outlays for full-time instructional staff on 11/12-month<br />
contracts were equated to 9-month outlays by multiplying the outlay for<br />
11/12-month contracted instructional staff by 0.8182. The equated outlays<br />
were then added to the outlays for 9/10-month instructional staff to<br />
determine an average salary for each rank. Salaries are not included for<br />
medical school staff or staff on less-than-9-month contracts.<br />
FTE for Enrollment<br />
The full-time equivalent (FTE) enrollment used in this report is the sum of<br />
the institution’s FTE undergraduate enrollment and FTE graduate<br />
enrollment (as calculated from or reported on the 12-month Enrollment<br />
component). Undergraduate and graduate FTE are estimated using 12-<br />
month instructional activity (credit and/or contact hours). See “Calculation<br />
of FTE Students (using instructional activity)” in the <strong>IPEDS</strong> Glossary at<br />
http://nces.ed.gov/ipeds/glossary/.<br />
FTE for Staff<br />
The full-time equivalent (FTE) of staff is calculated by summing the total<br />
number of full-time staff from the Employees by Assigned Position (EAP)<br />
section of the Human Resources component and adding one-third of the<br />
total number of part-time staff.<br />
Graduation Rates and Transfer-out Rate<br />
Graduation rates are those developed to satisfy the requirements of the<br />
Student Right-to-Know and Higher Education Opportunity Acts and are<br />
defined as the total number of individuals from a given cohort of full-time,<br />
first-time, degree/certificate-seeking undergraduates who completed a<br />
degree or certificate within a given percent of normal time (for the degree<br />
or certificate) before the ending status date of August 31, 2011, divided by<br />
the entire cohort of full-time, first-time, degree/certificate-seeking<br />
undergraduates minus any allowable exclusions. Institutions are permitted<br />
to exclude from the initial cohort students who died or were totally and<br />
permanently disabled; those who left school to serve in the armed forces<br />
or were called to active duty; those who left to serve with a foreign aid<br />
service of the federal government, such as the Peace Corps; and those<br />
who left to serve on an official church mission. Transfer-out rate is the total<br />
number of students from the cohort who are known to have transferred out<br />
of the reporting institution within the same time period, divided by the same<br />
adjusted cohort. Only institutions with a mission that includes preparing<br />
students to transfer are required to report transfers out.<br />
regardless of the duration of service, and amounts made to or on behalf of<br />
an individual over and above that received in the form of a salary or wage.<br />
Frequently, benefits are associated with an insurance payment. Private, forprofit<br />
institutions under FASB standards do not report salaries.<br />
Total Entering Undergraduate Students<br />
Total entering students are students at the undergraduate level, both fulland<br />
part-time, new to the institution in the fall term (or the prior summer<br />
term who returned in the fall). This includes all first-time undergraduate<br />
students, students transferring into the institution at the undergraduate<br />
level, and nondegree/certificate-seeking undergraduates entering in the fall.<br />
Only degree-granting, academic year reporting institutions provide total<br />
entering student data.<br />
Tuition and Required Fees<br />
Tuition is defined as the amount of money charged to students for<br />
instructional services; required fees are those fixed sum charges to<br />
students for items not covered by tuition that are required of such a large<br />
proportion of all students that the student who does not pay the charge is an<br />
exception. The amounts used in this report are for full-time, first-time,<br />
degree/certificate-seeking undergraduates and are those used by the<br />
financial aid office to determine need. For institutions that have differential<br />
tuition rates for in-district or in-state students, the lowest tuition rate is used<br />
in the figure. Only institutions that operate on standard academic terms will<br />
have tuition figures included in their report.<br />
Additional Methodological Information<br />
Additional methodological information on the <strong>IPEDS</strong> components can be<br />
found in the publications available at<br />
http://nces.ed.gov/pubsearch/getpubcats.asp?sid=010.<br />
Additional definitions of variables used in this report can be found in the<br />
<strong>IPEDS</strong> online glossary available at http://nces.ed.gov/ipeds/glossary/.<br />
Retention Rates<br />
Full-time retention rates are defined as the number of full-time, first-time,<br />
degree/certificate-seeking undergraduate students who enter the institution<br />
for the first time in the fall and who return to the same institution the<br />
following fall (as either full- or part-time), divided by the total number of fulltime,<br />
first-time, degree/certificate-seeking undergraduates in the fall of first<br />
entrance. Part-time retention rates are similarly defined. For 4-year<br />
institutions offering a bachelor’s degree, this rate is reported only for those<br />
first-time students seeking a bachelor’s degree. For less than 4-year<br />
institutions, the rate is calculated for all first-time degree/certificate-seeking<br />
students.<br />
Dr. Glendon Forgey, President<br />
<strong>Trinity</strong> <strong>Valley</strong> <strong>Community</strong> College (ID: 225308)<br />
100 Cardinal Drive<br />
Athens, TX 75751<br />
Salaries, Wages, and Benefits<br />
Salaries, wages, and benefits, for public institutions under GASB<br />
standards, and private, not-for-profit institutions under FASB standards,<br />
include amounts paid as compensation for services to all employees<br />
<strong>Trinity</strong> <strong>Valley</strong> <strong>Community</strong> College