Vertical profiling of atmospheric refractivity from ground-based GPS
Vertical profiling of atmospheric refractivity from ground-based GPS
Vertical profiling of atmospheric refractivity from ground-based GPS

Create successful ePaper yourself
Turn your PDF publications into a flip-book with our unique Google optimized e-Paper software.
13 - 14 LOWRY ET AL.: REFRACTIVITY PROFILING FROM GROUND-BASED <strong>GPS</strong><br />
Altitude (km)<br />
Difference in Excess Phase Path (m)<br />
6<br />
5<br />
4<br />
3<br />
2<br />
1<br />
Model A<br />
Model B<br />
0<br />
150 200 250 300 350<br />
Refractivity (Nunits)<br />
2<br />
0.6<br />
1.5<br />
1<br />
0.5<br />
A.<br />
B.<br />
RMS Difference in Z A<br />
(km)<br />
0.5<br />
0.4<br />
0.3<br />
Radiosonde – <strong>GPS</strong><br />
0.2<br />
-1 0 1 2 3 4 5<br />
Lowest Satellite Elevation Angle (deg)<br />
Model B – Model A<br />
0<br />
-1 0 1 2 3 4 5 6<br />
Geometric Elevation Angle (degrees)<br />
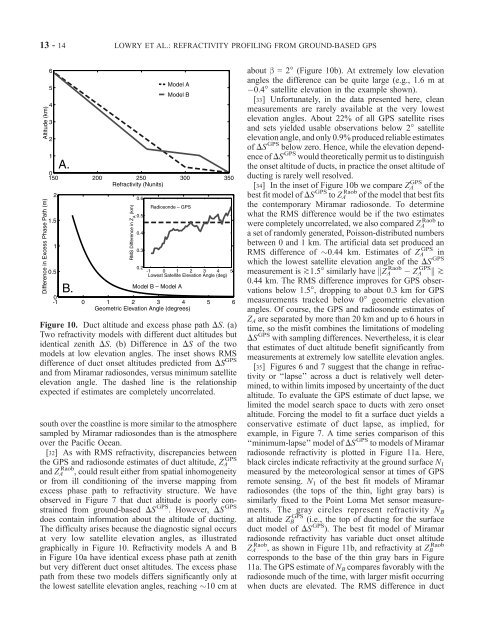
Figure 10. Duct altitude and excess phase path DS. (a)<br />
Two <strong>refractivity</strong> models with different duct altitudes but<br />
identical zenith DS. (b) Difference in DS <strong>of</strong> the two<br />
models at low elevation angles. The inset shows RMS<br />
difference <strong>of</strong> duct onset altitudes predicted <strong>from</strong> DS <strong>GPS</strong><br />
and <strong>from</strong> Miramar radiosondes, versus minimum satellite<br />
elevation angle. The dashed line is the relationship<br />
expected if estimates are completely uncorrelated.<br />
south over the coastline is more similar to the atmosphere<br />
sampled by Miramar radiosondes than is the atmosphere<br />
over the Pacific Ocean.<br />
[32] As with RMS <strong>refractivity</strong>, discrepancies between<br />
the <strong>GPS</strong> and radiosonde estimates <strong>of</strong> duct altitude, Z A<br />
<strong>GPS</strong><br />
and Z A Raob , could result either <strong>from</strong> spatial inhomogeneity<br />
or <strong>from</strong> ill conditioning <strong>of</strong> the inverse mapping <strong>from</strong><br />
excess phase path to <strong>refractivity</strong> structure. We have<br />
observed in Figure 7 that duct altitude is poorly constrained<br />
<strong>from</strong> <strong>ground</strong>-<strong>based</strong> DS <strong>GPS</strong> . However, DS <strong>GPS</strong><br />
does contain information about the altitude <strong>of</strong> ducting.<br />
The difficulty arises because the diagnostic signal occurs<br />
at very low satellite elevation angles, as illustrated<br />
graphically in Figure 10. Refractivity models A and B<br />
in Figure 10a have identical excess phase path at zenith<br />
but very different duct onset altitudes. The excess phase<br />
path <strong>from</strong> these two models differs significantly only at<br />
the lowest satellite elevation angles, reaching 10 cm at<br />
about b =2° (Figure 10b). At extremely low elevation<br />
angles the difference can be quite large (e.g., 1.6 m at<br />
0.4° satellite elevation in the example shown).<br />
[33] Unfortunately, in the data presented here, clean<br />
measurements are rarely available at the very lowest<br />
elevation angles. About 22% <strong>of</strong> all <strong>GPS</strong> satellite rises<br />
and sets yielded usable observations below 2° satellite<br />
elevation angle, and only 0.9% produced reliable estimates<br />
<strong>of</strong> DS <strong>GPS</strong> below zero. Hence, while the elevation dependence<br />
<strong>of</strong> DS <strong>GPS</strong> would theoretically permit us to distinguish<br />
the onset altitude <strong>of</strong> ducts, in practice the onset altitude <strong>of</strong><br />
ducting is rarely well resolved.<br />
[34] In the inset <strong>of</strong> Figure 10b we compare Z <strong>GPS</strong> A <strong>of</strong> the<br />
best fit model <strong>of</strong> DS <strong>GPS</strong> to Z Raob A <strong>of</strong> the model that best fits<br />
the contemporary Miramar radiosonde. To determine<br />
what the RMS difference would be if the two estimates<br />
were completely uncorrelated, we also compared Z Raob A to<br />
a set <strong>of</strong> randomly generated, Poisson-distributed numbers<br />
between 0 and 1 km. The artificial data set produced an<br />
RMS difference <strong>of</strong> 0.44 km. Estimates <strong>of</strong> Z <strong>GPS</strong> A in<br />
which the lowest satellite elevation angle <strong>of</strong> the DS <strong>GPS</strong><br />
Raob<br />
measurement is ^1.5° similarly have kZ A Z <strong>GPS</strong> A k ^<br />
0.44 km. The RMS difference improves for <strong>GPS</strong> observations<br />
below 1.5°, dropping to about 0.3 km for <strong>GPS</strong><br />
measurements tracked below 0° geometric elevation<br />
angles. Of course, the <strong>GPS</strong> and radiosonde estimates <strong>of</strong><br />
Z A are separated by more than 20 km and up to 6 hours in<br />
time, so the misfit combines the limitations <strong>of</strong> modeling<br />
DS <strong>GPS</strong> with sampling differences. Nevertheless, it is clear<br />
that estimates <strong>of</strong> duct altitude benefit significantly <strong>from</strong><br />
measurements at extremely low satellite elevation angles.<br />
[35] Figures 6 and 7 suggest that the change in <strong>refractivity</strong><br />
or ‘‘lapse’’ across a duct is relatively well determined,<br />
to within limits imposed by uncertainty <strong>of</strong> the duct<br />
altitude. To evaluate the <strong>GPS</strong> estimate <strong>of</strong> duct lapse, we<br />
limited the model search space to ducts with zero onset<br />
altitude. Forcing the model to fit a surface duct yields a<br />
conservative estimate <strong>of</strong> duct lapse, as implied, for<br />
example, in Figure 7. A time series comparison <strong>of</strong> this<br />
‘‘minimum-lapse’’ model <strong>of</strong> DS <strong>GPS</strong> to models <strong>of</strong> Miramar<br />
radiosonde <strong>refractivity</strong> is plotted in Figure 11a. Here,<br />
black circles indicate <strong>refractivity</strong> at the <strong>ground</strong> surface N 1<br />
measured by the meteorological sensor at times <strong>of</strong> <strong>GPS</strong><br />
remote sensing. N 1 <strong>of</strong> the best fit models <strong>of</strong> Miramar<br />
radiosondes (the tops <strong>of</strong> the thin, light gray bars) is<br />
similarly fixed to the Point Loma Met sensor measurements.<br />
The gray circles represent <strong>refractivity</strong> N B<br />
at altitude Z <strong>GPS</strong> B (i.e., the top <strong>of</strong> ducting for the surface<br />
duct model <strong>of</strong> DS <strong>GPS</strong> ). The best fit model <strong>of</strong> Miramar<br />
radiosonde <strong>refractivity</strong> has variable duct onset altitude<br />
Z Raob Raob<br />
A , as shown in Figure 11b, and <strong>refractivity</strong> at Z B<br />
corresponds to the base <strong>of</strong> the thin gray bars in Figure<br />
11a. The <strong>GPS</strong> estimate <strong>of</strong> N B compares favorably with the<br />
radiosonde much <strong>of</strong> the time, with larger misfit occurring<br />
when ducts are elevated. The RMS difference in duct