Vertical profiling of atmospheric refractivity from ground-based GPS
Vertical profiling of atmospheric refractivity from ground-based GPS
Vertical profiling of atmospheric refractivity from ground-based GPS

Create successful ePaper yourself
Turn your PDF publications into a flip-book with our unique Google optimized e-Paper software.
LOWRY ET AL.: REFRACTIVITY PROFILING FROM GROUND-BASED <strong>GPS</strong><br />
6<br />
6<br />
Pt Loma radiosonde (1524 UTC)<br />
Pt Loma radiosonde (2144 UTC)<br />
Pt. Loma <strong>GPS</strong> (Best-fit model)<br />
Pt. Loma <strong>GPS</strong> (Best-fit model)<br />
5<br />
SV 01 (1605 d292 99, az 226˚, el 0.9˚)<br />
5<br />
SV 10 (2200 d361 99, az 252˚, el 1.2˚)<br />
Pt. Loma <strong>GPS</strong> (10 cm RMS envelope)<br />
Pt. Loma <strong>GPS</strong> (10 cm RMS envelope)<br />
4<br />
4<br />
Altitude (km)<br />
3<br />
Altitude (km)<br />
3<br />
2<br />
2<br />
1<br />
1<br />
A. B.<br />
0<br />
150 175 200 225 250 275 300 325 350<br />
Refractivity (N-units)<br />
0<br />
150 175 200 225 250 275 300 325 350<br />
Refractivity (N-units)<br />
6<br />
6<br />
Pt Loma radiosonde (1657 UTC)<br />
Pt Loma radiosonde (1703 UTC)<br />
Pt. Loma <strong>GPS</strong> (Best-fit model)<br />
Pt. Loma <strong>GPS</strong> (Best-fit model)<br />
5<br />
SV 27 (1633 d363 99, az 244˚, el 1.3˚)<br />
5<br />
SV 07 (1727 d034 00, az 196˚, el 1.4˚)<br />
Pt. Loma <strong>GPS</strong> (10 cm RMS envelope)<br />
Pt. Loma <strong>GPS</strong> (10 cm RMS envelope)<br />
4<br />
4<br />
Altitude (km)<br />
3<br />
Altitude (km)<br />
3<br />
2<br />
2<br />
1<br />
0<br />
C. D.<br />
150 175 200 225 250 275 300 325 350<br />
Refractivity (N-units)<br />
1<br />
0<br />
150 175 200 225 250 275 300 325 350<br />
Refractivity (N-units)<br />
0.0 0.2 0.4 0.6 0.8 1.0 1.2 1.4 1.6 1.8 2.0 2.2<br />
Minimum RMS error in <strong>GPS</strong> Excess Phase (m)<br />
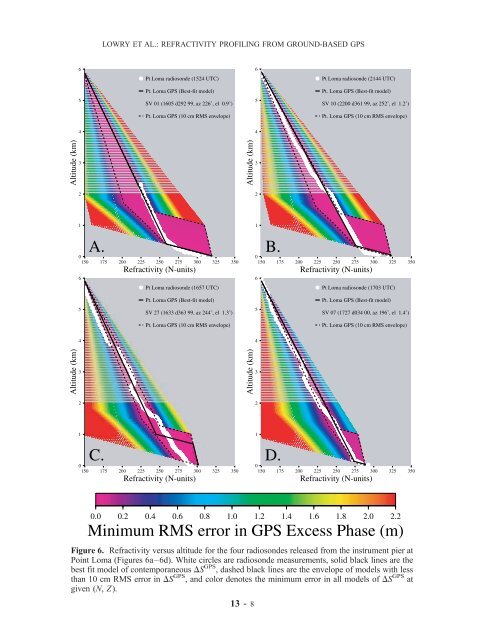
Figure 6. Refractivity versus altitude for the four radiosondes released <strong>from</strong> the instrument pier at<br />
Point Loma (Figures 6a–6d). White circles are radiosonde measurements, solid black lines are the<br />
best fit model <strong>of</strong> contemporaneous DS <strong>GPS</strong> , dashed black lines are the envelope <strong>of</strong> models with less<br />
than 10 cm RMS error in DS <strong>GPS</strong> , and color denotes the minimum error in all models <strong>of</strong> DS <strong>GPS</strong> at<br />
given (N, Z).<br />
13 - 8