Practical Long Range Guided Wave Inspection - Applications to ...
Practical Long Range Guided Wave Inspection - Applications to ...
Practical Long Range Guided Wave Inspection - Applications to ...

Create successful ePaper yourself
Turn your PDF publications into a flip-book with our unique Google optimized e-Paper software.
PRACTICAL LONG RANGE GUIDED<br />
WAVE INSPECTION - APPLICATIONS<br />
TO PIPES AND RAIL<br />
Peter Cawley<br />
NDE2002 predict. assure. improve.<br />
National Seminar of ISNT<br />
Chennai, 5. – 7. 12. 2002<br />
www.nde2002.org<br />
Department of Mechanical Engineering, Imperial<br />
College, London SW7 2BX, UK<br />
SUMMARY<br />
The inspection of large structures using conventional ultrasonic bulk wave techniques is<br />
slow because scanning is required if the whole structure is <strong>to</strong> be tested. Ultrasonic guided<br />
waves potentially provide an attractive solution <strong>to</strong> this problem because they can be excited<br />
at one location on the structure and will propagate many metres. However, guided wave<br />
testing is complicated by the presence of many possible wave modes, most of which are<br />
dispersive. These guided wave characteristics offer a wealth of opportunities for the<br />
extraction of information about the structure, but it is crucial <strong>to</strong> manage this complexity if<br />
the test is <strong>to</strong> be useable in industrial practice. This paper concentrates on long range testing<br />
using frequencies below 100 kHz. The progress from research work <strong>to</strong> a robust, commercial<br />
pipe testing system will be discussed, <strong>to</strong>gether with more recent research on applications <strong>to</strong><br />
plates and railroad rails. The paper concludes with a discussion of future research<br />
opportunities.<br />
INTRODUCTION<br />
<strong>Guided</strong> waves of different types can propagate in any bounded medium and include<br />
the well-known Rayleigh (surface) waves on a half-space and Lamb waves in plates. Similar<br />
types of wave can propagate in rods, cylinders and elongated structures which are not<br />
axially symmetric such as railroad rails and I-beams. The use of guided waves in NDE has<br />
been discussed for over 40 years, Worl<strong>to</strong>n [1] being one of the first <strong>to</strong> recognise their<br />
potential. The textbook by Rose [2] gives an introduction <strong>to</strong> the theory and application of<br />
guided waves and the same author has recently discussed the his<strong>to</strong>ry and potential of this<br />
type of inspection [3].<br />
<strong>Guided</strong> waves can be used in three regimes, each of which has been extensively<br />
researched: short range (
technique becomes even more attractive if part of the structure <strong>to</strong> be tested is inaccessible,<br />
for example a pipe passing under a road. The test is usually done in pulse-echo mode, the<br />
transducer transmitting the guided wave along the structure, and returning echoes indicating<br />
the presence of defects or other structural features.<br />
Unfortunately the ratio of the number of practical applications of guided waves <strong>to</strong><br />
the number of research papers in the area is rather small. This paper discusses the reasons<br />
for this and describes how the difficulties may be overcome so that the potential of the<br />
technique can be realised. This is followed by practical examples of pipe, railroad rail, plate<br />
and embedded tendon inspection, and the paper concludes with a review of future research<br />
and development directions.<br />
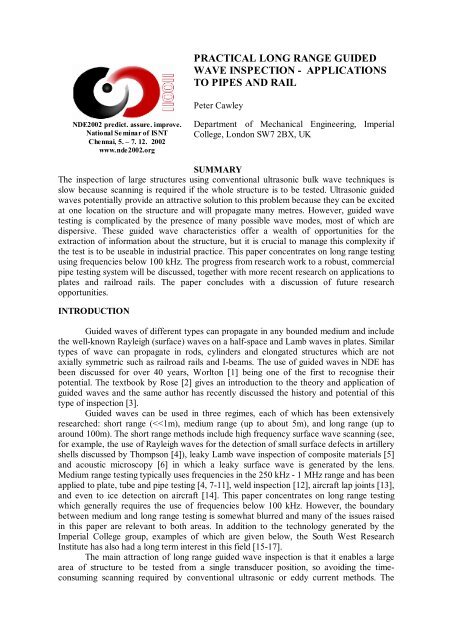
THE PRACTICAL PROBLEMS - COHERENT NOISE AND DISPERSION<br />
The main difficulty with medium and long range guided wave inspection is that it is<br />
very easy <strong>to</strong> obtain signals like that shown in Fig 1a. This shows the pulse-echo signal<br />
produced on a length of plain pipe by a group of transducers covering a quarter of the pipe<br />
circumference and connected in parallel so that they effectively act as a single transducer.<br />
Ideally the signal should contain two distinct echoes from the two ends of the pipe rather<br />
than the very complicated trace seen in the figure. The complication arises from the<br />
excitation of multiple modes which travel at different velocities in both directions, and these<br />
velocities being in general a function of frequency (i.e. the modes are dispersive). Fig 2a<br />
shows the dispersion curves for a 6 inch diameter, schedule 40 steel pipe. There are about<br />
50 modes present at frequencies below 100 kHz and many of them are strongly dispersive.<br />
Fig 2b shows the corresponding diagram for a plate. Here the group velocity is plotted as a<br />
function of frequency-thickness product and below about 1.6 MHz-mm only three modes<br />
are present (a 0 , s 0 and SH 0 ). Therefore in a 10 mm thick plate there are only 3 modes<br />
present below 160 kHz. Mode control is therefore easier in a plate than a pipe but other<br />
problems are more difficult, as will be discussed later.<br />
Fig 1b shows a clearer signal obtained at an early stage in the development of the<br />
pipe screening system discussed later. Reflections from two welds approximately 15m apart<br />
in a long pipe can clearly be distinguished. However, there are many smaller signals<br />
between the two weld echoes which should not be present since this was a new pipe.<br />
Averaging did not improve the signal, indicating that the problem is coherent, rather than<br />
random, noise. The welds are approximately -14 dB reflec<strong>to</strong>rs and the coherent noise level<br />
is about 10 dB below the weld echoes indicating that the signal <strong>to</strong> coherent noise ratio is<br />
between 20 and 25 dB. However, the target reflection size in this application was -26 dB so<br />
the system needed further refinement <strong>to</strong> reduce the noise. The coherent noise has two main<br />
sources:<br />
• the excitation and reception of unwanted modes;<br />
• the transmission of waves in the opposite direction along the pipe and the reception of<br />
echoes from that direction.<br />
The key <strong>to</strong> controlling coherent noise is therefore <strong>to</strong> excite and receive a single<br />
mode in one direction. The choice of mode will be influenced by the ease of exciting it<br />
while minimising the excitation of other modes, and by its sensitivity <strong>to</strong> the defect type(s) of<br />
interest. In addition <strong>to</strong> controlling coherent noise, it is also necessary <strong>to</strong> control dispersion.<br />
If the chosen mode is dispersive, the different frequency components in the signal travel at<br />
different velocities so the signal duration increases which compromises the spatial resolution<br />
(the ability <strong>to</strong> distinguish echoes from closely spaced reflec<strong>to</strong>rs). Dispersion is not very<br />
evident in Fig 1b since it was controlled by applying narrow band excitation centred on a<br />
region where the mode of interest is non-dispersive. This strategy <strong>to</strong>
6Group velocity (km/s)<br />
weld<br />
weld<br />
coherent<br />
noise level<br />
~15m<br />
0.5 ms<br />
(a)<br />
FIGURE 1. (a) Signal received on length of plain pipe using transducers over quarter of circumference; (b)<br />
signal received on welded pipe in early site test.<br />
(b)<br />
L(0,1)<br />
F(1,3)<br />
L(0,2)<br />
F(2,3)<br />
(a)<br />
F(1,2)<br />
T(0,1)<br />
0<br />
0 Frequency (kHz)<br />
100<br />
6<br />
S 0<br />
(b)<br />
S 1<br />
Group velocity (km/s)<br />
4<br />
2<br />
SH 0<br />
SH 1<br />
SH 2<br />
A 0<br />
A 1<br />
0<br />
0 2 4<br />
Frequency-Thickness (MHz-mm)<br />
FIGURE 2. Dispersion curves for (a) 6 inch, schedule 40 steel pipe; (b) steel plate.
overcome dispersion problems is often sufficient, though dispersion compensation [18] can<br />
also be valuable.<br />
CONTROLLING COHERENT NOISE<br />
In medium range testing, mode control is usually achieved by choosing an<br />
appropriate transducer and excitation signal. Fig 3a shows a schematic diagram of an<br />
EMAT (electro-magnetic acoustic transducer) which generates a wave in the structure via<br />
the Lorentz force and/or magne<strong>to</strong>striction [19, 20]. A narrow band signal (typically a few<br />
cycle <strong>to</strong>neburst) is applied <strong>to</strong> the meander coil and the current flows in opposite directions<br />
along successive limbs of the coil, so producing force in opposite directions. Therefore the<br />
spacing between the limbs of the coil controls the dominant wavelength of the excited<br />
wave. Hence a chosen mode can be excited by tuning the frequency, f, <strong>to</strong> the point on its<br />
dispersion diagram where the phase velocity is given by<br />
c p<br />
= fλ<br />
(1)<br />
where λ is the wavelength imposed by the EMAT. Direction control can be achieved by<br />
employing a second coil overlapping the first but displaced from it along the structure by a<br />
quarter wavelength. If the two coils are excited with the same signal, it may readily be<br />
shown that the waves generated in one direction interfere constructively, while in the other<br />
direction the interference is destructive. It is also possible <strong>to</strong> use a segmented coil [20].<br />
Mode control can also be achieved with piezoelectric excitation as shown<br />
schematically in Fig 3b. Here the transducer is oriented at an angle θ ι <strong>to</strong> the structure and<br />
directs compression waves <strong>to</strong>wards the structure via a coupling medium (often a plexiglas<br />
wedge). By the coincidence principle [21] the wavelength of the wave generated in the<br />
structure, λ p , is related <strong>to</strong> the wavelength of compression waves in the coupling medium, λ c ,<br />
by<br />
λ<br />
p<br />
λc<br />
=<br />
sinθ<br />
i<br />
(2)<br />
where θ i is the angle of incidence. Hence, the phase velocity in the structure is given by<br />
c<br />
p<br />
v<br />
=<br />
sinθ<br />
i<br />
(3)<br />
where v is the velocity of compression waves in the coupling medium. Therefore a chosen<br />
mode at a particular excitation frequency can be excited by orienting the transducer <strong>to</strong> the<br />
appropriate angle. The direction of propagation along the structure can be reversed by<br />
orienting the transducer at -θ i .<br />
It is important <strong>to</strong> use a transducer which forces the structure in the most appropriate<br />
direction. For example, at low frequency the s 0 mode in a plate involves predominantly inplane<br />
motion, while the a 0 mode is predominantly out-of-plane. It is therefore very difficult<br />
<strong>to</strong> obtain a satisfac<strong>to</strong>ry ratio of s 0 <strong>to</strong> a 0 signal by using a transducer such as a piezoelectric<br />
transducer on an angle wedge because it applies an out-of-plane force <strong>to</strong> the structure<br />
surface; if the s 0 mode is <strong>to</strong> be used in this regime, an EMAT designed <strong>to</strong> apply an in-plane<br />
force is preferable. The issue of mode excitability is discussed further in [22].
S<br />
N<br />
magnet<br />
meander coil<br />
(a)<br />
test plate<br />
λ<br />
transducer<br />
wedge<br />
(b)<br />
θ i<br />
λ c<br />
wave fronts in wedge<br />
λ p<br />
wave fronts in test plate<br />
FIGURE 3. Schematic diagram of excitation of guided waves by (a) EMAT; (b) piezoelectric transducer on<br />
wedge.<br />
FIGURE 4. Solid transducer assembly for 8 inch pipe showing array of dry coupled piezoelectric<br />
transducers.
The degree of modal selectivity obtained is governed by the size of the transducer<br />
and the excitation signal. The transducer size controls the effective wavelength bandwidth<br />
(with the EMAT) or the effective phase velocity bandwidth (with piezoelectric excitation),<br />
while the excitation signal governs the frequency bandwidth. This is discussed further in<br />
[21, 23-25]. In order <strong>to</strong> obtain satisfac<strong>to</strong>ry mode control, the transducer generally has <strong>to</strong> be<br />
a round 3-5 wavelengths long. For a mode with a phase velocity of 3 mm/µs, the<br />
wavelength is 6 mm at a frequency of 500 kHz so the required transducer size is modest.<br />
However, if the frequency is reduced <strong>to</strong> 50 kHz, the wavelength increases <strong>to</strong> 60 mm and the<br />
required transducer size becomes impractical. Therefore in long range testing an alternative<br />
<strong>to</strong> single, monolithic transducers must be sought and it has been found that an array of point<br />
sources is very attractive in several applications, as discussed below.<br />
If an array is used, satisfac<strong>to</strong>ry mode control requires that the direction of the force<br />
applied by the individual elements is appropriate for the desired mode, and that the<br />
individual array elements have good gain and phase consistency. Signal processing makes<br />
an important contribution <strong>to</strong> extracting the desired input mode - received mode combination<br />
from the array and rejecting other combinations, so improving the signal <strong>to</strong> coherent noise<br />
ratio; this is discussed further in the examples below. It is also potentially possible <strong>to</strong><br />
subtract a baseline signal obtained at an earlier stage in the life of a structure from the<br />
current signal in order <strong>to</strong> track changes. This is particularly applicable in 'smart structure'<br />
applications where the transducers are permanently attached, but the operation is not<br />
straightforward since, for example, temperature changes or small, unimportant changes in<br />
material properties with age will affect the dispersion relationships, and hence the received<br />
signals.<br />
EXAMPLES<br />
Pipe testing<br />
The safe operation of petrochemical plant requires screening of the pipework <strong>to</strong><br />
ensure that there are no unacceptable levels of corrosion. Since a significant proportion of<br />
industrial pipelines are insulated, this means that even external corrosion cannot readily be<br />
detected without the removal of the insulation, which can be prohibitively expensive. A<br />
quick, reliable method for the detection of corrosion under insulation (CUI) which does not<br />
involve removal of all the insulation is therefore required. The problem is even more severe<br />
in cases such as road crossings where the pipe is underground (often in a sleeve) for a<br />
limited distance; excavation of the pipe for visual or conventional ultrasonic inspection is<br />
extremely expensive so a technique <strong>to</strong> address this problem is particularly beneficial.<br />
The Imperial College NDT group, and latterly the spin-out company <strong>Guided</strong><br />
Ultrasonics Ltd, have developed a guided wave technique designed for the screening of long<br />
lengths (>10m) of pipes for corrosion. It seeks <strong>to</strong> detect corrosion defects removing of the<br />
order of 5-10% of the cross sectional area of the pipe at any axial location. It was originally<br />
developed for use on pipes in the 2-24 inch diameter range, though it can be used on both<br />
smaller and larger pipes; there have been recent applications <strong>to</strong> 36, 48 and 52 inch lines.<br />
The most attractive modes <strong>to</strong> use are those which have a mode shape which has<br />
uniform stress over the whole cross section of the pipe. This means that there will be equal<br />
sensitivity <strong>to</strong> cross section loss at any location through the wall thickness or round the<br />
circumference. Modes with a simple mode shape are also easier <strong>to</strong> excite in a pure form<br />
which is important in controlling coherent noise. The two modes which meet these criteria<br />
are the L(0,2) and T(0,1) modes shown in Fig 2a. These are essentially extensional and
amplitude<br />
(linear scale)<br />
mode converted<br />
reflection<br />
reflection of<br />
incident mode<br />
(a)<br />
amplitude<br />
(linear scale)<br />
mode converted<br />
reflection<br />
reflection of<br />
incident mode<br />
(b)<br />
0.5 m<br />
FIGURE 5. Typical signals from (a) axisymmetric feature e.g. weld; (b) corrosion.<br />
Call level<br />
DAC curve<br />
Weld DAC curve<br />
sketch of<br />
pipe layout<br />
FIGURE 6. <strong>Wave</strong>maker Pipe Screening System report from test adjacent <strong>to</strong> road crossing.
<strong>to</strong>rsional modes respectively. Both modes have the additional advantage of being nondispersive<br />
over a wide frequency band.<br />
Initial site trials of the technique carried out in the research phase in the mid 1990s<br />
used the L(0,2) mode at frequencies around 70 kHz [26, 27]. However, there is a second,<br />
unwanted, axially symmetric mode with particle displacements primarily in the axial and<br />
radial directions, L(0,1). This mode, which has a much lower velocity than L(0,2) in the<br />
operating frequency range above 35 kHz as shown in Fig 2a, makes it more difficult <strong>to</strong><br />
obtain pure mode signals. In contrast, T(0,1) is the only axially symmetric <strong>to</strong>rsional mode in<br />
the frequency range of interest, so axially symmetric <strong>to</strong>rsional excitation will only excite the<br />
T(0,1) mode. The <strong>to</strong>rsional mode also has the advantage that, in contrast <strong>to</strong> the L(0,2)<br />
mode, it does not involve radial displacement of the pipe wall. Therefore its propagation<br />
characteristics are not affected by the presence of liquid in the pipe so in-service inspection<br />
of lines carrying a liquid is straightforward.<br />
The <strong>Guided</strong> Ultrasonics Ltd <strong>Wave</strong>maker Pipe Screening System transducer array for<br />
an 8 inch pipe is shown in Fig 4. The array comprises two rings of dry-coupled, piezoelectric<br />
transducers [28] which apply a tangential force <strong>to</strong> the pipe surface, so exciting the <strong>to</strong>rsional<br />
mode; the two rings of transducers positioned roughly a quarter wavelength apart along the<br />
pipe (the precise fraction of the wavelength depends on the test frequency used) enable<br />
direction control. The transducer array is connected <strong>to</strong> the battery-operated testing<br />
instrument by a flexible cable; the test is controlled by a portable PC that is connected <strong>to</strong><br />
the instrument by an umbilical cable. In some cases it is convenient for the opera<strong>to</strong>r of the<br />
PC <strong>to</strong> be adjacent <strong>to</strong> the test location, but on other occasions it is better for the computer<br />
and opera<strong>to</strong>r <strong>to</strong> be in a van that can be up <strong>to</strong> 50m from the test location. Solid rings of the<br />
type shown in Fig 4 are manufactured for pipe diameters up <strong>to</strong> 8 inch, but above this they<br />
become bulky so a flexible, pneumatic clamping arrangement is used.<br />
The initial site trials [26,27] showed that corrosion defects of the target size (half<br />
wall thickness deep and half pipe diameter (16% circumference) in circumferential extent)<br />
could reliably be identified. However, echoes were also seen from butt welds since the weld<br />
caps are not generally removed so the weld presents a change in cross sectional area, and<br />
hence in effective acoustic impedance. The presence of the echo from a good weld makes it<br />
difficult <strong>to</strong> identify defects at welds, and also introduces the possibility of a weld being<br />
incorrectly identified as a defect in cases where the pipe is insulated or buried so the weld<br />
cannot be seen. This problem can be overcome by measuring the extent of mode conversion<br />
produced by a reflec<strong>to</strong>r.<br />
If an axially symmetric mode is incident on an axially symmetric feature in the pipe<br />
such as a flange, square end or uniform weld, then only axially symmetric modes are<br />
reflected. However, if the feature is non axially symmetric such as a corrosion patch, some<br />
non axially symmetric waves will be generated. These propagate back <strong>to</strong> the transducer<br />
rings and can be detected. If the T(0,1) mode is incident, the most important mode<br />
conversion is <strong>to</strong> the F(1,2) and F(2,2) modes. The amount of mode conversion obtained<br />
depends on the degree of asymmetry, and hence on the circumferential extent of the defect.<br />
The use of an array of transducers facilitates detection of the mode converted signals; if a<br />
monolithic transducer (equivalent <strong>to</strong> wiring all the elements of one ring of the array<br />
<strong>to</strong>gether) were <strong>to</strong> be used, the mode converted signals would not be detected since their<br />
displacements vary harmonically around the pipe so that the mean displacement is zero. In<br />
order <strong>to</strong> measure the mode conversion it is therefore necessary <strong>to</strong> access the signals<br />
received by individual transducers (or groups of adjacent transducers around the pipe)<br />
separately and <strong>to</strong> add them <strong>to</strong>gether in software with the appropriate phase shifts; the<br />
principles of this procedure are given in [29].<br />
Fig 5 shows typical reflections from symmetric and asymmetric features; the<br />
increase in the mode converted signal can clearly be seen in the asymmetric case and this is<br />
a key element of the defect identification scheme. Fig 6 shows an example report generated
y the <strong>Wave</strong>maker <strong>Wave</strong>Pro software for an epoxy painted, 4 inch pipe at a test position<br />
adjacent <strong>to</strong> a road crossing. The test range extends over more than 20m on either side of the<br />
rings which are located in the middle of the plot. The software identifies welds and<br />
computes a distance-amplitude correction (DAC) curve for the welds. It then calculates the<br />
defect call level by comparison with the weld echo level and the calculated output<br />
amplitude, knowing that an average site weld is a -14 dB reflec<strong>to</strong>r. The received<br />
axisymmetric signals are shown as a black curve while the non-axisymmetric, mode<br />
converted signals are shown as a red curve. The echo identified as +F2 is the only one<br />
where the red (mode converted) signal is significant compared <strong>to</strong> the black (reflection of<br />
incident mode) signal and this indicates possible corrosion at the entry point <strong>to</strong> a road<br />
crossing.<br />
Further practical examples of the use of the <strong>Guided</strong> Ultrasonics Ltd <strong>Wave</strong>maker<br />
Pipe Screening System can be found in [30-32]; another commercial system based on the<br />
earlier work [27] is described in [33]. The technique offers the possibility of rapid screening<br />
of long lengths of pipework for corrosion and other defects. A test range of 50m (25m in<br />
each direction) is commonly obtained from a single transducer position. No surface<br />
preparation is usually required and the transducers can be attached in less than 1 minute so<br />
long lengths of pipe can be screened in a day. Typical applications are the rapid, full<br />
coverage screening of long lengths of pipe. The method is also commonly used for the<br />
inspection of difficult-<strong>to</strong>-access locations such as sleeved road crossings, insulated pipe,<br />
wall penetrations and areas where rope access is required.<br />
Rail Testing<br />
Ultrasonic inspection systems that operate in the MHz range have been used for<br />
many years for the in-service testing of rail. Two specific areas that can present significant<br />
challenges for ultrasonic testing as currently deployed are the detection of smooth<br />
transverse/vertical defects and the volumetric examination of alumino-thermic welds. These<br />
two areas are of great importance as 39.5 % of rail breaks on the UK rail network operated<br />
by Railtrack plc. have been attributed <strong>to</strong> transverse/vertical defects and a further 22.4 % <strong>to</strong><br />
faults at alumino-thermic welds [34].<br />
Traditional ultrasonic techniques make use of transducers operating in pulse-echo<br />
mode that are applied at 0º (normal incidence) and 70º <strong>to</strong> the running surface of the rail on<br />
the centre line. The normal incidence transducer enables the depth of the rail <strong>to</strong> be<br />
determined and will also detect inclusions, horizontal cracks etc. The 70º transducer is<br />
designed <strong>to</strong> detect cracks running in the transverse direction and it is ideally suited <strong>to</strong><br />
detecting cracks in a plane at 20º <strong>to</strong> the vertical and many cracks do run at approximately<br />
this angle. There will also be some reflection from truly vertical cracks running normal <strong>to</strong><br />
the axis of the rail, particularly if they have rough surfaces. A tandem arrangement of a pair<br />
of transducers operating in pitch-catch mode may be better suited for the detection of<br />
transverse cracks, but it is more complicated <strong>to</strong> deploy. A serious problem with either<br />
method for detecting transverse/vertical defects is that the wave path is often blocked by<br />
cracks running close <strong>to</strong> and almost parallel <strong>to</strong> the running surface of the rail. In the case of<br />
alumino-thermic welds, the large material grain size strongly scatters ultrasonic waves at the<br />
frequencies that are used giving rise <strong>to</strong> high attenuation and reflected signals that are very<br />
difficult <strong>to</strong> interpret.<br />
<strong>Guided</strong> wave inspection is very attractive in this application as it is particularly<br />
sensitive <strong>to</strong> transverse vertical defects since the waves travel along the length of a rail.<br />
Small defects close <strong>to</strong> the surface will also not mask more severe, deeper, transverse cracks.<br />
A further advantage is that at the frequencies used, material attenuation due <strong>to</strong><br />
grain
user interface<br />
system electronics<br />
combined mechanical/<br />
pneumatic transducer<br />
clamping mechanism<br />
rail under test<br />
piezoelectric<br />
transducer<br />
array<br />
FIGURE 7. Pro<strong>to</strong>type rail testing instrument.<br />
End<br />
Head<br />
Crack<br />
Base<br />
Crack<br />
Weld<br />
with<br />
Defect<br />
Toe<br />
Crack<br />
Test<br />
Location<br />
End<br />
0<br />
dB<br />
-30<br />
Distance(m)<br />
-20 -15<br />
-10 -5 0 5<br />
Distance (m)<br />
FIGURE 8. A-scan display of results on 20m long section of rail with a variety of artificial defects.<br />
boundary scattering is very low and hence alumino-thermic weld material can be readily<br />
penetrated and tested.<br />
Analytical models exist for the exact calculation of the dispersion curves of<br />
structures with simple cross sectional geometry such as plates and pipes [35]. However, no<br />
such exact model exists for complex profiles such as a rail. Instead, a two-dimensional (2D)<br />
finite element (FE) method has been employed <strong>to</strong> predict the modes-shapes and guided<br />
wave characteristics for structures with complex cross sections such as rail [22]. Rail<br />
dispersion curves and example mode shapes calculated using this technique are presented in<br />
[36]. It is particularly interesting that different modes have energy concentrated in the head,<br />
web or foot of the rail, so introducing the possibility of improving the sensitivity <strong>to</strong><br />
particular locations of defect by appropriate mode choice, and also of determining the likely<br />
location of a defect in the cross section.<br />
The <strong>Guided</strong> Ultrasonics (Rail) Ltd pro<strong>to</strong>type rail testing system is shown in Fig 7. In<br />
order <strong>to</strong> obtain mode and propagation direction control it is necessary <strong>to</strong> deploy an array of
transducers all around the perimeter of the rail (excluding the underside). The individual<br />
transducers are similar <strong>to</strong> those employed in the pipe tester described above and are drycoupled<br />
<strong>to</strong> the rail using a combined mechanical and pneumatic actuation system. In this<br />
case the instrumentation is integral with the transducer assembly so the tester is a single,<br />
battery operated unit.<br />
An example display in A-scan format from a 20m length of rail with a variety of<br />
defects is shown in Fig 8. All the defects are seen and it is also possible <strong>to</strong> classify them by<br />
measuring the signals obtained in different transmitted mode - received mode combinations.<br />
This is made possible by individual addressing of the different transducers within the array.<br />
Further details are given in [36].<br />
Plate Testing<br />
At first sight, extending the long range guided wave inspection concept <strong>to</strong> plates is<br />
straightforward since at a given frequency there are fewer modes in a plate compared with a<br />
one dimensional structure such as a pipe or rail of similar thickness, and also the maximum<br />
propagation distance required is likely <strong>to</strong> be much shorter. However, the waves can<br />
propagate in an infinite number of directions in a plate, whereas they can only travel in two<br />
directions in a one dimensional structure. Therefore the main source of coherent noise in<br />
plate inspection is waves travelling in unintended directions. This is illustrated schematically<br />
in Fig 9 which shows an array testing a simple plate. A large echo will be received from the<br />
edge of the plate if a wave is sent from the array in the direction normal <strong>to</strong> the edge. Unless<br />
waves coming from the direction of the edge are perfectly eliminated by the signal<br />
processing, there is a danger that 'ghost' reflections will be produced that apparently come<br />
from other directions, and may be misinterpreted as defects.<br />
One approach <strong>to</strong> the problem is <strong>to</strong> use a transducer such as an EMAT of the type<br />
shown in Fig 3a which is several wavelengths wide. This will propagate waves in essentially<br />
one direction so the whole plate can be covered by scanning the transducer in the direction<br />
normal <strong>to</strong> the propagation direction [12]; in a strip mill, this scanning can be achieved with a<br />
stationary transducer positioned above the steel strip as it moves between the rollers [37].<br />
However, in other cases it is more convenient <strong>to</strong> have a stationary transducer and <strong>to</strong> 'look'<br />
in different directions across the plate by scanning electronically. This can be achieved by<br />
employing an array of point sources [38, 39]. In many cases such as pressure vessels or<br />
s<strong>to</strong>rage tanks, it will be desirable <strong>to</strong> test plate-like structures in service when they may have<br />
liquid on one side. In this case it is desirable <strong>to</strong> use a mode such as S 0 or SH 0 which has<br />
predominantly in-plane surface displacements in order <strong>to</strong> minimise energy leakage in<strong>to</strong> the<br />
liquid.<br />
Wilcox et al [39] have developed an EMAT array using the s 0 mode at frequencies<br />
around 170 kHz for the inspection of plates between 5 and 25 mm thick. The individual<br />
EMAT elements comprise a pancake coil with the magnetic field provided by a rare earth<br />
permanent magnet. These elements act as essentially point sources (and receivers) of the s 0<br />
mode. The need <strong>to</strong> avoid side lobes in the processed image sets a minimum spacing between<br />
the transducers and this minimum spacing is smaller than the transducer diameter required<br />
for efficient transduction. This problem has been overcome by printing the coils on a multilayered<br />
printed circuit board, the coils on different layers overlapping. The array is placed<br />
on the plate <strong>to</strong> be inspected and the test sequence is initiated from a controlling lap<strong>to</strong>p PC.<br />
The signal processing applied <strong>to</strong> the data obtained from the array provides beam steering<br />
and wavelength selectivity. The overall effect is <strong>to</strong> mimic the operation of a monolithic<br />
guided wave transducer operating in pulse-echo mode placed at the test location
test plate<br />
edge reflection<br />
ghost edge<br />
reflection<br />
array<br />
FIGURE 9. Schematic showing potential problem of ghost echoes in plate test.<br />
φ 30mm hole<br />
back edge<br />
φ 50mm hole<br />
front edge<br />
array<br />
plate edge<br />
FIGURE 10. Example result on 1m square, 5mm thick aluminium plate.<br />
100<br />
Attenuation (dB/m)<br />
80<br />
60<br />
40<br />
20<br />
A<br />
0<br />
0.0 1.0 2.0 3.0 4.0 5.0<br />
Frequency (MHz)<br />
FIGURE 11. Attenuation dispersion curves for axially symmetric modes in 22m diameter steel bar in limes<strong>to</strong>ne.<br />
end<br />
0<br />
0.4<br />
time (ms)<br />
0.8<br />
FIGURE 12. Example signal from 2.4m long rock bolt in mine.
and rotated though 360°. The result is an omni-directional B-scan (effectively a C-scan) of<br />
the surrounding area of the plate under test. The signals visible in the scan indicate the<br />
amplitude and position of reflec<strong>to</strong>rs in the plate and include signals from both features (such<br />
as edges) and defects.<br />
An example image of a 1m square, 5 mm thick aluminium plate with 30 mm and 50<br />
mm flat bot<strong>to</strong>med holes machined <strong>to</strong> half the plate thickness deep is shown in Fig 10. The<br />
largest signals are from the four edges of the plate; both holes are clearly seen, the spatial<br />
resolution being good enough for the echoes from the front and back of the larger one <strong>to</strong> be<br />
resolved. Further details of the plate tester with results on larger plates are given in [39].<br />
The range obtainable from a single array position is likely <strong>to</strong> be of the order of 5-10m in all<br />
directions and the test time is less than one minute so very rapid coverage of large areas can<br />
be obtained.<br />
Rock bolt testing<br />
The system of mine roof support known as rock bolting is increasingly used <strong>to</strong><br />
reinforce coal mine roofs in the UK and elsewhere, as it offers considerable safety and<br />
productivity improvements over the use of conventional steel framework. Rock bolts are<br />
steel studs that are fixed in<strong>to</strong> the roof <strong>to</strong> prevent the movement and expansion of rock<br />
strata, hence improving the stability of the roof. There is a considerable amount of strata<br />
movement data available <strong>to</strong> predict the condition of rock bolts, but there is currently no<br />
effective non-destructive test. Standard rock bolts for this application are 21.7mm in<br />
diameter, and up <strong>to</strong> 3 meters long. The installation procedure involves pre-drilling the roof<br />
with an oversize hole, which is then filled with fast-setting epoxy resin capsules. A portable<br />
installation machine is used <strong>to</strong> spin the rock bolt in<strong>to</strong> the hole, which causes the epoxy bags<br />
<strong>to</strong> puncture and the resin and hardener <strong>to</strong> be mixed. After curing, a nut and plate assembly<br />
is driven up the bolt and in<strong>to</strong> contact with the roof.<br />
When rock strata above the mine tunnel move there is a danger that the rock bolts<br />
will be deformed or broken so the main inspection requirement is <strong>to</strong> measure the length of<br />
the bolt. This is very straightforward with a free bolt in the labora<strong>to</strong>ry since a compression<br />
wave transducer coupled <strong>to</strong> the end of the bolt will send a cylindrical guided mode along the<br />
bolt and the length of the bolt can be estimated from the time at which the first end<br />
reflection is received. However, when the bolt is embedded in rock, there is severe leakage<br />
of the guided wave energy in<strong>to</strong> the surrounding rock so the guided wave attenuation is very<br />
high which limits the propagation distance. Fig 11 shows attenuation dispersion curves for a<br />
22 mm steel bar in limes<strong>to</strong>ne. There are different families of modes whose attenuation<br />
oscillates with frequency. The minimum attenuation is seen at around 2 MHz (point A),<br />
rather than at low frequencies as might intuitively be expected. This is because as the<br />
frequency increases, the energy at the points of minimum attenuation is increasingly<br />
concentrated in the middle of the bar and the surface motion, which controls the leakage of<br />
energy in<strong>to</strong> the surrounding medium, is small [40]. The attenuation at point A is around 20<br />
dB/m which is small enough for the end reflection from rock bolts <strong>to</strong> be identified. For<br />
example, Fig 12 shows the signal obtained from a 2.4m long bolt in a mine. Further details<br />
of rock bolt testing can be found in [41].<br />
SOME FUTURE DIRECTIONS<br />
In one dimensional structures the chief research challenge is <strong>to</strong> increase the test<br />
range on attenuative systems. For example, when pipes are coated with bitumen for<br />
corrosion protection, the guided wave mode propagates along the steel-bitumen bi-layer<br />
system and is attenuated due <strong>to</strong> material losses in the bitumen. The degree of attenuation is<br />
very dependent on the properties and thickness of the bitumen layer, its attachment <strong>to</strong> the
pipe and the frequency. A key requirement is <strong>to</strong> be able <strong>to</strong> test bitumen coated pipes at road<br />
crossings so a 10m test range is required. The test system has been improved <strong>to</strong> increase the<br />
fraction of such pipes that can successfully be inspected [30], but more work is needed <strong>to</strong><br />
understand the influence of bitumen properties [42].<br />
The attenuation in bitumen coated pipes is caused by the viscoelastic material,<br />
whereas in the rock bolts discussed above the attenuation is produced by leakage in<strong>to</strong> the<br />
surrounding medium. It would be very valuable <strong>to</strong> be able <strong>to</strong> increase the test range on<br />
embedded systems such as grouted post-tensioned cables in bridges but this is extremely<br />
difficult and likely <strong>to</strong> be feasible only <strong>to</strong> a limited extent [43].<br />
All the successful applications of long range testing <strong>to</strong> date have been on structures<br />
with low feature density. This means that the coherent noise produced by multiple<br />
reflections between different features is modest. It would be very valuable <strong>to</strong> be able <strong>to</strong> test<br />
more complex structures such as aircraft fuselage where the spacing between stiffeners is<br />
typically less than 300mm. Some initial work has been done on propagation in structures of<br />
this type [44, 45] which indicated that long range propagation was only likely <strong>to</strong> be possible<br />
at frequencies below around 200 kHz. This implies relatively long wavelengths which will<br />
reduce the spatial resolution obtainable, so making it very difficult <strong>to</strong> detect a defect close<br />
<strong>to</strong> another feature such as a stiffener. It may be possible <strong>to</strong> overcome this problem by using<br />
a subtraction algorithm <strong>to</strong> track changes in the received signal compared <strong>to</strong> a baseline<br />
measurement. This would be particularly relevant in smart structure applications where the<br />
transducers are permanently attached. However, simple subtraction of signals is unlikely <strong>to</strong><br />
be satisfac<strong>to</strong>ry as they will be affected by temperature changes, minor changes in material<br />
properties with age etc.<br />
Another interesting possibility is <strong>to</strong> use guided waves <strong>to</strong> probe inaccessible areas of a<br />
structure. For example there may be critical areas of a pipe network inside a containing wall<br />
and it would be desirable <strong>to</strong> inspect them from outside the wall. This is possible with the<br />
pipe testing system discussed above, but in some applications it will be necessary <strong>to</strong> find<br />
very small defects. Li and Rose [46] have used an array of transducers around the pipe <strong>to</strong><br />
focus energy at particular positions on the pipe circumference at chosen axial locations, the<br />
focusing being a result of constructive interference of the various guided modes excited by<br />
each transducer in the array. This approach also has potential in more complex structural<br />
geometries.<br />
CONCLUSIONS<br />
<strong>Guided</strong> wave inspection potentially enables a large area of structure <strong>to</strong> be tested<br />
from a single transducer position, so avoiding the time-consuming scanning required by<br />
conventional ultrasonic or eddy current methods. However, until recently, this potential has<br />
only been realised in a small number of practical applications. This is largely due <strong>to</strong> the<br />
difficulty of controlling the different possible modes and propagation directions so that the<br />
signal-<strong>to</strong>-coherent noise ratio is satisfac<strong>to</strong>ry and simple, easily interpretable signals are<br />
obtained. It is therefore important for research in this field <strong>to</strong> concentrate both on exploring<br />
the opportunities offered by the multiple possible modes, and on managing the complexity<br />
that the presence of so many modes can produce.<br />
It has been shown that an array of transducers acting as point sources provides a<br />
basis from which these problems can be overcome and examples of pipe, rail and plate<br />
testing have been presented. To date, most applications have been on simple structures with<br />
a low density of joints, stiffeners etc. Future research directions include the inspection of<br />
more complex structures and developing techniques <strong>to</strong> test systems where the attenuation is<br />
very high.<br />
ACKNOWLEDGEMENTS
The author is grateful <strong>to</strong> present and past members of the NDT group at Imperial<br />
College, particularly Drs Mike Lowe, David Alleyne, Brian Pavlakovic and Paul Wilcox,<br />
for assistance with the work reported here. Drs Alleyne and Pavlakovic are now with<br />
<strong>Guided</strong> Ultrasonics Ltd who market the pipe and rail testing systems.<br />
REFERENCES<br />
1. Worl<strong>to</strong>n, D.C., Non-Destructive Testing 15, 218 (1957).<br />
2. Rose, J.L., Ultrasonic waves in solid media, Cambridge University Press, New York,<br />
1999.<br />
3. Rose, J.L., Materials Evaluation 60, 53 (2002).<br />
4. Thompson, R.B., in Review of Progress in QNDE, Vol 16, eds. D.O. Thompson and<br />
D.E. Chimenti (eds), Plenum, New York, 1997, p121.<br />
5. Chimenti, D.E. and Martin, R.W., Ultrasonics 29, 13 (1991).<br />
6. Briggs, G.A.D., Acoustic Microscopy Clarendon Press, Oxford, 1992.<br />
7. Whitting<strong>to</strong>n, K.R., Brit J NDT 31 (1989).<br />
8. Böttger, W., Schneider, H., and Weingarten, W., Nuclear Eng. and Design 102, 356<br />
(1987).<br />
9. Mohr, W. and Höller, P., IEEE Trans Sonics and Ultrasonics SU-23 69 (1976).<br />
10. Hirao, M. and Ogi, H., NDT&E International 32 127 (1999).<br />
11. Alers, G.A. and Burns, L.R., Materials Evaluation 45 1184 (1987).<br />
12. Salzburger, H.-J., Dobmann, G., and Mohrbacher, H., IEE Proc: Science,<br />
Measurement and Technology 148 143 (2001).<br />
13. Rose, J.L., Soley, L., Materials Evaluation 50 1080 (2000).<br />
14. Hongerholt, D.D., Willms, G., Rose, J.L., in Review of Progress in QNDE, Vol 21,<br />
eds. D.O. Thompson and D.E. Chimenti (eds), American Inst Physics, New York,<br />
2002, p1023.<br />
15. Kwun, H. and Burkhardt, G. L., NDT Internationa 21 341 (1988).<br />
16. Kwun, H. and Holt, A. E., NDT & E International 28 211 (1995).<br />
17. Kwun, H. and Bartels, K. A., Ultrasonics 36 171 (1998).<br />
18. Wilcox, P.D., Lowe, M.J.S. and Cawley, P., in Review of Progress in QNDE, Vol 20,<br />
op. cit. (2001), p. 555.<br />
19. Thompson, R.B., IEEE Trans Sonics and Ultrasonics SU-25 7 (1978).<br />
20. Hubschen, G., NDT net, 3 (1998).<br />
21. Vik<strong>to</strong>rov, I.A., Rayleigh and Lamb waves, Plenum, New York, 1967.<br />
22. Wilcox, P., Evans, M., Dilient, O., Lowe, M. and Cawley, P., in Review of Progress<br />
in QNDE, Vol 21, op. cit. (2002), p. 203.<br />
23. Alleyne, D.N. and Cawley, P., NDT&E International 25 11 (1992).<br />
24. Monkhouse, R.S.C., Wilcox, P.D. and Cawley, P., Ultrasonics 35 489 (1997).<br />
25. Ditri, J.J. and Rose, J.L. , Journal of Applied Mechanics 61 330 (1994).<br />
26. Alleyne, D.N. and Cawley, P., Materials Evaluation 55 504 (1997).<br />
27. Alleyne, D.N., Cawley, P., Lank, A.M. and Mudge, P.J., in Review of Progress in<br />
QNDE, Vol 16, op. cit. (1997), p. 1269.<br />
28. Alleyne, D.N. and Cawley, P., J NDE 15 11 (1996).<br />
29. Lowe, M.J.S., Alleyne, D.N. and Cawley, P., Journal of Applied Mechanics 65 649<br />
(1998).<br />
30. Alleyne, D.N., Pavlakovic, B., Lowe, M.J.S. and Cawley, P., Insight 43 93 (2001).<br />
31. Sheard, M. and McNulty, A., Insight 43 79 (2001).<br />
32. Wassink, C.H.P., Robers, M.A., de Raad, J.A. and Bouma, T., Insight 43 86 (2001).<br />
33. Mudge, P.J. (2001), Insight 43 74 (2001).
34. Sawley, K. and Reiff, R. 'Rail failure assessment for the office of the rail regula<strong>to</strong>r',<br />
Report No. P-00-070 produced by Transportation Technology Center, Inc., Pueblo,<br />
Colorado, USA, 2000.<br />
35. Pavlakovic, B., Lowe, M.J.S., Alleyne, D.N. and Cawley, P., in Review of Progress in<br />
QNDE, Vol 16, op. cit. (1997), p. 185.<br />
36. Wilcox, P., Cawley, P., Lowe, M.J.S., Alleyne, D.N., Pavlakovic, B., Evans, M. and<br />
Vine, K. '<strong>Long</strong> range inspection of rail using guided waves', in these proceedings.<br />
37. Ploegaert, H., Corus Group, private communication.<br />
38. Wilcox, P.D., Lowe, M.J.S. and Cawley, P., in Review of Progress in QNDE, Vol 19,<br />
op. cit. (2000), p. 1049.<br />
39. Wilcox, P.D., Lowe, M.J.S. and Cawley, P. 'An EMAT array for the rapid inspection<br />
of large structures using guided waves', in these proceedings.<br />
40. Pavlakovic, B.N., Lowe, M.J.S. and Cawley, P., Journal of Applied Mechanics 68 67<br />
(2001).<br />
41. Beard, M.D., Lowe, M.J.S. and Cawley, P., Insight 44 19 (2002).<br />
42. Simonetti, F. and Cawley, P. 'A guided wave technique for the characterization of<br />
highly attenuative viscoelastic materials', in these proceedings.<br />
43. Beard, M.D., Lowe, M.J.S. and Cawley, P. '<strong>Inspection</strong> of Steel Tendons in Concrete<br />
Using <strong>Guided</strong> <strong>Wave</strong>s', in these proceedings.<br />
44. Dal<strong>to</strong>n, R.P., Cawley, P. and Lowe, M.J.S., IEE Proc Science, Measurement and<br />
Technology 148 169 (2001).<br />
45. Dal<strong>to</strong>n, R.P., Cawley, P. and Lowe, M.J.S., J. NDE 20 29 (2001).<br />
46. Li, J. and Rose, J. L., IEEE Trans Ultrasonics, Ferroelectrics & Frequency Control<br />
48 761 (2001).