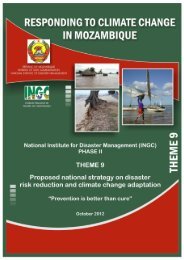
Theme 2 Coastal Protection ENG.pdf - Africa Adaptation Programme
Theme 2 Coastal Protection ENG.pdf - Africa Adaptation Programme
Theme 2 Coastal Protection ENG.pdf - Africa Adaptation Programme

Create successful ePaper yourself
Turn your PDF publications into a flip-book with our unique Google optimized e-Paper software.
Contact details for correspondence:<br />
André Theron<br />
Laurie Barwell<br />
atheron@csir.co.za<br />
lbarwell@csir.co.za<br />
Tel: +27 21 888 2511/2400<br />
Fax: +27 21 888 2693<br />
PO Box 320<br />
7599 Stellenbosch<br />
South <strong>Africa</strong><br />
Project Director: Joao Tiago MM Ribeiro<br />
Project Coordinator: Barbara van Logchem<br />
Science Coordinator: Antonio J Queface<br />
Report to be referenced as:<br />
Theron, A.K. & Barwell, L. 2012. Responding to climate change in Mozambique: <strong>Theme</strong> 2: <strong>Coastal</strong><br />
planning and adaptation to mitigate climate change impacts. Stellenbosch: CSIR.<br />
October 2012, p 1
S.1 BACKGROUND<br />
Mozambique is recognized as one of the<br />
countries in <strong>Africa</strong> that is most vulnerable to<br />
climate change. Hazards such as droughts and<br />
floods, variable rainfall and tropical cyclones<br />
already significantly affect the country.<br />
The country’s coastal zone is particularly<br />
vulnerable to the expected impacts of climate<br />
change. Contributing factors include:<br />
• Vast low-lying coastal plains such as delta<br />
coasts;<br />
• High population concentrations in close<br />
proximity to the sea;<br />
• Poverty;<br />
• Low capacity to defend infrastructure;<br />
• Susceptibility to cyclone activity;<br />
• Soft erodible coasts; and<br />
• Inadequate and ageing coastal defences.<br />
This situation is aggravated by direct exposure<br />
to high wave energy regimes in some parts, a<br />
potential increase in cyclone impacts, and<br />
impacted natural coastal defences such as<br />
dunes, mangroves and coral reefs. Large<br />
numbers of the local population also rely<br />
heavily on goods and services and economic<br />
benefits provided by the coastal zone.<br />
In this regard, the National Institute for<br />
Disaster Management (INGC) initiated two<br />
studies to define and locally contextualise<br />
important drivers and impacts of climate<br />
change in the country. Phase I, completed in<br />
2009, focused on determining the impacts of<br />
climate change on Mozambique at the macro<br />
level. The current project, Phase II, focuses on<br />
both the macro and the micro levels, with an<br />
emphasis on the implementation of<br />
adaptation measures and providing strategic<br />
and scientific evidence-based guidance for<br />
decision-making.<br />
Led by the Mozambican government, the<br />
overall goal of the Phase II project is to help<br />
protect the country against the potential<br />
impacts of climate change, and to plan for and<br />
kick start prevention through the<br />
implementation of adaptation measures at<br />
national scale, on the basis of science and in<br />
support of sustainable development.<br />
As such, a multi-disciplinary group of<br />
scientists from Mozambique and other<br />
institutions formulated 9 themes to<br />
encapsulate the research challenges faced,<br />
namely:<br />
• <strong>Theme</strong> 1: Early Warning at a Different Scale<br />
• <strong>Theme</strong> 2: <strong>Coastal</strong> planning and adaptation<br />
to mitigate climate change impacts<br />
• <strong>Theme</strong> 3: Cities prepared for climate<br />
change<br />
• <strong>Theme</strong> 4: Building resilience in partnership<br />
with the private sector<br />
• <strong>Theme</strong> 5: Water – doing More with less<br />
• <strong>Theme</strong> 6: Food – Meeting demands.<br />
• <strong>Theme</strong> 7: Preparing People<br />
• <strong>Theme</strong> 8: Ocean Climate Change (Extremes)<br />
• <strong>Theme</strong> 9: Proposed national strategy on<br />
disaster risk reduction and climate change<br />
adaptation<br />
October 2012, p 2
While this study is primarily concerned with<br />
<strong>Theme</strong> 2, it is closely aligned with <strong>Theme</strong>s 3<br />
and 4, and addresses the following key<br />
questions:<br />
• Where are the most vulnerable areas along<br />
the coast, at the local/micro level?<br />
• What will these areas look like, with<br />
climate change, in future?<br />
• Which key infrastructure and future<br />
investment plans are at risk in these areas?<br />
• What recommendations are in order for<br />
planned investments along the coast, with<br />
emphasis on Beira and Maputo?<br />
• What structural coastal protection<br />
measures are needed to compensate for<br />
the potential effects of climate change?<br />
• What shoreline management plans are<br />
most appropriate for these areas?<br />
• What should be the strategic framework on<br />
which all coastal structures and sea<br />
defences can be evaluated?<br />
• What should go into a coastal zone<br />
information system?<br />
• What input can be provided for in a coastal<br />
management policy?<br />
The INGC also emphasised the need for a proactive<br />
approach to protect lives and<br />
infrastructure, while at the same time finding<br />
sustainable solutions that are durable and low<br />
cost.<br />
The Scope of Work is detailed in Appendix 3<br />
with the response to the key questions and<br />
each expected deliverable from the study<br />
listed, together with the place in the<br />
document where the detailed results can be<br />
found.<br />
Following the introduction and background<br />
information in Chapters 1 and 2, Chapter 3<br />
provides a brief overview of the study area<br />
and the study sites which form the focus of<br />
<strong>Theme</strong> 2. The research approach and<br />
methodologies are discussed in Chapter 4.<br />
The physical factors that influence the risk to<br />
coastal infrastructure and the lives and<br />
livelihoods of coastal communities in current<br />
and future climate scenarios are discussed in<br />
Chapter 5 under the heading of Drivers of<br />
Risk. An assessment of the coastal hazards<br />
associated with these drivers of risk is<br />
provided in Chapter 6.<br />
The results of research on adaptation<br />
strategies and measures along with associated<br />
coastal protection options are presented in<br />
Chapter 7 followed by a discussion and site<br />
specific recommendations in Chapter 8. The<br />
results of interaction with municipal and<br />
institutional leaders and technical officials at<br />
some of the study sites are provided in<br />
Chapter 9. The key conclusions with<br />
recommendations are summarised in Chapter<br />
10. An extended list of references is provided<br />
as Chapter 11 followed by a comprehensive<br />
Glossary of Terms in Chapter 12.<br />
The underlying detail of selected sections is<br />
included in the Appendices.<br />
Note that Chapter 10 can be extracted as a<br />
stand alone document.<br />
S.2 KEY CONSIDERATIONS AND<br />
FINDINGS<br />
S.2.1 Drivers of change<br />
In <strong>Theme</strong> 2 the physical factors that influence<br />
the risk to coastal infrastructure in current<br />
and future climate scenarios were identified.<br />
This included consideration of the current<br />
situation along with future sea-level rise<br />
scenarios of 0.5m, 1.0m or 2m by 2100. These<br />
are further considered both with and without<br />
taking cyclones into account and the<br />
consideration of possible increases in<br />
“storminess” being another component of<br />
climate change.<br />
October 2012, p 3
The primary hazards to physical (abiotic)<br />
coastal infrastructure related to sea storms<br />
and climate change are:<br />
• Extreme inshore sea water levels resulting<br />
in flooding and inundation of low lying<br />
areas.<br />
• Changes in cyclone characteristics, winds<br />
and local wave regime resulting in direct<br />
wave impacts.<br />
• <strong>Coastal</strong> erosion and under-scouring of, for<br />
example, foundations and structures.<br />
• System complexities, thresholds and nonlinearities,<br />
for example related to sand<br />
transport.<br />
• A combination of extreme events, such as<br />
sea storms during high tides plus sea level<br />
rise, will have the greatest impacts and will<br />
increasingly overwhelm existing<br />
infrastructure as climate change related<br />
factors set in time.<br />
The main drivers of change related to the<br />
above are thus waves and sea water levels<br />
(and to a lesser extent winds and currents). A<br />
detailed discussion can be seen in Chapters 5<br />
and 6.<br />
The shoreline response and flooding impact is<br />
influenced by coastal parameters/processes<br />
such as: topography, geology, inshore wave<br />
action, sea level (including the tidal state and<br />
future rise), bathymetry and foredune<br />
volume.<br />
To be of more use in hazard quantification<br />
and ultimately in finding ways of reducing<br />
risks and deriving practical adaptation<br />
measures, it is necessary to be able to predict<br />
or forecast the coastal response and severity<br />
of impacts. To this end, given the lack of<br />
historic data and information along the<br />
Mozambican coastline, three flooding<br />
scenarios are defined to establish the hazard<br />
levels at the specific sites in terms of possible<br />
flooding due to the various factors associated<br />
with ‘normal’ meteorological factors as well<br />
as the effects of climate change.<br />
These three flooding level scenarios were<br />
calculated for each of the study towns and<br />
cities as depicted in the figure below (the 3<br />
bars for each town).<br />
<strong>Coastal</strong> flooding levels for 11 towns/cities (see Figure 6.3 in Chapter 6)<br />
October 2012, p 4
S.2.2 Coarse scale coastal vulnerability<br />
assessment<br />
Broadly speaking, the low lying central delta<br />
coast areas (e.g. Beira) are very vulnerable in<br />
terms of elevation (see Figure below). The<br />
highest occurrence of cyclones (very high<br />
hazard) is found along the central parts of<br />
Mozambique, tapering off to the south (from<br />
roughly Tofo) and also sharply to the north<br />
(from about Ilha de Mocambique).<br />
Coarse overview of hazards and vulnerability of Mozambican coast<br />
(See Figure 6.21 in Chapter 6)<br />
October 2012, p 5
S.2.3 Local / micro scale coastal<br />
vulnerability assessment<br />
Analyses were carried out to determine the<br />
vulnerability of key coastal cities and towns<br />
(identified by the INGC) to the impact of a<br />
range of biophysical change scenarios.<br />
The vulnerability to the forces from the sea of<br />
approximately 10 km of shoreline at each site<br />
was assessed by evaluating 14 abiotic<br />
parameters against an agreed to set of criteria<br />
(see Table 6.1 in Chapter 6). The vulnerability<br />
assessment was done with and without<br />
climate change factors, and also with and<br />
without the effect of cyclones. Total<br />
vulnerability maps are available for each of<br />
the study sites, for the 8 scenarios that<br />
include cyclones (i.e. C1 to D4).<br />
The figure below shows the detailed coastal<br />
vulnerability comparison of the 12 coastal<br />
study sites when the most likely future<br />
climate change scenario, C4, is used.<br />
(Scenario C4 considers a 1m sea-level rise by<br />
2100 and includes both the effects of cyclones<br />
and an increase in storminess due to climate<br />
change.<br />
A comparison of the vulnerabilities of the 12 study sites under the most likely future case<br />
scenario (C4) (See Figure 6.36 in Chapter 6)<br />
October 2012, p 6
Results show that the most vulnerable towns<br />
are Ponta do Ouro, Maputo, XaiXai Beach,<br />
Tofo, Villanculos, Beira and Pemba. Beira is<br />
identified as the most vulnerable city.<br />
S.2.4 Appropriate adaptation measures<br />
A comprehensive literature review led to the<br />
identification of a number of management<br />
options and “soft” and “hard” coastal<br />
engineering methods available to protect the<br />
shoreline (see Chapter 7). By considering the<br />
coastal processes and characteristics of the<br />
study area, and factors governing suitability<br />
for coastal development, various potential<br />
response options were identified.<br />
Based on the foregoing evaluation<br />
considerations and criteria, and including all<br />
appropriate options, the priority<br />
adaptation/”no-regret” measures were<br />
grouped according to type and impact,<br />
covering the most relevant climate change<br />
issues for Mozambique coastal towns and<br />
cities (Chapter 7).<br />
The results together with site investigations<br />
allowed coastal engineers to determine the<br />
most appropriate adaptation options to<br />
introduce for a particular area within the<br />
study areas. Following a conservative and<br />
precautionary approach, a list of prioritised<br />
adaptation response actions for each town<br />
and city was recommended (Chapter 8).<br />
S.3 KEY CONSIDERATIONS AND<br />
FINDINGS<br />
S.3.1 Integrated coastal planning and<br />
management<br />
The adoption and implementation of the<br />
strategic principles and guidelines on planning<br />
for and responding to coastal impacts and<br />
including specifically climate change impacts,<br />
as discussed in Chapter 7 is seen as the first<br />
and most important action point.<br />
Most of the response options are purposefully<br />
what can be termed “soft” options or<br />
“working with nature”. Following an<br />
integrated coastal planning approach is in line<br />
with strategic principles and best practise<br />
guidelines in terms of coastal management<br />
and responding to climate change. This simple<br />
management level decision will go a long way<br />
in reducing the need for constructing<br />
expensive coastal defences in many instances,<br />
especially in the long-term. Activities are,<br />
amongst others:<br />
• Plan any coastal construction so that it is a<br />
safe distance away from the high-water<br />
mark and reinstate natural defence<br />
mechanisms with the necessary<br />
environmental authorisations.<br />
• Undertake holistic planning and<br />
implementation through the development<br />
and implementation of <strong>Coastal</strong><br />
Management <strong>Programme</strong>s that incorporate<br />
Shoreline Management Plans.<br />
• Establish a coastal development setback<br />
line which is designed to protect both the<br />
natural environment from encroachment<br />
from buildings as well as protecting<br />
beachfront developments from the effects<br />
of storms and accelerated coastal erosion.<br />
• Work with nature by protecting the<br />
integrity of buffer dune systems, which<br />
October 2012, p 7
should be vegetated with appropriate dune<br />
species as per the original natural zones<br />
and maintained.<br />
• Maintain, or even better, increase the sand<br />
reservoir (volume) stored in the dune<br />
system.<br />
• <strong>Protection</strong>, restoration and maintenance of<br />
natural systems like mangroves and coral<br />
reefs.<br />
S.3.2 Site specific adaptation options<br />
To illustrate the assessment approach and the<br />
way the results are presented for each study<br />
site, the city of Beira is used as the example<br />
below. The results for the other study sites<br />
are presented in a similar manner in<br />
Chapter 8.<br />
<strong>Adaptation</strong> / coastal protection options based on general criteria, local site characteristics and<br />
current use/”value” for Beira. (See figure 8.1 in Chapter 8)<br />
October 2012, p 8
The key adaptation measures found to be<br />
appropriate for Mozambique is summarised in<br />
the large white block in the figure, which<br />
include four “Management options” (labelled<br />
A1 to A4), three “Soft<br />
engineering”/Restoration measures (B1, B2 &<br />
B3), four “Hard engineering” & armouring<br />
options (C1s, C1r, C2, C5), and two options<br />
more suitable for low/moderate wave energy<br />
sites (C11 & C12).<br />
The three or four options or combination of<br />
options considered most suitable for each<br />
0.5 km alongshore section of the coast at<br />
Beira are indicated in the small white block<br />
adjacent to each marker on the map. The<br />
labels within each small block (e.g. A1 or C5,<br />
etc.) refer to the labelled options described in<br />
the large white block.<br />
The large red numbers (1 to 4) on the figures<br />
indicate the recommended order of<br />
implementation of the identified coastal<br />
adaptation measures for Beira. In other<br />
words, Figure 8.1 represents a “plan” or<br />
“map” summarising the preferred adaptation<br />
options along each 0.5 km section of the<br />
western, southern and south-eastern Beira<br />
coast.<br />
It should be noted that specific engineering<br />
design details and accurate costing of each<br />
option can only be done once site specific<br />
engineering and environmental investigations<br />
have been carried out. It is absolutely critical<br />
to involve experienced coastal engineering<br />
and coastal environmental professionals in<br />
the detailed planning, design and<br />
implementation of the chosen options.<br />
S.3.3 Seek opportunities for publicprivate-partnerships<br />
(PPP)<br />
In many cases sound planning and future<br />
development beyond the reach of the sea<br />
forces can be implemented successfully. Many<br />
opportunities for entering into ‘design-&-<br />
build’ type PPP exist which have the potential<br />
to co-fund the implementation of the more<br />
costly “hard”-engineering adaptation options.<br />
S.3.4. Continue active engagement and<br />
communication with stakeholder to<br />
disseminate the outputs and<br />
facilitate uptake<br />
Observations by the study team during<br />
interaction with stakeholder groups at various<br />
levels of authority leads to the following<br />
recommendations presented for<br />
consideration:<br />
The recommendations fall into three<br />
categories, namely (a) those that relate to the<br />
various decision-makers, (b) those at a more<br />
technical/scientific level, and (c) those that<br />
relate to knowledge dissemination and<br />
decision-making.<br />
S.4 MONITORING AND<br />
EVALUATION REQUIREMENTS<br />
S.4.1 Establish a baseline<br />
Following on the present Phase II work, it is<br />
expected that there will be an<br />
implementation phase. In any follow up<br />
phase of work, it is essential to include as<br />
priority additional data collection and<br />
monitoring to address the critical gap in<br />
regional, national and local level data and<br />
information required to enable detailed site<br />
planning and design and to increase the level<br />
of confidence in the key sets of information<br />
on which the adaptation measures identified<br />
in this study are based.<br />
The parameters and issues which should be<br />
monitored include the following:<br />
October 2012, p 9
Cyclone characteristics – done when<br />
appropriate.<br />
Winds and local wave regime (and sea<br />
storms) – ongoing.<br />
Inshore sea water levels ( tides and sea level<br />
trends) - ongoing<br />
• Shoreline stability and trends (erosion /<br />
accretion) - a baseline survey as soon as<br />
possible followed by repeat surveys every<br />
three to five years, and after each major<br />
cyclone.<br />
• Integrity of built coastal<br />
defences/structures - a baseline survey<br />
followed by repeat surveys every three to<br />
five years. This should be a critical input<br />
into an effective infrastructure<br />
maintenance plan.<br />
• Integrity of natural coastal defences<br />
(dunes, mangroves, coral reefs, wetlands) –<br />
a baseline followed by regular repeats as<br />
appropriate. This should also be a critical<br />
input into an effective maintenance and<br />
wider integrated coastal zone management<br />
plan.<br />
• It is of utmost importance to collect<br />
sufficiently detailed topographic and<br />
bathymetric data at identified priority<br />
areas. This can mostly be a “once off”<br />
baseline data collection task, but should be<br />
repeated at longer intervals, perhaps every<br />
10 years for the topographic data, or<br />
immediately after any major change<br />
caused by, for example, a cyclone that will<br />
then form the new baseline.<br />
As far as can be determined, the first three<br />
items (indicated by a tick) are being<br />
monitored to some degree or can be derived<br />
indirectly from existing monitoring actions.<br />
However, the last four items (indicated by a<br />
square dot) are not being monitored (as far as<br />
it is known). These items are also critical for<br />
any proper integrated coastal zone<br />
management and sustainable coastal<br />
developments assessments and plans. Thus, it<br />
is strongly recommended that actions be<br />
taken to ensure that effective monitoring of<br />
all the above mentioned parameters is<br />
undertaken.<br />
As indicated, while some of the parameters<br />
need to be collected at very short time<br />
intervals (e.g. sub-hourly wind data), others<br />
need only be collected every few years (e.g.<br />
topographic data).<br />
S.4.2 Ongoing monitoring, evaluation,<br />
dissemination and response<br />
Building onto the recommendation on<br />
decision-support that arose through the<br />
interaction with stakeholder groups, it is<br />
considered of strategic and tactical<br />
importance to implement a national<br />
programme of ongoing monitoring and<br />
reporting of key environmental indicators that<br />
are relevant to the climate change parameters<br />
identified during this study.<br />
The INGC has a well established and proven<br />
network for near real-time information<br />
gathering, evaluation and response during the<br />
lead up and in emergency events, such as<br />
cyclones, floods, fires etc. It is therefore<br />
recommended that a complementary network<br />
for data gathering, evaluation and information<br />
dissemination regarding climate change<br />
effects, possible trends in the identified<br />
hazard drivers, potential threshold changes<br />
(or “tipping points”) and resulting impacts to<br />
build up the scientific database and<br />
knowledge on which informed decisions can<br />
be made be set up as soon as possible.<br />
October 2012, p 10
CHAPTER 1: INTRODUCTION ______________________________________ 19<br />
CHAPTER 2: BACKGROUND _______________________________________ 21<br />
2.1 INTRODUCTION 21<br />
2.2 SOME RESULTS FROM THE INGC PHASE I STUDY 25<br />
2.3 CONCLUSION FROM THE INGC PHASE I STUDY 26<br />
CHAPTER 3: STUDY AREA ________________________________________ 27<br />
CHAPTER 4: APPROACH / METHODOLOGY __________________________ 29<br />
4.1 OVERVIEW OF THE APPROACH 29<br />
4.2 METHODOLOGY 29<br />
CHAPTER 5: DRIVERS OF RISK _____________________________________ 31<br />
5.1 INTRODUCTION 31<br />
5.2 IDENTIFICATION OF KEY ULTIMATE DRIVERS OF RISK 31<br />
5.3 EXTREME INSHORE SEA WATER LEVELS 34<br />
5.4 MOZAMBIQUE WAVE CLIMATE AND EXTREMES ANALYSES 37<br />
5.4.1 Mozambican Offshore Wave Analysis 37<br />
5.4.2 Trends in wave climate and future conditions 54<br />
5.4.3 Modelling cyclone wind-generated waves 58<br />
5.5 COASTAL FLOODING/INUNDATION AND EROSION 70<br />
5.5.1 Basic concepts and approach 70<br />
5.5.2 Prediction of high inshore sea water levels 70<br />
5.5.3 Prediction of wave run-up 73<br />
5.5.4 <strong>Coastal</strong> erosion due to climate change 75<br />
5.5.5 <strong>Coastal</strong> Flooding/Inundation and Erosion Model 77<br />
5.5.6 Calculation of potential erosion due to SLR at Beira and Maputo 79<br />
5.6 QUANTIFICATION OF FLOODING LEVELS FOR MOZAMBICAN COASTAL TOWNS 83<br />
October 2012, p 11
CHAPTER 6: COASTAL HAZARD ASSESSMENT ________________________ 89<br />
6.1 COASTAL HAZARD ASSESSMENT METHOD 89<br />
6.1.1 Introduction 89<br />
6.1.2 Methods of assessing vulnerability of coastal areas and developments 89<br />
6.1.3 <strong>Adaptation</strong> of suitable method for study area 89<br />
6.2 DETAIL ASSESSMENT OF FLOODING HAZARD AND QUANTIFICATION OF ELEVATION<br />
VULNERABILITY 95<br />
6.2.1 Sea water flooding hazard levels 95<br />
6.2.2 Elevation hazard 97<br />
6.3 COARSE VULNERABILITY ASSESSMENT FOR WHOLE MOZAMBICAN COAST 110<br />
6.4 DETAIL VULNERABILITY ASSESSMENT FOR SELECTED COASTAL TOWNS AND CITIES 116<br />
6.4.1 Application of the <strong>Coastal</strong> Hazard Assessment Method 116<br />
6.4.2 Scenarios assessed for coastal vulnerability 118<br />
6.4.3 Mapping of detail vulnerability assessment outputs 119<br />
6.4.4 Comparison of detail coastal vulnerability of 12 Mozambican areas 135<br />
CHAPTER 7: ADAPTATION OPTIONS _______________________________ 138<br />
7.1 STRATEGIC PRINCIPLES AND BEST PRACTICE GUIDELINES 138<br />
7.2 POTENTIAL ADAPTATION MEASURES/COASTAL PROTECTION OPTIONS 142<br />
7.2.1 Range of potential solutions 142<br />
7.2.2 Listing and description of potential solutions 144<br />
7.2.3 Summary list of potential solutions 162<br />
7.3 EVALUATION CONSIDERATIONS AND CRITERIA 163<br />
CHAPTER 8:<br />
DISCUSSION ON POSSIBLE ADAPTATION OPTIONS PER<br />
STUDY SITE ________________________________________ 169<br />
8.1 SITE SPECIFIC ANALYSIS AND RECOMMENDED PRIORITIZED ADAPTATION ACTIONS 169<br />
8.1.1 Beira 169<br />
8.1.2 Maputo 177<br />
8.1.3 Inhambane & Maxixe 183<br />
8.1.4 Tofo and Barra 186<br />
8.1.5 Vilanculos 187<br />
8.1.6 Quelimane 190<br />
8.1.7 Ilha de Moçambique 192<br />
8.1.8 Nacala 193<br />
8.1.9 Pemba 195<br />
8.2 THE REHABILITATION OF MANGROVE AREAS (B3) TO FORM EFFECTIVE NATURAL BUFFER<br />
AREAS ALL ALONG THE INNER SHORELINE OF THE BAY SHOULD BE ENCOURAGED AND<br />
COULD BE AN EXCELLENT JOB CREATION OPPORTUNITY. CONCLUSION 197<br />
CHAPTER 9: INTERACTION WITH MUNICIPALITIES ___________________ 198<br />
9.1 PURPOSE 198<br />
9.2 KEY POINTS FOR CONSIDERATION 198<br />
October 2012, p 12
CHAPTER 10: SUMMARY, CONCLUSION AND RECOMMENDATIONS ______ 200<br />
10.1 BACKGROUND 200<br />
10.2 KEY CONSIDERATIONS AND FINDINGS 201<br />
10.2.1 Drivers of change 201<br />
10.2.2 Coarse scale coastal vulnerability assessment 204<br />
10.2.3 Local / micro scale coastal vulnerability assessment 205<br />
10.2.4 Appropriate adaptation measures 207<br />
10.3 KEY RECOMMENDATIONS 208<br />
10.3.1 Integrated coastal planning and management 208<br />
10.3.2 Site specific adaptation options 209<br />
10.3.3 Seek opportunities for public-private-partnerships (PPP) 210<br />
10.3.4 Continue active engagement and communication with stakeholder to disseminate the<br />
outputs and facilitate uptake 210<br />
10.4 MONITORING AND EVALUATION REQUIREMENTS 212<br />
10.4.1 Establish a baseline 212<br />
10.4.2 Ongoing monitoring, evaluation, dissemination and response 213<br />
CHAPTER 11: REFERENCES _______________________________________ 214<br />
CHAPTER 12: GLOSSARY OF TERMS (DEAD & P, 2010) _________________ 220<br />
APPENDIX 1: SATELLITE REMOTE SENSING FOR COASTAL CHANGE 226<br />
APPENDIX 2: THEME 2 MISSION TO INTERACT WITH MUNICIPALITIES 249<br />
APPENDIX 3: COASTAL PROTECTION: SCOPE OF WORK (PHASE 2) 260<br />
October 2012, p 13
Figure 2.1:<br />
Figure 2.2:<br />
Cyclone tracks during November to April in the south-western Indian Ocean from 1952 to<br />
2007 (Mavume et al., 2009) 22<br />
Mozambican examples of existing vulnerable coastal areas, likely to become more<br />
vulnerable due to climate change effects. 25<br />
Figure 3.1: The coastal zone of Mozambique (INGC, 2009) 27<br />
Figure 3.2: <strong>Coastal</strong> study areas (Google Earth TM ) 28<br />
Figure 5.1: Drivers, processes and activities affecting shoreline “stability” or erosion. 33<br />
Figure 5.2: Comparison of minimum and maximum estimates of global SLR by year 2100 (USACE, 2011) 35<br />
Figure 5.3: Definition sketch of the various components leading to extreme inshore sea water levels. 36<br />
Figure 5.4: NCEP grid-point locations 37<br />
Figure 5.5a: NCEP grid-point location off Maputo 39<br />
Figure 5.5b: NCEP grid-point location off Maxixe 40<br />
Figure 5.5c: NCEP grid-point location off Vilanculos 41<br />
Figure 5.5d: NCEP grid-point location off Beira 42<br />
Figure 5.6: Mean and standard deviation of wave height as based on NCEP wave data 45<br />
Figure 5.7: Annual wave roses as based on 12 years of NCEP wave data 46<br />
Figure 5.8: Scatter-plot of Hmo versus Tp for 9 NCEP wave stations 47<br />
Figure 5.9:<br />
Extremes wave heights (NCEP wave data) versus return periods offshore of Maputo (left)<br />
and Beira (right) 51<br />
Figure 5.10: 100-year wave condition along Mozambican coast 54<br />
Figure 5.11: Peaks of individual storms over 14 year-period – offshore Cape Town (based on recordings by<br />
CSIR on behalf of Transnet National Ports Authority, South <strong>Africa</strong>). 55<br />
Figure 5.12: Future wave climate changes from model predictions by Mori et al. (2010) 56<br />
Figure 5.13: Example of wave height determined from wind velocity through a wind/wave model 57<br />
Figure 5.14: Location of wave buoys off Beira, Mozambique 59<br />
Figure 5.15: Track of TC Lizette over Mozambique (JTWC, 1997). 60<br />
Figure 5.16: ERS-2 Scatterometer image of TC Lizette showing the cyclonic wind vectors 61<br />
Figure 5.17: SWAN model domain 62<br />
Figure 5.18: Example of cyclone wind-generated wave fields showing wave height in the Mozambique<br />
Channel and near Beira at particular time-steps. Note, the locations where wave data were<br />
collected are also shown. 63<br />
Figure 5.19: Time-series of measured and simulated wave height – for both wave buoy locations 65<br />
October 2012, p 14
Figure 5.20: Example of wave modelling to derive inshore conditions at Maputo (east-north-easterly<br />
cyclone direction) 67<br />
Figure 5.21a, b & c: Example of wave modelling to derive inshore conditions at Beira (south-easterly<br />
cyclone direction) 68<br />
Figure 5.22a and b: Example wave cyclone modelling output for Pemba; (a) easterly offshore cyclone<br />
direction; (b) cyclone on land / over bay 69<br />
Figure 5.23: Description of (part of) the Nielsen and Hanslow (1991) coastal wave run-up model 74<br />
Figure 5.24: Schematic illustration of the Bruun model of profile response to rise in sea level showing<br />
erosion of the upper beach and nearshore deposition. (From Davidson-Arnott, 2005). 76<br />
Figure 5.25: Example of proportional wave height growth versus wind velocity increase, also indicating<br />
resultant non-linear increase in wave energy and power (Kamphuis model). 77<br />
Figure 5.26: Conceptual description of the combined coastal flooding/inundation and SLR erosion model<br />
with functional relationships between components. (SLR = Sea Level Rise; DEM = Digital<br />
Elevation Model) 78<br />
Figure 5.27: Example of predicted run-up amounts at Beira 79<br />
Figure 5.28: Map of potential erosion and recommended setback line for SLR – Beira 81<br />
Figure 5.29: Increase in potential erosion over time at Beira, due to the increasing SLR up to 1m by 2100 82<br />
Figure 5.30: Map of potential erosion and setback line for SLR - Maputo 83<br />
Figure 5.31: Beira coastal flooding and wave run-up levels. 84<br />
Figure 5.32: Maputo coastal flooding and wave run-up levels 86<br />
Figure 5.33: Pemba coastal flooding and wave run-up levels 87<br />
Figure 6.1:<br />
Figure 6.2:<br />
Degree of protection/exposure from prevailing wave energy (A – most protected, D – most<br />
exposed) 91<br />
Conceptual description of the coastal hazard/risk evaluation model with functional<br />
relationships between components. 94<br />
Figure 6.3: <strong>Coastal</strong> flooding levels for 11 towns/cities 96<br />
Figure 6.4a: Estimated contours for Maputo 98<br />
Figure 6.4b: Estimated contours for Maputo – Costa de Sol 98<br />
Figure 6.4c: Estimated contours for Maputo / Matola 99<br />
Figure 6.5: Estimated contours for Beira 100<br />
Figure 6.6: Estimated contours for Ponto Do Ouro 101<br />
Figure 6.7: Estimated contours for Xai-Xai Beach 101<br />
Figure 6.8: Estimated contours for Tofo / Barra (overlain on Google Earth image) 102<br />
Figure 6.9: Estimated contours for Maxixe; Inhambane 103<br />
Figure 6.10: Estimated contours for Vilankulos 104<br />
Figure 6.11: Estimated contours for Quelimane 104<br />
Figure 6.12: Estimated contours for Ilha De Mozambique 105<br />
Figure 6.13: Estimated contours for Nacala port area 106<br />
Figure 6.14: Estimated contours for Nacala bay area 106<br />
Figure 6.15: Estimated contours for Pemba 107<br />
Figure 6.16: Estimated contours for Pemba port area 108<br />
Figure 6.17: Baseline typology mapping of Mozambican geology 111<br />
Figure 6.18: Vulnerability mapping based on geologic classification 112<br />
Figure 6.19: Baseline typology mapping of Mozambican geomorphology 113<br />
October 2012, p 15
Figure 6.20: Vulnerability mapping based on geomorphologic classification 114<br />
Figure 6.21: Coarse overview of hazards and vulnerability of Mozambican coast 115<br />
Figure 6.22: Maputo example - Location of <strong>Coastal</strong> Points (1 km intervals) 116<br />
Figure 6.23 a to c: Beira vulnerability mapping showing all 14 parameters for 3 of the 16 scenarios. 122<br />
Figure 6.24a: Beira detail vulnerability mapping: Scenarios A & B 123<br />
Figure 6.24b: Beira detail vulnerability mapping: Scenarios C & D 124<br />
Figure 6.25: Ponto Do Ouro detail vulnerability mapping: Scenarios C & D 125<br />
Figure 6.26: Maputo (and Matola) detail vulnerability mapping: Scenarios C & D 126<br />
Figure 6.27: Xai-Xai Beach detail vulnerability mapping: Scenarios C & D 127<br />
Figure 6.28: Tofo and Bara detail vulnerability mapping: Scenarios C & D 128<br />
Figure 6.29: Imhambane and Maxixe detail vulnerability mapping: Scenarios C & D 129<br />
Figure 6.30: Villancoulos detail vulnerability mapping: Scenarios C & D 130<br />
Figure 6.31: Quelimane detail vulnerability mapping: Scenarios C & D 131<br />
Figure 6.32: Ilha de Mozambique detail vulnerability mapping: Scenarios C & D 132<br />
Figure 6.33: Nacala detail vulnerability mapping: Scenarios C & D 133<br />
Figure 6.34: Pemba detail vulnerability mapping: Scenarios C & D 134<br />
Figure 6.35: A comparison of the vulnerabilities of each of the 12 towns and cities (from south to north)<br />
for the present case scenario (A3) 135<br />
Figure 6.36: A comparison of the vulnerabilities of each of the 12 towns and cities for the most likely<br />
future case scenario (C4) 136<br />
Figure 6.37: A comparison of the vulnerabilities of each of the 12 towns and cities for the worst case<br />
scenario (D4) 137<br />
Figure 7.1: Example of local accommodation measure 145<br />
Figure 7.2:<br />
Beach nourishment by means of direct “rainbowing” of sand from the dredger to shore<br />
(only practical in certain areas). 146<br />
Figure 7.3: Beach nourishment by means of pumping sand onto the beach through a pipe system 146<br />
Figure 7.4:<br />
Example of a vegetated dune at Beira with sufficient volume and height to protect<br />
landwards areas from storm erosion or coastal flooding. 148<br />
Figure 7.5: Examples of a revetment (left) and a seawall (right) in Mozambique 150<br />
Figure 7.6: Example of a rock revetment protecting houses (South <strong>Africa</strong>) 151<br />
Figure 7.7: Examples of vegetated dikes (Germany) 152<br />
Figure 7.8: Perched beach with partially submerged retaining structure 153<br />
Figure 7.9 Example of erosion mitigation through shore-parallel structures (Anglin, et al. 2001) 154<br />
Figure 7.10: Example of beach accretion through submerged artificial reefs 154<br />
Figure 7.11: Existing groynes along Maputo shoreline 156<br />
Figure 7.12: Groynes protecting Richards Bay entrance channel shoreline, South <strong>Africa</strong> (Photograph S<br />
Pillay) 156<br />
Figure 7.13: Piles driven to form a wave fence (about 50 % reflective - PIANC, 2008) 158<br />
Figure 7.14: Patented floating breakwater (www.whisprwave.com) 159<br />
Figure 7.15: Examples of geotextile (sand bag) revetments (Kwazulu-Natal, South <strong>Africa</strong>) 160<br />
Figure 7.16: Example of a Gabion retaining wall structure (to protect the back-beach area) 161<br />
Figure 8.1:<br />
Beira. <strong>Adaptation</strong> / coastal protection options based on general criteria, local site<br />
characteristics and current use/”value.” 170<br />
October 2012, p 16
Figure 8.2:<br />
Figure 8.3:<br />
Figure 8.4:<br />
Figure 8.5:<br />
Figure 8.6:<br />
Western Beira. <strong>Adaptation</strong> / coastal protection options based on general criteria, local site<br />
characteristics, current use / ”value” 171<br />
Southern Beira. <strong>Adaptation</strong> / coastal protection options based on general criteria, local site<br />
characteristics, current use/ ”value”. 173<br />
South-western Beira. <strong>Adaptation</strong> / coastal protection options based on general criteria, local<br />
site characteristics, current use/”value”. 174<br />
South-eastern Beira. <strong>Adaptation</strong> / coastal protection options based on general criteria, local<br />
site characteristics, current use/”value”. 175<br />
South-eastern Beira. <strong>Adaptation</strong> / coastal protection options based on general criteria, local<br />
site characteristics, current use/”value”. 176<br />
Figure 8.7: Eastern Maputo. Recommended adaptation /coastal protection options 179<br />
Figure 8.8: Eastern Maputo. Recommended adaptation /coastal protection options 180<br />
Figure 8.9 : Sediment transport patterns at Maputo (A Mather, pers com 2009) 181<br />
Figure 8.10: Western Maputo. Recommended adaptation/coastal protection options 182<br />
Figure 8.11: Inhambane. Recommended adaptation /coastal protection options 185<br />
Figure 8.12: Tofo & Barra. Recommended adaptation /coastal protection options 187<br />
Figure 8.13a: Vilanculos. Recommended adaptation /coastal protection options 188<br />
Figure 8.13b: Vilanculos. Recommended adaptation /coastal protection options 189<br />
Figure 8.14: Quelimane adaptation/coastal protection options 191<br />
Figure 8.15: Ilha de Moçambique recommended adaptation /coastal protection options 192<br />
Figure 8.16: Nacala & Minguri adaptation / coastal protection options 194<br />
Figure 8.17: Pemba recommended adaptation /coastal protection options 196<br />
Table 2.1: Regional adaptive capacity, vulnerability, and key concerns 21<br />
Table 5.1: NCEP grid-points (as shown in Figure 5.4) 38<br />
Table 5.2: General wave height statistics 44<br />
Table 5.3:<br />
Tropical cyclones , and tropical storms (TS) making landfall on the coast of Mozambique for<br />
the period 1994-2008 (source: INGC report, 2009) 48<br />
Table 5.4: NCEP extreme wave analysis for 9 Locations off the Mozambican coast 50<br />
Table 5.5:<br />
Estimated average maximum wind speed intensity in 100 years as a function of latitude<br />
(based on Rossouw, 1999) 52<br />
Table 5.6: Estimated offshore and nearshore 100-year wave condition 53<br />
Table 5.7: The main input parameters for TC Lizette (March 1997) 62<br />
Table 5.8: Cyclone simulation details for Mozambican locations 66<br />
Table 5.9: Tidal levels based on UK Hydrographic Office (2007). 71<br />
Table 5.10: Example of quantification of erosion potential and erosion setback for SLR 80<br />
Table 6.1:<br />
Vulnerability indicators, limit values for each indicator and vulnerability classification ranges<br />
applied for Mozambican coastal vulnerability assessment. 93<br />
Table 6.2 : Example of vulnerability scoring (1 to 5 - very high) for Ponto Do Ouro 117<br />
Table 6.3: Summary of scenarios assessed for coastal vulnerability 118<br />
Table 7.1: Examples of potential implications and possible adaptation measures 143<br />
October 2012, p 17
Table 7.2:<br />
Selection of shoreline management options based on assets at risk (adapted from the<br />
literature) 163<br />
Table 7.3: Summary of some adaptation option cost estimates 164<br />
Table 7.4:<br />
Relative costs, life expectancy and potential environmental impacts associated with<br />
shoreline management options (adapted from SNH, 2000) 165<br />
Table 7.5: Comparative functionality/suitability of some potential adaptation measures 166<br />
Table 7.6: Priority adaptation/no-regret measures 168<br />
Table 8.1:<br />
Table 8.2:<br />
Summary of some adaptation option costs for Beira - coastal construction capital cost<br />
estimates (2011). 178<br />
Summary of some adaptation option costs for Maputo - coastal construction capital cost<br />
estimates (2011). 184<br />
October 2012, p 18
CHAPTER 1: INTRODUCTION<br />
Mozambique is recognized as one of the countries in <strong>Africa</strong> that is most vulnerable to climate<br />
change. Hazards such as droughts and floods, variable rainfall and tropical cyclones already<br />
significantly affect Mozambique. Following a first phase investigation (INGC Phase I) aimed at<br />
defining and locally contextualizing important drivers and impacts of climate change in<br />
Mozambique, the National Institute for Disaster Management (INGC) in Mozambique<br />
commissioned a second phase of investigation. While INGC Phase I focused on determining the<br />
impacts of climate change on Mozambique at the macro level, INGC Phase II focuses on both the<br />
macro and the micro level, with emphasis on implementation of adaptation, and providing<br />
strategic guidance.<br />
The overall goal of the Phase II projects, led by the Mozambican government, is to help protect<br />
Mozambique against the potential impacts of climate change, and to plan for and kick start<br />
prevention through the implementation of adaptation measures at national scale, on the basis of<br />
science and in support of sustainable development. Phase II projects focus on a number of<br />
thematic research challenges that have been formulated and required a multi-disciplinary effort.<br />
To this end, <strong>Theme</strong> 2: ‘<strong>Coastal</strong> planning and adaptation to mitigate climate change impacts’<br />
contributes to the ‘<strong>Coastal</strong> City <strong>Protection</strong>’ objective. This theme is considered to be aligned with<br />
the approach followed under <strong>Theme</strong> 3: ‘Cities prepared for Climate Change’ and <strong>Theme</strong> 4:<br />
‘Building Resilience in participation with the private sector’. As such, the research included a<br />
number of coastal pilot sites in high impact locations that were selected under the other themes.<br />
The focus on pilot sites introduced a scale dimension that made it possible to approach a deeper<br />
understanding of the environmental systems represented within the pilot sites. In addition,<br />
research undertaken at this scale made it possible to conceive interventions for climate change<br />
adaptation that are of sufficient substance to aid in their likely implementation. This contrasts the<br />
generalized adaptation interventions that would be conceived through research undertaken at<br />
more expansive scales.<br />
The following key questions were addressed in <strong>Theme</strong> 2:<br />
• Where are the most vulnerable areas along the coast, at the local/micro level?<br />
• What will these areas look like, with climate change, in future?<br />
• Which key infrastructure and future investment plans are at risk in these areas?<br />
• What recommendations are in order for planned investments along the coast, with emphasis<br />
on Beira and Maputo<br />
• What structural coastal protection measures are needed to compensate for the potential<br />
effects of climate change?<br />
• What shoreline management plans are most appropriate for these areas?<br />
• What should be the strategic framework on which all coastal structures and sea defences can<br />
be evaluated? What should go into a coastal zone information system? What input can be<br />
provided for an integrated coastal management policy?<br />
October 2012, p 19
In short, it can be said that the INGC wants to follow a pro-active approach to protect lives and<br />
infrastructure (Prevention is better than Cure). In addressing this task, the conservative/<br />
precautionary principle should be applied, to find sustainable solutions that are durable and low<br />
cost to the Municipality and/or the State.<br />
Key points from the INGC Phase I study relating to the coastal environment are highlighted in<br />
Chapter 2 whilst Chapter 3 provides a brief overview of the study area and the study sites which<br />
form the focus of <strong>Theme</strong> 2. The research approach and methodologies are discussed in<br />
Chapter 4.<br />
The physical factors that influence the risk to coastal infrastructure and the lives and livelihoods<br />
of coastal communities in current and future climate scenarios are discussed in Chapter 5 under<br />
the heading of Drivers of Risk. An assessment of the coastal hazards associated with these drivers<br />
of risk is provided in Chapter 6.<br />
The results of research on adaptation strategies and measures along with associated coastal<br />
protection options are presented in Chapter 7 followed by a discussion and site specific<br />
recommendations in Chapter 8. The results of interaction with municipal and institutional leaders<br />
and technical officials at some of the study sites are provided in Chapter 9. The key conclusions<br />
with recommendations are summarised in Chapter 10.<br />
The underlying detail of selected sections is included in the Appendices.<br />
October 2012, p 20
CHAPTER 2: BACKGROUND<br />
2.1<br />
The continuously rising concentrations of ”greenhouse” gases in the atmosphere lead to global<br />
warming and climate change. The effects of these rising concentrations are already detectable,<br />
mainly in terms of thermal variables and, in particular, global mean air temperature. The increase<br />
in surface temperatures leads to an increase in sea levels through the interaction of various<br />
processes such as thermal expansion of the oceans and melting of glaciers. It is predicted that<br />
climate change will also bring greater storm intensities. This makes coastal settlements<br />
vulnerable, especially considering that large portions of the coastal zone are densely populated<br />
and growing rapidly. <strong>Coastal</strong> resources are expected to be affected by a number of consequences<br />
of climate change, namely higher sea levels, higher sea temperatures, changes in precipitation<br />
patterns and sediment fluxes from rivers, altered oceanic conditions as well as changes in storm<br />
tracks, frequencies and intensities.<br />
In a report published in 2001, the International Panel on Climate Change (IPCC) assessed the<br />
adaptive capacity of regions in the world, including <strong>Africa</strong> and adjacent small island states (IPCC<br />
2001b). This assessment included Mozambique and extracts from the report are depicted in<br />
Table 2.1 below.<br />
Table 2.1:<br />
Regional adaptive capacity, vulnerability, and key concerns<br />
(Extracted from Technical Summary of IPCC, 2001b. With relevant sections of IPCC 2001b for each example<br />
(source: IPCC 2001b, extracted from Table SPM-2).<br />
given in square brackets).<br />
Region<br />
<strong>Africa</strong><br />
(including<br />
Mozambique)<br />
Small<br />
Island States<br />
(also<br />
Mozambique)<br />
Adaptive Capacity, Vulnerability, and Key Concerns<br />
Adaptive capacity of human systems in <strong>Africa</strong> is low due to a lack of economic resources and<br />
technology, and vulnerability high as a result of heavy reliance on rain-fed agriculture,<br />
frequent droughts and floods, and poverty. [5.1.7]<br />
Increases in droughts, floods, and other extreme events would add to stresses on water<br />
resources, food security, human health, and infrastructures, and would constrain<br />
development in <strong>Africa</strong> (high confidence). [5.1]<br />
<strong>Coastal</strong> settlements in, for example, the Gulf of Guinea, Senegal, Gambia, Egypt, and along<br />
the East–Southern <strong>Africa</strong>n coast would be adversely impacted by sea-level rise through<br />
inundation and coastal erosion (high confidence). [5.1.5]<br />
The projected sea-level rise of 5 mm per year for the next 100 years would cause enhanced<br />
coastal erosion, loss of land and property, dislocation of people, increased risk from storm<br />
surges, reduced resilience of coastal ecosystems, saltwater intrusion into freshwater<br />
resources, and high resource costs to respond to and adapt to these changes (high<br />
confidence). [5.8.2 and 5.8.5]<br />
Coral reefs would be negatively affected by bleaching and by reduced calcification rates due<br />
to higher CO 2 levels (medium confidence); mangrove, sea grass beds, and other coastal<br />
ecosystems and the associated biodiversity would be adversely affected by rising<br />
temperatures and accelerated sea-level rise (medium confidence). [4.4 and 5.8.3]<br />
Tourism, an important source of income and foreign exchange for many islands, would face<br />
severe disruption from climate change and sea-level rise (high confidence). [5.8.5]<br />
October 2012, p 21
Mozambique is therefore recognized as one of the countries in <strong>Africa</strong> that is most vulnerable to<br />
climate change (Tol, 2004). Hazards such as droughts and floods, variable rainfall and tropical<br />
cyclones already significantly affect Mozambique (e.g. Figure 2.1). The coastal zone of<br />
Mozambique is particularly vulnerable to the expected impacts of climate change (e.g. Table 2.1<br />
above extracted from IPCC 2001). Existing problems exacerbate the situation, for example, in<br />
2008, the Mozambican government announced that it needed US$18 million to resolve the<br />
problem of erosion in the coastal area of Maputo, according to newspaper reports (Notícias,<br />
2008).<br />
Figure 2.1: Cyclone tracks during November to April in the south-western Indian Ocean from 1952 to 2007<br />
(Mavume et al., 2009)<br />
Contributing factors include vast low-lying coastal plains such as delta coasts; high population<br />
concentrations in close proximity to the sea; poverty; low capacity to defend infrastructure;<br />
susceptibility to cyclone activity; soft erodible coasts; and inadequate and ageing existing coastal<br />
defences (Theron et al. 2011). This situation is aggravated by direct exposure to high wave energy<br />
regimes in some parts, a potential increase in cyclone impacts, and impacted natural coastal<br />
defences (e.g. dunes, mangroves and coral reefs). Large numbers of the local populations also<br />
rely heavily on goods and services and economic benefits provided by the coastal zone (Theron et<br />
al. 2011). Many Mozambicans therefore live close to the sea (and coastal lagoons and lakes) to<br />
gain easy access to fishing, being the main sustenance sources for many poor people living along<br />
the coast.<br />
Mozambique also has numerous coastal lagoons/lakes separated from the sea only by a frontal<br />
dune. The joint effects of sea-level rise (SLR) and increased sea storminess could breach some of<br />
these dune barriers. Besides the resulting loss of some of these ecologically (and socially)<br />
important lagoon/lake systems, the presently sheltered inner shores would then be directly<br />
exposed to much more severe conditions (waves, winds & currents) leading to severe impacts<br />
such as shoreline erosion, etc. (Theron & Rossouw, 2008).<br />
October 2012, p 22
Mozambican examples of existing vulnerable coastal areas, likely to become more vulnerable due to climate<br />
change effects.<br />
The most vulnerable areas along the coast will almost invariably be located where problems are<br />
already being experienced at present. In most cases these are the areas where development has<br />
encroached too close to the high-water line, or at a too low elevation above mean sea level<br />
(Theron, 2007).<br />
Some examples of current problems in Mozambique are depicted in Figure 2.2. In some instances<br />
(especially in the more developed coastal towns/cities) some of the formal built infrastructure is<br />
at risk, while in most urban and rural coastal settlements there are informal settlements very<br />
close to the sea.<br />
October 2012, p 23
Mozambican examples of existing vulnerable coastal areas, likely to become more vulnerable due to climate<br />
change effects.<br />
October 2012, p 24
Figure 2.2:<br />
Mozambican examples of existing vulnerable coastal areas, likely to become more vulnerable<br />
due to climate change effects.<br />
2.2<br />
The following points are extracts from the results of the INGC Phase I report (INGC, 2009) and are<br />
included as background to the current study:<br />
• As a result of climate change, the exposure to natural disaster risk in Mozambique will<br />
increase significantly over the coming 20 years and beyond. Temperatures in Mozambique<br />
may rise by as much as 2 to 2.5˚C by 2050 and 5 to 6˚C by 2090 (depending on the region).<br />
• Rainfall variability will increase; there will be likely shifts in the start of rainy seasons with<br />
wetter rainy seasons and drier dry seasons. Flood risk will increase notably in the South. The<br />
central regions will be most heavily impacted by more intense cyclones and sea level rise, as<br />
well as drought risk around the Cahora Bassa area.<br />
• Up to approximately 2030, more severe cyclones will pose the biggest threat to the coast;<br />
beyond 2030, the accelerating sea level rise will present the greatest danger, especially when<br />
combined with high tides and storm surges. The city of Beira is already in a very vulnerable<br />
situation, with inadequate coastal protection for annual return events. Parts of Maputo, as<br />
well as other coastal areas such as Pemba and Vilankulos and nearby islands, are also already<br />
at risk.<br />
October 2012, p 25
• <strong>Coastal</strong> City “Vulnerability” League Table:<br />
o Beira: Cyclone threat, exposed coast, low lying land, defences in poor repair<br />
o Inhambane: Cyclone threat, river flood, low land<br />
o Quelimane: Cyclone threat, river flood<br />
o Maputo: High land, beachfront at risk<br />
o Vilanculos: Protected by islands<br />
o Nacala : Protected from sea, high land<br />
2.3<br />
Investments are being made in areas where the threats are increasing and the cost of insurance,<br />
even when borne by the government, is becoming very unattractive.<br />
Vulnerability is expected to increase over the next two decades, as climate impacts reduce<br />
peoples’ livelihood assets (health, water, infrastructure) and impinge on food production, thus<br />
undermining Mozambique’s overarching goal of reducing extreme poverty. However, the extent<br />
to which the vulnerability of Mozambique will increase with increased exposure depends on its<br />
adaptive capacity. This in turn depends in large part on the socio-economic and technological<br />
development trajectory Mozambique will take, and on the adaptation measures, i.e. protection<br />
and planning it will put in place in the coming 5 to 10 years.<br />
October 2012, p 26
CHAPTER 3: STUDY AREA<br />
Figure 3.1: The coastal zone of Mozambique (INGC, 2009)<br />
October 2012, p 27
As discussed in the previous chapter, the coastal zone of Mozambique (Figure 3.1) is particularly<br />
vulnerable to the expected impacts of climate change and the adaptive capacity is poor.<br />
Contributing factors include vast low-lying coastal plains such as delta coasts; high population<br />
concentrations in close proximity to the sea; poverty; and low capacity to defend infrastructure.<br />
This situation is aggravated by direct exposure to high wave energy regimes in some parts and a<br />
potential increase in cyclone impacts. Large numbers of the local populations also rely heavily on<br />
goods and services and economic benefits provided by the coastal zone and are therefore located<br />
close to the sea in vulnerable areas.<br />
As specified in the terms of reference and selected in conjunction with the INGC, research was<br />
focused on the following coastal towns and city areas shown in Figure 3.2:<br />
Maputo / Matola; Xai-Xai Beach; Maxixe; Inhambane / Tofo; Vilanculos; Beira; Quelimane; Ilha De<br />
Mozambique; Nacala; and Pemba.<br />
Figure 3.2: <strong>Coastal</strong> study areas (Google Earth TM )<br />
October 2012, p 28
CHAPTER 4: APPROACH / METHODOLOGY<br />
4.1<br />
Building onto the Phase I findings and using appropriate assessment techniques such as the use<br />
of remote sensing, aerial and field observations, high risk areas were identified (including<br />
hazardous areas of change), based on agreed criteria described in Chapter 6,<br />
A coastal vulnerability index was adapted from available techniques described in literature<br />
(Chapter 6) and the study sites assessed using maps, satellite data and in-situ observations. The<br />
results were incorporated into a Geographical Information System (GIS) which made it possible to<br />
produce vulnerability maps that include realistic scenarios of future coastal conditions<br />
(Chapter 6).<br />
By applying realistic scenarios of future coastal conditions (e.g. waves, extreme events and sea<br />
level rise -SLR) under climate change, and investigating the potential effects, specific adaptation<br />
measures and coastal protection options were developed for ten Mozambican towns to adapt to<br />
the physical impacts of climate change (Chapters 7 and 8). While some of these measures involve<br />
straightforward management options, others focus on soft engineering or restoration, and hard<br />
engineering or armouring as coastal defences.<br />
4.2<br />
A list of the main tasks and studies that were conducted (in sequence) is presented below:<br />
1. Review literature & Phase 1 outputs and collation of available data relevant to <strong>Theme</strong> 2.<br />
(Chapters 2 & 3)<br />
2. Identify primary and secondary coastal hazard drivers and vulnerability parameters<br />
(Chapter 5).<br />
3. Generate realistic scenarios of future coastal conditions (Chapter 5).<br />
4. Analyse the offshore wave climate and undertake cyclone wave modelling (Chapter 5).<br />
5. Determine and calculate: local tides, wind/wave and hydrostatic set-up, future sea-level<br />
and wave run-up levels (Chapter 5).<br />
6. Develop and adapt suitable coastal vulnerability indexing methodology (Chapter 6).<br />
7. Conduct coarse coastal vulnerability assessment for the whole Mozambique coastline<br />
(Chapter 6).<br />
8. Undertake an aerial reconnaissance of the coast and in-situ investigation of specific sites;<br />
Inspect and assess local coastal processes, site characteristics, vulnerability, and current<br />
protection/adaptation options (Chapter 6).<br />
9. Undertake a detail coastal vulnerability analyses of 10 sites based on the methodology<br />
developed in (6) above. (This resulted in the assessment of 14 physical parameters and 5<br />
October 2012, p 29
classes for each site for 16 scenario combinations of climate change and cyclones)<br />
(Chapter 6).<br />
10. Map areas vulnerable to sea-level rise erosion (Chapter 6).<br />
11. Map vulnerable areas: flooding and wave run-up levels (Chapter 6).<br />
12. Identify a suite of suitable planning and adaptation options: considering relative costs,<br />
life expectancy, associated environmental impacts, and comparative functionality<br />
(Chapter 7).<br />
13. Apply general coastal engineering principles and identify adaptation options relevant to<br />
local Mozambican conditions (Chapter 7).<br />
14. Determine preliminary adaptation option costs including coastal construction capital cost<br />
estimates (Chapter 7).<br />
15. Define appropriate and site specific adaptation/coastal protection options based on<br />
general criteria, local site characteristics and current coastal use/”value” (Chapter 8).<br />
16. Recommend order of implementation of identified adaptation options at each study site<br />
(Chapter 8).<br />
17. Interact with officials of coastal municipalities to understand degree of local<br />
understanding of climate change factors and if and how these are considered in current<br />
and future planning (Chapter 9).<br />
18. Prepare recommendations for action in the short, medium and long term (Chapters 8<br />
and 10).<br />
19. Identify monitoring requirements to improve evidence-based decision-making<br />
(Chapter 10).<br />
October 2012, p 30
CHAPTER 5: DRIVERS OF RISK<br />
5.1<br />
Understanding the potential risk to both human and natural elements of the coastal zone<br />
facilitates the mapping of vulnerable areas. The need therefore exists to determine areas of low<br />
risk (or vulnerability) which, in turn, require prediction of future vulnerability under future climate<br />
change scenarios. Studying the hazards associated with coastal processes and dynamics, in<br />
particular related to climate change in this case, will aid the planning and low risk location of new<br />
development areas and infrastructure. Such knowledge will also assist in the identification of<br />
appropriate adaptation options for existing developments that are assessed to be at risk.<br />
In this chapter an overview of the wave climate around the Mozambican coast, as well as possible<br />
trends reflected in the regional data is provided. The focus is on the abiotic physical coastal<br />
aspects which include factors linked to climate change.<br />
5.2<br />
Van Ballegooyen et al. (2003) identified all significant marine hazards relevant to parts of the<br />
Southern <strong>Africa</strong>n (SA) coast. A hazard is defined here as an event or process (natural or<br />
anthropogenic) that results in a potentially deleterious impact on a desirable status quo. Marine<br />
hazards may be due to natural events or anthropogenic activities but are typically a combination<br />
of these two causes. Van Ballengooyen et al. (2003) point out that the full extent of risk (e.g. loss<br />
of life and financial loss) is not always fully appreciated, and cite as an example the long-term<br />
financial losses due to coastal erosion which are often poorly understood, particularly by local<br />
authorities. It can be said that all of the items in the hazard inventory of Van Ballegooyen et al.<br />
(2003) result from either erosion and/or under-scouring of foundations and structures; flooding<br />
and inundation; direct wind and wave impacts<br />
(occasionally currents); and, broadly speaking,<br />
algal blooms and pollution.<br />
Focusing on the abiotic hazards to infrastructure<br />
and developments in the coastal zone, the main<br />
metocean drivers are thus waves and sea water<br />
levels (and to a lesser extent winds and currents in<br />
some instances). This is generally confirmed by the<br />
literature review of coastal vulnerability<br />
assessment methods (discussed in detail in<br />
Chapter 6) where the identified indicators almost<br />
all relate to parameters that affect<br />
vulnerability/resilience to erosion/under-scouring,<br />
and flooding/inundation (Theron et al. 2010).<br />
Regarding wind hazards and Mozambique, it is<br />
acknowledged that primary hazards to coastal<br />
NOTE – definitions and<br />
terminology:<br />
NOAA: Storm surge: ”A rise or piling-up of<br />
water against shore, produced by strong<br />
winds blowing onshore. A storm surge is<br />
most severe when it occurs in conjunction<br />
with a high tide.”<br />
Expansion by the authors:<br />
In southern <strong>Africa</strong>, sea storms (i.e. high<br />
waves with run-up, impacts and scouring)<br />
are also a big risk; these can be<br />
exacerbated by strong winds and high<br />
tides.<br />
October 2012, p 31
infrastructure should include likely high wind damage during cyclones. However, this report<br />
focuses on climate change and water (coastal/marine) related hazards. The damage that may be<br />
done to infrastructure and housing by cyclone winds should not be overlooked, but is understood<br />
to be within the scope of some of the other <strong>Theme</strong>s (“preparing cities”). As such, cyclone wind<br />
impacts may be felt far inland with no influence from the sea, and therefore should rightfully be<br />
dealt with as a hazard to be included in risk assessment and response for virtually all areas/cities<br />
(not specifically the coast).<br />
Similarly, tsunami hazard and vulnerability is noted as not being considered in this report.<br />
Tsunami risk is not associated with climate change (which is at the core of <strong>Theme</strong> 2), and is also<br />
considered to be a relatively low risk hazard for the Mozambique coast. (Although this is beyond<br />
the present scope of <strong>Theme</strong> 2, a focussed tsunami risk assessment for the Mozambican coast<br />
should probably be conducted in the near future, to properly assess vulnerability and quantify<br />
impacts/risks, so that the need for tsunami specific planning and adaptation can be ascertained.)<br />
Finally, in also considering other abiotic “non-coastal/marine” hazards and impacts in the wider<br />
coastal zone, there is value in noting the combined hazard of high seawater levels with flooding<br />
from rivers. It is well known that the heavy rains accompanying cyclones also bring river floods<br />
that can be “backed up” by high seawater levels along the coast. If such joint extreme events<br />
occur, they add to the destruction experienced to infrastructure and services. River flooding<br />
studies need to take into account the possible effects of high seawater flooding levels. This detail<br />
of exacerbated river flooding levels is beyond the scope of this study, but should be considered<br />
(possibly within <strong>Theme</strong> 3: Cities prepared for Climate Change and/or <strong>Theme</strong> 4: Building<br />
Resilience). Attention must certainly be drawn to the potential combined flooding impact in the<br />
cities/towns where major rivers join the sea. However, it should be noted that since <strong>Theme</strong> 2 did<br />
not deal with the hazards driven by terrestrial processes, the riverine flooding of all areas<br />
(including coastal) should be treated in a different theme.<br />
Shoreline ’stability’, or the probability of erosion (and/or under-scouring of structures) is affected<br />
by many drivers, processes and activities, some of which are natural and others due to<br />
anthropogenic actions. Most of these variables are listed and “typed/classified” in the following<br />
diagram (Figure 5.1).<br />
October 2012, p 32
Figure 5.1:<br />
Drivers, processes and activities affecting shoreline “stability” or erosion.<br />
The study on “Vulnerability and adaptation of the natural resources to the climate changes in<br />
Mozambique”, a report prepared by MICOA under the United States Country <strong>Programme</strong> in 1999<br />
(MICOA, 1999), identifies sea level rise as the main impact of global climate change in coastal<br />
areas of Mozambique. As was noted in IPCC (2001) and summarised in Table 2.1, climate change<br />
is expected to have a number of consequences which will detrimentally affect coastal resources.<br />
These are, amongst others: higher sea levels; higher sea temperatures; changes in precipitation<br />
patterns and sediment fluxes from rivers; changed oceanic conditions; as well as changes in storm<br />
tracks, frequencies and intensities. The apparent increase in storm activity and severity will be the<br />
most visible impact and the first to be noticed, since higher sea levels will require smaller storm<br />
events to overtop existing storm protection measures.<br />
October 2012, p 33
Changes in the shape of sandy coastlines depend on a number of factors of which the most<br />
important is the availability and distribution of sediment (sand). Sand along the coast is moved<br />
mostly by waves and currents, while the waves approaching the coast are in turn affected by<br />
bottom topography. As the sea level rises, existing topographic features will be located in deeper<br />
water and will have a different effect on waves approaching the coast. Features landward of the<br />
breaker zone will be in deeper water and will either have an amplified or dampened effect on the<br />
wave climate compared to the present. Deep water features may deepen to the degree that their<br />
effect on the wave climate is negligible. The points of wave energy convergence and divergence<br />
will change. The new locations of wave energy convergence could be expected to experience an<br />
increase in erosion while those locations currently subject to energy convergence could accrete if<br />
they are exposed to less energy in future. Changes in wave approach will change longshore<br />
currents and longshore sediment transport.<br />
In conclusion, the primary hazards to physical (abiotic) coastal infrastructure related to sea<br />
storms and climate change are:<br />
• Extreme inshore sea water levels resulting in flooding and inundation of low lying areas.<br />
• Changes in cyclone characteristics, winds and local wave regime resulting in direct wave<br />
impacts.<br />
• <strong>Coastal</strong> erosion and under-scouring of, for example, foundations and structures.<br />
• System complexities, thresholds and non-linearities, for example related to sand transport.<br />
• A combination of extreme events, such as sea storms during high tides plus sea level rise, will<br />
have the greatest impacts and will increasingly overwhelm existing infrastructure as climate<br />
change related factors set in time.<br />
The main metocean drivers related to the above are thus waves and sea water levels (and to a<br />
lesser extent winds and currents). (The primary hazards listed above are discussed in detail in<br />
Sections 5.3 to 5.6 and 6.2.)<br />
5.3<br />
Significant drivers of high inshore sea water levels are tides, wind set-up, hydrostatics set-up,<br />
wave set-up and, in future, sea-level rise due to climate change (Theron, et al. 2010). These<br />
drivers all affect the still-water level at the shoreline.<br />
The drivers/components of extreme inshore sea water levels most significant to the Southern<br />
<strong>Africa</strong>n context are the tides (South <strong>Africa</strong>n spring tides are about 1 m above mean sea level<br />
(MSL), but reach up to +3.7 m MSL in Mozambique), potential SLR, and wave run-up. Theron<br />
(2007) has estimated that in the South <strong>Africa</strong>n setting during extreme events, these components<br />
could each contribute additional amounts (heights) of between about 0.35 m to 1.4 m to the<br />
inshore sea water level. Note that potential additional impacts of climate change (e.g. more<br />
extreme weather events) on wind-, hydrostatic- and wave set-up are not included in the above<br />
range of increase. These components of extreme inshore sea water levels as determined for the<br />
Mozambican coast are discussed in detail in Section 5.5.2<br />
October 2012, p 34
Recent observations from satellites, very carefully calibrated, are that global sea level rise over<br />
the last decade has been 3.3 +/- 0.4 mm/y (Rahmstorf et al. 2007)). The IPCC AR4 Report (IPCC<br />
2007) concludes that anthropogenic warming and sea level rise would continue for centuries due<br />
to the timescales associated with climate processes and feedbacks, even if greenhouse gas<br />
concentrations were to be stabilised. Comparisons between about 30 years of South <strong>Africa</strong>n tide<br />
gauge records and the longer term records elsewhere, show substantial agreement. A recent<br />
analysis of sea water levels recorded at Durban confirms that the local rate of sea level rise falls<br />
within the range of global trends (Mather 2008). Present SA SLR rates are: west coast +1.87<br />
mm/y, south coast +1.47 mm/y, and east coast +2.74 mm/y (Mather et al. 2009).<br />
The probability of sudden large rises in sea level (possibly several metres) due to catastrophic<br />
failure of large ice-shelves (e.g. Church and White 2006) is still considered unlikely this century,<br />
but events in Greenland (e.g. Gregory 2004, Overland, 2011) and Antarctica (e.g. Bentley 1997;<br />
Thomas et al. 2004) may soon force a re-evaluation of that assessment. In the longer term the<br />
large-scale melting of large ice masses is inevitable. Recent literature (since IPCC 2007) gives a<br />
wide range of SLR scenarios, as indicated in Figure 5.2.<br />
Figure 5.2: Comparison of minimum and maximum estimates of global SLR by year 2100 (USACE, 2011)<br />
(Note, the post 2007 studies give an overall range of about 0.5 m to 2 m.)<br />
Some projections and scenarios are even higher, but most “physics/process based” projections<br />
(e.g. Nicholls and Cazenave 2010; Pfeffer et al. 2008; Milne et al. 2009; SWIPA 2011) for 2100 are<br />
in the 0.5 m to 2 m range (Figure 5.4), as also concluded in various reviews (e.g. Theron and<br />
Rossouw 2009; Fletcher 2009). It is concluded that the best estimate (“mid scenario”) of SLR by<br />
2100 is around 1m, with a plausible worst case scenario of 2m, and a best case scenario of 0.5 m.<br />
The corresponding best estimate (“mid scenario”) projection for 2050 is 0.3 m to 0.5 m.<br />
October 2012, p 35
The drivers of inshore water levels should not be confused with the added effect of wave run-up,<br />
which can reach even higher elevations. Wave run-up is the rush of water up the beach slope<br />
beyond the still-water level in the swash zone. A definition sketch of the various components<br />
leading to extreme inshore sea water levels (identifying the components of tide,<br />
barometric/hydrostatic setup, wind setup, wave setup, wave runup and sea level rise) is<br />
presented in Figure 5.3.<br />
Figure 5.3:<br />
Definition sketch of the various components leading to extreme inshore sea water levels.<br />
According to surveyed elevations (Smith et al. 2010), maximum run-up levels on the open<br />
Kwazulu-Natal (KZN) coast near Durban during the March 2007 storm (which coincided with<br />
highest astronomical tide) reached up to about +10.5 m MSL. Note that wave set-up and run-up<br />
are both accounted for in these levels. The maximum wave run-up alone during the 2007 KZN<br />
storm is estimated to have been up to about 7 m (vertical), resulting from significant nearshore<br />
wave heights of about 8.5 m. (The horizontal distance that the coastline retreated due to coastal<br />
erosion caused by this storm ranged from in the order of 0 m to 100 m resulting from local<br />
circumstances.)<br />
Around southern <strong>Africa</strong>, including Mozambique, wave run-up is thus an important factor, which<br />
may be considerably exacerbated by tides and future SLR (Theron, et al. 2010). Wave climate,<br />
resulting wave run-up prediction and the combined impact of waves, tides and SLR/climate<br />
change effects are addressed in the following sections of this chapter.<br />
October 2012, p 36
5.4<br />
5.4.1 Mozambican Offshore Wave Analysis<br />
Introduction<br />
This section presents a description of the wave climate derived for the Mozambican coast. Little<br />
recorded wave data are available for the Mozambican coast. Most of the wave analysis is based<br />
on the WaveWatch III information available from the National Centre for Environmental<br />
Prediction (NCEP), a division of NOAA, USA. Information on the cyclone-generated waves are also<br />
inferred from Cyclone data and other references.<br />
Wind and Wave Climate Information<br />
Offshore Wave Data<br />
Data source<br />
Archived NCEP data were available from February 1997 to June 2009. Data were extracted for 13<br />
locations along the coast, as presented in Figure 5.4. The output includes three-hourly<br />
measurements of significant wave height (Hs), spectral peak wave period (Tp) and peak wave<br />
direction. In addition, the wind speed and direction were extracted.<br />
NCEP Positions<br />
Figure 5.4:<br />
NCEP grid-point locations<br />
October 2012, p 37
The advantage of the NCEP data is that a data set of about 12 years is available. However since<br />
the data is derived from the global WaveWatch III Model, which predicts the wave conditions at a<br />
resolution of 1 x 1.25 degree resolution (approximately 110 km x 125 km grid size), the dynamic<br />
characteristics and scale of cyclones appear to be under-estimated by the model. A list of the<br />
grid-points used in this study is presented in Table 5.1. It is, however, worth noting that off the<br />
south coast of South <strong>Africa</strong>, the NCEP data compares well with measurements. The good<br />
comparison can most probably be attributed to the different wave generation mechanisms, i.e.<br />
the large low pressure or frontal systems passing the South <strong>Africa</strong>n coast that can be well defined<br />
in the numerical atmospheric models.<br />
Table 5.1: NCEP grid-points (as shown in Figure 5.4)<br />
NCEP ID<br />
Lat<br />
Long<br />
Deg Min Deg Min<br />
City/Town<br />
1302 26 0 33 45 Maputo<br />
1206 24 0 36 15 Maxixe<br />
1108 22 0 36 15 Vilanculos<br />
1011 20 0 37 30 Beira<br />
914 18 0 38 45 Pebane<br />
818 16 0 41 15 Angoche<br />
720 14 0 41 15 Memba<br />
622 12 0 41 15 Ilha Macaloe<br />
524 10 0 41 15 Mtwara<br />
Note that the output data are only representative of exposed offshore ocean waters with depths of 100m or greater<br />
The NCEP grid-points offshore of Maputo, Beira, Maxixe and Vilanculos are given in greater detail<br />
in Figures 5.5a to 5.5d.<br />
October 2012, p 38
Maputo<br />
Figure 5.5a: NCEP<br />
grid-point location off<br />
Maputo<br />
100 m<br />
200 m<br />
600 m<br />
October 2012, p 39
Maxixe<br />
Figure 5.5b: NCEP<br />
grid-point location off<br />
Maxixe<br />
2000 m<br />
100 m<br />
200 m<br />
600 m<br />
1000 m<br />
October 2012, p 40
Vilanculos<br />
Figure 5.5c: NCEP gridpoint<br />
location off Vilanculos<br />
200 m<br />
600 m<br />
1000 m<br />
October 2012, p 41
Beira<br />
50 m<br />
600 m<br />
1000 m<br />
Figure 5.5d:<br />
NCEP grid-point location off Beira<br />
October 2012, p 42
Wave Climate<br />
A summary of the general statistics per location is given in Table 5.2. This table presents the<br />
mean (average), the standard deviation, minimum and maximum, and selected exceedance<br />
percentiles. This table indicates that the wave height decreases to the northern part of<br />
Mozambique. The maximum registered wave height in the south was 6.2 m, decreasing to about<br />
4.2 in the northern part. However, the waves appear to increase again in the southern part of<br />
Tanzania possibly as a result of the reduction of the sheltering effect of Madagascar.<br />
The monthly distribution of mean wave height and standard deviation of wave height at each<br />
location are depicted in Figure 5.6. Thus, it can be seen that the highest waves occur during<br />
winter seasons, while calm conditions generally occur during November to February periods.<br />
Less seasonal variation is found in the south than in northern part of the Mozambican coast.<br />
Table 5.2/…<br />
October 2012, p 43
Table 5.2:<br />
General wave height statistics<br />
Station<br />
Lat Long<br />
Deg Min Deg Min<br />
City/Town NCEP ID Average Variance Min Max 0.01% 0.05% 0.10% 1% 5% 10% 25% 50% 75% 90%<br />
ML01 26 0 33 45 Maputo 1302 1.8 0.5 0.5 6.2 6.0 5.7 5.4 4.2 3.2 2.8 2.1 1.7 1.4 1.2<br />
ML03 24 0 36 15 Maxixe 1206 1.9 0.5 0.5 6.0 5.9 5.6 5.4 4.2 3.3 2.9 2.2 1.8 1.4 1.2<br />
ML04 22 0 36 15 Vilanculos 1108 1.7 0.5 0.4 5.4 5.3 5.0 4.9 3.9 3.0 2.6 2.0 1.5 1.2 1.0<br />
ML06 20 0 37 30 Beira 1011 1.6 0.5 0.4 5.3 5.3 4.9 4.8 3.8 3.0 2.6 1.9 1.4 1.1 0.9<br />
ML08 18 0 38 45 Pebane 914 1.4 0.4 0.3 5.3 5.2 4.8 4.6 3.6 2.8 2.3 1.7 1.3 1.0 0.8<br />
ML10 16 0 41 15 Angoche 818 1.4 0.4 0.3 5.3 5.2 4.7 4.3 3.4 2.5 2.2 1.6 1.2 1.0 0.8<br />
ML11 14 0 41 15 Memba 720 1.1 0.2 0.2 4.2 4.1 3.8 3.5 2.6 2.0 1.8 1.4 1.0 0.8 0.6<br />
ML12 12 0 41 15 Ilha Macaloe 622 1.1 0.2 0.2 4.2 4.1 3.7 3.6 2.6 2.0 1.8 1.4 1.0 0.8 0.6<br />
ML13 10 0 41 15 Mtwara 524 1.4 0.3 0.3 4.2 4.3 3.8 3.7 2.8 2.3 2.0 1.7 1.3 1.0 0.8<br />
October 2012, p 44
Hmo (m)<br />
Hmo (m)<br />
Hmo (m)<br />
Hmo (m)<br />
Hmo (m)<br />
Hmo (m)<br />
Hmo (m)<br />
Hmo (m)<br />
Hmo (m)<br />
NCEP - 1302 (Offshore of Maputo): Signficant wave height<br />
NCEP - 1206 (Offshore of Maxixe): Signficant wave height<br />
3.0<br />
3.0<br />
2.5<br />
2.5<br />
2.0<br />
2.0<br />
1.5<br />
1.5<br />
1.0<br />
1.0<br />
0.5<br />
0.5<br />
0.0<br />
0.0<br />
Jan Feb Mar Apr May Jun Jul Aug Sep Oct Nov Dec<br />
Jan Feb Mar Apr May Jun Jul Aug Sep Oct Nov Dec<br />
Month<br />
Month<br />
Mean<br />
Standard deviation<br />
Mean<br />
Standard deviation<br />
NCEP - 1108 (Offshore of Vilanculos): Signficant wave height<br />
NCEP - 1101 (Offshore of Beira): Signficant wave height<br />
3.0<br />
3.0<br />
2.5<br />
2.5<br />
2.0<br />
2.0<br />
1.5<br />
1.5<br />
1.0<br />
1.0<br />
0.5<br />
0.5<br />
0.0<br />
0.0<br />
Jan Feb Mar Apr May Jun Jul Aug Sep Oct Nov Dec<br />
Jan Feb Mar Apr May Jun Jul Aug Sep Oct Nov Dec<br />
Month<br />
Month<br />
Mean<br />
Standard deviation<br />
Mean<br />
Standard deviation<br />
NCEP - 914: Signficant wave height<br />
NCEP - 818: Signficant wave height<br />
3.0<br />
3.0<br />
2.5<br />
2.5<br />
2.0<br />
2.0<br />
1.5<br />
1.5<br />
1.0<br />
1.0<br />
0.5<br />
0.5<br />
0.0<br />
0.0<br />
Jan Feb Mar Apr May Jun Jul Aug Sep Oct Nov Dec<br />
Jan Feb Mar Apr May Jun Jul Aug Sep Oct Nov Dec<br />
Month<br />
Month<br />
Mean<br />
Standard deviation<br />
Mean<br />
Standard deviation<br />
NCEP - 720: Signficant wave height<br />
NCEP - 622: Signficant wave height<br />
3.0<br />
3.0<br />
2.5<br />
2.5<br />
2.0<br />
2.0<br />
1.5<br />
1.5<br />
1.0<br />
1.0<br />
0.5<br />
0.5<br />
0.0<br />
0.0<br />
Jan Feb Mar Apr May Jun Jul Aug Sep Oct Nov Dec<br />
Jan Feb Mar Apr May Jun Jul Aug Sep Oct Nov Dec<br />
Month<br />
Month<br />
Mean<br />
Standard deviation<br />
Mean<br />
Standard deviation<br />
NCEP - 524: Signficant wave height<br />
3.0<br />
2.5<br />
2.0<br />
1.5<br />
1.0<br />
Figure 5.6: Mean and<br />
standard deviation of wave<br />
height as based on NCEP<br />
wave data<br />
0.5<br />
0.0<br />
Jan Feb Mar Apr May Jun Jul Aug Sep Oct Nov Dec<br />
Month<br />
Mean<br />
Standard deviation<br />
October 2012, p 45
The annual joint distributions of wave height versus direction for each of the locations are<br />
presented in Figure 5.7 in the form of wave roses. The roses indicate that in the southern part of<br />
Mozambique (from southern border to Vilanculos), a bi-modal wave direction with waves<br />
approaching from the S and SE/ESE is indicated. In the central part (from Vilanculos to Angoche),<br />
a SSW’ly component also becomes prominent, together with the SSE’ly component. However,<br />
the SSW’ly component is more prominent towards the northern section. In the northern part of<br />
the Mozambican coast, the wave direction is predominantly S. However, it appears that in the<br />
coastal area between Mozambique and Tanzania, the direction changes to a more E’ly direction<br />
as the effect of Madagascar is less.<br />
NCEP: Annual wave roses<br />
Figure 5.7:<br />
Annual wave roses as based on 12 years of NCEP wave data<br />
The NCEP wave data also provides information on the wave periods. Figure 5.8 presents the<br />
scatter-plots of the significant wave height (Hmo) versus peak wave period (Tp).<br />
October 2012, p 46
Maputo<br />
Maxixe<br />
Vilanculos<br />
Beira<br />
Pebane<br />
Angoche<br />
Memba<br />
Ilha Macaloe<br />
Mtwara<br />
Figure 5.8: Scatter-plot<br />
of Hmo versus Tp for 9 NCEP<br />
wave stations<br />
October 2012, p 47
The peak periods (Tp) of the smaller waves varies mostly between 3 s and about 20 s off the<br />
Mozambican coast. The period for the larger waves varies mostly between periods ranging from<br />
8 s to about 18 s.<br />
Cyclone Information<br />
The NCEP data are derived from the global Wavewatch III model. Therefore, since tropical<br />
cyclones are fairly small and dynamic atmospheric phenomena, the cyclone-generated waves are<br />
not well represented by the NCEP data. There is also little measured data to verify the cyclonegenerated<br />
wave data. It was therefore necessary to examine the available information on<br />
cyclones. For this study, the Annual Tropical Reports from the Joint Typhoon Warning Centre<br />
(JTWC) were utilized (JTWC 1997, 2009). From these reports, four tropical cyclones were<br />
identified for inspection of the corresponding NCEP data. During TC Eline (Feb 2000) with wind<br />
speeds of about 200 km/h, the closest grid-point off Beira indicated offshore waves of about 4 m.<br />
During TC Jahpet (March 2003), NCEP indicated waves of about 4 m offshore of Beira and about 3<br />
m offshore of Vilanculos. TC Favio passed over the Vilanculos region with wind speeds of more<br />
than 150 km/h. The offshore wave height was indicated to be in the order of 2 m. Therefore, it<br />
appears the NCEP model may be under-estimating the magnitude of these waves.<br />
In this study, only cyclone information from 1997 onwards (as obtained from JTWC, 2009) was<br />
extracted, to coincide with the NCEP data. An evaluation of the estimated cyclone tracks<br />
indicated that cyclones travelled through the Mozambican Channel during the period November<br />
to April. Based on the period 1997 to 2008, approximately three cyclones had moved across the<br />
Mozambican Channel on an annual basis, which may have had an impact on the wave data.<br />
During this period a number of tropical cyclones of significance impacted on the Mozambican<br />
coast. Tropical cyclones that made landfall since 1994, as summarised by INGC Climate Change<br />
Report (INGC Phase 1 Report, 2008), are presented in Table 5.3. Unfortunately no wave data<br />
were readily available for these cyclones, except for the CSIR measurements made off Beira<br />
during TC Lisette in February 1997. The wave buoy deployed in 20 m water depth, registered a<br />
peak of about 4 m (Hs) with a corresponding peak period of about 10 s.<br />
Table 5.3:<br />
Tropical cyclones , and tropical storms (TS) making landfall on the coast of Mozambique for the<br />
period 1994-2008 (source: INGC report, 2009)<br />
Year<br />
Category and<br />
Name<br />
Landfill Date Strength Wind speed<br />
1994 (Cat 4) Nadia North 24 March Cat 1 139 km/h<br />
1995 (TS) Fodah Central 22 Jan TD 37 km/h<br />
1996 (Cat 4) Bonita Central 14 Jan Cat 1 130 km/h<br />
1997 (Cat 1) Lisette Central 2 March TS 111 km/h<br />
1998 (TS) North 17 Jan TD 56 km/h<br />
2000 (Cat 4) Eline Central 22 Feb Cat 4 213 km/h<br />
2000 (Cat 4) Hudah Central 8 April Cat 1 148 km/h<br />
2003 (Cat 4) Japhet South 2 March Cat 2 167 km/h<br />
2003 (TS) Atang North 13 Nov TD 46 km/h<br />
2004 (TS) Delfina Central 1 Jan TS 93 km/h<br />
2007 (Cat 4) Favio South 22 Feb Cat 3 185 km/h<br />
2008 (Cat 4) Jokwe North 08 Mar Cat 3 180 km/h<br />
October 2012, p 48
It is worth noting that remote sensing satellite wave data are available for the area. These<br />
satellites (e.g. Jason, Envisat) have fixed tracks (i.e. geo-orbiting). Therefore, more detailed<br />
studies could be conducted to find the satellite-tracks that coincide with the occurrence of<br />
cyclones.<br />
Extreme Wave Analysis<br />
Introduction<br />
As the wave conditions are a primary driver of extreme sea water levels and potential<br />
flooding/inundation of areas, it is necessary to quantify the extreme wave conditions<br />
encountered around the coast. Two procedures were applied in this study to derive the extreme<br />
wave conditions. The first procedure involved fitting a statistical distribution to the NCEP data,<br />
while the second procedure focussed on determining the wave height generated by the extreme<br />
cyclone wind conditions. Both approaches were applied to the full Mozambican coast. The<br />
sections below give an overview of the procedures and the results. (These results, in conjunction<br />
with other drivers of extreme inshore water levels, were considered in the assessment of coastal<br />
flooding in Sections 5.5, 5.6 and 6.2.)<br />
NCEP Extreme Wave Analysis<br />
The NCEP wave climate was analysed and appropriate statistical distributions (e.g. Fisher-Tippet<br />
and Weibull) were tested to find those most applicable to the Mozambican coast. (An article by<br />
Rossouw and Rossouw (1999) provides a description of these distributions and their application<br />
to wave statistics.) The final procedure was based on the POT method (Rossouw & Rossouw,<br />
1999) and by fitting Weibull and Gumbell statistical distributions to all directional data. A<br />
summary of the results are provided in Table 5.4. Note that the corresponding peak period (Tp)<br />
were based on the relationship of Tp 2 versus wave height. By determining the average wave<br />
period per wave height bin (of 0.5 m), a linear relationship could be assumed.<br />
The derived Tp for each extreme wave height is therefore an estimate of the corresponding<br />
period. Since longer wave periods are indicated in the data (Figure 5.8) than presented in<br />
Table 5.4, more detailed analyses will be necessary when focussing on a particular site. The<br />
longer period waves will influence the wave energy that will arrive at the particular location.<br />
October 2012, p 49
Mtwara (M13) Ilha Macaloe (M12) Memba (M11)<br />
Angoche (M10)<br />
Pebane (M08)<br />
Beira (M06)<br />
Vilanculos (M04)<br />
Maxixe (M03)<br />
Maputo (M01)<br />
Table 5.4:<br />
NCEP extreme wave analysis for 9 Locations off the Mozambican coast<br />
Site Dir Return period<br />
1 5 10 20 30 40<br />
50 100<br />
Hm0 [m] Tp [s] Hm0 [m] Tp [s] Hm0 [m] Tp [s] Hm0 [m] Tp [s] Hm0 [m] Tp [s] Hm0 [m] Tp [s] Hm0 [m] Tp [s] Hm0 [m] Tp [s]<br />
All 5.2 10.1 6.3 10.7 6.7 11.0 7.1 11.2 7.4 11.3 7.6 11.4 7.7 11.5 8.1 11.7<br />
N 2.4 5.0 2.6 5.2 2.7 5.2 2.7 5.3 2.8 5.3 2.8 5.3 2.9 5.3 2.9 5.4<br />
NE 2.4 5.5 2.5 5.6 2.6 5.6 2.7 5.7 2.8 5.7 2.8 5.7 2.8 5.7 2.9 5.8<br />
E 3.8 10.1 4.6 10.8 4.9 11.0 5.3 11.3 5.5 11.4 5.6 11.5 5.7 11.6 6.1 11.9<br />
SE 4.7 10.6 5.6 11.3 6.0 11.5 6.3 11.8 6.5 12.0 6.7 12.1 6.8 12.2 7.2 12.4<br />
S 5.9 10.1 6.9 10.4 7.3 10.5 7.7 10.6 7.9 10.7 8.1 10.7 8.2 10.7 8.6 10.8<br />
SW 4.0 - 4.7 - 5.0 - 5.3 - 5.4 - 5.6 - 5.6 - 5.9 -<br />
W<br />
NW 2.3 5.0 2.5 5.1 2.6 5.1 2.7 5.1 2.7 5.2 2.8 5.2 2.8 5.2 2.9 5.2<br />
All 5.3 11.2 6.5 12.1 7.0 12.4 7.5 12.8 7.7 12.9 7.9 13.1 8.1 13.2 8.6 13.5<br />
N 3.5 7.3 4.0 7.8 4.2 8.0 4.3 8.1 4.5 8.3 4.5 8.3 4.6 8.4 4.8 8.6<br />
NE 3.6 8.3 4.2 8.9 4.4 9.2 4.7 9.4 4.8 9.5 4.9 9.6 5.0 9.7 5.3 9.9<br />
E 4.5 9.2 5.5 9.7 5.9 9.9 6.3 10.2 6.6 10.3 6.8 10.4 6.9 10.4 7.4 10.7<br />
SE 5.1 10.0 6.3 10.7 6.7 11.0 7.2 11.3 7.5 11.4 7.7 11.6 7.9 11.6 8.3 11.9<br />
S 5.7 11.5 6.8 12.0 7.2 12.1 7.6 12.3 7.8 12.4 8.0 12.5 8.1 12.5 8.5 12.7<br />
SW 4.7 12.7 5.4 12.7 5.7 12.7 6.0 12.7 6.2 12.7 6.3 12.7 6.4 12.7 6.7 12.7<br />
W<br />
NW<br />
All 4.8 10.3 6.0 11.1 6.4 11.5 6.9 11.8 7.2 12.0 7.4 12.1 7.5 12.2 8.0 12.5<br />
N 3.1 6.9 3.5 7.4 3.7 7.6 3.9 7.8 4.0 7.9 4.1 8.0 4.2 8.0 4.4 8.2<br />
NE 3.3 7.4 3.9 7.9 4.2 8.2 4.4 8.4 4.6 8.5 4.7 8.6 4.8 8.6 5.0 8.8<br />
E 3.8 9.0 4.5 9.7 4.8 10.0 5.1 10.3 5.3 10.4 5.4 10.5 5.5 10.6 5.8 10.9<br />
SE 4.5 9.5 5.5 10.1 5.9 10.3 6.2 10.5 6.5 10.7 6.6 10.8 6.7 10.8 7.1 11.1<br />
S 5.5 10.3 6.6 10.4 7.1 10.5 7.6 10.5 7.9 10.6 8.1 10.6 8.3 10.6 8.7 10.7<br />
SW 3.5 - 4.2 - 4.5 - 4.7 - 4.9 - 5.0 - 5.1 - 5.4 -<br />
W<br />
NW<br />
All 4.5 10.6 5.4 11.3 5.7 11.5 6.1 11.8 6.3 12.0 6.4 12.0 6.5 12.1 6.9 12.4<br />
N 3.0 6.6 3.5 7.0 3.7 7.2 3.9 7.4 4.0 7.5 4.1 7.6 4.2 7.6 4.4 7.8<br />
NE 3.3 9.0 3.9 9.9 4.2 10.3 4.5 10.6 4.7 10.8 4.8 10.9 4.9 11.0 5.1 11.4<br />
E 3.3 7.2 3.8 7.7 4.0 7.8 4.3 8.0 4.4 8.1 4.5 8.2 4.6 8.3 4.8 8.5<br />
SE 4.4 9.4 5.0 9.9 5.3 10.1 5.6 10.3 5.8 10.4 5.9 10.4 6.0 10.5 6.2 10.7<br />
S 4.9 10.9 5.7 11.2 6.1 11.4 6.4 11.5 6.7 11.6 6.8 11.6 6.9 11.7 7.2 11.8<br />
SW 4.1 - 5.0 - 5.4 - 5.8 - 6.1 - 6.2 - 6.4 - 6.8 -<br />
W<br />
NW<br />
All 4.3 11.4 5.1 12.2 5.5 12.6 5.8 12.9 6.0 13.0 6.1 13.2 6.2 13.3 6.6 13.6<br />
N 1.7 4.4 1.8 4.5 1.8 4.5 1.8 4.5 1.8 4.5 1.8 4.5 1.9 4.5 1.9 4.6<br />
NE 2.6 6.4 3.0 6.8 3.2 6.9 3.3 7.0 3.4 7.1 3.5 7.2 3.5 7.2 3.7 7.3<br />
E 2.8 7.5 3.3 8.2 3.6 8.5 3.8 8.7 4.0 8.9 4.1 9.0 4.2 9.0 4.4 9.3<br />
SE 3.8 8.4 4.4 8.8 4.7 9.0 5.0 9.2 5.1 9.3 5.2 9.4 5.3 9.4 5.6 9.6<br />
S 4.5 11.5 5.4 12.2 5.7 12.4 6.0 12.7 6.2 12.8 6.4 12.9 6.5 13.0 6.8 13.2<br />
SW 3.9 - 4.9 - 5.3 - 5.8 - 6.0 - 6.2 - 6.3 - 6.8 -<br />
W<br />
NW<br />
All 4.1 11.7 5.2 12.8 5.6 13.3 6.0 13.7 6.2 13.9 6.4 14.1 6.6 14.2 7.0 14.6<br />
N 2.9 6.8 3.4 7.2 3.6 7.3 3.8 7.5 3.9 7.5 4.0 7.6 4.0 7.6 4.2 7.8<br />
NE 2.6 6.2 3.0 6.5 3.2 6.6 3.4 6.7 3.5 6.7 3.5 6.8 3.6 6.8 3.8 6.9<br />
E 3.1 7.2 3.7 7.7 4.0 7.9 4.3 8.1 4.5 8.2 4.6 8.3 4.7 8.4 5.0 8.5<br />
SE 2.6 6.9 3.0 7.2 3.1 7.3 3.3 7.4 3.4 7.5 3.4 7.5 3.5 7.6 3.6 7.7<br />
S 4.3 11.9 5.2 12.8 5.6 13.1 5.9 13.4 6.2 13.6 6.3 13.7 6.4 13.8 6.8 14.1<br />
SW 3.4 12.8 4.0 12.8 4.2 12.9 4.5 12.9 4.6 12.9 4.7 12.9 4.8 12.9 5.1 12.9<br />
W<br />
NW<br />
All 3.2 9.1 3.9 9.8 4.2 10.0 4.5 10.3 4.7 10.4 4.8 10.5 4.9 10.6 5.2 10.8<br />
N 3.0 7.4 3.5 8.0 3.7 8.2 4.0 8.4 4.1 8.6 4.2 8.6 4.3 8.7 4.5 8.9<br />
NE 2.0 6.8 2.3 7.0 2.4 7.1 2.6 7.2 2.6 7.3 2.7 7.3 2.7 7.3 2.8 7.4<br />
E 2.6 7.4 3.2 8.0 3.4 8.2 3.7 8.4 3.8 8.5 4.0 8.6 4.0 8.7 4.3 8.9<br />
SE 2.5 7.1 2.9 7.5 3.0 7.6 3.2 7.7 3.3 7.8 3.4 7.9 3.4 7.9 3.6 8.1<br />
S 3.5 9.3 4.2 9.5 4.5 9.6 4.8 9.7 5.0 9.8 5.1 9.8 5.2 9.9 5.6 10.0<br />
SW<br />
W<br />
NW<br />
All 3.3 7.8 4.0 8.3 4.4 8.4 4.7 8.6 4.8 8.7 5.0 8.8 5.1 8.8 5.4 9.0<br />
N 3.0 7.2 3.5 7.8 3.7 8.0 3.9 8.2 4.0 8.3 4.1 8.4 4.2 8.4 4.4 8.6<br />
NE 2.0 7.8 2.4 8.2 2.6 8.3 2.8 8.5 2.8 8.6 2.9 8.7 3.0 8.7 3.1 8.9<br />
E 2.1 8.0 2.6 8.3 2.9 8.4 3.1 8.6 3.3 8.7 3.4 8.7 3.5 8.8 3.8 8.9<br />
SE 2.5 6.9 2.9 7.2 3.1 7.3 3.3 7.5 3.4 7.6 3.4 7.6 3.5 7.7 3.7 7.8<br />
S 3.7 7.6 4.4 7.6 4.7 7.5 5.0 7.5 5.2 7.5 5.3 7.5 5.4 7.4 5.7 7.4<br />
SW<br />
W<br />
NW<br />
All 3.5 8.1 4.2 8.5 4.5 8.6 4.8 8.8 5.0 8.9 5.1 8.9 5.2 9.0 5.5 9.1<br />
N 3.0 6.8 3.5 7.3 3.8 7.4 4.0 7.6 4.1 7.7 4.2 7.8 4.3 7.8 4.5 8.0<br />
NE 2.3 8.1 2.7 8.5 2.8 8.6 3.0 8.8 3.1 8.9 3.2 8.9 3.2 9.0 3.4 9.1<br />
E 2.5 9.2 2.8 9.5 2.9 9.6 3.0 9.7 3.1 9.7 3.1 9.8 3.2 9.8 3.3 9.9<br />
SE 3.0 6.9 3.3 6.9 3.4 6.9 3.6 7.0 3.6 7.0 3.7 7.0 3.7 7.0 3.9 7.0<br />
S 4.0 8.0 4.7 8.2 5.0 8.3 5.3 8.4 5.5 8.4 5.6 8.5 5.7 8.5 6.0 8.6<br />
SW<br />
W<br />
NW<br />
October 2012, p 50
As concluded from the discussion above, the NCEP data do not sufficiently represent or contain<br />
the cyclone-generated waves, less emphasis is placed on the results of the extreme analysis<br />
based on this data set (Table 5.4).<br />
Offshore wave heights corresponding to return periods from 1 to 100 years applicable to the<br />
various sectors of the Mozambican coast are also indicated in Table 5.4. For the deep sea off the<br />
Maputo and Beira areas, for example, the calculated return periods for various extreme wave<br />
heights can be depicted graphically as indicated in Figure 5.9.<br />
Figure 5.9:<br />
Extremes wave heights (NCEP wave data) versus return periods offshore of Maputo (left) and<br />
Beira (right)<br />
The norm for the engineering design of marine/coastal structures is the 1-in-100 year wave<br />
condition. It may be argued that residential dwellings or less important structures could be<br />
designed for a reduced design period of say 50 years. However, based on the calculated wave<br />
return periods (Figure 5.9) the 1-in-50 year condition is only 5% less than the 1-in-100 year<br />
condition for both Maputo and Beira. Therefore, the results for the 1-in-100 year wave height<br />
(the design norm) are applied further.<br />
Cyclone-generate Extreme Waves<br />
Information on the extreme wind intensity of tropical cyclones was obtained to estimate extreme<br />
cyclone generated waves, as a better alternative to focussing on the analysis of the NCEP wave<br />
data. By deriving or estimating extreme wind intensities, the corresponding wave condition can<br />
be calculated. This procedure was also followed since no long-term measurements and no high<br />
resolution hindcast data were available along the Mozambican coast for this study.<br />
Rossouw (1999) used data obtained from JTWC and applied Monte Carlo techniques to derive the<br />
number and average maximum intensity of tropical cyclones to be expected in a 100 years.<br />
Estimates of the extreme wind conditions were derived for the entire Mozambican coast, as a<br />
function of latitude. These estimates are presented in Table 5.5.<br />
October 2012, p 51
Table 5.5:<br />
Estimated average maximum wind speed intensity in 100 years as a function of latitude<br />
(based on Rossouw, 1999)<br />
Latitude<br />
Onshore<br />
(Deg)<br />
City/Town<br />
Vm (knots)<br />
26.0 Maputo 96<br />
24.0 Maxixe 116<br />
22.0 Vilanculos 132<br />
19.8 Beira 120<br />
17.3 Pebane 142<br />
16.2 Angoche 134<br />
14.2 Memba 132<br />
12.0 Ilha Macaloe 138<br />
10.3 Mtwara 106<br />
Using the estimate maximum intensities, Rossouw (1999) applied the following procedure to<br />
determine the extreme wave height. Note that the estimation of the significant wave height (Hs)<br />
and associated peak wave period (Tp) is described in the SPM (USACE, 1984).<br />
Hs<br />
0.29<br />
R P<br />
4700 f<br />
5.03e<br />
1<br />
{m} (1)<br />
U<br />
R<br />
V<br />
Tp<br />
0.145<br />
R P<br />
9400 f<br />
8.6e<br />
1<br />
{s} (2)<br />
U<br />
R<br />
V<br />
Where:<br />
R (radius to maximum winds) = 11.671<br />
5 3<br />
0.014487 * Latitude *10 * Vm {km} (3)<br />
with Vm, the average 1-minute wind speed, in m/s<br />
∆P (pressure gradient) =<br />
1 ln<br />
Vm<br />
0.6797 4.4548<br />
e {mb}<br />
(4)<br />
with Vm in knots<br />
a = forward motion factor, estimated to be 1.0<br />
V f = forward celerity of the tropical cyclone {m/s}<br />
U R =0.865*Vm+0.5V f (5)<br />
with Vm and V f in m/s<br />
October 2012, p 52
For the purposes of this study, the forward celerity (V f ) was taken as 7 m/s. This value was based<br />
on Rossouw (1999) and a review of the cyclone tracks obtained from the JTWC reports. The<br />
results of this procedure are presented in Table 5.6. The 100-year wave conditions, represent the<br />
offshore wave condition in the same areas as presented in Table 5.1. A summary of the wave<br />
conditions is schematically presented in Figure 5.10, giving the wave height and period along the<br />
Mozambican coast. For example, based on the wind speed expected to occur only once in a 100<br />
years as result of the presence of a tropical cyclone, the estimated wave height offshore of Beira<br />
would be in the order of 8.7 m. The corresponding wave period is estimated to be 12 s.<br />
Table 5.6:<br />
Estimated offshore and nearshore 100-year wave condition<br />
100-year wave Water depth = 14 m (from 200 m); Slope = 1:50<br />
Onshore<br />
Latitude<br />
condition<br />
0 (orthogonal) 45 (orthogonal)<br />
City/Town<br />
(deg)<br />
Hs Tp Hs Dir L Hs Dir L<br />
Maputo 26.0 8.2 11 7.8 0.0 122.0 7.0 27.0 122.0<br />
Maxixe 24.0 8.6 12 8.4 0.0 135.0 7.4 25.0 135.0<br />
Vilanculos 22.0 9.0 12 8.8 0.0 135.0 7.8 25.0 135.0<br />
Beira 19.8 8.7 12 8.5 0.0 135.0 7.5 25.0 135.0<br />
Pebane 17.3 9.3 12 9.1 0.0 135.0 8.0 25.0 135.0<br />
Angoche 16.2 9.1 12 8.9 0.0 135.0 7.9 25.0 135.0<br />
Memba 14.2 9.0 12 8.4 0.0 135.0 7.8 25.0 135.0<br />
Ilha Macaloe 12.0 9.2 12 9.0 0.0 135.0 8.0 25.0 135.0<br />
Mtwara 10.3 8.4 11 8.0 0.0 122.0 7.2 27.0 122.0<br />
Furthermore, since the derived waves represent deep water conditions, a linear wave<br />
transformation was applied to estimate the wave height in a water depth of 15 m. Two wave<br />
heights were determined. The wave height was determined assuming the waves approach the<br />
coast orthogonally as well as from a 45° angle. These results are also presented in Table 5.6.<br />
Thus, the offshore 100-year wave condition ranges in height from 8.2 m to 9.3 m with a mean of<br />
8.8 m. It is interesting to note that the largest deviation from the mean is only about 7%. These<br />
estimated extreme wave conditions were applied in the rest of the study, except where<br />
superseded by wave modelling, as discussed in Section 5.4.3.<br />
October 2012, p 53
Hmo 1:100 : 8.4 m<br />
Tp: 11 s<br />
Hmo 1:100 : 9.2 m<br />
Tp: 12 s<br />
Hmo 1:100 : 9.0 m<br />
Tp: 12 s<br />
Hmo 1:100 : 9.1 m<br />
Tp: 12 s<br />
Hmo 1:100 : 9.3 m<br />
Tp: 12 s<br />
Hmo 1:100 : 8.7 m<br />
Tp: 12 s<br />
Hmo 1:100 : 9.0 m<br />
Tp: 12 s<br />
Hmo 1:100 : 8.6 m<br />
Tp: 12 s<br />
Hmo 1:100 : 8.2 m<br />
Tp: 11 s<br />
Figure 5.10:<br />
100-year wave condition along Mozambican coast<br />
5.4.2 Trends in wave climate and future conditions<br />
Preliminary findings indicate that there may be long-term trends in regional marine weather<br />
(metocean) climates, while sea level rise alone will greatly increase the risks and impacts<br />
associated with extreme sea-storm events (Theron 2007). The regional variation in the global<br />
wave climate was demonstrated by Mori et al. (2010), who predicted that the mean wave height<br />
might generally increase in the regions of the mid-latitudes (both hemispheres) and the Antarctic<br />
ocean, while decreasing at the equator. Their study was based on simulating future trends.<br />
Further evidence of a general wave height increase in the northern Atlantic, along the North<br />
American East coast was provided by Wang et al. (2004). Komar and Allan (2008) also found an<br />
increase in the wave height generated by hurricanes along the East coast of the United States<br />
using wave data from the National Data Buoy Center (NDBC) wave buoy data. Investigations<br />
done by Ruggerio et al. (2010) with buoy data also indicate increasing storm intensities along<br />
both the West and East coast of Northern America. Such changes in the regional metocean<br />
climates are expected to have significant impacts on local coastal areas. It is therefore important<br />
October 2012, p 54
Hmo (m)<br />
to also investigate possible future climatic changes off the southern <strong>Africa</strong>n coastline as well as<br />
the expected associated impacts.<br />
As can be anticipated, a more severe wave climate (or indirectly a more severe oceanic wind<br />
climate) will have greater impact on run-up and flooding levels, and will thus necessitate the<br />
prediction of future trends in the wave climate. Although the available southern <strong>Africa</strong>n wave<br />
record is shorter than ideally required to determine long-term trends, a preliminary analysis was<br />
conducted. It was found that the annual mean significant wave height (H m0 ) and corresponding<br />
standard deviation for the wave data set collected off Richards Bay (some 230 km south of<br />
Mozambique) and the annual mean wave height (H m0 ) for the long-term data set, collected<br />
offshore of Cape Town (SA), indicate no real progressive increase. This may appear to contradict<br />
the findings of the IPCC as presented in PIANC (2008). However, the SA results may reflect a<br />
regional aspect of the impact of climate change. Since no long-term data are available for the<br />
Mozambican waters and given the different weather climate, or rather the different wave<br />
generating mechanisms, the patterns or trends in wave climate found along the SA east coast can<br />
not be transferred directly to the Mozambican coast.<br />
Although the averages of the SA data appear to remain constant, the individual storm data shows<br />
some change. For example, considering the peaks of individual storms during the more extreme<br />
South <strong>Africa</strong>n winter period (June to August), an increase of about 0.5 m over 14 years can<br />
seemingly be observed (Figure 5.11). The trend could potentially be indicative of a significant<br />
increase in the ’storminess’ over the next few decades, but such a large trend is considered<br />
unlikely at this stage. It is also worth noting that the opposite occurs during summer: there seems<br />
to be a general decreasing trend over the last 14 years with regard to individual storms.<br />
Offshore Cape Town - Winter<br />
Individual storm above 5 % exceedance value (4.9 m)<br />
12<br />
10<br />
8<br />
6<br />
4<br />
2<br />
0<br />
1-Jan-94<br />
1-Jan-95<br />
1-Jan-96<br />
31-Dec-96<br />
1-Jan-98<br />
1-Jan-99<br />
1-Jan-00<br />
31-Dec-00<br />
1-Jan-02<br />
1-Jan-03<br />
1-Jan-04<br />
31-Dec-04<br />
1-Jan-06<br />
1-Jan-07<br />
1-Jan-08<br />
31-Dec-08<br />
1-Jan-10<br />
Date<br />
Figure 5.11: Peaks of individual storms over 14 year-period – offshore Cape Town (based on recordings by CSIR<br />
on behalf of Transnet National Ports Authority, South <strong>Africa</strong>).<br />
October 2012, p 55
If the recorded increase is indeed indicative of a trend, storminess (in terms of intensity) may be<br />
on the increase. (A number of aspects need further study though, including reviewing the trends<br />
in energy flux and not just the wave height.) An extrapolation into the future of the previous 0.5 m<br />
wave height increase over 14 years, is however considered to be unrealistically high. To some<br />
extent it could be said that an increasing trend (as possibly indicated by the SA wave data) is<br />
supported by the model predictions of Mori et al. (2010), which appear to show an increase for<br />
the southern Indian Ocean of roughly 6% (at exceedance probability < 10^-5) (Figure 5.12).<br />
Figure 5.12: Future wave climate changes from model predictions by Mori et al. (2010)<br />
In lieu of a sufficiently long record of wave data and consequently on wave climate trends, the<br />
main driver of the waves, namely the ocean winds, can be examined to derive possible trends.<br />
Wave climate and conditions are determined by ocean winds (through parameters such as, e.g.<br />
velocity, duration, fetch, occurrence, decay, depth), as indicated in Figure 5.13. Modelling of the<br />
southern <strong>Africa</strong>n metocean climate i.t.o. present versus future wind conditions and barometrics,<br />
is currently being conducted (by CSIR). Analyses of the outputs (i.t.o. factors such as ocean wind<br />
statistics and trends) are still required to inform future projections of oceanic weather and<br />
resultant wave conditions.<br />
October 2012, p 56
Wave Height (m Hmo)<br />
16<br />
14<br />
12<br />
Graph of wave height vs. wind velocity.<br />
Based on Kamphuis (1999)<br />
Example for: fetch = 500 km & duration = 24 h.<br />
10<br />
8<br />
6<br />
4<br />
2<br />
0<br />
0 5 10 15 20 25 30 35 40 45<br />
Figure 5.13:<br />
Wind Velocity (m/s)<br />
Example of wave height determined from wind velocity through a wind/wave model<br />
Despite the possibility of stronger oceanic winds (e.g. IPCC 2007, Joubert and Hewitson 1997),<br />
predicted values for potential changes in wind regimes off the southern <strong>Africa</strong>n coastal region are<br />
currently still largely lacking. In view of this shortcoming, and to enable an assessment of the<br />
potential impacts of stronger winds, a relatively modest increase of 10% could be assumed. (This<br />
is also in line with assumptions made for the German coast (Brinkmann, 2010)). Wave height (in<br />
the fully developed state) is proportional to the square of the wind stress factor (UA). UA can be<br />
related to the wind speed (U) according to the following expression (US Army, Corps of Engineers<br />
1984): UA = 0.71 U 1.23 . Thus, a modest 10% increase in wind speed, means a 12% increase in wind<br />
stress and a 26% increase in wave height (Theron, 2007).<br />
Some Global climate models seem to predict an increase in frequency and intensification of<br />
cyclones (e.g. Carter at all, 1994), but there does not seem to be general scientific consensus on<br />
such future cyclone changes/trends. While about two to three cyclones per year currently enter<br />
the Mozambique Channel, a possible southward shift of the cyclone belt due to climate change<br />
(see Phase I and <strong>Theme</strong> 8 report), would mean an increase in the occurrence of cyclones<br />
impacting southern Mozambique’s coastal regions. However, although this is a projected future<br />
outcome of climate change effects, the confidence placed in this projection is low at this stage.<br />
This potential effect of CC is also not expected to occur within the next few decades, but is<br />
possible in the long-term, perhaps only beyond 2100.<br />
Based on the foregoing information and discussion, it is concluded that the main scenario for<br />
future wave climate off Mozambique should be a 6% to 10% increase in wave height by 2100,<br />
with the best estimate at 6% increase as derived from Mori et al. 2010. This might seem<br />
insignificant, but the effect on for example sediment transport can be significant, as discussed in<br />
Section 5.5.4. However, in terms of only wave height it is indeed somewhat insignificant, in that<br />
the uncertainly of the predicted cyclone wave heights is probably more than 6%. In addition, the<br />
water depth was increased in the cyclone wave modelling according to the predicted SLR<br />
scenarios, thus accounting for the possibly largest CC effect on the waves. Therefore, the possible<br />
additional effect of the small 6% increase was not explicitly incorporated in the cyclone<br />
October 2012, p 57
modelling. (If better wave data becomes available for the Mozambique region, it may be<br />
warranted to re-evaluate this issue.)<br />
5.4.3 Modelling cyclone wind-generated waves<br />
Approach and cyclone wave modelling background<br />
Numerical wave modelling is powerful tool to understand and determine the wave conditions in<br />
an area where no data are available. The CSIR has been using the SWAN model for many years<br />
now to simulate the evolution of a wave field from the offshore area to the coast (the shore).<br />
This includes the development of the CSIR Virtual Buoy System, which is operational in Table Bay<br />
and Saldanha Bay (Rossouw et al., 2005). SWAN is the acronym for Simulating WAves Nearshore<br />
(Booij et al. 1999). SWAN also has the ability to take the local wind into account by generating the<br />
waves over the model domain. Furthermore, SWAN allows spatial and temporal variability of the<br />
wind.<br />
In this part of the study the focus was on the varying wind field and propagation due to cyclones<br />
and the resulting wave generation and propagation towards the shoreline. Therefore, using the<br />
estimated 100 year extreme winds, the corresponding wave conditions could be derived for<br />
specific locations along the coast. The application of SWAN in this study is described below.<br />
Background on SWAN numerical wave model<br />
The SWAN model is based on the discrete spectral action balance equation and is fully spectral (in<br />
all directions and frequencies). More detail can be found in Deltares (2010). Being a spectral<br />
model, it implies that short-crested random wave fields can be simulated. These wave fields<br />
propagate simultaneously from different directions (e.g. a wind sea with super-imposed swell).<br />
Note that the SWAN model represents the processes of wave generation by wind, dissipation due<br />
to white-capping, bottom friction and depth-induced wave breaking and non-linear wave-wave<br />
interactions.<br />
October 2012, p 58
Verification of cyclone wave modelling<br />
To evaluate and verify the cyclone wind-wave modelling ability, a test case was set up, where an<br />
actual tropical cyclone was modelled. The CSIR collected wave data with wave buoys off Beira in<br />
1997 at the time that Tropical Cyclone (TC) Lizette passed over the area. This event gave a unique<br />
opportunity to simulate the cyclone-generated waves and to compare the results to measured<br />
data. The locations of the two wave buoys are shown in Figure 5.14.<br />
Figure 5.14:<br />
Location of wave buoys off Beira, Mozambique<br />
Although sufficient wave information was available at the two buoys, little detail information on<br />
TC Lizette, was available. The most useful information was obtained from the 1997 Annual<br />
Tropical Cyclone report of the Joint Typhoon Warning Center (JTWC, 1997). This center uses<br />
observations and satellite imagery to estimate the magnitude and tracks of cyclones. The track of<br />
TC Lizette over Mozambique is shown in Figure 5.15. The estimated maximum wind speed<br />
intensity of the cyclone was 39 m/s, which represented in the 1 min average speed.<br />
October 2012, p 59
An image of the Scatterometer onboard the ERS-2 satellite of TC Lizette on the morning of 27<br />
February 1997 in the Mozambican channel, is shown in Figure 5.16. The Scatterometer provides<br />
information on the wind speed and direction. The structure of the cyclone is shown; in particular<br />
one can note the sensitivity of each Scatterometer's antenna to the wind direction. The eye of the<br />
cyclone, where the wind speed falls dramatically is clearly illustrated by the wind vectors.<br />
TC Lizette<br />
Figure 5.15: Track of TC Lizette over Mozambique (JTWC, 1997).<br />
October 2012, p 60
Cyclone Lizette<br />
27 February 1997 (07:25:06 UTC)<br />
Figure 5.16:<br />
ERS-2 Scatterometer image of TC Lizette showing the cyclonic wind vectors<br />
(Source: ESA)<br />
In order to represent the cyclone (or wind field) in time and space in the SWAN model, a wind<br />
field was generated with a MatLab procedure over the entire model domain. A schematized wind<br />
distribution was used to describe TC Lizette, based on what little information about the structure<br />
of the cyclone could be obtained. The wind field was generated on a 30 minute time-step over a<br />
period of about 2 days. Examples of these wind fields, at certain time-steps, are presented in<br />
Table 5.7. These wind fields follow the trajectory of the cyclone over time. Note that a separate<br />
MatLab procedure was developed to generate the cyclone trajectory.<br />
October 2012, p 61
Table 5.7: The main input parameters for TC Lizette (March 1997)<br />
Estimated mean pressure (MSLP):<br />
Max wind speed (1 min average):<br />
Max wind speed (1 hr average – SWAN input):<br />
Radius to maximum wind speed:<br />
Forward celerity of cyclone (estimated from JTWC tracks):<br />
Water level (based on CSIR water level measurements at Beira):<br />
968 MB<br />
39 m/s<br />
31 m/s<br />
12 km<br />
5 m/s<br />
+ 5.5 m to CD<br />
Using these wind fields as input, a SWAN model was set up for the Mozambican coast off Beira. In<br />
general, the model domain of a typical SWAN set-up would cover an area of about 50 km by 100<br />
km. In this particular case, the model domain covered an area of about 700 km by 800 km, which<br />
included the Mozambican channel. The model domain is shown in Figure 5.17. This is a very<br />
large area and therefore, a computationally intensive exercise.<br />
The SWAN model consisted of two model domains, namely the coarse domain as shown in Figure<br />
5.17 and a high resolution domain. The high resolution domain covered a small area at Beira,<br />
taking the depth-varying bathymetry into account.<br />
Mozambique<br />
Beira<br />
Model domain<br />
Madagascar<br />
Figure 5.17:<br />
SWAN model domain<br />
The wave simulation was done using these model domains and the wind field set-up. The windgenerated<br />
wave fields, which correspond to the wind field given in Table 5.7, are presented in<br />
Figure 5.18. The wave fields are presented for a larger area and for the area close to Beira, where<br />
the wave data were collected.<br />
October 2012, p 62
Figure 5.18: Example of cyclone wind-generated wave fields showing wave<br />
height in the Mozambique Channel and near Beira at particular time-steps. Note,<br />
the locations where wave data were collected are also shown.<br />
October 2012, p 63
October 2012, p 64
A comparison of the simulated wave height with the measured data is shown in Figure 5.19.<br />
Taking the sparse information on the cyclone into account, and considering that no additional<br />
boundary conditions or local wind conditions were taken into account, the model simulations<br />
compare very well with the measured wave height data at both of the locations. (Note that the<br />
measured wave height, as recorded 24 hours prior to the cyclone storm event, was subtracted<br />
(hence the flat line on the y-axis at 0 m), since the background swell and historic wind-generated<br />
waves were not taken into account – only the cyclone-generated waves.)<br />
Figure 5.19:<br />
Time-series of measured and simulated wave height – for both wave buoy locations<br />
The results of the simulation exercise indicated that SWAN provided a reasonably good<br />
description of the cyclone event in terms of the wave conditions. The modelling methodology<br />
developed can thus be applied with some confidence to simulate cyclone wind and wave<br />
conditions.<br />
Extreme cyclone generated waves along the Mozambican coast<br />
Analyses of the input offshore wave climate, extreme conditions and future projections off<br />
Mozambique, have been dealt with in the previous sections. However, to assess coastal wave<br />
run-up and wave related impacts, the inshore wave conditions have to be determined for design<br />
offshore wave conditions. Therefore, based on available bathymetric data and selected offshore<br />
input cyclone conditions, numerical wave modelling was conducted to determine the required<br />
inshore conditions.<br />
October 2012, p 65
Limited wave modelling was conducted for three locations along the Mozambican coast, namely<br />
Maputo, Beira and Pemba areas. Since a cyclone can approach from a wide directional range, a<br />
number of selected propagation-directions were investigated. The selected locations did,<br />
however, dictate which directions were simulated with SWAN. The three offshore cyclone<br />
propagation directions which could result in the most severe wave conditions along the<br />
Mozambique coast included south-east, east and north- east. In line with the norm for<br />
engineering design, the 1-in-100 year condition was selected.<br />
A summary of the simulation details for the three locations, as applied in this study, is presented<br />
in Table 5.8. Note, the radius to maximum wind speed (R) was based on the procedure presented<br />
in Rossouw (1999). The total radius of the cyclone was taken as 150 km.<br />
Table 5.8:<br />
Cyclone simulation details for Mozambican locations<br />
Simulation parameter<br />
Location<br />
Maputo Beira Pemba<br />
Wind speed – hourly average (m/s) 42 48 56<br />
V f - forward celerity (m/s) 7 7 7<br />
Radius to max wind speed (km) 12 12 12<br />
Approach directions simulated with SWAN ENE & E E & SE NE & E<br />
Examples of the wave fields, as generated by a cyclone with a 1-in-100 yr wind condition, are<br />
presented in Figures 5.20 to 5.22 for three locations. The wave fields are presented in terms of<br />
the wave height contours (i.e. the colour range) and wave vectors. These wave vectors show the<br />
mean wave direction while the wave height is represented by the length of the vector.<br />
The wave field depicted in Figure 5.20 is the result of the cyclone approaching Maputo from an<br />
East-north-easterly direction. The largest waves prevail in the open waters (white colour) and<br />
decrease rapidly closer to the shore, as a result of the decreasing water depth.<br />
A similar wave field is presented for the Beira area in Figure 5.21c. The waves are larger in the<br />
open waters and smaller near the shore. Figure 5.21 also presents the wave field of the entire<br />
cyclone as it is travelling towards the coast from a south-easterly direction.<br />
The wave field generated by a cyclone approaching Pemba from an easterly direction is<br />
illustrated in Figure 5.22. Figure 5.22a (left side) shows the waves when the cyclone is offshore of<br />
Pemba. Note that the centre of the cyclone is northward of Pemba, to ensure the maximum<br />
impact of the approaching waves. Figure 5.22b (right side) shows the wave field when the<br />
cyclone is already over land.<br />
October 2012, p 66
Figure 5.20:<br />
Example of wave modelling to derive inshore conditions at Maputo<br />
(east-north-easterly cyclone direction)<br />
October 2012, p 67
Figure 5.21a, b & c: Example of wave modelling to derive inshore conditions at Beira<br />
(south-easterly cyclone direction)<br />
October 2012, p 68
Figure 5.22a and b: Example wave<br />
cyclone modelling output for Pemba; (a)<br />
easterly offshore cyclone direction; (b)<br />
cyclone on land / over bay<br />
October 2012, p 69
It is perhaps worth noting that the derivation of the nearshore waves using a numerical model,<br />
provides a more realistic estimation of the extreme waves than merely deriving the nearshore<br />
wave from the estimated offshore extreme wave using a simple refraction/shoaling equation.<br />
The mild bathymetric slopes/features have a significant impact on wave dissipation (e.g. through<br />
frication and shoaling) which can be better estimated with a numerical model.<br />
Following the SWAN simulations, the relevant wave parameters were extracted at a number of<br />
positions for each of the three areas. These parameters were incorporated in the derivation of<br />
the coastal inundation and erosion levels for particular areas. The derivation<br />
approach/methodologies and results are described in the following section.<br />
5.5<br />
5.5.1 Basic concepts and approach<br />
As found in the literature review, probably the most significant driver of deleterious impacts in<br />
the Mozambican coast is sea storms (e.g. due to cyclones) combined with high water levels<br />
(Section 5.2). Thus, the remainder of this chapter is focussed on the quantification of these<br />
specific aspects/drivers of coastal hazard. Process based models are now applied to these specific<br />
drivers which have greatest effect on the coastal impacts.<br />
The shoreline response and flooding impact is influenced by coastal parameters/processes such<br />
as: topography, geology, inshore wave action, sea level rise, bathymetry and foredune volume. To<br />
be of more use in hazard quantification and ultimately in finding ways of reducing risks, it is<br />
necessary to be able to predict or forecast the coastal response and severity of impacts. This is<br />
addressed in the following sections.<br />
5.5.2 Prediction of high inshore sea water levels<br />
As mentioned, significant drivers of high inshore sea water levels are tides, wind set-up,<br />
hydrostatics set-up, wave set-up and, in future, sea-level rise (SLR, due to climate change). These<br />
drivers all affect the still-water level at the shoreline. The drivers/components of extreme inshore<br />
sea water levels most significant to the southern <strong>Africa</strong>n context are the tides, potential SLR, and<br />
wave run-up. Refer to Figure 5.3 for a schematic definition of the various components referred to<br />
below.<br />
Tides<br />
Spring tides reach up to about 3.7 m above mean sea level (MSL) in Mozambique. The tidal levels<br />
at locations along the Mozambican coast are given in Table below.<br />
October 2012, p 70
Table 5.9: Tidal levels based on UK Hydrographic Office (2007).<br />
Location<br />
(south to north)<br />
Mean high water spring level<br />
(m to MSL)<br />
Richards Bay 1.1<br />
Maputo 1.5<br />
Inhambane 1.4<br />
Bazaruto 1.9<br />
Beira 2.9<br />
Chinde 1.8<br />
Quelimane 2.1<br />
Maquivale 2.2<br />
Pebane 1.9<br />
Moma 1.4<br />
Port Angoche 1.9<br />
Port Mozambique 1.8<br />
Nacala 3.3<br />
Pemba 3.3<br />
Mocimboa da praia 3.7<br />
Palma 3.2<br />
Wind and wave set-up<br />
Wind set-up is usually a smaller component of combined extreme inshore sea water levels, and<br />
along open coasts it can be insignificant (the amount is dependent on the shape of the coast). It is<br />
also difficult to separate out the wind set-up from the usually more dominant wave set-up and<br />
especially the wave run-up. Various authors do not clearly distinguish between the wind set-up<br />
and other wave related set-ups and some assume that the combined determination/calculation<br />
of wave set-up and wave run-up includes the often smaller component of wind set-up. If specific<br />
additional allowance is made for wind set-up, the combined total set-up tends to be somewhat<br />
over estimated. For these reasons the wind set-up is included in the calculation of wave run-up as<br />
discussed in Section 5.5.3.<br />
Various guidelines are provided in the literature to estimate the amount of wave set-up at the<br />
coast. According to FEMA (2000) the set-up is 10-20% of the breaker wave height. Karsten (2008)<br />
puts the set-up at 20% of the offshore wave height (Hmo). WMO (1988) states that: "As a general<br />
rule of thumb, wave set-up at the coast is about fifteen to twenty per cent of the incident rootmean<br />
square wave height." The wave set-up factor (Ws), which is a function of the wave height,<br />
period and direction, can also be estimated using an approach presented by Goda (2000) for the<br />
following wave period range:<br />
October 2012, p 71
Ws = 0.13 for Tp ≤ 11 s<br />
= 0.15 for 11 s < Tp ≤ 12 s<br />
= 0.16 for Tp > 12 s<br />
Where Tp<br />
= Wave period<br />
Thus, based on these published guidelines and the distribution of wave periods versus wave<br />
heights off Mozambique (Section 5.4), the wave set-up factor is taken as 0.16.<br />
To estimate the increase in the water level as a result of wave set-up, the following relationship is<br />
proposed:<br />
wave set-up<br />
= H’ 0 * Ws<br />
where H’ 0 = “equivalent” unrefracted off-shore significant wave height<br />
Ws<br />
= Wave set-up factor (according to Goda)<br />
For the purposes of this estimation, the “equivalent” unrefracted off-shore significant wave<br />
height (H’ 0 ) is related to the observed off-shore wave height through the following relationship:<br />
H’ 0 = Kr * Hs offshore<br />
where Kr = refraction coefficient<br />
Hs offshore = the off-shore significant wave height<br />
(from e.g. NCEP or cyclone modelling)<br />
The refraction coefficient is mainly a function of wave direction, wave period and the orientation<br />
of the coastline. Simplified refraction coefficients (Kr) for regions around the southern <strong>Africa</strong>n<br />
coast almost all fall within the range of 0.4 to 0.98 (Rossouw pers com). The design wave<br />
conditions off Mozambique have been determined to range from 8.2 m to 9.3 m (Section 5.4.3).<br />
Thus, the “equivalent” unrefracted off-shore significant wave height (H’ 0 ) ranges from<br />
approximately 3.3 m to 9.1 m. By application of Goda’s wave set-up factor, the wave set-up is<br />
therefore estimated to range from approximately 0.5 m to 1.5 m, or about 1 m on average. In<br />
terms of regional differences in the offshore wave climate, as indicated in Section 5.4 and Table<br />
5.6, the largest wave height deviation from the mean (100-year wave condition) is only about 7%.<br />
This would result in only a 7 cm deviation from the average 1 m set-up, which is insignificant, and<br />
therefore means that regional differences in the wave climate can rightfully be neglected (w.r. t.<br />
set-up). The larger differences in wave set-up indicated above (with set-ups ranging from 0.5 m to<br />
1.5 m), are due to local wave exposure/sheltering effects (i.e. the refraction coefficients<br />
mentioned above), but even these differences are 0.5 m or less from the 1 m average set-up.<br />
Differences in the tidal ranges, SLR scenarios and wave run-up (Section 5.5.3) are larger and thus<br />
more significant. More accurate location specific wave set-ups can only be determined by means<br />
of numerical wave modelling requiring detail bathymetry data at each site, which in virtually all<br />
instances are not available. In view of all of these factors, it is deemed acceptable to use the<br />
average wave set-up of 1 m for all the study sites.<br />
October 2012, p 72
Hydrostatic set-up<br />
Raised inshore sea water levels result from the effects of low local atmospheric pressure over the<br />
ocean. The pressure set-up can be estimated by using the inverse barometer approximation,<br />
which translates to an increase of about 1cm for every 1hPa decrease in atmospheric pressure<br />
(Van Ballegooyen, 1996). Annual minimum pressures off the Mozambican coast (due to cyclones)<br />
are in the order of 100 hPa below the average sea level pressure (estimated from the Joint<br />
Typhoon Warning Center data; JTWC, 1997). Thus, the annual maximum hydrostatic set-up along<br />
the Mozambican coast is usually about 1 m. Cyclone occurrence statistics in the Mozambique<br />
offshore region, at present show an occurrence of about 1/3 less in southern Mozambique<br />
relative to central Mozambique (INGC Phase 1, 2009). In Section 5.4.2 the possibility is mentioned<br />
of a southward shift of the cyclone belt due to climate change (see Phase I and <strong>Theme</strong> 8 report).<br />
This would mean a relative increase in the occurrence of cyclones impacting southern<br />
Mozambique’s coastal regions. (Although this is a projected future outcome of climate change<br />
effects, the confidence placed in this projection is low at this stage.) In any case, very strong<br />
cyclones (with very low central pressures) have been recorded along the southern Mozambique<br />
region. For these reasons, it is deemed acceptable to use one value for hydrostatic set-up along<br />
the whole Mozambican coast, with the annual maximum usually being usually about 1 m.<br />
Based on these calculations, the combined wave and “barometric” set-up is estimated to be<br />
about 2 m (respectively 1 m each).<br />
Sea-level rise (SLR)<br />
In Section 5.3 it is concluded that the best estimate (or “central” estimate) of SLR by 2100 is<br />
around 1m, with a plausible worst case scenario of 2m, and a best case scenario (low estimate) of<br />
0.5 m. (The corresponding best estimate (“mid scenario”) projection for 2050 is 0.3 m to 0.5 m.)<br />
5.5.3 Prediction of wave run-up<br />
One of the impacts of sea level rise is that waves will reach further inland than at present which<br />
implies that present coastal development setback lines (of which few exist) have to be adapted. A<br />
coastal development setback line should be a line landward of which fixed structures (e.g.<br />
houses, roads, etc.) may be built with reasonable safety against the physical impacts of the<br />
coastal processes (e.g. sea storms, wave erosion and run-up). Factors which co-determine the<br />
location of setback lines are storm wave run-up elevations and how far the shoreline will retreat<br />
due to erosion, which are in turn affected by the amount of sea level rise that is expected and the<br />
projected increases in storminess. Therefore, realistic scenarios of sea level rise and potential<br />
increases in wave heights were determined, as well as calculations to estimate the resulting<br />
effects on erosion and run-up.<br />
As mentioned, an important step in calculating setback lines (i.e. adequate development setback<br />
distances) is the determination of wave run-up, i.e. the maximum point that storm waves can<br />
reach (Figure 5.3). In a literature review of wave run-up prediction methods, 15 such methods<br />
were considered of which 7 were evaluated in more detail. These were: Battjes (1971); Nielsen &<br />
Hanslow (1991); three formulations by Ahrens and Seelig (2001); two formulations by Ruggiero et<br />
al. (2001); Guza and Thornton (1982); and Stockdon et al. (2006). Of the more empirical<br />
October 2012, p 73
formulations, Nielsen and Hanslow (1991) and Ruggiero et al. (2001) appear to be most suitable;<br />
with the former being easier to apply. The Nielsen and Hanslow (1991) model requires the wave<br />
height and period, beach slope and water level. Their set of formulations was therefore used in<br />
the compilation of a computer routine, which was then verified and tested against an available<br />
set of southern <strong>Africa</strong>n field data. The results are considered surprisingly good (R 2 = 0.79) if the<br />
relatively few parameters included in the formulation are kept in mind. (Most recently a<br />
promising formulation for SA has been proposed by Mather et al. (2011), but this was not<br />
available at the time when the Mozambican modelling was conducted.)<br />
Figure 5.23:<br />
Description of (part of) the Nielsen and Hanslow (1991) coastal wave run-up model<br />
Having found the Nielsen and Hanslow (1991) model to be sufficiently valid and applicable to<br />
local conditions, the same methodology was applied to investigate the impact of SLR on run-up<br />
return periods and occurrences.<br />
To clearly illustrate the large effect that SLR has, a low SLR value is first applied. The mean value<br />
of the IPCC Fourth Assessment Report SLR predictions is about 0.4 m by 2100 (AR4 Report, IPCC<br />
2007). Using this prediction of future sea levels it was found that the same extreme wave run-up<br />
elevations as occurred during the extreme 2007 KZN storm in South <strong>Africa</strong>, would be reached by<br />
waves 10% lower (H m0 ) than those recorded during the peak of the 2007 storm. This means that,<br />
based on the calculated return period of the 2007 storm (and assuming that the statistical<br />
distribution of extreme waves remains about the same over the next 100 years), the return<br />
period for the same extreme run-up heights is effectively halved. In other words, the probability<br />
of such extreme conditions occurring again is basically doubled, or statistically, such situations are<br />
likely to occur about twice as often over the long term for a SLR of only 0.4 m. (Note, that as<br />
discussed in the next paragraph, SLR of 0.4 m is not considered to be a suitable scenario for<br />
planning in this report.)<br />
October 2012, p 74
In Section 5.3 it was concluded that the best estimate (or “central” estimate) of SLR by 2100 is<br />
around 1m (with a plausible worst case scenario of 2m, and a best case scenario (low estimate) of<br />
0.5 m). Therefore, in view of the newer SLR predictions (post IPCC 2007), the effects of a 1 m SLR<br />
(best estimate) on run-up levels were also quantified. It was thus calculated that a wave height of<br />
24% less than the 2007 KZN storm would result in similar run-up elevations if sea level rose by 1<br />
m. The results are alarming, in that the return period of the 2007 event (i.t.o. of high run-up<br />
elevations) would effectively be subject to a six-fold reduction. In other words, the probability of<br />
such extreme events (i.t.o. of high run-up elevations) as those experienced during 2007<br />
happening again would be six times greater, or statistically, such impacts are likely to occur six<br />
times as often in the long run due to SLR of 1 m.<br />
As illustrated above, it is of utmost importance to take seriously the issue of wave run-up when<br />
determining development setback parameters,<br />
5.5.4 <strong>Coastal</strong> erosion due to climate change<br />
Calculation of shoreline erosion due to climate change<br />
Another important issue to predict is how areas that are already vulnerable to erosion may<br />
become more prone to damage in the future due to the effects of climate change. It is well<br />
known that the prime factor leading to damages in the past and increased risk in the future, are<br />
developments located too close to the sea. Thus, there is a need to determine areas of low<br />
vulnerability, which requires prediction of future shoreline locations. Studying the risks due to<br />
climate change in coastal areas will aid design and location of new developments and<br />
infrastructure in low risk areas, and will also help to identify other adaptation options for existing<br />
developments that are at risk.<br />
The Mozambican coastline includes many sandy areas, which mostly have no hard protection<br />
(and where upon cyclone generated waves could impact). This leads to a high potential for<br />
erosion of these sandy coastlines. The most widely known (and applied) formula for estimating<br />
erosion as a result of sea level rise was proposed by Bruun (Bruun, 1988; Figure 5.24). The main<br />
parameters that are taken into account in Bruun’s unsophisticated rule are the amount of sea<br />
level rise and the slope of the nearshore. The accuracy of the absolute results obtained through<br />
use of the Bruun rule can certainly be questioned, but the rule can be applied to give a first<br />
estimate of possible erosion of ’soft’ sandy beaches. In some cases, broad dunes and wide<br />
beaches could mitigate such erosion to some degree. In other situations narrower beaches<br />
backed by hardened dunes will resist erosion resulting in less erosion than predicted by the Bruun<br />
rule.<br />
October 2012, p 75
Figure 5.24:<br />
Schematic illustration of the Bruun model of profile response to rise in sea level showing erosion<br />
of the upper beach and nearshore deposition. (From Davidson-Arnott, 2005).<br />
The Bruun rule is sensitive to the chosen values of the input parameters and the values of these<br />
parameters are also sometimes difficult to determine (Theron 1994; Theiler et al. 2000). Many<br />
other factors besides the amount of sea level rise and the slope of the nearshore need to be<br />
taken into account to accurately predict future coastal evolution on longer time and space scales.<br />
Site specific aspects such as local geology, hydrology and sedimentology, near and offshore<br />
bathymetry, exposure to waves, currents and general climatology, and local geographical<br />
features as well as human influences should all be considered. The Bruun rule remains, however,<br />
generally useful for coasts with little data or information about past morphological change and<br />
can be used as a useful spatial indicator of where future impacts may be a problem.<br />
Effects of climate change on sediment transport<br />
Wave energy is proportional to the square of the wave height (which in itself, in the fully<br />
developed state, is proportional to the square of the wind stress factor). The wave power is<br />
proportional to the wave energy and the wave period. Therefore, with the wave period directly<br />
proportional to the wind stress factor, an increase of only 10% in wind speed can mean as much<br />
as an 80% increase in wave power (Theron, 2007). (In lieu of more comprehensive site specific<br />
sediment transport calculations or modelling, wave power or wave energy can provide a rough<br />
indication of sediment transport potential.) This means that a modest 10% increase in wind speed<br />
could also result in a potential significant increase in coastal sediment transport rates and<br />
consequently impacts to the shoreline. (<strong>Coastal</strong> sediment transport rates are especially sensitive<br />
to changes in wave/storm direction.) The response (increase) of wave height versus wind velocity<br />
increase, and the resultant non-linear (power law) increase in wave energy and even further<br />
accelerated wave power, are illustrated in Figure 5.25.<br />
In lieu of more complex/sophisticated sediment transport and/or beach morphology modelling,<br />
wave energy can be calculated to give an indication of coastal erosion potential. Thus, it can for<br />
October 2012, p 76
example, be determined for the different wave return period conditions (Section 5.4), that the 1-<br />
in-1 and 1-in-50 year waves have respectively about 10 and 20 times the energy of the mean<br />
wave. In other words, the wave erosion potential of 1-in-1 and 1-in-50 year waves is respectively<br />
in the order of 10- of 20 times greater than for the mean condition, which is a significant change.<br />
Since the current coastal geomorphology (of especially the soft coasts) is a direct result of the<br />
long term coastal processes (i.e. the mean condition over time) a change in the wave erosion<br />
potential can significantly alter the coastal configuration.<br />
Figure 5.25:<br />
Example of proportional wave height growth versus wind velocity increase, also indicating<br />
resultant non-linear increase in wave energy and power (Kamphuis model).<br />
5.5.5 <strong>Coastal</strong> Flooding/Inundation and Erosion Model<br />
A conceptual description of the combined coastal flooding/inundation and SLR erosion model<br />
which explains the functional relationships between components of the model is presented in<br />
Figure 5.26 below. (Note, the figure relates to processes related to Climate Change and does not<br />
include any consideration of long term beach erosion and/or short term storm erosion. These are<br />
also important and such allowance is made in the setback line discussion for Beira and Maputo in<br />
Section 5.5.6.)<br />
October 2012, p 77
Figure 5.26: Conceptual description of the combined coastal flooding/inundation and SLR erosion model with<br />
functional relationships between components. (SLR = Sea Level Rise; DEM = Digital Elevation Model)<br />
(Note, the figure relates to Climate Change and excludes other erosion drivers.<br />
These should also be allowed for in setback lines.)<br />
Having determined the inshore wave conditions, the wave run-up and SLR coastal erosion models<br />
(as described in Sections 5.5.2 and 5.5.3) can be employed to quantify specific coastal impacts.<br />
Thus, for example, wave run-up elevations can be calculated at each coastal point along the coast<br />
for various tidal levels combined with different wave heights. Spring high tides (see Section 5.5.2)<br />
occur once every 14 days along the southern and eastern <strong>Africa</strong>n coast and are therefore<br />
selected as a realistic scenario to consider in conjunction with selected sea storms. The same<br />
methods can be employed to predict and assess the conditions and impacts in the future by<br />
including climate change effects, in this case sea level rise and/or increased storminess. The<br />
extreme wave climate off Mozambique has been forecast to increase by about 6% by 2100, as<br />
discussed in Section 5.4, while the best estimate for SLR is 1 m by 2100 (Section 5.5.2).<br />
An example of the calculated amount of wave run-up at each location point along the Beira<br />
shoreline is presented in Figure 5.27. These are the predicted amounts of wave run-up for the<br />
modelled inshore cyclone wave conditions.<br />
October 2012, p 78
Predicted wave runup (m)<br />
1<br />
2<br />
3<br />
4<br />
5<br />
6<br />
7<br />
8<br />
9<br />
10<br />
11<br />
12<br />
13<br />
14<br />
15<br />
16<br />
5<br />
Predicted runup elevations at Beira<br />
for modelled inshore cyclone wave conditions<br />
4<br />
3<br />
2<br />
1<br />
0<br />
Alongshore point number<br />
Figure 5.27:<br />
Example of predicted run-up amounts at Beira<br />
From the figure it can be seen that the wave run-up amounts range from about 1 m to 4 m. The<br />
alongshore variations in predicted run-up heights are mainly related to the differing wave<br />
exposure and slope of each location. (Note, however, that where the beach slopes were found to<br />
be flatter than 0.1, they were taken to be 0.1. This was done for two reasons: (1) It has been<br />
found that the Nielsen and Hanslow model is less reliable for slopes flatter than 0.1, and (2) more<br />
importantly, extreme run-up occurs during storms, which means that the beach profiles are also<br />
subject to erosion at the same time. The effect is that the beach slopes will in fact steepen during<br />
the storm, leading to higher run-up on the steeper profile. Thus, it is assumed that the milder<br />
profile slopes (< 0.1) are likely to be steeper during a storm than at present, which is a<br />
conservative assumption.<br />
Similar run-up predictions were made for Maputo and Pemba (thus incorporating a wide variety<br />
of cyclone wave conditions and shoreline characteristics). It was found that wave run-up amounts<br />
range from about 1 m to 6 m. Taking all three areas into account (and rounding up to the nearest<br />
decimetre), it was found that for most of the input conditions at most of the coastal point<br />
locations, the run-up in fact ranges between about 1.5 m to 3 m. (At first hand this may appear to<br />
be lower run-up amounts than expected, but the wave modelling shows that this is due to the<br />
dampening effect of the wide shallow inshore areas, as found in many parts of Mozambique.)<br />
Appropriate combinations of present and future components of extreme inshore water levels<br />
(including wave run-up) are discussed in detail in Section 5.5.6.<br />
5.5.6 Calculation of potential erosion due to SLR at Beira and Maputo<br />
The focus here is on Maputo and Beira as they are the two major coastal cities in Mozambique<br />
with by far the most extensive infrastructure and development within the coastal zone<br />
potentially subject to climate change impacts. (They are also both major sources of income for<br />
the government and contain the main Mozambican ports.) For each of the two cities, and for<br />
October 2012, p 79
each of the scenarios and input conditions, the SLR coastal erosion model (Section 5.5.4) was also<br />
employed to quantify the potential erosion due solely to SLR. To allow for normal shoreline<br />
variability (e.g. erosion during storms and accretion recovery thereafter) an additional setback<br />
distance of 40 m is added to derive an acceptable total setback distance, as indicated in the last<br />
row of the table.<br />
Detailed and comprehensive investigations are sometimes conducted to better determine<br />
setbacks required for local shoreline variations, but then only for small study areas and where<br />
extensive input data is available. On large scale studies (such as this project), it is not practical or<br />
affordable to conduct many such detailed local setback investigations. The 40 m distance is based<br />
on extensive experience in southern <strong>Africa</strong> and adapted for average Mozambican conditions. This<br />
is also the distance specified in some Australian and US states. An example of the calculated<br />
potential erosion and setback line recommended at each location along the Beira shoreline, is<br />
given in Table 5.10. Some of the results for predicted erosion potential (due to SLR) shown in this<br />
example (Table 5.10) are very low (Points 2451 to 2455). These results are correct however, and<br />
are due to these points being located on non-erodible (rocks or hard structures) and/or very<br />
steeply sloped sections of the Beira coast. Where the coast cannot erode, the high-water line<br />
simply moves directly up and landward with the slope according to the amount of SLR; the Bruun<br />
rule is not applicable at these locations.<br />
Table 5.10:<br />
Example of quantification of erosion potential and erosion setback for SLR<br />
POINT<br />
Sea level rise<br />
(SLR)<br />
(m)<br />
BEIRA - SUMMARY<br />
Erosion due to SLR<br />
(m)<br />
Erosion setback<br />
including SLR (m)<br />
2440 0 0 40<br />
2440 0.5 130 170<br />
2440 1 260 300<br />
2440 2 530 570<br />
2444.5 0 0 40<br />
2444.5 0.5 50 90<br />
2444.5 1 110 150<br />
2444.5 2 120 260<br />
2450 0 0 40<br />
2450 0.5 110 150<br />
2450 1 220 260<br />
2450 2 450 490<br />
2451 to 2455 0 0 40<br />
2451 to 2455 0.5 10 50<br />
2451 to 2455 1 20 60<br />
2451 to 2455 2 30 70<br />
October 2012, p 80
A graphical output of all of these results for each coastal point at Beira is mapped in Figure 5.28.<br />
The total SLR erosion setback thus ranges from 40 m to 570 m depending on the alongshore<br />
location. The alongshore variations in erosion potential (due to SLR) are mainly related to the<br />
differing wave exposure, but especially slope and “erodibility/hardness” of each location. Some of<br />
the potential erosion distances are very large (e.g. around Point 2440). These may be considered<br />
somewhat unrealistic, as it should be remembered that the unsophisticated Bruun rule cannot<br />
take account of changing landward characteristics and processes where potentially large inland<br />
erosion is predicted. (Recent Australian coastal guideline documents provide a modified Bruun<br />
rule methodology which may give smaller erosion distances that might be more realistic, but the<br />
applicability of this method has not yet been verified for Mozambique.) It should also be noted<br />
that application of such methods and all of the results are dependent on the accuracy of the input<br />
data. In particular, detailed topographic data was only available at some towns (and even where<br />
it was available, significant errors were found in some of the data). Thus, elevations, slopes and<br />
landward horizontal distances were calculated or interpolated on this relatively coarse data.<br />
Where the topography is very complex and uneven or large abrupt changes occur in reality, the<br />
results could be affected significantly. This underscores the need for good topographic input data<br />
if more detailed or accurate results are required. The potential setback line for SLR erosion at<br />
Beira, as mapped in Figure 5.27, can only be recommended as a conservative first order estimate<br />
to consider for long-term planning of new development or major redevelopment of the coastal<br />
strip.<br />
N<br />
↑<br />
― Potential erosion due to 2 m SLR by 2100<br />
― Potential erosion due to SLR + 40m setback<br />
― Possible detail terrain adjustment of setback line<br />
Figure 5.28:<br />
Map of potential erosion and recommended setback line for SLR – Beira<br />
The increase in potential erosion over time, due to the increasing SLR, is illustrated in Figure 5.29.<br />
The potential additional impact of a relatively low background erosion trend (which could e.g.<br />
October 2012, p 81
Erosion potential (m)<br />
result from other human impacts) is also illustrated in the figure. Poor coastal zone management<br />
practises (e.g. disruption of sand transport or removal of sand) can easily lead to such or higher<br />
erosion rates. (Note, that such an existing erosion trend has not been observed at Beira.)<br />
180<br />
160<br />
140<br />
Beira:<br />
Potential coastal erosion (m) due to sea level rise (SLR)<br />
(based on "Bruun erosion" rule and coastal parameters at Point # 2444.5),<br />
as well as including additional erosion trend<br />
120<br />
100<br />
80<br />
SLR (1m by 2100) erosion (Bruun)<br />
SLR + other erosion 0.3m/a<br />
Poly. (SLR (1m by 2100) erosion (Bruun))<br />
y = 0.0052x 2 - 20.116x + 19512<br />
R² = 0.9996<br />
60<br />
Poly. (SLR + other erosion 0.3m/a)<br />
40<br />
y = 0.004x 2 - 16.931x + 16444.514<br />
R² = 1.000<br />
20<br />
0<br />
1950 1975 2000 2025 2050 2075 2100<br />
Year<br />
Figure 5.29: Increase in potential erosion over time at Beira, due to the increasing SLR up to 1m by 2100<br />
Taking the example depicted in Figure 5.29 (at Beira location # 2444.5), for the scenario of 1 m<br />
SLR by 2100 and assuming no other (“background”) erosion trends, by 2050 (i.e. in the next ~40<br />
years) some 30 m (more) of the coast at this location may be eroded (compared to perhaps not<br />
more than 10 m of erosion in the past 40 years). (Note, good data on possible historical erosion<br />
trends was not available.) Major problems due to possible historic erosion at Beira have not been<br />
observed. However, coastal erosion due to SLR is likely to become significant in a few decades.<br />
The onset of such coastal erosion should be a “red flag”, triggering a reassessment of the<br />
likelihood of the more extreme SLR scenarios, as the potential impacts (in conjunction with the<br />
impacts of extreme events) will be severe at Beira. Such reassessment should consider all<br />
vulnerable areas along the Mozambican coast.<br />
Following the same procedure as applied for Beira, the potential erosion setback line (due to SLR<br />
effects and shoreline variability) has been determined for Maputo as indicated in Figure 5.30.<br />
October 2012, p 82
N<br />
↑<br />
― Potential erosion due to<br />
2 m SLR by 2100<br />
― Potential erosion due to<br />
SLR + 40m setback<br />
― Possible detail terrain<br />
adjustment of setback line<br />
Figure 5.30:<br />
Map of potential erosion and setback line for SLR - Maputo<br />
The potential erosion and setback lines indicate in the foregoing maps do, however, not explicitly<br />
make allowance for coastal flooding/inundation. The areas subject to extreme flooding events<br />
could in several instances extend significantly further landward than the potential setback lines<br />
indicated in the foregoing maps (despite these being considerable distances in some locations<br />
due to the potential erosion indicated by the Bruun rule). Areas/locations subject to coastal<br />
flooding/inundation should also be an important consideration in identifying vulnerable areas<br />
and in planning coastal developments (and ICZM). For each of the 10 towns / cities the areas that<br />
are vulnerable to coastal flooding/inundation are identified and discussed in detail in Section 6.4.<br />
5.6<br />
To illustrate how the components of the inshore sea water levels have been calculated for each<br />
location, Beira is used as an example in Figure 5.31 below.<br />
October 2012, p 83
Worst case scenario for fully exposed shorelines<br />
Intermediate risk case for partially exposed shorelines<br />
Low risk case for sheltered shorelines<br />
Figure 5.31:<br />
Beira coastal flooding and wave run-up levels.<br />
The figure shows the extreme inshore sea water levels calculated for Beira due to the<br />
combination of the various contributing components. Thus, the figure shows the increasing water<br />
levels all relative to Mean Sea Level (MSL) which is at approximately 0 m elevation, for:<br />
• Mean High Water Spring tide (MHWS, occurring every 14 days) = 2.9 m above MSL<br />
• The crest elevation of existing coastal structures (according to INGC Phase 1,, 2009) = 3.46 m<br />
above MSL.<br />
• Highest Astronomical Tide (HAT, highest level that ordinary tides will reach under average<br />
meteorological conditions, which has a 19 yr cycle) = 3.7 m above MSL<br />
• A cyclone approaching the coast results in an additional local set-up (increase) of the sea<br />
water level due to strong onshore winds (wind-waves) and low barometric pressure. The<br />
combined wave and “barometric” set-up is estimated at an additional 2 m. Thus, at present, a<br />
cyclone approaching Beira during spring tides (which occur every 2 weeks) could result in<br />
flooding levels of about 2.9 m (MHWS) + 2 m (wind & barometric set-up) = 4.9 m above MSL.<br />
October 2012, p 84
• The mid scenario (best estimate) for Sea level Rise (SLR, due to Climate Change) is 1 m by<br />
2100. Thus, the extreme future scenario (2100) for a cyclone occurring during spring tide could<br />
result in flooding levels of about 4.9 m + 1 m (SLR) = 5.9 m above MSL. In lieu of better<br />
extreme water level data, it is recommended that this be taken as the “design” flooding level<br />
for low risk infrastructure (
Worst case scenario for fully exposed shorelines<br />
Intermediate risk case - partially exposed shorelines<br />
Low risk case - sheltered shorelines<br />
Figure 5.32:<br />
Maputo coastal flooding and wave run-up levels<br />
October 2012, p 86
Worst case scenario for fully exposed shorelines<br />
Intermediate risk case - partially exposed shorelines<br />
Low risk case - sheltered shorelines<br />
Figure 5.33:<br />
Pemba coastal flooding and wave run-up levels<br />
October 2012, p 87
The results of the calculated sea water flooding levels of all of the coastal towns are summarised<br />
and compared in Section 6.2.1 (and Figure 6.3), where the implications are also discussed.<br />
From the discussion above it is concluded that:<br />
1. The physical conditions (wave heights, direction and sea water level) that occur at the<br />
coast during a cyclone was determined by the setting up of a cyclone model which was<br />
calibrated using data measured at Beira during Tropical Cyclone Lizette in March 1997.<br />
2. The storm wave conditions that are predicted to prevail offshore of Mozambique were<br />
determined for current conditions and also with expected climate change factors taken<br />
into account. An appropriate technique was used to derive the expected wave height and<br />
wave direction distribution off each of the study sites.<br />
3. Due to the geographical location and local bathymetry at each of study sites, the tide<br />
levels are different. The influence of a rise in sea level on the high tide levels is therefore<br />
also different in different areas along the coast.<br />
4. Using the results of the above studies and calculation of wave run-up heights, the High,<br />
Medium and Low sea water flooding hazard levels for three selected scenarios were<br />
determined.<br />
The values of these parameters are incorporated into the coastal hazard assessment discussed in<br />
Chapter 6.<br />
October 2012, p 88
CHAPTER 6: COASTAL HAZARD ASSESSMENT<br />
6.1<br />
6.1.1 Introduction<br />
In this chapter an overview of hazard assessment along the coast, as well as possible trends<br />
reflected in the regional data is provided. A relatively coarse level of assessment, based on a<br />
comprehensive set of hazard drivers and vulnerability modification factors, is further provided for<br />
the Mozambican coastline. A more detailed level of assessment, focussing on better<br />
quantification of the primary hazards is also given for the selected coastal cities and towns.<br />
6.1.2 Methods of assessing vulnerability of coastal areas and developments<br />
Breetzke et al. (2008), although not providing a vulnerability assessment method per se, contains<br />
information and guidelines on risks and response to coastal erosion that is particularly relevant to<br />
the southern <strong>Africa</strong>n scenario. The coastal vulnerability index (CVI) devised by the US Geological<br />
Survey and founded on six physical variables is found to be useful to assess the vulnerability of<br />
the coastline to climate change (Theiler & Hammar-Klose 2000). These six variables are:<br />
geomorphology; coastal slope; relative sea level change; shoreline erosion/accretion rate; tidal<br />
range; and wave height. Another indicator, the coastal social vulnerability index (CoSVI)<br />
developed by Boruff et al. (2005), is used to determine social-economic vulnerability of coastal<br />
areas to sea level rise (SLR). These indices can also be combined to give an overall vulnerability<br />
index, which appears to be a viable approach to the southern <strong>Africa</strong>n situation. The methods of<br />
Dutrieux et al. (2000) are considered to be more useful for integrated coastal zone management<br />
aimed at sustainability and protection/management of the natural environment, and are<br />
particularly useful for guidance on more detailed vulnerability mapping of smaller areas (e.g.<br />
islands).<br />
The methods recently developed and applied in Portugal and Spain have a practical approach and<br />
are well-suited to the southern <strong>Africa</strong>n and Mozambican context. Jimenez et al. (2009) have<br />
developed good coastal storm vulnerability assessment methods, but the input data<br />
requirements are considered to be too onerous for wide scale application in the <strong>Africa</strong>n context.<br />
Jimenez (2008) provides a good description of how coastal vulnerabilities can be assessed for<br />
multiple hazards.<br />
However from the literature study it was concluded that the set of parameters included in the<br />
method developed by Coelho et al. (2006) would be pragmatic and most relevant for application<br />
to the study area.<br />
6.1.3 <strong>Adaptation</strong> of suitable method for study area<br />
The first part of the Coelho et al. (2006) method is to assess the degree of exposure and<br />
vulnerability to coastal processes using the following nine indicators as the basis: foreshore<br />
elevation; distance (e.g. infrastructure) to shore; tidal range; offshore wave height; historical<br />
October 2012, p 89
erosion / accretion rate; geology (type of rock or sediment); geomorphology (type: e.g. rocky cliff<br />
or river mouth); ground cover (e.g. forest/mangrove or urbanised/industrial); and anthropogenic<br />
actions (e.g. shoreline stabilisation intervention or sediment sources reduction). Specific limit<br />
values associated with each of the indicators are defined and the assessment is done by selecting<br />
the appropriate range of values for each indicator. A vulnerability classification of Very Low<br />
(Vulnerability Score = 1) to Very High (Score = 5) is then derived.<br />
Three additional indicators have been identified here that are relevant to the study area, which<br />
have been added by the authors to the Coelho et al. (2006) assessment methodology:<br />
• Degree of protection from prevailing wave energy (site location, coastline configuration/shape<br />
& orientation, bathymetry). Following a method proposed by Barwell (2011), scoring is done<br />
according to wave exposure as listed below and illustrated in Figure 6.1, in increasing order of<br />
exposure:<br />
o Leeside of large island or extensive spit on opposite side of incident waves (A);<br />
o Leeside of headland, rocky point or peninsula (A);<br />
o Partially sheltered from deep-sea wave energy (B);<br />
o Directly exposed to waves only slightly refracted from deep-sea (C); and<br />
o Directly exposed to storm wave attack, with narrow surf zone (D).<br />
(Wide areas of dense mangroves can also provide some wave protection, but this factor is already<br />
accounted for in the “ground cover” indicator mentioned before.) Additionally, if sites are located<br />
close to a river/estuary mouth, the vulnerability is scored more severely due to the risk of mouth<br />
meandering for example. This indicator therefore explicitly accounts for the differing vulnerability<br />
to incident storm waves due to location (and other wave modification factors), ranging from fully<br />
exposed open coast sites to well sheltered locations, for example within bays or on the leeside of<br />
headlands.<br />
• Sea level rise erosion potential (“Bruun” factor i.t.o. inshore slope; see Section 5.5.4). Sea<br />
level rise is likely to result in flooding/inundation and coastal erosion. However,<br />
flooding/inundation vulnerability is already accounted for in the elevation and distance to<br />
shore. Thus, only the Bruun erosion potential needs to be assessed: for a specific amount of<br />
sea level rise, the erosion is directly related to inshore slope. (Alternatively, the parameter to<br />
quantify could be taken as distance to the 10, 15 or 20 m depth contour; the choice depends<br />
on the “active” nearshore profile depth);<br />
• Relative height (ideally volume) of the protective foredune buffer (i.e. the available sand<br />
reservoir). The importance of the foredune buffer as a natural coastal defense mechanism is<br />
discussed in Barwell (2011).<br />
October 2012, p 90
Figure 6.1: Degree of<br />
protection/exposure from<br />
prevailing wave energy (A –<br />
most protected, D – most<br />
exposed)<br />
In the tropics (i.e. Mozambique) two important additional indicators have been included by the<br />
authors: cyclones (e.g. occurrence per annum); and protective corals/fringing reefs (alongshore<br />
extent as % of total shoreline length). (Potential additional factors that could be considered in<br />
future are: characteristics of the winds (velocities above 12 km/h, that dominate during the dry<br />
season with an onshore component more than 20% of the time); pressures from human activities<br />
(to dunes/vegetation); and existing cross-shore beach width (e.g. to accommodate storm erosion<br />
or long-term trend).)<br />
Nevertheless, it is important to keep in mind which data are readily available to quantify a specific<br />
factor. “Double accounting” must also be avoided, e.g. distance and elevation already account for<br />
slope on land, so if distance and elevation are assessed, slope on land should not also be added as<br />
a factor. Seaward slope is, however, independent of on-land slope and is used specifically to<br />
assess vulnerability to erosion due to SLR.<br />
Almost all of the 14 indicators included in Table 6.1 can be assessed directly, based on the<br />
available input data. Some of the indicators require further interpretation or analysis of the input<br />
data to properly assess the vulnerability.<br />
October 2012, p 91
Erosion /accretion (# 5 in Table 6.1) is one of the most difficult indicators to quantify if historic<br />
data is not available, as was the case for virtually all areas of the Mozambican coast. Assessment<br />
of erosion (or accretion) was therefore assessed from remote sensing (satellite images with semiautomated<br />
change detection). The technique of using remote sensing to assess change is<br />
described in Appendix 1. Four study areas were identified for the satellite remote sensing<br />
assessment, namely Maputo, Maxixe, Vilanculos and Beira. Three change detection methods<br />
were assessed at the Maputo (Object-Oriented Image Analysis, Change Vector Analysis and<br />
Spectral Change Analysis) site while two were used for the Maxixe, Vilanculos, and Beira sites<br />
(Change Vector Analysis and Spectral Change Analysis).<br />
As discussed in Appendix 1, the results show that the Change Vector and Spectral Change<br />
Analyses report consistent results while the Object-Oriented Image Analysis returned inconsistent<br />
results. All three image analysis procedures were affected by tides which made differentiating<br />
between ocean, beach and shallow water very difficult. This resulted in commission and omission<br />
type errors depending on the nature of the tides and the imagery used. Spatial resolution also<br />
played a role in the quality of the results with a ±60 metre accuracy deemed too inaccurate. The<br />
study concluded that in the future high resolution satellite imagery or digital aerial photography<br />
or laser scanning (e.g. LIDAR) should be used to assess coastal stability. If suitable pre 1980’s<br />
coastal aerial photography can be sourced, this could be useful to quantify historic shoreline<br />
changes over a longer period.<br />
To complement the remote sensing technique, use was made of Google Earth images for<br />
orientation, aerial observations (during the low altitude coastal flight inspection in May 2010) and<br />
in-situ ground inspections.<br />
At Beira, for example, the remote sensing coarse resolution images do not show significant<br />
erosion trends within the main city area. Noticeable changes are due to construction, while the<br />
other noticeable changes are observed in the naturally dynamic mangrove/sand/mud-bank areas.<br />
The Beira aerial observations and in-situ investigation found no obvious indicators of significant<br />
erosion (e.g. scarps, many trees undercut, etc.); also old (more than three decades) structures are<br />
found quite near the high-water line as well as old surviving groynes. The conclusion is thus that<br />
there is no large erosion trend at Beira. (Possible erosion since the 1950’s could be in the order of<br />
10 m in total.)<br />
The other coastal sites were assessed in the same manner. In all instances more emphasis was<br />
placed on the application of coastal engineering experience during the flight observations and<br />
site inspections, rather than on the generally somewhat inconclusive remote sensing information.<br />
In summary, a total of 14 vulnerability indicators have been determined as appropriate and<br />
applicable for the Mozambican coast (also in terms of the input data/information required). The<br />
14 vulnerability indicators, the specific limit values associated with each of the indicators and the<br />
vulnerability classification ranges, are summarised in Table 6.1.<br />
October 2012, p 92
Table 6.1:<br />
Vulnerability indicators, limit values for each indicator and vulnerability classification ranges applied for Mozambican coastal vulnerability assessment.<br />
#<br />
Vulnerability Classification & Score<br />
Vulnerability Criteria<br />
VL L M H VH<br />
1 2 3 4 5<br />
1 TE: Elevation (m) >30 21 - 30 11 -20 6 -10 1000 200 - 1000 50 -200 20 -50 0<br />
(accretion)<br />
-1 to 0 -3 to -1 -5 to -3 < -5<br />
(erosion)<br />
6 GL: Geology Hard rocks (Magmatic) “Medium” hardness rocks<br />
(Metamorphic)<br />
Soft rocks (Sedimentary) Non-consolidated coarse<br />
sediment<br />
Non-consolidated fine<br />
sediments<br />
7 GM: Geomorphology Mountains Rocky cliffs Erosive cliffs, Sheltered Exposed beaches,<br />
Dunes, river mouths,<br />
8 GC: Ground Cover Forest/<br />
Mangroves<br />
9 AA: Anthropogenic Actions Shoreline stabilisation<br />
intervention<br />
10 Degree of protection from<br />
prevailing wave energy<br />
Leeside of large island or<br />
extensive spit on opposite<br />
side of wave incident<br />
waves<br />
Ground<br />
Vegetation, cultivated<br />
ground<br />
Intervention without<br />
sediment sources reduction<br />
Leeside of headland, rocky<br />
point or peninsula<br />
beaches<br />
Flats<br />
estuaries<br />
Non-covered Rural urbanised Urbanised or industrial<br />
Intervention with<br />
sediment sources<br />
reduction<br />
Partially sheltered from<br />
deep-sea wave energy<br />
Without intervention or<br />
sediment sources<br />
reduction<br />
Directly exposed to waves<br />
only slightly refracted<br />
from deep-sea<br />
Without intervention but<br />
with sediment sources<br />
reduction<br />
Directly exposed to storm<br />
wave attack, with narrow<br />
surf zone<br />
11 Cyclones (occurrence/a) 0 >0 2-3 >3<br />
12 Sea-level rise Bruun erosion<br />
0.005<br />
potential (inshore slope)<br />
13 Corals/fringing reefs (alongshore<br />
80<br />
extent as % of total length)<br />
14 Relative height (m) of the<br />
protective foredune buffer<br />
>20 10-20 5-10 0.5-5
A conceptual description of a coastal hazard/risk model (based on the foregoing), which explains<br />
the functional relationships between components of the model, is presented in Figure 6.2. The<br />
“<strong>Coastal</strong> Hazard Assessment Model” approach could basically be described as an expert analysis<br />
of functional responses (linked to process-based modelling).<br />
Figure 6.2:<br />
Conceptual description of the coastal hazard/risk evaluation model with functional relationships<br />
between components.<br />
Having developed a suitable assessment method to identify hazardous coastal areas, each<br />
particular hazard can then be investigated further to quantify the risk of occurrence or to<br />
determine which locations within an area are at risk from a specific event.<br />
October 2012, p 94
6.2<br />
One of the most important vulnerability indicators and considerations in planning coastal<br />
developments, ICZM and determining adaptation measures is the elevation (thus also location) of<br />
coastal areas in relation to sea water flooding levels. Thus, available data related to these aspects<br />
are quantified and assessed in detail for each coastal town.<br />
6.2.1 Sea water flooding hazard levels<br />
Following on from the discussion in Section 5.6, three flooding scenarios were defined to<br />
establish the hazard levels at the specific sites in terms of possible flooding due to the various<br />
factors associated with ‘normal’ meteorological factors as described in Figure 6.3. In addition to<br />
these factors, the effects of climate change are taken into consideration. The flooding scenarios<br />
shown in Figure 6.3 are:<br />
• LOW vulnerability areas, relatively sheltered from direct wave impact => mean high-water<br />
spring (MHWS) + wind, wave and atmospheric set up (a total of 2 m) + 1m SLR (best estimate<br />
of SLR by 2100). This low flooding level is appropriate for planning and management of<br />
infrastructure along sheltered shoreline locations, with a design life of less than 50 years.<br />
• MEDIUM vulnerability areas, semi-exposed to direct wave impact => MHWS + wind, wave and<br />
atmospheric set up (2 m) + 1m SLR + 1.5 m run-up (moderate run-up height). This intermediate<br />
flooding level is appropriate for planning and management of infrastructure along the semiexposed<br />
locations, with a design life of less than 50 years.<br />
• HIGH vulnerability areas, fully exposed to direct wave impact => MHWS + wind, wave and<br />
atmospheric set up (2 m) + 2m SLR (probable maximum SLR by 2100) + 3 m run-up (estimated<br />
run-up for relatively severe storm) This high flooding level is appropriate for important<br />
infrastructure with a design life of more than 50 years (such as ports and airports) along the<br />
exposed locations. (For “greenfield” or undeveloped areas, a more conservative allowance of<br />
2 m SLR is also preferable.)<br />
October 2012, p 95
Figure 6.3:<br />
<strong>Coastal</strong> flooding levels for 11 towns/cities<br />
These three flooding level scenarios were calculated for each of the study towns and cities as<br />
depicted in the figure (the 3 bars for each town). It can be seen that for most of the towns and<br />
cities the LOW flooding scenario (sheltered locations), ranges from 4.4 to 6.3 m MSL, on average<br />
at about the +5 m MSL level, here defined as the “high hazard level”. Thus, virtually all areas<br />
(from sheltered to exposed locations) below the 5 m contour will already be at risk, even for the<br />
LOW flooding scenario. The MEDIUM flooding levels (applicable along semi-exposed locations)<br />
range from +5.9 m to +7.8 m MSL. Thus, areas located above the +8 m MSL contour, (rounded up<br />
from 7.8 m) defined as the “intermediate hazard level” (Figure 6.3), will in virtually all instances<br />
have a low risk in terms of the MEDIUM flooding scenario (applicable along semi-exposed<br />
locations).<br />
Almost all of the HIGH flooding scenarios, being the worst case scenario for exposed locations, lie<br />
below the 10 m MSL elevation (the values range from 6.1 to 10.3 m MSL), depicted as the “low<br />
hazard level” in Figure 6.3. INGC promotes a pro-active approach (‘prevention is better than<br />
cure’), implementing the ‘precautionary principle’ when locating and designing national key point<br />
infrastructure (e.g. national roads, railways, petroleum / oil pipelines and storage, ports and<br />
airport infrastructure, etc.). It is for this reason that it is recommended that such highly important<br />
and costly infrastructure generally be designed to be located at or above the +10 m MSL level<br />
(Low hazard) along exposed shorelines. ‘Normal’ municipal and other infrastructure should<br />
generally be located above the +9 m MSL level along exposed locations. Along semi-exposed<br />
shorelines it is recommended that the critical infrastructure generally be designed to be located<br />
at or above the +8.5 m MSL level, while ‘normal’ infrastructure should generally be located above<br />
the +7.5 m MSL level along semi-exposed shorelines. Note, that the actual wave exposure/shelter<br />
October 2012, p 96
of each shoreline location is duly considered in the detail recommended adaptation options<br />
(including “design” levels/elevations) for each site (Chapter 8). It is to facilitate easy assessment<br />
and comparison of vulnerable areas, that just three contour lines (5, 8 and 10 m MSL) derived<br />
from satellite imagery and roughly associated with three generalised flooding scenarios are<br />
indicated for each city/town, as discussed in the following section.<br />
6.2.2 Elevation hazard<br />
Using satellite imagery (SRTMv4.1 (90m resolution) and ASTER (30m resolution), but mostly the<br />
SRTM because, for example, it has better algorithms to detect the land and sea interface), and<br />
(limited) local available topographical data, the positions of the contour lines roughly associated<br />
with the three sea water flooding hazard levels were estimated and superimposed onto Google<br />
Earth images at each coastal town and city. This allowed for a 1 st level identification of the<br />
vulnerability of the coastline of Mozambique (Vulnerability parameter # 1 in Table 6.1) and<br />
assessment of specifically the current development and infrastructure at each study area<br />
(Example for Maputo shown in Figures 6.4a, b and c).<br />
It is reiterated that such results are dependent on the accuracy of the input data, which again<br />
underscores the need for good topographic and bathymetric input data if more detailed or<br />
accurate results are required. (In other words, the contours are not based on accurate<br />
topographical data, and therefore can only give a rough indication of where the accurate contour<br />
location is in reality.) It should also be noted, that although the above generalised<br />
LOW/MEDIUM/HIGH scenarios are derived from the correct theoretical flooding levels for the<br />
different combinations of events, the actual landward extent of the flooded areas would not<br />
reach all the way to the +8 m or + 10 m contours in many locations, as “on-land” factors such as<br />
the roughness (due to buildings, trees, etc.) will reduce the actual landward extent of the flooded<br />
area. (This is not accounted for in most run-up models, including the Nielsen & Hanslow model<br />
applied in this project.) In lieu of detailed three-dimensional wave run-up and landward flooding<br />
modelling the estimated contour locations give a good but somewhat conservative (i.e. of lower<br />
risk) indication of the potential extent of flooded areas. These comments are applicable to all of<br />
the study areas.<br />
In Figure 6.4a it can be seen that much of the existing port and adjacent developed areas are<br />
located below the estimated + 5 m contour position. Along the sheltered and semi-exposed<br />
Maputo shoreline depicted in Figure 6.4a, the safe level for important national infrastructure that<br />
is expected to be in operation up to and after the year 2100 is considered to be +8.5 m MSL.<br />
The Costa de Sol and Matola areas are depicted in Figures 6.4 b and c. Note that by their nature<br />
ports are located as close to the water as possible and therefore often in lowlying areas. By<br />
recommending that ports, as national key infrastructure facilities and with design lifespans<br />
extending from 50 to 100 years, be located above the +8.5 m MSL level in Maputo and +10.0 m<br />
MSL in Beira, means that, for example the design of the foundation structure and layout should<br />
allow for the future heightening of the quays, warfs and adjacent infrastructure.<br />
October 2012, p 97
Figure 6.4a:<br />
Estimated contours for Maputo<br />
c<br />
Figure 6.4b:<br />
Estimated contours for Maputo – Costa de Sol<br />
October 2012, p 98
Much of the area near Costa de Sol (formerly wetland and some mangroves) is very low lying and<br />
already at considerable risk from coastal flooding (should for example a cyclone approach this<br />
area), as it is also exposed to wave run-up effects.<br />
Figure 6.4c:<br />
Estimated contours for Maputo / Matola<br />
In Figure 6.4c it can be seen that the main access roads and toll road structures (and some<br />
developed areas) are located below the + 5 m contour, while +7 m MSL is considered as the low<br />
risk level for important national infrastructure (and a main evacuation/“escape” routes in this<br />
instance) in this relatively sheltered area under the scenario of 1m SLR by 2100.<br />
Elevation hazard at the rest of the study sites<br />
Figure 6.5 shows a Google Earth TM image of Beira with the satellite derived estimated positions of<br />
the + 5 m,+ 8 m and +10 m contours (to MSL) overlain thereon. From the above points, it can be<br />
seen that all areas below the + 5 m contour are already vulnerable to flooding alone resulting<br />
from a cyclone coinciding with mean high water spring tides (4.9 m to MSL) as depicted in Figure<br />
6.3. This excludes the additional elevation that could be reached due to wave run-up along the<br />
semi-exposed and exposed shoreline locations.<br />
The minimum future elevation to plan for would be about 8 m above MSL (excluding any<br />
adaptation measures), which would allow for a combination of a cyclone coinciding with mean<br />
high water spring tides (4.9 m MSL), plus 1 m SLR, plus wave runup of 1.5 m. This is applicable to<br />
October 2012, p 99
almost the whole Beira shoreline, as most locations are either fully exposed (all “south” facing<br />
shorelines), or semi-exposed (western shoreline during cyclone waves approaching obliquely<br />
from the south-south-west)<br />
Ideally, for critical infrastructure, the future elevation to plan for, would be 10 m above MSL<br />
(excluding any adaptation measures), which would allow for 2 m SLR and a wave runup of 3 m<br />
along the exposed SW, S and SE shorelines.<br />
By implication, the map shows that most of Beira is already at extreme flooding risk and that only<br />
the high area a few km inland (to the North) would really be at a low riskin future. (Note, this is<br />
flooding due to high seawater levels, and not related to river floods resulting from extreme<br />
rainfall events.) Where possible, new developments should be located above the 8 m level and<br />
ideally, for critical infrastructure, above the 10 m level, again, in the absence of any adaptation<br />
measures.<br />
Figure 6.5:<br />
Estimated contours for Beira<br />
Figures 6.6 to 6.16 show the results for the rest of the study sites.<br />
October 2012, p 100
Figure 6.6:<br />
Estimated contours for Ponto Do Ouro<br />
Ponto Do Ouro is fully exposed to ocean waves, but high tides are lower than most of the<br />
Mozambican coast. The intermediate flooding level is +5.9 m MSL, while the extreme flooding<br />
scenario is +8.4 m MSL.<br />
Figure 6.7:<br />
Estimated contours for Xai-Xai Beach<br />
October 2012, p 101
Xai-Xai Beach is also fully exposed with relatively lower tides, giving rise to flooding levels of +5.9<br />
m MSL and +8.4 m MSL for the intermediate and extreme flooding scenarios respectively. (The<br />
Xai-Xai town centre is located about 10 km inland from the shore, in a north-westerly direction<br />
from the coastal area shown in Figure 6.7. Therefore the town itself is not vulnerable to hazards<br />
from the sea, other than cyclone winds and possibly flooding from rainfall.)<br />
+10 m MSL<br />
+ 8 m MSL<br />
+ 5 m MSL<br />
Figure 6.8:<br />
Estimated contours for Tofo / Barra (overlain on Google Earth image)<br />
Most of the Tofo area is fully exposed (Figure 6.8). The northern shore at Barra is generally less<br />
exposed to wave action, but this area is directly exposed to cyclone waves approaching from the<br />
NE. Thus, flooding levels of +6.4 m MSL and +8.9 m MSL are applicable for the intermediate and<br />
extreme flooding scenarios respectively. The coastal topography is relatively steep with high<br />
ground relatively close to the sea, expect for two extensive low-lying wetland areas which are<br />
susceptible to flooding from the sea.<br />
October 2012, p 102
Figure 6.9:<br />
Estimated contours for Maxixe; Inhambane<br />
The Maxixe and Inhambane shorelines are only semi-exposed to cyclone waves (approaching<br />
from the NE). Thus, wave run-up is not expected to exceed about 1.5 m. The intermediate<br />
flooding hazard level of +5.9 m MSL is mostly applicable. Critical infrastructure (100 year planning<br />
horizon) should only allow for an additional 1 m of SLR (i.e. 2 m SLR in total) by 2100, thus giving a<br />
“design” level of +6.9 m MSL.<br />
October 2012, p 103
Figure 6.10:<br />
Estimated contours for Vilankulos<br />
Despite some shallow sandbanks and a small island to the east, Vilankulos is relatively exposed<br />
(to cyclones from the east), with flooding levels of 6.4 m and 8.9 m MSL for intermediate and<br />
extreme flooding scenarios respectively.<br />
Figure 6.11:<br />
Estimated contours for Quelimane<br />
October 2012, p 104
Quelimane is located inland and is not exposed to wave effects. From a coastal/marine flooding<br />
perspective alone (i.e. not considering river floods), the intermediate flooding level is the same as<br />
the low flooding level at +5.1 m MSL. Only critical infrastructure need consider the extreme<br />
scenario of 2 m SLR by 2100, thus giving a flooding level of +6.1 m MSL.<br />
Figure 6.12:<br />
Estimated contours for Ilha De Mozambique<br />
While Ilha De Mozambique is semi protected by some islands, it is exposed to specific cyclone<br />
wave approach directions. This island is very narrow, and flood wash-over from the seaward side<br />
is possible in the low lying areas during extreme events. Thus, flooding levels of 6.3 m and 8.8 m<br />
MSL for intermediate and extreme flooding scenarios are respectively applicable to the whole<br />
island.<br />
October 2012, p 105
Figure 6.13:<br />
Estimated contours for Nacala port area<br />
Figure 6.14:<br />
Estimated contours for Nacala bay area<br />
Most of the Nacala and Minguri shoreline is relatively well sheltered from the open sea (Figure<br />
6.14). Only very limited ocean wave penetration into the bay is possible from the north, while<br />
only moderate local wave generation inside the bay is possible due to the limited fetch (e.g.<br />
resulting from cyclone winds over the bay). The “sea water flooding hazard” levels for the bay<br />
October 2012, p 106
shorelines of Nacala and Minguri (Figure 6.14) show that for a 1m sea level rise (by 2100) plus<br />
spring high tides and limited local raising of water levels (through barometrics and wind), that<br />
areas below the +6.3 m contour will be in danger of being flooded. The intermediate flooding<br />
level of +6.5 m MSL (rounded up from +6.3 m MSL) is appropriate for planning and management<br />
of infrastructure along the bay shoreline with a design life of less than 50 years. Taking a<br />
conservative and precautionary approach, the extreme scenario of 2 m SLR by 2100 should be<br />
considered for critical infrastructure. Thus, the safe hazard level for important infrastructure<br />
inside the bay such as the port (Figure 6.13) and airport with a design life of more than 50 years is<br />
+7.5 m MSL. As for Maputo and Beira ports, this recommendation should not be interpreted as<br />
meaning that the port should be relocated to landward of the +7.5 m MSL contour lines, which<br />
would render it inoperable. The recommendation is for the Nacala port infrastructure to be<br />
upgraded to deal with CC risks in its present location, including raising the infrastructure in stages,<br />
eventually to above the level of +7.5 m MSL in this case.<br />
Only the shoreline outside of the bay (to the north of Fernao Veloso, Figure 6.14) is relatively<br />
exposed to cyclone waves approaching from the north-east or north. Here, the intermediate<br />
flooding level of +8 m MSL is appropriate for planning and management of infrastructure with a<br />
design life of less than 50 years (allowing for the scenario of a +1 m sea level rise along with a 1.5<br />
m storm run-up level during cyclones).<br />
Figure 6.15:<br />
Estimated contours for Pemba<br />
October 2012, p 107
Informal settlements<br />
Figure 6.16:<br />
Estimated contours for Pemba port area<br />
The eastern and northern shores of Pemba outside of the bay (Figure 6.15) are exposed to<br />
cyclone waves approaching from the north-east or north. Along these more exposed shores<br />
outside of Pemba Bay, the intermediate safety hazard level of +9 m MSL is appropriate for<br />
planning and management of infrastructure with a design life of less than 50 years (allowing for<br />
the scenario of a +1 m sea level rise along with a 3 m storm run-up level during cyclones.)<br />
On first impression it may seem that the Bay shoreline is well sheltered from wave action.<br />
However, of importance is that, due to the large expanse of water in Pemba Bay (i.e. relatively<br />
large wind fetch), the Pemba peninsula provides only partial protection from cyclonic forces<br />
(waves and sea water flooding) when a cyclone moves inland across Pemba. This has implications<br />
for the design of coastal protection around the port and the shoreline around the whole bay in<br />
that significant local water level set-ups and local wave run-up can occur. The informal<br />
settlements in the Porto Amelia area (Figure 6.16) are very low-lying, much of it located between<br />
the normal high tide line and less than 5 m above MSL. This area is particularly vulnerable to<br />
flooding from the sea. The “sea water flooding hazard” levels for locations inside Pemba Bay<br />
(Figure 6.15) show that for a 1m sea level rise (by 2100) plus a run-up of +1.5 m during cyclonic<br />
events, that areas below the +8 m contour will be in danger of being flooded. This intermediate<br />
flooding level of +8 m MSL is appropriate for planning and management of infrastructure along<br />
the bay shoreline with a design life of less than 50 years. However, taking a conservative and<br />
precautionary approach, the extreme scenario of 2 m SLR by 2100 should be considered. Thus,<br />
the safe hazard level for important infrastructure inside the bay with a design life of more than 50<br />
years such as the port is +9 m MSL (Figure 6.16).<br />
October 2012, p 108
Conclusion on the elevation hazard<br />
The overall conclusion is that the Mozambican coastal zone has much low-lying infrastructure.<br />
This poses a major risk because of expected climate change impacts. The question may be raised<br />
whether the risk of damage to key coastal areas suddenly increases above a certain sea level?<br />
Based on the assessment of the drivers, hazards and impacts (Chapter 5), it is expected that there<br />
will be a progressive increase in risk, but no specific tipping point. However, the consequences of<br />
the impacts are expected to increase exponentially. The situation is serious, but not impossible to<br />
correct if action is taken timeously (the sooner the better), as discussed in Chapters 7 and 8.<br />
It is reiterated that the results in terms of the maps indicating potential flooded areas, are<br />
dependent on the accuracy of the input data, which underscores the need for good topographic<br />
input data if more detailed or accurate results are required. It should also be noted, that although<br />
the flooding scenarios are derived from the correct theoretical flooding levels for the different<br />
combinations of events, the actual landward extent of the flooded areas would not reach all the<br />
way to the derived levels in many locations, as “on-land” factors such as the roughness (due to<br />
buildings, trees, etc.) will reduce the actual landward extent of the flooded area. In lieu of<br />
detailed three-dimensional wave run-up and landward flooding modelling the estimated contour<br />
locations give a good but somewhat conservative (i.e. of lower risk) indication of the potential<br />
extent of flooded areas.<br />
October 2012, p 109
6.3<br />
A relatively coarse level of assessment, based on a sub-set of hazard drivers and vulnerability<br />
modification factors, is provided for the entire Mozambican coastline. Nine of the 14 hazard<br />
drivers and vulnerability modification factors were selected from the ideal set of 14 indicators<br />
identified in Section 6.1.2, due to the fact that data could only be obtained on a country wide<br />
basis for the the particular nine parameters. Despite this shortcoming, the coarse hazard<br />
assessment is still useful in comparing vulnerability on a more regional level, and does give a<br />
coarse indication of how some important hazards are spatially distributed. (The full set of 14<br />
parameters/indicators was used in the detail assessments described in Section 6.4.)<br />
Spatial data were collated and incorporated in the following nine GIS layers:<br />
• Topographic elevation<br />
• Distance to urban infrastructure<br />
• Geology<br />
• Geomorphology<br />
• Land cover<br />
• Tidal range<br />
• Maximum offshore wave height (NCEP)<br />
• Erosion – accretion<br />
• Cyclone (occurrence inversely weighted by distance from shore)<br />
Examples of the coarse spatial input data and derived hazard/vulnerability classification mapping<br />
for most of these parameters are given below.<br />
An overview of the baseline typology mapping of Mozambican geology<br />
(http://139.191.1.96/projects/soter/index.htm (Souirji, 1997) is presented in Figure 6.17.<br />
October 2012, p 110
Figure 6.17:<br />
Baseline typology mapping of Mozambican geology<br />
October 2012, p 111
The type of geology of the coastal areas (i.t.o. rock hardness or sediment coarseness), gives a<br />
good indication of underlying resistance to coastal erosion or “erodability”. A map of the<br />
resultant geologic vulnerability classification from 1 (very low vulnerability) to 5 (very high<br />
vulnerability) is indicated in Figure 6.18.<br />
Figure 6.18:<br />
Vulnerability mapping based on geologic classification<br />
October 2012, p 112
An overview of the baseline typology mapping of Mozambican geomorphology is presented in<br />
Figure 6.19.<br />
Figure 6.19:<br />
Baseline typology mapping of Mozambican geomorphology<br />
October 2012, p 113
The geomorphologic characteristics of the coastal areas (e.g. rocky cliffs or exposed beaches),<br />
similarly give a good indication of underlying resistance to coastal erosion or “erodability”. A map<br />
of the resultant geomorphologic vulnerability classification from 1 (very low vulnerability) to 5<br />
(very high vulnerability) is indicated in Figure 6.20.<br />
Figure 6.20:<br />
Vulnerability mapping based on geomorphologic classification<br />
October 2012, p 114
A coarse overview of hazards and vulnerability of Mozambican coast is summarised in Figure<br />
6.21, in terms of tidal range, offshore wave height, cyclone threat (i.t.o. occurrence, category and<br />
inversely weighted by distance from shore), and elevation vulnerability.<br />
Figure 6.21:<br />
Coarse overview of hazards and vulnerability of Mozambican coast<br />
Conclusion on the hazard and vulnerability of the whole coastline<br />
Broadly speaking, the low lying central delta coast areas (e.g. Beira) are very vulnerable in terms<br />
of elevation. The highest occurrence of cyclones (very high hazard) is found along the central<br />
parts of Mozambique, tapering off to the south (from roughly Tofo) and also sharply to the north<br />
(from about Ilha de Mocambique). In terms of wave height, based on the NCEP data and<br />
excluding cyclones, the hazard increases slightly from north to south, with most of the coast<br />
subject to moderate offshore wave attack. Due to the particular bathymetry off Mozambique and<br />
(amongst others) the location of tidal nodes, the northern coast (e.g. Nacala and Pemba) as well<br />
as parts of the central coast (e.g. Beira) face the highest tidal hazard ( note that the hazard here is<br />
still rated as moderate relative to coastlines in some other parts of the world where tidal<br />
extremes are much higher).<br />
Although the coarse hazard assessment is useful in comparing vulnerability on a more regional<br />
level, and does give a coarse indication of how some important hazards are spatially distributed, a<br />
much more detailed assessment is required to identify appropriate adaptation measures at the<br />
local level, as described in Section 6.4.<br />
October 2012, p 115
6.4<br />
6.4.1 Application of the <strong>Coastal</strong> Hazard Assessment Method<br />
A relatively coarse level of assessment for the Mozambican coastline, is provided in the previous<br />
section. A more detailed level of assessment, based on a comprehensive set of hazard drivers and<br />
vulnerability modification factors, and focussing on better quantification of the primary hazards is<br />
also given for selected areas. The focus is on the abiotic physical coastal aspects which include<br />
factors linked to climate change.<br />
<strong>Coastal</strong> points were defined along the whole Mozambican coast at 1 km intervals as indicated in<br />
the Maputo example area in Figure 6.22 below. The results of all the coastal risk assessments<br />
were determined at each of about 10 points (i.e. 10 km) at each of the study sites.<br />
Figure 6.22:<br />
Maputo example - Location of <strong>Coastal</strong> Points (1 km intervals)<br />
October 2012, p 116
Based on the coastal hazard/risk evaluation method as described in Section 6.1, a coastal<br />
vulnerability assessment was conducted for each of the study sites. Data were obtained or<br />
derived for each of the 14 parameters at each of the coastal points. Important inputs were<br />
gleaned from low elevation aerial reconnaissance of the entire Mozambican coast (May 2010)<br />
and complemented by a site investigation of 10 sites.<br />
These observations and inspections were conducted to assess local coastal processes, site<br />
characteristics, coastal vulnerability, existing protection/adaptation methods and were used to<br />
derive appropriate response options. Other inputs were collated from remote sensing data and<br />
GIS layers and information made available through the Mozambican colleagues on the project<br />
team.<br />
The input data values were then scored according to the vulnerability classification for each<br />
parameter as defined in Table 6.1. An example of the scoring for the Ponto Do Ouro study area<br />
for Scenario A1, for example, is show in Table 6.2.The individual scores were then added and<br />
normalised to calculate the overall vulnerability score or rating for each coastal point.<br />
Table 6.2 :<br />
Indicator<br />
Example of vulnerability scoring (1 to 5 - very high) for Ponto Do Ouro<br />
Location: Ponto Do Ouro & Shoreline location reference<br />
number<br />
4237 4236 4235 4234 4233 4232 4231 4230 4229<br />
#1: TE: Elevation 3 3 4 5 4 4 4 4 4<br />
#2: DS: Distance (e.g. infrastructure) to 1 2 3 4 3 3 3 3 1<br />
shore<br />
#3: TR: Tidal range 3 3 3 3 3 3 3 3 3<br />
#4: WH: Max wave height 5 5 5 5 5 5 5 5 5<br />
#5: EA: Erosion / accretion rate 2 2 2 2 2 2 2 2 2<br />
#6: GL: Geology 5 5 5 5 5 5 5 5 5<br />
#7: GM: Geomorphology 5 5 4 4 4 4 4 4 4<br />
#8: GC: Ground Cover 1 1 5 5 4 1 1 1 1<br />
#9 AA: Anthropogenic Actions 4 4 4 5 4 4 4 4 4<br />
#10 Degree of protection from prevailing 5 5 3 4 5 5 5 5 3<br />
wave energy.<br />
#11 Cyclones 2 2 2 2 2 2 2 2 2<br />
#12 Sea-level rise Bruun erosion potential 3 3 3 4 4 3 3 3 4<br />
#13 Corals/fringing reefs 1 1 1 1 1 1 1 3 5<br />
#14 Relative height of the protective<br />
1 1 3 4 3 3 2 2 2<br />
foredune buffer (i.e. the available sand<br />
reservoir).<br />
Note, the above scoring example is for a specific scenario, namely “Scenario A1”. The different scenarios are<br />
discussed in the following section.<br />
October 2012, p 117
Climate change<br />
included<br />
6.4.2 Scenarios assessed for coastal vulnerability<br />
Detail vulnerability assessments for 12 coastal towns were conducted for 16 different hazard<br />
scenarios. Based on the SLR projections (Section 5.3) and hazard assessment and analyses, four<br />
levels of SLR were considered, namely 0 m, 0.5 m, 1 m and 2 m. As cyclones are such a major<br />
hazard along the Mozambique coast, the assessments were conducted both with and without<br />
taking cyclones into account. Other than SLR, the effects of climate change were also assessed by<br />
both including and excluding increases in “storminess” (i.e. wave height increase leading to<br />
increased wave attack). The total number of scenario combinations thus assessed comes to 16, as<br />
summarised in Table 6.3.<br />
#<br />
No Climate<br />
Change:<br />
Table 6.3:<br />
A<br />
Summary of scenarios assessed for coastal vulnerability<br />
Excluding cyclones<br />
Including cyclones<br />
Present wave<br />
climate<br />
Increased<br />
storminess<br />
Present wave<br />
climate<br />
Increased<br />
storminess<br />
1 2 3 4<br />
Present wave Present wave<br />
Present wave Present wave<br />
climate<br />
climate<br />
climate<br />
climate<br />
Note:<br />
SLR =<br />
0.5 m<br />
SLR =<br />
1.0 m<br />
SLR =<br />
2.0 m<br />
B<br />
C<br />
D<br />
Present wave<br />
climate<br />
Present wave<br />
climate<br />
Present wave<br />
climate<br />
Increased<br />
storminess<br />
Increased<br />
storminess<br />
Increased<br />
storminess<br />
Present wave<br />
climate<br />
Present wave<br />
climate<br />
Present wave<br />
climate<br />
1 Scenario A1 is the same as A2, therefore no A2 Scenario is included in the scoring<br />
2 Scenario A3 is the same as A4, therefore no A4 Scenario is included in the scoring<br />
Increased<br />
storminess<br />
Increased<br />
storminess<br />
Increased<br />
storminess<br />
The potential effect of each scenario combination (e.g. D4: SLR = 2 m; increased storminess;<br />
including cyclone hazard) was assessed on each of the 14 vulnerability indicators at each<br />
shoreline location (assessment) point. To account for each different scenario, the scoring for each<br />
vulnerability indicator was changed (e.g. vulnerability score increases by 1 for a particular<br />
scenario) or the weighting for that indicator changed (increased). Thus, appropriate weightings<br />
were also applied to the scoring to account for those parameters which have a (progressively)<br />
greater influence on the vulnerability as the scenarios change. The scores or weightings for<br />
specifically Vulnerability Indicators # 1, 2, 4, 5, 10 and 13 (Table 6.1) were therefore consistently<br />
adapted to properly account for each different scenario.<br />
For example, as the sea level rises, both elevation and distance from the sea (Indicators #1 and #2<br />
in Table 6.1) decrease relatively. Thus, the vulnerability in terms of these 2 indicators increases<br />
with each higher SLR scenario. (Specifically, for all C Scenarios, i.e. SLR = 1 m, the scores for<br />
Indicators #1 and #2 are double weighted; while for all D Scenarios, i.e. SLR = 2 m, the scores for<br />
Indicators #1 and #2 are triple weighted.) Increased storminess has a direct effect on vulnerability<br />
to waves (Indicator #4 in Table 6.1). (Therefore, specifically, for Scenarios B2, C2, D2, B4, C4 and<br />
October 2012, p 118
D4, i.e. increased storminess, the individual location scores for Indicator #4 are increased by one<br />
vulnerability class (= 1 point)).<br />
Cyclones mostly approach from some easterly direction, within a very wide range of approach<br />
directions. In addition, due to their “circular” wind fields, the largest incident waves can approach<br />
the shoreline from a very wide range of directions. Thus, while a specific location may be<br />
relatively sheltered from say long period ocean swells approaching from the south-east, waves<br />
generated by a cyclone could approach from, e.g. the north-east, to which this particular location<br />
might have much less shelter due to the specific shoreline configuration in this area. The<br />
occurrence of cyclones therefore reduces the degree of protection (Indicator #10 in Table 6.1) of<br />
many particular coastal locations. (For example, under all Scenarios 1 and 2, a particular coastal<br />
location may be partially sheltered from the usual deep sea swell approaching from the southeast<br />
and according to the evaluation criteria awarded a vulnerability score of 3 for Indicator #10.<br />
Under all Scenarios 3 and 4, i.e. including cyclones, this particular coastal location may be fully<br />
exposed to cyclone generated waves approaching from the north-east and now awarded a<br />
vulnerability score of 5 for Indicator #10.)<br />
These examples are given to illustrate how each of the 14 vulnerability indicators was assessed in<br />
terms of potential effects of the 16 different scenario combinations. In general, the vulnerability<br />
of coastal locations increase as the scenarios “increase” from A to D and # 1 to # 4 in Table 6.3,<br />
resulting in Scenario D4 being the “worst case” scenario. The effects of the different scenarios on<br />
the vulnerability ratings at each location can be seen in the vulnerability maps discussed in the<br />
following section.<br />
6.4.3 Mapping of detail vulnerability assessment outputs<br />
The vulnerability scores for each parameter at each coastal point (representative of a 1 km<br />
section) along the Beira study area, for example, is summarised in the map depicted in Figure<br />
6.23. The vulnerability at each point is indicated by the colour code, ranging from blue “very low”<br />
(score in 0 to 1 band), to purple “very high” (score in 4 to 5 band), as indicated by the legend. The<br />
examples are shown for 3 of the 16 scenarios assessed.<br />
The total or overall vulnerability scores (all parameters combined) at each point (representative<br />
of a 1 km coastal section) along the study area, for each of the 16 scenarios, is summarised in the<br />
maps depicted in Figure 6.24. The vulnerability at each point is again indicated by the colour<br />
code, ranging from blue “very low” (score in 0 to 1 band), to purple “very high” (score in 4 to 5<br />
band), as indicated by the legend. Besides the differences in vulnerability due to the different<br />
scenarios, it is concerning to note that almost all of the points are rated as having between<br />
medium (for Scenarios A1 to B4) to some very high vulnerability (for Scenarios D3 and D4).<br />
October 2012, p 119
(a)<br />
October 2012, p 120
(b)<br />
October 2012, p 121
(c)<br />
Figure 6.23 a to c: Beira vulnerability mapping showing all 14 parameters for 3 of the 16 scenarios.<br />
(Vulnerability is measured on a scale of 1- 5 with 1= lowest vulnerability and 5 = highest vulnerability as depicted in Table 6.1))<br />
October 2012, p 122
Figure 6.24a: Beira detail vulnerability mapping: Scenarios A & B<br />
(showing overall vulnerability rating when the 14 parameters in Table 6.1 are combined).<br />
Location Key<br />
October 2012, p 123
Location Key<br />
Figure 6.24b: Beira detail vulnerability mapping: Scenarios C & D<br />
(showing overall vulnerability rating when the 14 parameters in Table 6.1 are combined).<br />
October 2012, p 124
Similar total vulnerability maps for each of the other study sites, for the 8 scenarios that include cyclones (i.e. C1 to D4), are summarised in the maps<br />
depicted below in Figures 6.25 to 6.34.<br />
Location<br />
Key<br />
Figure 6.25:<br />
Ponto Do Ouro detail vulnerability mapping: Scenarios C & D<br />
October 2012, p 125
Location Key<br />
Figure 6.26:<br />
Maputo (and Matola) detail vulnerability mapping: Scenarios C & D<br />
October 2012, p 126
Location<br />
Key<br />
Location Key<br />
Figure 6.27:<br />
Xai-Xai Beach detail vulnerability mapping: Scenarios C & D<br />
October 2012, p 127
Location<br />
Key<br />
Figure 6.28:<br />
Tofo and Bara detail vulnerability mapping: Scenarios C & D<br />
October 2012, p 128
Location Key<br />
Figure 6.29:<br />
Imhambane and Maxixe detail vulnerability mapping: Scenarios C & D<br />
October 2012, p 129
Figure 6.30:<br />
Villancoulos detail vulnerability mapping: Scenarios C & D<br />
October 2012, p 130
Location Key<br />
Figure 6.31:<br />
Quelimane detail vulnerability mapping: Scenarios C & D<br />
October 2012, p 131
Location Key<br />
Figure 6.32:<br />
Ilha de Mozambique detail vulnerability mapping: Scenarios C & D<br />
October 2012, p 132
Location Key<br />
Figure 6.33:<br />
Nacala detail vulnerability mapping: Scenarios C & D<br />
October 2012, p 133
Location Key<br />
Figure 6.34:<br />
Pemba detail vulnerability mapping: Scenarios C & D<br />
October 2012, p 134
6.4.4 Comparison of detail coastal vulnerability of 12 Mozambican areas<br />
A comparison of the vulnerabilities of each of the 12 towns and cities for the A3 scenario with<br />
existing wave climate including cyclones (i.e. present day, no climate change effects) is presented<br />
in Figure 6.35.<br />
Figure 6.35:<br />
A comparison of the vulnerabilities of each of the 12 towns and cities (from south to north) for<br />
the present case scenario (A3)<br />
In this study the vulnerability was typically assessed over an area of about 10 km total for each<br />
town/city. The vulnerability was then assessed in detail per alongshore section of coast, typically<br />
per 1 km alongshore sections, although in some areas the sections were shorter. The green bars<br />
in Figure 6.35 indicate the lowest vulnerability score per section within the total length of<br />
shoreline assessed for a particular town. The yellow bars indicate the average vulnerability score<br />
over the total length of shoreline assessed for a particular town. The red bars indicate the highest<br />
individual vulnerability score within the total length of shoreline assessed for a particular town. In<br />
general for the present day scenario (A3), the most vulnerable towns are Ponta du Uoro, Maputo,<br />
Tofo, Villancoulos, Beira and Pemba.<br />
The least vulnerable towns for the present day scenario (A3), are generally XaiXai Beach, Maxixe,<br />
Quelimane and Nacala. As indicated by the yellow bars, all of the towns assessed have medium<br />
vulnerability on average to the impacts of climate change. At present (Scenario A3) Beira is the<br />
most vulnerable city in terms of all three categories (least vulnerable, average and most<br />
vulnerable section). (Note, other socio-economic factors such as population density are not<br />
accounted for in this relative comparison of abiotic physical vulnerability to coastal/marine & CC<br />
threats.)<br />
October 2012, p 135
A comparison of the vulnerabilities of each of the 12 towns and cities for the most likely future<br />
case scenario (C4) is presented in Figure 6.36 (The most likely future case scenario, C4, includes<br />
SLR of 1 m by 2100, vulnerability to cyclones and an increase in storminess.)<br />
Figure 6.36:<br />
A comparison of the vulnerabilities of each of the 12 towns and cities for the most likely future<br />
case scenario (C4)<br />
In general for the most likely future case scenario (C4), the most vulnerable towns are again<br />
Ponta du Uoro, Maputo, Tofo, Villancoulos, Beira and Pemba, but now also joined by XaiXai<br />
Beach. The least vulnerable towns for the most likely future case scenario (C4), are generally<br />
Maxixe, Quelimane and Nacala. As indicated by the yellow bars, some of the towns assessed now<br />
have high vulnerability (score 3 to 4) on average to the impacts of climate change, while, as<br />
indicated by the red bar, every town assessed has at least some location that is highly vulnerable<br />
to the impacts of climate change. In the most likely future (Scenario C4), Beira is again the most<br />
vulnerable city.<br />
A comparison of the vulnerabilities of each of the 12 towns and cities for the worst case scenario<br />
(D4) is presented in Figure 6.37 (The worst case scenario, D4, includes SLR of 2 m by 2100,<br />
vulnerability to cyclones and an increase in storminess.)<br />
October 2012, p 136
Figure 6.37:<br />
A comparison of the vulnerabilities of each of the 12 towns and cities for the worst case scenario<br />
(D4)<br />
In general for the worst future case scenario (D4), the most vulnerable towns are now XaiXai<br />
Beach, Tofo, Beira, Ilha De Mozambique and Pemba. The least vulnerable towns for the worst<br />
future case scenario (D4), generally remain Maxixe, Quelimane and Nacala. As indicated by the<br />
red bar, under this scenario, every town assessed has at least some location that is either highly<br />
or very highly vulnerable to the impacts of climate change. In the worst case future (Scenario D4),<br />
Beira remains the most vulnerable city, in terms of average vulnerability.<br />
In the above three figures (6.35 to 6.37), for Scenarios A3, C4 and D4 (present, most likely future<br />
and worsts case future respectively), the y-axis has purposefully been kept at the same start and<br />
end points, so that the three figures can be directly compared. The big increases in vulnerability<br />
to climate change, from present to most likely future to worst case future scenarios respectively,<br />
are thus clearly observed. For example, the most vulnerable locations in XaiXai Beach, Tofo, Beira<br />
and Pemba all increase from medium vulnerability under present conditions (A3) to very high<br />
vulnerability for the worst future case scenario (D4).<br />
The results of the vulnerability assessment were used to determine suitable adaptation options<br />
and also to prioritise the recommended actions. These aspects are discussed in the next chapter.<br />
October 2012, p 137
CHAPTER 7: ADAPTATION OPTIONS<br />
The results of a comprehensive literature survey as well as in-house coastal management and<br />
engineering experience are discussed and summarised in this Chapter.<br />
7.1<br />
As discussed in Chapter 5, in Southern <strong>Africa</strong>, including Mozambique, the most important drivers<br />
of risk to coastal infrastructure from erosion and flooding, are waves, tides and sea level rise in<br />
future. It is the combination of extreme events (sea storms occurring during high tides in<br />
conjunction with sea level rise) that will have by far the greatest impacts and will be the events<br />
that increasingly overwhelm existing infrastructure in the future (Theron et al. 2010). Several<br />
authors (e.g. Theron, 2007 and others) have summarised the basic options for responding or<br />
adapting to these predicted coastal climate change impacts as follows:<br />
• Do nothing;<br />
• Defend the existing position of the shoreline;<br />
• Advance the existing position of the shoreline;<br />
• Retreat.<br />
Each of these options has a different impact on the risk. Besides these basic “climate change<br />
response options”, there are other actions that can be taken to reduce risk resulting from<br />
physical coastal/marine hazards (including CC), such as for example reducing human pressure on<br />
the natural defences, as is described in more detail further in this Chapter. In the foregoing<br />
chapters, the main scenarios that were considered for changing risk in the future relate to climate<br />
change, in particular sea level rise and increased storminess (due to changed/increased oceanic<br />
wind fields). These two drivers of change were therefore incorporated directly into the modelling<br />
and results discussed in the previous chapters. Man (and especially relating to the Mozambican<br />
abiotic coastal domain) has virtually no regulatory control or significant influence over these<br />
drivers. Only in the long-term and with strong unified global intervention could these drivers<br />
eventually be significantly influenced. Thus, in terms of global change or other scenarios of<br />
change, we need to identify local mitigation/adaptation options by which resilience of the coastal<br />
area can be increased.<br />
Anthropogenic actions /interventions in the Mozambican coastal zone that could potentially be<br />
affected and that would affect vulnerability are:<br />
• <strong>Coastal</strong> constructions which result in a significantly steeper profile (e.g. gabion revetments or<br />
seawalls) or reduce the roughness of the profile (e.g. smooth concrete or block surface), result<br />
in relatively higher wave run-up elevations for the same input wave conditions. Such<br />
constructions also often lead to erosion hot-spots in adjacent beach areas.<br />
• Degradation of dune vegetation or destabilisation of dunes and especially actions which lead<br />
to reduction of dune volume (and height) lead to increased risk of coastal erosion. The dune<br />
sand (volume) forms the natural buffer against erosion during sea storms, preventing<br />
October 2012, p 138
excessive landward migration of the shoreline and allowing for recuperation of the beach<br />
between storms, provided that the natural processes are not impacted by human activities.<br />
• Increased human development within the hazard zone (i.e. usually too low or too close to the<br />
sea) directly leads to increased risk.<br />
• Any human activities which reduce the amount of sand within the coastal zone (e.g. dams on<br />
rivers or sand mining) or which reduce the rate at which sand is replenished into the area (e.g.<br />
causing a deficit in the coastal sediment budget) almost invariably eventually leads to<br />
progressive coastal erosion (thus necessitating increased erosion setback distances for coastal<br />
developments).<br />
Considering the above interventions, it is obvious that they all relate to actions which would<br />
exacerbate the problems or increase the risks within the coastal zone. Key<br />
mitigations/adaptations or opportunities for increasing resilience thus lie in preventing or<br />
reducing such actions or impacts (in line with Integrated <strong>Coastal</strong> Zone Management actions).<br />
For the purpose of this document it is important to note that in coastal management<br />
programmes it is desirable, beneficial and good practise to develop a coastal protection corridor<br />
with various zones, including:<br />
• the <strong>Coastal</strong> Reserves as a no development zone,<br />
• a coastal buffer strip as a limited development zone, and<br />
• conservation corridors that include inland areas that require additional protection.<br />
Proper planning can often eliminate the need for protection measures that might be required for<br />
future developments. The following points, adapted from various coastal management<br />
guidelines, (including Breetzke et al. 2008) serve as a guide:<br />
(1) Avoid the hazard<br />
Locate the development in such a way that the hazard cannot affect it. This requires<br />
determination of setback lines and buffer zones (Theron, 2000). This will always be of<br />
long-term financial and ecological benefit.<br />
(2) Prevent the loss<br />
Accept that extreme natural events will occur. Therefore take measures to minimize<br />
damage to or loss of property against the impact of extreme natural events.<br />
(3) Do nothing if appropriate, rather than ill conceived plans/actions, especially those that<br />
ignore full (“triple bottom line”) long-term costs/consequences. (If, for example, the<br />
main hazard in an area is deemed to be erosion, it may in a particular case be argued<br />
that the erosion is cyclic and that the sand will be replenished naturally over time. In<br />
such particular instance it may then be appropriate not to take any action.)<br />
The key questions that should be considered in planning developments near the shoreline are:<br />
• Will disaster risk increase for the population living in/near the area of intervention? If yes,<br />
• Is the development “location dependent”, i.e. is it really necessary for it to be located on or<br />
immediately adjacent to the shoreline?<br />
October 2012, p 139
• If development must take place within the sensitive dynamic area, what mitigating and<br />
maintenance measures will be implemented?<br />
• Can sediment movement and therefore erosion be altered by the proposed development?<br />
• Will the existing protection e.g. foredune ridge, mangroves etc be affected in any way?<br />
• Will the groundwater regime be affected in any way? And potable water supply for population<br />
centres nearby?<br />
• Will the proposed development or activity affect the coast in terms of its<br />
tourism/entertainment value .e.g. aesthetic-, swimming- surfing- or sunbathing values?<br />
• Will the proposed development or activity affect the coast in terms of its nature conservation<br />
value, or detrimentally affect the ecology e.g. breeding of birds or other organisms?<br />
• Has an accountable body or organisation been identified to determine the mitigating<br />
measures and ensure that such measures are properly implemented?<br />
Strategy to plan & “live” with coastal erosion:<br />
Following the coastal erosion events of 2006 and 2007 the KwaZulu-Natal Department of<br />
Agriculture and Environmental Affairs has compiled a Best Practical Guide for Living with coastal<br />
erosion (Breetzke et al. 2008). The following are adapted from the document to ensure relevance<br />
to this study:<br />
“Living with coastal erosion” requires that the following principles are acknowledged:<br />
• Continued global warming is likely to cause sea level rise and increased intensity and<br />
frequency of coastal storms;<br />
• Increased coastal erosion will lead to higher and continued risk to human life and the natural<br />
and built environments;<br />
• Best International Practice in the face of sea level rise and changing coastal dynamics is a<br />
phased retreat away from the shoreline;<br />
• It is not inconceivable that areas along the coast will lose more sand as a result of natural<br />
processes;<br />
• The severity of this loss will be dependent on coinciding phenomena such as storm events<br />
[winds & waves], occurring at equinox (highest annual) and spring high-tides and cyclones;<br />
• Any construction too close to the sea/beach interferes with natural sand movement and may<br />
impede beach and foredune recovery after a serious storm event;<br />
• Removing sand from beaches increases the severity of erosion;<br />
• Badly planned and inappropriate sea defences may cause further loss of sand resulting in<br />
beach degradation on site and to beaches and properties further along the coast; and<br />
• Removing vegetation from dunes destabilises these protective sand barriers and reduces its<br />
function as natural sea defences.<br />
The following are best practice guidelines to manage the human response to coastal erosion:<br />
Accept and live with erosion<br />
• Plan any coastal construction so that it is a safe distance away from the high-water mark and<br />
reinstate natural defence mechanisms with the necessary environmental authorisations.<br />
October 2012, p 140
A collective response is required<br />
• Holistic planning and implementation by authorities in response to coastal erosion is critical.<br />
<strong>Coastal</strong> Management <strong>Programme</strong>s, incorporating Shoreline Management Plans, are required<br />
to reduce the direct and associated effects of erosion.<br />
• Neighbours need to institute similar mitigation measures for the same reason. This<br />
collaboration will increase defence effectiveness and reduce costs.<br />
Establish a coastal setback<br />
• A development setback line is designed to protect both the natural environment from<br />
encroachment from buildings as well as protecting beachfront developments from the effects<br />
of storms and accelerated coastal erosion..<br />
• Development seaward of this setback is considered to be at high risk from coastal erosion.<br />
Work with natural processes in responding<br />
to erosion (and flooding)<br />
• Soft coasts mostly require soft solutions.<br />
• The preferred protection measures should make use of soft engineering solutions – e.g.:<br />
o A geofabric sand container or other suitable sand bags (which could be covered with<br />
dunes & vegetation),<br />
o Managed dune systems, which should be vegetated with appropriate dune species as<br />
per the original natural zones and maintained; maintain, or even better, increase the<br />
sand reservoir (volume) stored in the dune system.<br />
o <strong>Protection</strong>, restoration and maintenance of natural systems like mangroves and coral<br />
reefs.<br />
Replace lost sand with sand (i.e. beach<br />
nourishment)<br />
• It is important that the sand used must be of a similar nature to that found on the beach.<br />
• Accessing beach sand from other sources should only be considered following input from<br />
appropriate experts (e.g. it might be necessary to find an offshore sand source – this is usually<br />
very expensive).<br />
Consider hard engineering solutions in<br />
exceptional cases only<br />
• Resort to hard engineering solutions only in exceptional cases and only after detailed<br />
environmental impact assessment and authorisation is obtained.<br />
Be prepared, monitor and react:<br />
Employ appropriate “early warning”<br />
systems;<br />
Appropriately reconstruct coastal<br />
infrastructure and amenity<br />
• Early warning systems (or appropriate long-term monitoring) allow plans to be made to<br />
“handle” extreme events (e.g. sea storms) and reduce the associated risks.<br />
October 2012, p 141
• Infrastructure that is damaged as a result of coastal erosion should not just be replaced. Its<br />
appropriateness should be assessed and necessary improvements made, and in the mediumto<br />
long-term, plans prepared and implemented for a managed retreat of such infrastructure.<br />
Avoid and reduce the risk<br />
• This includes risk factors emanating from “non-marine/coastal processes”, e.g. stormwater<br />
runoff from streets, parking areas or drains:<br />
• <strong>Coastal</strong> property owners are responsible for the maintenance of stormwater discharge and<br />
may be liable for any erosion or negative impact such discharge may have on the frontal dune<br />
or beach.<br />
• Where stormwater has to be discharged onto a dune or beach, such discharge should be away<br />
from the dune face and toe. Discharge should preferably be onto a hardened area such as a<br />
rocky headland.<br />
Most of the response options described in this section (7.1) are purposefully what can be termed<br />
“soft” options or “working with nature”. This is in line with strategic principles and best practise<br />
guidelines in terms of coastal management and responding to climate change. The following<br />
section (7.2) has a more site specific focus and includes all appropriate adaptation measures and<br />
coastal protection options, “soft” and “hard”.<br />
7.2<br />
7.2.1 Range of potential solutions<br />
Many useful publications that address potential implications and adaptation/coastal protection<br />
measures can be found in the literature, e.g. UNCTAD (2008) – Table 7.1. Other examples include:<br />
NCCOE (2004), Stive et al. (1991), Breetzke et al. (2008), FEMA (2000), USACER (2004), SNH<br />
(2000), Van Rijn (2011), and others.<br />
However, due to various factors, southern <strong>Africa</strong>n states actually have very little adaptive<br />
capacity and their ability to halt coastal impacts on a large scale are virtually non-existent (Theron<br />
2011). According to Tol (2004), adaptation would reduce impacts by factor of 10 to 100, and the<br />
adaptation costs would be minor compared to the damage avoided.<br />
This is a clear imperative to set and implement adaptation measures sooner rather than later. To<br />
mitigate detrimental impacts resulting from climate change, an understanding of the adaptation<br />
options available to developing <strong>Africa</strong>n nations needs to be reached and that these are<br />
considerably different from some traditional approaches used in the developed countries.<br />
Mozambique is also not a wealthy country and has less money available for coastal constructions;<br />
more affordable response options are required.<br />
October 2012, p 142
Table 7.1:<br />
Examples of potential implications and possible adaptation measures<br />
(adapted from UNCTAD, 2008)<br />
CLIMATE CHANGE FACTOR POTENTIAL IMPLICATIONS ADAPTATION MEASURES<br />
Rising sea levels<br />
Flooding and inundation<br />
Erosion of coastal areas<br />
Extreme weather conditions<br />
Tropical cyclones<br />
Storms<br />
Floods<br />
Wind<br />
Damage to infrastructure,<br />
equipment and cargo (coastal<br />
infrastructure, port-related<br />
structures, hinterland<br />
connections)<br />
Increased construction and<br />
maintenance costs, erosion and<br />
sedimentation<br />
Relocation and migration of<br />
people and business, labour<br />
shortage and shipyard closure<br />
Variation in demand for and<br />
supply of shipping and port<br />
services (e.g. relocating)<br />
Changes in water levels in<br />
harbours<br />
Damage to infrastructure,<br />
equipment and cargo (coastal<br />
infrastructure, port-related<br />
structures, hinterland<br />
connections)<br />
Increased damage to ships as a<br />
result of wave current<br />
interaction<br />
Erosion and sedimentation,<br />
subsidence and landslide<br />
Relocation and migration of<br />
people and business<br />
Reduced safety and sailing<br />
conditions, challenge to service<br />
reliability<br />
Modal shift, variation in demand<br />
for and supply of shipping and<br />
port services<br />
Change in trade structure and<br />
direction<br />
Change in wave climate (swell<br />
and long period waves) in<br />
harbours<br />
Relocation, redesign and<br />
construction of coastal<br />
protection schemes (e.g. levees,<br />
seawalls, dikes, infrastructure<br />
elevation)<br />
Insurance<br />
Raising of existing breakwaterstructure<br />
to counter additional<br />
overtopping<br />
Raising of existing quay and<br />
wharf levels<br />
Set up barriers and protection<br />
structures<br />
Relocate infrastructure, ensure<br />
the functioning of alternative<br />
routes<br />
Raising of existing breakwaterstructure<br />
to counter additional<br />
overtopping<br />
Increase monitoring of<br />
infrastructure Conditions (e.g.<br />
CSIR breakwater monitoring<br />
programme)<br />
Restrict development and<br />
settlement in low-lying areas<br />
Strengthen foundations, raising<br />
dock and wharf levels<br />
Smart technologies for abnormal<br />
events detection<br />
New design for sturdier ship<br />
Designing new ports<br />
Revising dredging maintenance<br />
programmes, amended beach<br />
nourishment programmes<br />
Revision in ship mooring<br />
operations and equipment in<br />
ports<br />
Alterations to ports to<br />
compensate for additional wave<br />
action (swell induced or long<br />
period waves)<br />
October 2012, p 143
7.2.2 Listing and description of potential solutions<br />
By considering the coastal processes and characteristics of the study area, and factors governing<br />
suitability for coastal development, various potential responses can be formulated. A significant<br />
number of management options and “soft” and “hard” coastal engineering methods are available<br />
to protect the shoreline. The options described here do not include all possible coastal protection<br />
measures/options; however, the listed options include the potentially more appropriate<br />
measures:<br />
A<br />
A1<br />
“Management options”<br />
“Accept and retreat.” This involves repositioning infrastructure at risk so that it is no<br />
longer in danger of being affected by erosion or flooding. This requires zoning (through<br />
set-back lines) and retreat of communities and infrastructure to landward of the<br />
setback plus possibly an additional buffer zone. Ultimately this means better planning<br />
and management of both the built environment and natural resources, including<br />
specifically to increase the climate resilience of current development plans, in this case<br />
coastal infrastructure & development. Government must be directly involved in<br />
resettlement of populations to lower risk areas (this is also a good option for low cost<br />
housing projects). However, much can additionally be achieved by encouraging,<br />
incentivizing & enabling “private” migration to lower risk areas. Large costs are<br />
associated with the relocation of utility infrastructure (power, roads, water reticulation,<br />
water treatment, storm-water runoff and telecommunications), but these can be offset<br />
to some extent, e.g. through enhanced tourism & investment opportunities, or foreign<br />
aid.<br />
This option, the “accept & retreat” option, will allow for the continued erosion of the<br />
coast by the sea. Where the coastline has not yet been significantly developed (low<br />
existing infrastructure value), as in the case of large parts of the Mozambican coast, and<br />
the cause and effect of the erosion problem is of a large scale, this is often a wise choice<br />
in the long-term (e.g. Theiler, et al. 2000). It is also very much in line with the strategic<br />
principles and best practice guidelines discussed before. This option implies abandoning<br />
and removing existing infrastructure located near the sea. All infrastructure and<br />
development would have to be located landward of at least the 50 year coastal<br />
development setback line, while major developments and those with a longer design<br />
lifespan should be located landward of the 100 year setback line. However, this option<br />
does not provide protection for existing strategic or high value<br />
developments/infrastructure that are likely to be considered areas that must be<br />
defended.<br />
A2<br />
A3<br />
“Abstention” involves the ‘do nothing’ option. This option can be feasible if the risk of<br />
loss of property or human life is considered to be minimal. With this option, the current<br />
status quo will prevail, i.e. the actual/potential shoreline erosion and/or flooding<br />
continues with the associated consequence to the area.<br />
“Alternative” coastal developments. Provide good access to and develop alternative<br />
coastal areas (including providing services such as storm-water drainage and ideally<br />
sewerage systems), which are not prone to impacts such as flooding or erosion.<br />
October 2012, p 144
It is recommended that while interventions within existing developed areas are<br />
instigated, development of these alternative areas should progress in parallel.<br />
A4<br />
“Accommodation”. The intent here is not the direct defence or protection against the<br />
rising sea or storm waves, but to increases resilience or to better accommodate the<br />
associated impacts on infrastructure. Such measures include “climate or flood<br />
proofing”, such as raising property, more robust buildings, and improved early warning<br />
of climatic hazards such as extreme storms. The relevant action is to plan to build<br />
infrastructure to higher design standards to withstand higher frequency of storm wave<br />
impacts, flooding/inundation and under-scouring. Some of these measures can be<br />
employed by property owners and private developers (Figure 7.1). At ports the<br />
foundation should be strengthened to allow for a future raising of the levels of the<br />
wharfs and quays as SLR occurs.<br />
Figure 7.1: Example of local accommodation measure<br />
(Photo: Holland Herald, KLM, September 2011)<br />
B “Soft engineering” or Restoration (“semi-natural” interventions in the littoral zone)<br />
B1<br />
Sand nourishment: discrete localized nourishment projects or ongoing/regular<br />
nourishment projects; to mitigate existing and/or expected future coastal erosion<br />
problems, or even to build up a wider than present beach area, which will also reduce<br />
possible wave impacts and flooding potential. Stive et al. (1991), argue that shore<br />
nourishment is an effective mechanism to prevent shore retreat owing to long-term<br />
sea level rise because of the uncertainties and the flexibility that shore nourishment<br />
provides. Provided that sufficient sources of suitable sand are available, this is a good<br />
“soft” adaptive strategy, often better than “hard” (e.g. structural) approaches in the<br />
long-term. However, sand nourishment is expensive (like “hard” solutions) and the<br />
October 2012, p 145
need for eventual re-nourishment, although foreseen and planned for, is sometimes<br />
perceived as “failure” by the Public.<br />
Beach area can often be created or expanded by artificially feeding sand to an area<br />
(beach nourishment). To maximize benefit to cost ratios, the time between required renourishment<br />
events (maintenance intervals) is typically found to range from 6 to 12<br />
years. However, a lack of a sufficient sand source could rule this out as a viable option<br />
in such areas. Usually a discrete localised beach nourishment project is quite feasible in<br />
areas where the background erosion rates are up to 0.9 m per year; are marginally<br />
feasible in areas where the background erosion rates are 0.9 m to 1.5 m per year; and<br />
are generally not economically viable if the rates are greater than 1.5 m per year (USA<br />
values - Dean, Davis and Erickson 2006). However, USA back-shore property values are<br />
very high, while most Mozambican values would be much lower. The implication is that<br />
the acceptable background erosion rate for developed areas of the Mozambican coast<br />
area is probably lower than 0.9 m/yr.<br />
At a cost of perhaps $ 10/m 3 a project of 2 million m 3 would cost in the order of $ 20<br />
million. If costs are compared on a unit cost per metre basis, this option is actually very<br />
competitive. To supply a mean volume of say 300 000 m 3 /yr, could cost in the order of<br />
$ 3 million per year, or perhaps $ 500/m of shoreline. If options for cost sharing with<br />
existing port dredging operations are not available, foreign aid could be employed to<br />
fund such projects.<br />
Figure 7.2: Beach nourishment by means of direct<br />
“rainbowing” of sand from the dredger to shore (only practical<br />
in certain areas).<br />
Figure 7.3:<br />
Beach nourishment by means of pumping sand<br />
onto the beach through a pipe system<br />
October 2012, p 146
B2<br />
Managed (vegetated and/or reinforced) dune. Construct/reinstate and/or manage<br />
vegetated dune buffer areas. Where appropriate, it can be crucial to maintain an<br />
affordable and effective soft-engineering coastal defence mechanism that preserves<br />
the ecosystem services that protect natural backdune areas and man-made<br />
development against the forces of the sea.<br />
Rock protection or gabions can be placed underneath a (normally vegetated) dune.<br />
During a storm the dune will be eroded, but the rock/gabion will prevent excessive<br />
erosion. After the storm the dune could recover naturally, but in some instances may<br />
require active restoration and management.<br />
Dunes are usually the soft coast's natural protective buffer against storm seas and high<br />
spring tides. Sand trapped in a dune system is stored and can be returned to the beach,<br />
thus preventing beach erosion. Vegetated dunes protect houses, roads and<br />
recreational facilities against corrosive sea spray, sand blasting and inundation by sand<br />
blown inland from the beach, as the vegetated dune functions as a natural sand trap.<br />
The dunes should have a crest height of approximately +6 m to +10 m to MSL<br />
(depending on local circumstances), while the base width should ideally be at least 60<br />
m. In terms of the cross section, the seaward slope of the dune should be<br />
approximately 1:6. The estimated total cost of a dune, including reinforcement, is in the<br />
order of $ 240 000 per 100 m alongshore. The dune would be aligned approximately<br />
parallel to the shoreline.<br />
The estimated cost of constructing a non-reinforced dune is in the order of $ 1400 /m.<br />
The following items should be allowed for in costing: site establishment, bulk<br />
earthworks, shaping and trimming, irrigation system, fertilizers, mulching, harvesting of<br />
pioneer species, planting of dune vegetation, fencing, footpaths, signage and limited<br />
consultation. Estimated cost of placed rock reinforcement is about $ 100/m 3 , with<br />
additional costs relating to the reinforcement, estimated at about 75 % of the cost of<br />
the rock. Such reinforcement would only be required if there were very important<br />
reasons to reduce the shoreline variability in a specific location. The use of local labour<br />
in labour intensive projects could reduce the cost of building or maintaining dune<br />
systems.<br />
October 2012, p 147
Figure 7.4: Example of<br />
a vegetated dune at Beira<br />
with sufficient volume and<br />
height to protect landwards<br />
areas from storm erosion or<br />
coastal flooding.<br />
Vegetation (e.g. grass planting), thatching and fencing can be installed to hold or trap<br />
beach sand. In some instances, vegetation can reduce erosion by holding the sand.<br />
Casuarina trees have been planted in some coastal locations in Mozambique (e.g. Tofo,<br />
Maputo). However, these Casuarina trees have not been effective in preventing local<br />
soil erosion. The use of proper dune vegetation and appropriate grasses can be more<br />
effective. Suitable dune vegetation and grasses typically have a fine root system that<br />
goes over 2 meters deep, is tolerant to salt and cannot be easily uprooted. The<br />
vegetation is typically capable of tolerating sand-blasting and traps windblown sand,<br />
thereby contributing to dune development. By planting this vegetation strategically and<br />
fixing large volumes of sand in calm periods, a buffer can be created over a number of<br />
years that can erode in the stormy periods, thereby reducing erosion of the backshore<br />
areas.<br />
The use of non-invasive dune vegetation above other alternatives can be advantageous<br />
because it is cheaper and can have a higher aesthetic value. Further, it does not have<br />
negative effects on the adjacent coast, as many engineering structures do. It can<br />
therefore be used if there are limited financial resources available and could be<br />
undertaken by the owners of the property along the beach. Thus, it is a relatively<br />
"cheap" low environmental impact quasi-natural intervention to promote natural dune<br />
volume growth.<br />
On the other hand, it is difficult to be certain that the degree of protection is adequate<br />
for more than low erosion rates, particularly cyclones that can recur frequently result in<br />
relatively high erosion rates. It does not provide immediate protection and requires<br />
some maintenance to establish. Thus, it often has small potential for making a big<br />
difference, especially if used in isolation and not in conjunction with other<br />
management actions/interventions or protective measures. In general it can be<br />
October 2012, p 148
concluded that grass planting, thatching and fencing are relatively "cheap" low<br />
environmental impact quasi-natural intervention to promote natural dune volume<br />
growth, but sometimes have small potential for making a big difference.<br />
B3<br />
Mangroves, corals and wetlands<br />
Mangroves are not only ecologically important (especially for fisheries), but if they<br />
occur in sufficiently dense stands of sufficient cross-shore extent, they also structurally<br />
behave like a semi-permeable barrier (mostly due to their root system, much of which<br />
is above ground level). Energy is dissipated and sediments can even accumulate under<br />
suitable circumstances, thus reducing the flooding/erosion potential of waves/cyclones<br />
and proving some shore protection to landward areas. Wetlands can have a similar<br />
dampening effect and if of sufficient extent can help to dissipate flood waters and wave<br />
impacts on landward areas. Properly planned restoration of damaged mangrove areas<br />
are practical and can be used as a local job creation initiative, often in collaboration<br />
with private enterprise.<br />
Storm waves approaching the coast (e.g. resulting from cyclones) are affected by<br />
bottom topography, and shallow coral reefs that cause wave breaking dissipate much<br />
of the incident wave energy. However, as the sea level rises, existing topographic<br />
features including coral reefs will be located in deeper water and will have a reduced<br />
effect on waves approaching the coast. Areas landward of the reef breaker zone will<br />
experience an amplified wave climate compared to the present. At low rates of eustatic<br />
sea level rise, healthy corals can grow to match the rate of SLR, thereby retaining their<br />
protective effect. Deeper water features including coral reefs may deepen to the<br />
degree that their effect on the wave energy impacting on the shoreline is negligible.<br />
However, the coral reef areas of Mozambique are very vulnerable to CC impacts,<br />
through coral bleaching (e.g. Obura 2005), in terms of direct effect on the biota as well<br />
as on the important linked socio-economic sectors (e.g. tourism). As mentioned, the<br />
coral reefs serve other important functions, such as sheltering the coast from wave<br />
action and by providing beach building materials. Thus, loss of coral due to CC will also<br />
negatively impact these functions with detrimental impacts on the coast (e.g. erosion).<br />
Similarly, fringing reefs are found along some areas in Mozambique. These reefs<br />
comprise tough, algal-clad intertidal bars composed largely of coral rubble, and provide<br />
protection from wave attack to the inshore areas and beach sands that are susceptible<br />
to erosion (Arthurton 2003). If the coast is subjected to the predicted sea-level rise, the<br />
protective role of the reef bars will be diminished if their upward growth fails to keep<br />
pace (Theron and Rossouw, 2008).<br />
Mangroves, corals & wetlands therefore all have some “coastal protection” potential<br />
and can mitigate coastal climate change impacts to some degree. The opportunities<br />
therefore lie in protecting and managing these natural defences, or indeed in<br />
enhancing/expanding their positive effects by increasing such areas where practical<br />
or reintroducing such natural systems where they have been lost or impacted.<br />
October 2012, p 149
C “Hard engineering” & armouring (construct shore protection measures)<br />
C1<br />
Seawalls (mostly vertical or curved concrete structures) and revetments (including rock<br />
and concrete sloping revetments), involve the construction of ‘hard’ protective<br />
structures that are placed along the shoreline so as to act as a distinctive barrier<br />
between the land and the water, thereby directly preventing erosion and/or flooding of<br />
the back shore. Ground level (natural or raised) on the landward side of the structure is<br />
usually at the same elevation or higher than that of the crest of the structure.<br />
There are many types of revetments and retaining walls. The material of which they<br />
consist (rock, wood or concrete) and characteristics (e.g. permeability) result in<br />
differences in costs, longelivety, effectiveness & environmental impacts. Without<br />
detailed topographic surveys of the local project sites and possible underground<br />
foundation rock, it is very difficult to estimate quantities and thus construction costs.<br />
Design and construction supervision costs could be about an additional 10% of the total<br />
cost. The estimated costs provided further on in this Chapter and Chapter 8 are mainly<br />
for comparative purposes and more exact costs can only be determined once detailed<br />
designs have been completed. The availability of suitable rock, access roads and a<br />
quarry site all have big impacts on the total project cost. The extent of work can also be<br />
tailored to suit the available budget, although the greater the number of phases, the<br />
greater the overall project cost, i.e. due to longer construction supervision required and<br />
additional costs for re-establishment of a contractor on site.<br />
Figure 7.5:<br />
Examples of a revetment (left) and a seawall (right) in Mozambique<br />
October 2012, p 150
Figure 7.6:<br />
Example of a rock revetment protecting houses (South <strong>Africa</strong>)<br />
C2<br />
Dikes, similarly to C1, act as a distinctive alongshore barrier between the land and the<br />
water, but are often massive sloped (even landscaped and vegetated) loose standing<br />
sand or earthen mound constructions. They can be armoured (e.g. by a revetment) on<br />
the seaward side, or left unarmoured, but might then require significant maintenance<br />
or restoration after large storms. Their massive nature and large space requirements<br />
also make this an expensive option and difficult to apply in congested or very built up<br />
areas. However, they can be an option where absolutely necessary to protect current,<br />
immobile, vital infrastructure (e.g., potentially appropriate areas associated with the<br />
ports and cities of Beira and Maputo provided that sufficient space can be made<br />
available), but the development of new infrastructure directly adjacent to the dike<br />
should generally be avoided. To be effective against flooding, they have to be<br />
continuous or linked to other defences. It is essential to also plan for dispersing of<br />
floodwaters trapped inside the dike resulting from rainfall runoff or river flooding.<br />
October 2012, p 151
Figure 7.7:<br />
Examples of vegetated dikes (Germany)<br />
C3<br />
Perched beach or sill structures, which aim to artificially keep the upper part of the<br />
beach profile in place seaward of where it naturally would be. Wave energy is<br />
dissipated on the beach, which reduces the wave run-up.<br />
The available beach area can be expanded significantly by constructing a “perched”<br />
beach. This is simply a structure that allows a beach to be formed at an elevated level<br />
on the upper beach and prevents significant wave erosion. The structure consists of<br />
some form of partially submerged retaining wall, bulkhead or revetment, and is usually<br />
aligned roughly parallel to the shoreline. Hard rock substrate is required to provide<br />
good founding conditions, as the structure will have to withstand significant wave<br />
action.<br />
October 2012, p 152
Figure 7.8: Perched beach with partially submerged retaining structure<br />
A lack of good rock foundation conditions would make this an even more expensive<br />
construction. Some structures are designed to support the near-coast profile seaward<br />
of where it would otherwise be. Successful prototypes of such low structures, when<br />
designed to retain an artificial "perched" beach, are rare. The two main disadvantages<br />
are perhaps that the perched beach can easily lead to dangerous bathing conditions<br />
(due to e.g. the presence of a hard structure in the surf zone, the sudden drop-off and<br />
potential generation up rip currents), and a local intervention (i.e. small project area)<br />
would not address possible existing much wider background coastal erosion problems.<br />
C4<br />
Shore-parallel structures (e.g. artificial surf zone reefs, detached breakwaters, rock<br />
berms, etc.). These structures are normally built parallel to the shoreline and some are<br />
not connected to the shoreline. The structures are mainly designed to induce wave<br />
breaking and can either be submerged or above the water. (This could also include tidal<br />
pools, with or without beaches, as multi-functional structures.) These types of<br />
structures are usually expensive to place, require heavy plant and access roads and<br />
might need to transport both construction plant and rock material over long distances<br />
if it is not locally available (as in some parts of Mozambique), all of which can make this<br />
an expensive option.<br />
October 2012, p 153
Figure 7.9 Example of erosion mitigation through shore-parallel structures (Anglin, et al. 2001)<br />
Figure 7.10:<br />
Example of beach accretion through submerged artificial reefs<br />
October 2012, p 154
An offshore beach retention structure is a non-shore-connected feature that acts to retain a<br />
beach larger than would exist in its absence. Most of these structures perform this function by<br />
affecting waves such that a reduction in wave energy in their lee or a changed alignment of waves<br />
in their lee results, sustaining a protrusion of the shoreline. These structures are categorized as<br />
surface piercing or submerged offshore (or detached) breakwaters and artificial reefs. Each has<br />
advantages in retaining a beach. Conversely, there are disadvantages linked with each of them,<br />
including in some instances that the beach remains depleted and erosion continues, adverse<br />
erosion impacts on adjacent beaches, and failure of the structure. The most successful offshore<br />
structures have been those that are high, surface piercing, impermeable, “two-dimensional”<br />
breakwaters. Complexity in the functional design process increases as the height of the structure<br />
is reduced. In addition to diffraction effects, wave energy that passes through or over low or<br />
submerged, “two-dimensional” breakwaters must be considered.<br />
Thus, the concept of an artificial reef is to cause the waves that at present prevent a beach from<br />
building up, to break on this reef. By dissipating sufficient energy, a beach will form along the<br />
shore in the lee of the structure. The crest elevation and width of this reef have to be sufficient to<br />
cause such wave breaking and energy dissipation. This is similar to what occurs naturally in many<br />
areas where Tombolas are found in the lee of natural reefs. If the crest is too high, the reef will be<br />
more visually obtrusive. On the other hand, if the crest is too low, the reef will not be effective in<br />
reducing wave energy with the associated build-up of sand in the lee area. The crest of the beachreef<br />
will probably have to be at at least +2 m to +4 m to MSL or higher (depending on which area<br />
of the Mozambican coast is considered). The crest should probably be 4 m wide or more (also for<br />
practical construction purposes). The reef should be constructed of rock armour with sufficient<br />
weight to be stable under the expected wave conditions. The reef should be founded on existing<br />
bedrock if at all possible and the side slopes should probably be one in two (that is one vertical to<br />
two horizontal). The reef would be aligned approximately parallel to the shoreline and would<br />
have a unit length of at least 150 m. A disadvantage is perhaps that the localised artificial reef<br />
would not address possible existing wider background coastal erosion problems. In addition,<br />
potentially dangerous rip currents could be generated near the extremities of the reef especially<br />
during high tides.<br />
Similar to the artificial beach-reef, the concept of an artificial surf zone reef or alongshore<br />
breakwater is also to initiate wave breaking to allow a beach to form in the lee of the structure.<br />
The difference is that the surf zone reef is not located on the existing beach, but significantly<br />
further seawards in the surf zone (or beyond). This means that the surf zone reef is less obtrusive<br />
than the beach-reef and also presents less of a barrier between the beach and the inner surf zone<br />
area. On the other hand, the surf zone reef will obviously be much more expensive, due to the<br />
larger rock volume (larger sectional area and reef length) and the larger rocks sizes required to<br />
remain stable under the incident wave conditions in the deeper water. The surf zone reef would<br />
have a unit length of about 200 m or more, including required gaps in the reef. As the sea level<br />
rises in time, the effectiveness will be reduced and reconstruction/addition may be required. This<br />
reconstruction/addition needs to be incorporated into the design.<br />
October 2012, p 155
C5<br />
Groynes (straight, curved, T, L etc.). Groynes constructed perpendicularly or at an angle<br />
to the shoreline, can trap sediment and provide protection.<br />
Groynes can trap sand and aid the formation of a beach at the foot of the groyne. In general, a<br />
larger beach will tend to accrete on the updrift side of the groyne, with a smaller beach directly<br />
on the downdrift side in the lee of the groyne. A localised erosion area usually forms slightly<br />
further downdrift of the groyne. Lengthening of the groyne up to the outer surf zone will increase<br />
the beach area, but at a much greater cost. Groynes create very complex current and wave<br />
patterns. The orientation, length, height, permeability, and spacing of the groynes determine,<br />
under given natural conditions, the actual effects on breaking wave conditions, local currents,<br />
sand transport and changes in the bottom configuration. Problems sometimes arise with groynes<br />
due to cross-shore sand losses during storms or the formation of strong rip currents parallel to<br />
the structure.<br />
Figure 7.11:<br />
Existing groynes along Maputo shoreline<br />
Figure 7.12:<br />
Groynes protecting Richards Bay entrance channel shoreline, South <strong>Africa</strong> (Photograph S Pillay)<br />
October 2012, p 156
C6<br />
C7<br />
A spending beach of very coarse sand, gravel or cobbles can be used to dissipate wave<br />
energy and reduce erosion. Storm erosion of such a beach would be much less than for<br />
the natural finer grained beach material. A large source of such material is required<br />
relatively near the application site to make this option economically viable. (No obvious<br />
large deposits of such materials were observed during the Mozambique site<br />
reconnaissance.)<br />
The installation of a beach (and dune) dewatering mechanism. Sediment “stability”<br />
can be increased by reducing the pore water pressure.<br />
Geotechnical assessments of Kwazulu-Natal coastal areas (Theron, 2008) indicated that the<br />
phreatic surface and the emergence of seepage water along the shoreline influence slope<br />
stability. It seems that this is the only geological parameter that could potentially be manipulated<br />
in limited local areas. The basic concept here is to decrease the pore water pressure of the beach<br />
sand/dune to such an extent that the beach sand is not fluidized by waves and/or the<br />
groundwater within the dune is drawn down to enhance the dune slope stability. The system<br />
consists of a pipe network (with relatively closely spaced water extraction points), which is placed<br />
some distance below the normal sand level (say 1 m) and to which suction is applied.<br />
Although not a new technology, this concept found favour in coastal engineering applications in<br />
the late 1980s and early 1990s (e.g. Jenkins and Bailard, 1989, Parks, 1991, Ogden and Wiesman,<br />
1991, and Wiesman et al, 1995) with patents being granted to Vesterby in 1987 and Parks in 1991<br />
(Parks, 1992). In theory, this is a promising concept, but in practice it has met with limited success<br />
in coastal engineering applications. More recent publications (e.g. Turner and Leatherman, 1997,<br />
Bruun, 1989, and Bruno, 1999) are somewhat critical of earlier claims that this is a successful<br />
technology. The problems include the practical side of the application (sometimes aggravated by<br />
conditions in the harsh and dynamic coastal zone). The difficulties range from maintenance of the<br />
electrical supply, motors and pumps which extract water from the system to the robustness and<br />
durability of the pipe network. The initial position of the pipes and the flow rate through the<br />
system are also critical design parameters, but due to the dynamic nature of the coastal zone it is<br />
very difficult to ensure success under all conditions. For example, if the pipes are placed too deep<br />
or the flow rate is too low, the sand will not be effectively de-fluidised. On the other hand, if the<br />
pipes are placed in too shallow a position, the pipes may be scoured open resulting in damage.<br />
There is also a considerable risk that the system could be scoured open and damaged by wave<br />
action, especially if the shoreline is experiencing an erosion phase (or longer term trend), or<br />
localised erosion “hot-spot.<br />
Due to the many technical and practical problems associated with this option, the high<br />
maintenance costs, as well as the largely unproven track record, this option is not recommended.<br />
C8<br />
<strong>Coastal</strong> flood control gates in “enclosed” areas (e.g. river mouths, small bays).<br />
Well known examples include components of the Delta works in the Netherlands and the Thames<br />
flood barrier in the UK. These flood defence works tend to be very large and expensive schemes<br />
(as in the two examples mentioned), linked into wider dike defence systems. Suitable foundation<br />
conditions are ideally required, which is a major constraint in river mouth and delta areas with<br />
October 2012, p 157
deep mud/silt deposits. For these reasons, this option is considered to be largely unsuitable for<br />
practical application in Mozambique.<br />
In low to moderate wave energy environments:<br />
C9<br />
Closely spaced piles or wave fences to dissipate wave energy.<br />
Such structures can be successful in dissipating wave energy in low to moderate wave energy<br />
environments. However, they have no effect on rising sea levels, and coastal areas will still be<br />
subject to increased risk from flooding due to SLR. Thus, this is generally considered to be an<br />
unsuitable adaptation measure for the purposes of this investigation.<br />
Figure 7.13: Piles driven to form a wave fence (about 50 % reflective - PIANC, 2008)<br />
October 2012, p 158
C10<br />
Floating moored “breakwater” type structures.<br />
Figure 7.14:<br />
Patented floating breakwater (www.whisprwave.com)<br />
Such structures can be successful in dissipating wave energy in low to moderate wave<br />
energy environments. However, they have no effect on rising sea levels, and coastal<br />
areas will still be subject to increased risk from flooding due to SLR. These types of<br />
structures also require considerable maintenance, with significant cost implications.<br />
Thus, this is generally considered to be an unsuitable adaptation measure for the<br />
purposes of this investigation.<br />
C11<br />
“Geotextile” shore protection, usually sand filled geotextile containers.<br />
Traditional forms of shore protection, such as detached breakwaters, groynes,<br />
revetments have become expensive to build and maintain (especially if not well<br />
designed or constructed in the first place). This has prompted novel designs of low-cost<br />
shore protection. These protection measures may need replacement at relatively short<br />
intervals but might still be more affordable and economic in the long term than<br />
conventional methods. Low-cost shore protection methods are especially suitable<br />
when emergency beach erosion measures are urgently required.<br />
The CSIR has conducted comprehensive literature reviews in order to learn from<br />
international experience. Promising measures were identified and new low-cost shore<br />
protection measures were developed (Theron et al. 1994). These concepts were then<br />
tested initially in the laboratory and eventually in prototype (in South <strong>Africa</strong> at<br />
Strandfontein, Hermanus, False Bay and at Oranjemund in Namibia). These prototype<br />
tests enabled this new technology to be applied successfully and cost effectively to<br />
projects (Theron et al. 1999).<br />
October 2012, p 159
Possible applications of the low-cost shore protection include the following:<br />
• <strong>Protection</strong> of the shoreline against erosion.<br />
• Sleeping defence underneath a dune to safeguard against extreme beach erosion.<br />
• Preventing scour near coastal/marine structures.<br />
• Limiting the cost of breakwaters or groynes.<br />
While modern geotextiles are durable, they should be regarded as temporary measures as their<br />
lifespan for longer than a decade has not been proven. Successive storms may breach the<br />
protection if it is not maintained. Maintenance will be necessary after every major storm to<br />
replace sandbags that have been moved or damaged. If they are used as “sleeping defence”<br />
structures against extreme events and covered by sufficient sand (dunes), routine maintenance<br />
costs can be much reduced. The cost of durable geotextile material is high. The work has to be<br />
done under supervision of an experienced contractor. For construction of a groyne of sandbags a<br />
typical price is $ 200/bag for 0.75m 3 bags, including placement. A sandbag revetment would have<br />
a volume of at least 11 m 3 per meter shoreline length. Thus, for a 100 meter revetment the total<br />
price will be about $ 300 000. Present low-cost shore protection measures may not to be<br />
appropriate for permanent solutions to the more severe erosion problems possibly encountered<br />
in some areas or expected in future. They are also generally not suitable for use as “breakwater<br />
type” structures in deeper water.<br />
Figure 7.15:<br />
Examples of geotextile (sand bag) revetments (Kwazulu-Natal, South <strong>Africa</strong>)<br />
October 2012, p 160
C12<br />
Gabions and/or rock filled wire basket & mattress structures.<br />
An example of a Gabion retaining wall structure is depicted in Figure 7.14<br />
Figure 7.16: Example of a<br />
Gabion retaining wall structure<br />
(to protect the back-beach area)<br />
Evaluations of Gabion<br />
structures from<br />
literature and practical<br />
experience:<br />
• "At sites where<br />
there was<br />
significant wave<br />
action, abrasion,<br />
and impact forces,<br />
the gabion baskets<br />
tended to be broken<br />
quickly. Corrosion was<br />
a significant problem at most sites, even though PVC-coated baskets were used... The hazard<br />
posed by the baskets once deterioration begins would restrict their use only to site where<br />
there is little public use." (Combe et al. 1989, page 61-62).<br />
• A UK report (Welsby and Motyka, 1984) reviewed the performance of Gabion structures<br />
around the coast of the UK: "Opinion as to the lifespan of metal gabions on the foreshore is<br />
divided but the general consensus is that in areas subject to severe wave activity, gabions will<br />
succumb to rapid abrasion and as a result their lifespan can be as short as 2 or 3 years. On flat<br />
sand beaches subject to moderate or low wave activity the lifespan can be a decade or more.<br />
On the backshore, where gabion structures are not subjected to regular wave activity, they<br />
can be expected to have a considerably longer life." The report also notes that the<br />
performance of the Gabion under wave action often depends on how well they're packed<br />
(Powell, pers com. 2011).<br />
• If there is any debris in the water or cobble on the beach, the baskets are prone to failure<br />
(Tanski, 2011 pers com.).<br />
• In all of these types, construction practice is critical, especially regarding stone gradation and<br />
packing to resist self-destruction (McGehee, 2011 pers com.).<br />
Gabions can also be used as “sleeping defence” structures against extreme events and covered<br />
by sufficient sand ( ideally vegetated dunes), which will reduce routine maintenance costs. While<br />
Gabion structures may be durable and relatively low-cost, they should probably be regarded as<br />
temporary measures based on the above review. Rock filled wire basket & mattress structures<br />
employed as shore protection measures may not to be appropriate for permanent solutions to<br />
the more severe erosion problems possibly encountered in some areas or expected in more<br />
areas in the future.<br />
October 2012, p 161
D Combined options<br />
Many combinations of the above options are possible. For example, to reduce the high sand loss<br />
rate from a discrete localised beach nourishment project, groynes (probably L or T shaped) could<br />
be added on either side (and within) the nourishment area. However, the disadvantages<br />
associated with groynes will still be applicable.<br />
In areas where the beach is artificially widened a constructed vegetated buffer dune may be<br />
required to manage wind-blown sand and thereby also maintain the sand within the beach-dune<br />
system.<br />
7.2.3 Summary list of potential solutions<br />
The following potential options to respond and adapt to the impacts of climate change have been<br />
identified for the study areas.<br />
A<br />
A1<br />
A2<br />
A3<br />
A4<br />
B<br />
B1<br />
B2<br />
B3<br />
C<br />
C1<br />
C2<br />
C3<br />
C4<br />
C5<br />
C6<br />
C7<br />
C8<br />
“Management options”<br />
“Accept and retreat”: repositioning infrastructure at risk; zoning, set-back lines, resettlement,<br />
etc.<br />
“Abstention” involves the ‘do nothing’ option. (If the risk of loss of property or human life is very<br />
minimal.)<br />
“Alternative” coastal developments: develop “safe” alternative coastal areas including services.<br />
“Accommodation”: increase resilience and accommodate impacts on infrastructure e.g. raising<br />
property.<br />
“Soft engineering” or Restoration (“semi-natural” interventions in the littoral zone)<br />
Sand nourishment: pump extra sand onto the beach to build it up and reduce wave impacts &<br />
flooding.<br />
Managed (vegetated and/or reinforced) dune. Construct/reinstate and/or manage vegetated<br />
dune areas.<br />
Mangroves, corals and wetlands. Expand/reinstate and manage/protect such natural defences.<br />
“Hard engineering” & armouring (construct shore protection measures)<br />
Seawalls & revetments: sloping, vertical or curved concrete/rock structures.<br />
Dikes: massive sloped (landscaped and vegetated) loose standing sand/ earthen mound.<br />
Perched beach structures: artificially keep the upper part of the beach profile in place<br />
Shore-parallel structures (e.g. artificial surf zone reefs, detached breakwaters, rock berms, etc.).<br />
Groynes (straight, curved, T, L etc.) placed perpendicular or at angle to shoreline, can trap<br />
sediment<br />
Spending beach of very coarse sand, gravel or cobbles: dissipates wave energy & erosion.<br />
Beach (and dune) dewatering mechanism. Sediment “stability” can be increased<br />
<strong>Coastal</strong> flood control gates in “enclosed” areas (e.g. river mouths, small bays).<br />
In low to moderate wave energy environments:<br />
C9 Closely spaced piles or wave fences to dissipate wave energy.<br />
C10 Floating moored “breakwater” type structures.<br />
C11 “Geotextile” shore protection, usually sand filled geotextile containers.<br />
C12 Gabions and/or rock filled wire basket & mattress structures.<br />
October 2012, p 162
D<br />
Combined options<br />
A combination of two or more of the identified solution options may be required.<br />
7.3<br />
Table 7.2:<br />
Asset<br />
The considerations or criteria used to evaluate the different options focus mainly on the practical<br />
and technical aspects. The main technical consideration is whether the solution will adequately<br />
address the project aims. Another critical aspect is the expected cost. Further practical aspects<br />
include issues such as that the recommended solution should ideally address possible existing<br />
background coastal erosion problems. The solutions should also be as environmentally friendly as<br />
possible. However, ecological considerations (that is, impacts on the fauna and flora) must be<br />
taken into account; similarly social issues must be properly accounted for. Also, aesthetic impacts<br />
should be considered. Thus, the main considerations in choosing between the options are<br />
effectiveness in adapting to expected climate change impacts (e.g. increasing beach width),<br />
environmental aspects, costs, and possibly whether the option has a dual purpose in also<br />
addressing possible existing background coastal erosion problems. Impaired beach (and possible<br />
inter-tidal rocky area) usage and aesthetic impacts should also be assessed.<br />
Useful guidelines have been published (SNH, 2000) that aid the decision making process<br />
regarding the approach to follow, as summarized in Table 7.2 below:<br />
Replaceable (e.g. caravans,<br />
golf tees/green, car parks,<br />
amenity buildings, etc)<br />
Moderate economic value or<br />
medium residual life (5-25<br />
years * ) (Low density housing,<br />
roads, large caravan sites,<br />
military installations, etc)<br />
Selection of shoreline management options based on assets at risk (adapted from the literature)<br />
Recommended approaches:<br />
Move or rebuild assets inland (adaptive management), plus minor temporary<br />
works to delay the onset of the move (i.e. fencing, planting, beach re-cycling,<br />
sand bag or gabion revetments). Total costs typically range from very low to<br />
$ 90 000 per 100 m alongshore.<br />
Series of nearshore breakwaters<br />
Rock groynes (on mixed sediment beaches where littoral drift is active and<br />
downdrift erosion is not an issue)<br />
Beach nourishment (with future top-ups, and possibly buried rock revetment)<br />
Rock revetment<br />
Total costs typically range from $ 150 000 to $ 750 000 per 100 m alongshore.<br />
However, it is emphasised that if the erosion is long-term, backshore assets<br />
should not be enhanced or replaced, thereby allowing for ultimate<br />
abandonment.<br />
*Note: These useful guidelines have been adapted from the literature, which includes a suite of responses including<br />
short lifespan options, although the main planning period considered in this report is generally 50 to 100 years.<br />
A critical consideration in evaluating the different options is the expected cost. Some costs have<br />
been estimated as summarized in the table below. (These estimates are mainly adapted from<br />
South <strong>Africa</strong>n experience, but are supplemented by some experience in other <strong>Africa</strong>n countries<br />
and limited international inputs.)<br />
October 2012, p 163
Table 7.3:<br />
Summary of some adaptation option cost estimates<br />
DESCRIPTION<br />
Approximate<br />
Minimum<br />
Costs (excl tax)<br />
for 1km<br />
Approximate<br />
Maximum<br />
Costs (excl tax)<br />
for 1km<br />
Approximate<br />
Minimum<br />
Costs (excl tax)<br />
for 10km<br />
Approximate<br />
Maximum<br />
Costs (excl tax)<br />
for 10km<br />
Sand feeding (beach nourishment) new<br />
$4 000 000 $60 000 000 $40 000 000 $600 000 000<br />
@ rate of 300 000 m 3 /a for 10 yrs)<br />
Sand feeding (beach nourishment) maintenance $400 000? $7 780 000?<br />
Revetments & walls (permeable) $2 300 000 $24 000 000 $23 000 000 $240 000 000<br />
Vegetated dune $750 000 $7 200 000 $7 500 000 $72 000 000<br />
Geotextile sand containers, Geobags (semisheltered<br />
$1 100 000 $23 000 000 $11 000 000 $230 000 000<br />
location)<br />
Gabions (semi-sheltered location) $600 000 $7 000 000 $6 000 000 $70 000 000<br />
Rock groynes $1 000 000 $29 200 000 $10 000 000 $292 000 000<br />
Wave Fence (semi-sheltered location) $2 300 000 $40 000 000 $23 000 000 $400 000 000<br />
Floating pontoons (semi-sheltered location) $2 250 000 $31 600 000 $22 500 000 $316 000 000<br />
Rubble-mound breakwater structure land based $1 500 000 $15 100 000 $15 000 000 $151 000 000<br />
Rubble-mound breakwater: marine based $2 900 000 $42 800 000 $29 000 000 $428 000 000<br />
Sheet piling seawall (shore parallel) $2 700 000 $36 000 000 $27 000 000 $360 000 000<br />
A significant proportion of the costs for most coast protection materials is in the transport and<br />
placement. Work on dune systems can impose additional costs due to concerns over destruction<br />
of landforms and habitats, and the problems of working in locations lacking access. Delivery from<br />
the sea of bulk materials (rock or beach sediment) is often preferred as backshore damage is<br />
minimised, although land access will still have to be provided for plant, labour and additional<br />
materials. Parts of the Mozambican coast are very exposed or have very shallow in-shore areas;<br />
thus sea access is also very difficult (expensive and risky). Haul roads will have to be built across<br />
the dunes unless access can be provided from an existing route. (Rock supply, plant availability<br />
and access are big cost factors especially relevant to parts of Mozambique.) Thus, there are many<br />
local factors and other details such as local supplier pricing, which will have a big impact on<br />
project costs. (This is why the band between minimum and maximum cost estimates in Table 7.3<br />
is so wide, to ensure as far as can be foreseen that the actual costs should be between these<br />
limits.) These can only be assessed properly at the detail design stage of specific projects. Besides<br />
direct capital costs it is critical to consider maintenance costs and life expectancy of the option.<br />
Solutions MUST be sustainable, which means the recommended options must also be durable<br />
and affordable to the Municipality and/or State (or responsible authority).<br />
In choosing adaptation options it is also very important to consider the impacts to habitat,<br />
landform, landscape, coastal processes, etc. Consideration should be given to the full life<br />
environmental impacts of proposed management intervention/operations. The<br />
manager/responsible authority must consider not only the local short-term impact of a scheme,<br />
but also the following aspects (adapted from literature):<br />
the impact on the source area for materials (offshore dredging areas, rock quarry, etc)<br />
the impact of transport to the site (road congestion and surface damage, noise levels, risk<br />
of accidents at sea or on roads, access through dunes, etc)<br />
October 2012, p 164
Option<br />
the impact of damaged or life expired materials on the shoreline (synthetic fencing<br />
materials, geotextile sand bags, gabion baskets and rock fill, timber, concrete, rock, etc).<br />
the long term evolution of the beach and dunes and the effectiveness of structures over<br />
their full life.<br />
Management plans should allow for these environmental impacts during the decision process,<br />
particularly where costs are being passed on to future generations. Mitigation measures and<br />
good working practices to minimise impacts should be built into designs, agreed with contractors<br />
and monitored rigorously during initial and ongoing operations.<br />
A pertinent comparison and assessment of most of the options has been reported in the<br />
literature, as summarised in Table 7.4, below.<br />
Table 7.4:<br />
Relative costs, life expectancy and potential environmental impacts associated with shoreline<br />
management options (adapted from SNH, 2000)<br />
(* = low, ***** = high)<br />
Impacts (1) Costs (5)<br />
Habitat Landform Landscape Processes Capital Maintenance (2) Life<br />
Expectancy (3)<br />
Adaptive management ** ** ** *<br />
Dependant<br />
on assets<br />
* *****<br />
Grass planting, Thatching,<br />
Dune fencing<br />
* * * * * *** *<br />
Sandbag structures ** ** ** ** ** * **<br />
Beach drainage * * * ** *** ** *<br />
Beach nourishment ** * * * *** *** **<br />
Gabion revetments (4) *** *** *** *** *** ** ***<br />
Artificial headlands ** ** *** *** *** * ***<br />
Artificial reefs ** ** *** *** *** * ***<br />
Nearshore breakwaters *** ** **** *** *** * ***<br />
Groynes *** *** *** *** *** * ***<br />
Rock revetments (4) **** **** ***** **** **** * *****<br />
Timber revetments (4) *** *** **** *** **** * ***<br />
Impermeable<br />
revetments/seawalls<br />
**** ***** ***** **** ***** * ****<br />
1. Impacts over full life-cycle of option<br />
2. Maintenance cost relative to capital cost (to retain design benefits)<br />
3. Life expectancy of benefits without maintenance<br />
4. If buried into the dune face the impacts associated with these approaches are lowered and the life<br />
expectancy increased; capital costs may be higher but maintenance costs lower.<br />
5. These cost indications are more applicable to Europe and possibly less so for Mozambique<br />
October 2012, p 165
Note, Table 7.4, as taken from the literature, does not include all the options considered for<br />
Mozambique. A further assessment by the authors (based on southern <strong>Africa</strong>n experience) of<br />
some of the options is summarized in Table 7.5 below.<br />
Table 7.5:<br />
Comparative functionality/suitability of some potential adaptation measures<br />
Suitability<br />
Criteria<br />
<strong>Adaptation</strong><br />
Alternative<br />
Shoreline<br />
stability<br />
Wave<br />
attenuation<br />
potential<br />
Inundation<br />
due to SLR<br />
mitigation<br />
potential<br />
Environmental<br />
& social<br />
impact<br />
Relative<br />
cost<br />
Relative<br />
design life<br />
Maintenance<br />
Cost<br />
Maintenance<br />
Frequency<br />
Do nothing Low Nil Nil Nil to high Nil - - -<br />
Shoreline<br />
Nourishment<br />
Medium to<br />
high<br />
Low<br />
to high<br />
Low to high<br />
Low<br />
Medium<br />
to high<br />
Short to<br />
Medium<br />
medium<br />
Medium<br />
Revetment High High High High High Long High Low<br />
Detached<br />
Breakwater<br />
Limited Limited Nil Medium<br />
Medium<br />
to high<br />
Long High Low<br />
Sill<br />
Medium to<br />
High<br />
Medium Low Medium Medium Long Medium Low<br />
Submerged<br />
breakwater<br />
Limited Limited Nil<br />
Low<br />
medium<br />
to<br />
Medium<br />
to high<br />
Long Medium Low<br />
Wave fence –<br />
fully reflective<br />
Medium to<br />
high<br />
High<br />
Nil<br />
Medium<br />
to high<br />
Low to<br />
Medium Low High<br />
medium<br />
Wave fence –<br />
partially<br />
reflective<br />
Medium High Nil Medium<br />
Low to<br />
Medium Low Medium<br />
medium<br />
Floating<br />
Low to<br />
Medium Medium Nil<br />
Medium Medium Medium High<br />
breakwater<br />
medium<br />
Note: Effectiveness, impacts and costs can vary significantly due to local site characteristics, availability of<br />
materials, access and transport costs<br />
In Table 7.5 the functionality and suitability of some coastal climate change (CC) adaptation<br />
measures are assessment and compared:<br />
• The 1 st column lists 9 adaptation alternatives/options. Columns 2 to 4 assess the functionality<br />
of each option, respectively in terms of: “shoreline stability” (i.e. how effectively will the<br />
shoreline location be “fixed” in place), “wave attenuation potential” (i.e. how effectively will<br />
wave energy be dissipated), and “inundation due to SLR (sea level rise) mitigation potential”<br />
(i.e. how effectively will flooding due to SLR be prevented). The most direct measure of<br />
effectiveness in meeting the objective of reducing the coastal CC impacts is "inundation due to<br />
SLR mitigation potential". Thus, a score of "nil" here should almost eliminate such options.<br />
• Columns 5 to 9 assess the suitability of each option, respectively in terms of: adverse<br />
“environmental or social impacts”, relative cost of each option, relative design life (or<br />
October 2012, p 166
durability), cost of maintenance required for each option, and required frequency of<br />
maintenance.<br />
• To facilitate a quick comparison of the different options, all “good” assessments of<br />
functionality/suitability have been coloured in green, while unfavourable assessments are<br />
coloured in red. Thus, in general, the “better” or “more suitable” options have relatively many<br />
green blocks and few red blocks. Of the 9 options listed here, “shoreline nourishment” and<br />
“revetments” are therefore generally preferred. Note, however, that the effectiveness,<br />
impacts and costs can vary significantly due to local site characteristics, availability of<br />
materials, access and transport costs.<br />
• Four of the options have been identified as generally not suitable to most of the study sites in<br />
Mozambique (in terms of effectiveness in meeting the objective of reducing coastal CC<br />
impacts); red lines have been drawn through these options in Table 7.5.<br />
• All of the structural options would have significant environmental impacts, including enhanced<br />
downdrift coastal erosion.<br />
• Some of the best options available are to address the causes of existing erosion (i.e. for<br />
Maputo: feed dredged port entrance channel sand to the main beachfront area with<br />
appropriately coarse sand or large scale ad hoc nourishments). All large sand nourishment<br />
projects are likely to benefit a much more extensive (alongshore) area in the long-term. In this<br />
respect, the opportunities presented by future capital dredging projects for port expansions<br />
must be fully exploited. Even if a fairly large percentage of such dredged material is considered<br />
less suitable or inappropriate (too much fine sediment) for “ideal” beach nourishment, this<br />
must be critically reviewed. In view of the present and future erosion impacts and hazard<br />
prone state of the coastal environment, the negative ecological environmental impacts<br />
(probably temporary) from pumping otherwise too fine material onto the beaches, are likely<br />
to be considerably less than the ultimate environmental (and socio-economic) good that<br />
would result from beach nourishment even with a much lower than “normally” acceptable<br />
proportion of coarser sediment.<br />
Based on the foregoing evaluation consideration and criteria, and including all appropriate<br />
options, the priority adaptation/”no-regret” measures were grouped according to type and<br />
impact, covering the most relevant Climate Change issues for Mozambique coastal towns and<br />
cities, as summarized in Table 7.6 below. The measures were assessed in terms of general<br />
feasibility, cost/benefit applicability (CBA), suitability/effectiveness and area of applicability.<br />
Thereafter the general priorities for implementation were identified and the preferred order of<br />
implementation was determined as also indicated in the table.<br />
October 2012, p 167
Table 7.6:<br />
Priority adaptation/no-regret measures<br />
Key: (Note, a high CBA (Cost/Benefit Assessment) is taken as a positive indicator, meaning in fact that the benefits outweigh the costs, and could thus perhaps be stated more logically as BCA<br />
(Benefit/Cost Assessment) in terms of a positive metric. However, to remain consistent with the terminology used in the other themes, CBA is retained here.)<br />
October 2012, p 168
CHAPTER 8: DISCUSSION ON POSSIBLE<br />
ADAPTATION OPTIONS PER STUDY SITE<br />
Before going into the detailed adaptation recommendations for each city/town, it is important to<br />
reiterate that the strategic principles and guidelines on planning for and responding to coastal<br />
impacts and including specifically climate change impacts, as discussed in Section 7.1, should be<br />
adopted and implemented forthwith. This will go a long way in reducing the need for<br />
constructing expensive coastal defences in many instances, especially in the long-term.<br />
8.1<br />
The derivation of final recommendations for site specific ‘no regret’ adaptation measures<br />
entailed the following tasks/actions:<br />
• A literature survey (Chapter 7)<br />
• Assessment against the evaluation considerations and criteria (Section 7.3)<br />
• Use of coastal engineering practice and experience<br />
• On site observations and surveys during a field mission in May 2010<br />
• Consensus within a multi-disciplinary coastal specialist team<br />
Following a conservative and precautionary approach with the aim to be pro-active and prevent<br />
or lower the risk to lives, livelihoods and infrastructure, a list of prioritized adaptation response<br />
actions for each town and city was derived and is provided in the form of annotated diagrammes<br />
on Google-Earth TM images (Figures 8.1 to 8.17). The specific engineering design details and<br />
accurate costing of each option can only be done once site specific engineering and<br />
environmental investigations have been carried out. It is absolutely critical to involve experienced<br />
coastal engineering and coastal environmental professionals in the detailed planning, design and<br />
implementation of the chosen options.<br />
To illustrate the assessment approach and the way the results are presented for each study site,<br />
the city of Beira is used as the example in section 8.1.1 below. The results for the other study sites<br />
are presented in a similar manner.<br />
8.1.1 Beira<br />
Large areas in and around the city of Beira are low-lying (Figure 6.5) and thus are vulnerable to<br />
the forces from the sea. Major areas could be flooded at present should a cyclone reach Beira at<br />
the same time that the tide is at the Mean High Water Spring (MHWS) tide level. Due to the<br />
projected increase in the frequency of cyclones under climate change scenarios (Chapter 5), this<br />
situation will occur more often as the sea level rises in time. A Google-Earth TM image of Beira with<br />
numbered yellow location markers at 0.5 km intervals along the coastline is shown in Figure 8.1.<br />
October 2012, p 169
Figure 8.1:<br />
Beira. <strong>Adaptation</strong> / coastal protection options based on general criteria, local site characteristics<br />
and current use/”value.”<br />
Using the information discussed in Chapter 7 as the basis, the short-list of the key adaptation<br />
measures found to be most suitable for Beira (summarised in the large white block in Figure 8.1),<br />
which includes four “Management options” (labelled A1 to A4), three “Soft<br />
engineering”/Restoration measures (B1, B2 & B3), four “Hard engineering” & armouring options<br />
(C1s, C1r, C2, C5), and two options more suitable for low/moderate wave energy sites (C11 &<br />
C12). (Note that the focus of this project is on longer term adaptation measures such as those<br />
recommended here. However, emergency response options/actions, such as marking flood<br />
evacuation routes and keeping them open are also critical response actions. It appears that the<br />
INGC has already been successful in applying such measures.)<br />
The three or four options or combination of options considered most suitable for each 0.5 km<br />
alongshore section of the coast are indicated in the small white block adjacent to each marker on<br />
the map. The labels within each small block (e.g. A1 or C5, etc.) refer to the labelled options<br />
described in the large white block.<br />
The large red numbers (1 to 4) on the figures indicate the recommended order of<br />
implementation of the identified coastal adaptation measures for Beira. In other words, Figure<br />
8.1 represents a “plan” or “map” summarising the preferred adaptation options along each 0.5<br />
km section of the western, southern and south-eastern Beira coast.<br />
Referring to the discussions in Chapters 5 and 6, the “sea water flooding hazard” levels for Beira<br />
(Figures 5.32 and 6.3) show that along the semi- exposed and exposed locations, labelled 2440 to<br />
October 2012, p 170
2455 in Figure 8.1, for a 1m sea level rise (by 2100) plus a run-up of +1.5 m during cyclonic events,<br />
that areas below +7.4 m MSL will be in danger of being flooded. In lieu of better topography data<br />
and detailed flood inundation modelling, the 8 m MSL contour is taken as the line roughly up to<br />
where the sea water could potentially reach from such an event. (Note that as indicated before in<br />
Section 6.2.2, although this is the correct theoretical flooding level for this combination of events,<br />
the actual landward extent of the flooded area would not extend all the way to the +8 m contour<br />
in many locations, as “on-land” factors such as the roughness (due to buildings, trees, etc.) will<br />
reduce the actual landward extent of the flooded area. This is not accounted for in most run-up<br />
models, including the Nielsen & Hanslow model applied in this project. In addition, the contours<br />
are not based on accurate topographical data, and therefore can only give a rough indication of<br />
where the accurate contour location is in reality. These comments are applicable to all of the<br />
study areas.) This intermediate flooding level is appropriate for planning and management of<br />
infrastructure along the semi- exposed locations # 2451 to 2455 in Figure 8.1, or with a structural<br />
design life of less than 50 years along the exposed locations # 2440 to 2450.<br />
The low hazard risk level along the exposed locations # 2440 to 2450 for important infrastructure<br />
with a design life of more than 50 years (such as ports and airports) is +9.9 m MSL, taken as the<br />
rough +10 m MSL contour (arriving from the extreme scenario of a +2 m sea level rise along with<br />
a 3 m storm run-up level during cyclones).<br />
The recommended adaptation options along parts of the Beira coast are shown and discussed in<br />
more detail in the following pages.<br />
Figure 8.2:<br />
Western Beira. <strong>Adaptation</strong> / coastal protection options based on general criteria, local site<br />
characteristics, current use / ”value”<br />
October 2012, p 171
The preferred option for the mangrove/wetland and informal settlement area on the western<br />
side of Figure 8.2 between markers 2449 and 2451 (the Ponta Gea – Cabedelo area) is<br />
management actions such as alternative developments in “safe” areas, zoning and “accept and<br />
retreat”. This area is very low-lying, highly vulnerable to flooding and erosion, with very limited<br />
present infrastructure investment and should preferably be managed as a more natural area, as<br />
portions of this area are still functioning at present. The natural wetland also provides a valuable<br />
natural filtering and nursery habitat ‘ecosystem service’ which is impacted on by the informal<br />
activities.<br />
The landward edge of this mangrove/wetland area (at the edge of the existing formal<br />
development), as indicated by the dashed orange line in Figure 8.2, should eventually be<br />
protected by preferably a rock revetment (or potentially a concrete seawall if affordable). (Note<br />
that this requires a suitable source of rock material, including an adequate stockpile of material<br />
for timeous repairs after damages resulting from extreme events.) As this location is at present<br />
relatively sheltered, the revetment could also be constructed by means of gabions (on rock<br />
mattresses or even sand filled geotextile structures if suitable rock is not readily available). Such<br />
constructions can be significantly cheaper to build than conventional rock revetments, but may<br />
require more maintenance.<br />
Quay walls, warfs, storage areas, transport infrastructure, etc. located in the vicinity of the<br />
existing port infrastructure will have to be raised in stages to an estimated level of at least +7.4 m<br />
MSL by 2100, but this level should be revised (say at 10 year intervals) as more accurate SLR<br />
projections become available in future. The protecting seawalls will have to be similarly raised<br />
where possible, or new walls constructed. The existing infrastructure is already too low at present<br />
(i.e. excluding SLR) and needs to be upgraded and maintained as a matter of urgency (Priority # 3<br />
for Beira). (Note, this recommendation means that the port infrastructure should be upgraded to<br />
deal with CC risks in its present location, including raising the infrastructure in stages, eventually<br />
to above the level of +7.4 m MSL, not that the port should be relocated to landward of the +7.4 m<br />
MSL contour line, which would render it inoperable. The same interpretation goes for the other<br />
ports, e.g. Beira and Nacala.)<br />
October 2012, p 172
Figure 8.3:<br />
Southern Beira. <strong>Adaptation</strong> / coastal protection options based on general criteria, local site<br />
characteristics, current use/ ”value”.<br />
Figure 8.3 shows the recommended adaptation options along the southern Beira coast in more<br />
detail.<br />
The preferred option here is for beach nourishment, i.e. increasing the beach width and volume<br />
by placing additional sand on the beach. The source of this sand feeding should ideally be suitable<br />
sand from the sediment dredged from the entrance channel to the port (maintenance dredging<br />
to maintain shipping access to/from the port). At some locations along the access channel, the<br />
sand reportedly has similar characteristics as the sand of the shoreline (Achimo, pers. com.<br />
2012).) This will result in significant cost savings (compared to alternative dredging from other<br />
marine sediment sources), and will also return “riverine”/coastal sediments to the inshore zone<br />
where a large proportion of it would naturally have been transported to, were it not “artificially”<br />
removed from the area by dredging.<br />
The longshore sediment transport is usually from east to west along this area. (as can be seen by<br />
the accumulation of sand on the eastern side of the existing groynes). Therefore, the sand<br />
feeding should be done in the eastern part of this coastal sector (in the area of the solid green<br />
arrow in Figure 8.3). In this way, the sand can be transported towards the west by the natural<br />
wave and current action, thus eventually nourishing the whole of the southern Beira coastal area<br />
(indicated by the dashed green arrows). (The small photographs indicate the 2 main means of<br />
delivering the sand, namely by “rainbowing” (sand-spraying) directly from the dredger – also see<br />
Figure 7.1 - or by means of pumping and spreading through pipelines – also see Figure 7.2.)<br />
Where shallow areas prevent the dredger from coming close in to the shore, such as some areas<br />
October 2012, p 173
of Maputo and Beira, pumping through pipelines may be required, which is likely to increase the<br />
cost.). At present the beach along much of this area is too narrow to accommodate a sufficiently<br />
wide and high dune to adequately protect landward development. However, after<br />
implementation of the sand feeding scheme and ongoing beach nourishment the beach width<br />
should increase sufficiently to enable a proper managed dune system. A dune of sufficient<br />
volume will greatly bolster the natural resilience of the coast against climate change impacts. The<br />
dune area is indicated by the double green line (dashed).<br />
To enhance the accreted beach width further or potentially “trap” a portion of the alongshore<br />
sand transport, groynes could also be added later if required. The additional beach area thus<br />
“secured” as well as multifunctional structures (e.g. piers/groynes), can provide alternative<br />
coastal development potential, whilst also planning for potential down-drift erosion effects. (This<br />
again requires a suitable source of rock material.)<br />
The large red numbers in the Figures 8.3 and 8.4 indicate the possible order of implementation of<br />
coastal adaptation measures. Thus, it is preliminarily recommended that the sand feeding<br />
scheme should be the 2 nd coastal adaptation measure to be implemented. (The other 4 of the 1 st<br />
five measures to be implemented are indicated in the rest of the figures relating to Beira.)<br />
Figure 8.4:<br />
South-western Beira. <strong>Adaptation</strong> / coastal protection options based on general criteria, local site<br />
characteristics, current use/”value”.<br />
October 2012, p 174
Figure 8.4 shows the recommended adaptation options along the south-western Beira coast in<br />
more detail.<br />
The beach nourishment scheme from the east (Figure 8.4) would continue westward into this<br />
coastal area (alongshore) up to the Ponta Gea area (adjacent to Comandante Gaivao Ruo Do). At<br />
this location a relatively long terminal groyne (i.e. the “last” or “end” groyne in a groyne field)<br />
should be added. This structure should be constructed from concrete or rock if available, as<br />
indicated by the red “4” on the figure. The purpose of this groyne would be to increase the beach<br />
width and to reduce the amount of sand that could potentially be transported into the harbour<br />
entrance channel (by “trapping” a portion of the alongshore sand transport). The additional<br />
beach area thus “secured” as well as a multifunctional structure (e.g. pier/groyne), can provide<br />
alternative coastal development potential, possibly as a PPP initiative associated with a hotel<br />
complex.<br />
To protect the area north-west of this groyne as well as to prevent down-drift erosion effects (on<br />
the western side of the groyne), a 400 m long revetment should be constructed, from concrete or<br />
preferably rock if available, as indicated by the red “5” on Figure 8.4. A small rock revetment is<br />
already present in this area.<br />
Figure 8.5:<br />
South-eastern Beira. <strong>Adaptation</strong> / coastal protection options based on general criteria, local site<br />
characteristics, current use/”value”.<br />
October 2012, p 175
Figure 8.6:<br />
South-eastern Beira. <strong>Adaptation</strong> / coastal protection options based on general criteria, local site<br />
characteristics, current use/”value”.<br />
Figures 8.5 and 8.6 show the recommended adaptation options along the south-eastern Beira<br />
coast in more detail. The preferred option here is for a managed dune (i.e. vegetated and<br />
maintained). (Eventually, as the sea level increases, the dune could also be extended or expanded<br />
into a “dike” type defence measure.) “Managed” includes installing and maintaining effective<br />
people control mechanisms such as providing sufficient (many) formal access pathways across<br />
the foredune and information signage. This is required to prevent the damage and loss of dune<br />
vegetation and resultant loss of dune volume due to wind-blown sand. The initial alongshore<br />
extent of the dune area is indicated by the double green line (dashed).<br />
The dune construction (and enhancement of the existing dune towards the east) should be done<br />
in conjunction with management actions such as coastal development setbacks, zoning and<br />
alternative developments in “safe” areas.<br />
Cost estimates for priority Beira adaptation measures<br />
Cost estimates were made for the two locations which will have the highest adaptation costs<br />
(being the areas where the most infrastructure and development occurs), namely Maputo and<br />
Beira. Based on the foregoing, costs have been estimated roughly for implementation of the<br />
priority adaptation measures as summarized in Table 8.1 below. However, our recommended 1st<br />
priority for Beira is "alternative development in safe location" of the present informal settlement<br />
in the wetland area, and re-zoning of this area (no development and rehabilitation of the<br />
mangroves and wetland; see Figure 8.2. A cost estimate for this adaptation measure has not been<br />
made since there are many external and socio-economic factors which will determine the cost of<br />
October 2012, p 176
implementing such recommendations, versus the direct and indirect benefits (and "future cost<br />
savings"); this could only be properly considered in an in-depth socio-economic study.<br />
8.1.2 Maputo<br />
The short-list of the key adaptation measures found to be most suitable for Maputo includes four<br />
“Management options” (labelled A1 to A4), three “Soft engineering”/Restoration measures (B1,<br />
B2 & B3), four “Hard engineering” & armouring options (C1s, C1r, C2, C5), and two options more<br />
suitable for low/moderate wave energy sites (C11 & C12). (As mentioned before, the focus of this<br />
project is on longer term adaptation measures such as those recommended here. However,<br />
emergency response options/actions, such as marking flood evacuation routes and keeping them<br />
open are also critical response actions in Maputo and all other coastal cities. It appears that the<br />
INGC has already been successful in applying such measures.)<br />
Referring to the discussions in Chapters 5 and 6, the “sea water flooding hazard” levels for the<br />
Maputo and Matola area (Figures 5.33 and 6.3) show that along the semi- exposed and exposed<br />
locations for a 1m sea level rise (by 2100) plus a run-up of +1.5 m during cyclonic events, that<br />
areas below the +6 m contour will be in danger of being flooded. This intermediate flooding level<br />
is appropriate for planning and management of infrastructure along the semi- exposed southwestern<br />
Maputo shoreline, or with a design life of less than 50 years along the exposed southeastern<br />
Maputo shoreline. Taking a conservative and precautionary approach, the low hazard<br />
risk level along the exposed south-eastern Maputo shoreline for important infrastructure with a<br />
design life of more than 50 years (such as ports and airports) is +8.5 m MSL, (based on the<br />
extreme scenario of a +2 m sea level rise along with a 3 m storm run-up level during cyclones).<br />
The recommended adaptation options along parts of the Maputo coast are shown and discussed<br />
in more detail in the following pages.<br />
October 2012, p 177
Possible order of<br />
implementation<br />
Table 8.1: Summary of some adaptation option costs for Beira - coastal construction capital cost estimates (2011).<br />
DESCRIPTION<br />
Approximate<br />
Minimum Costs (excl<br />
tax) for 1km<br />
Approximate<br />
Maximum Costs (excl<br />
tax) for 1km<br />
Approximate length<br />
(or number of)<br />
proposed for Beira<br />
(km)<br />
Approximate<br />
Minimum Costs (excl<br />
tax) for Beira<br />
Approximate<br />
Maximum Costs (excl<br />
tax) for Beira<br />
2 Sand feeding (beach nourishment) new*<br />
$4 000 000 $60 000 000 1 $4 000 000 $60 000 000<br />
@ rate of 300 000 m 3 /a for 10 yrs)<br />
5 Revetments & walls (permeable) $2 300 000 $24 000 000 2.3 $5 290 000 $55 200 000<br />
4 Rock groynes** $1 000 000 $29 200 000 1 $1 000 000 $29 200 000<br />
3 Sheet piling seawall (shore parallel) $2 700 000 $36 000 000 3.5 $9 450 000 $126 000 000<br />
3 Heightening quay walls, berths, other port infrastructure $2 000 000 $25 000 000 3.5 $7 000 000 $87 500 000<br />
POTENTIAL TOTAL COST FOR IMPLEMENTING ALL ABOVE ($) $26 740 000 $357 900 000<br />
NB:<br />
Costs of “management” options (A1 to A4) not included, e.g. relocation, alternative development of infrastructure, etc.<br />
* Actual nourishment to a point by means of either pipelines with booster pumps from dredger quay or possibly distributed by means of dredger rainbowing off beaches<br />
** Cost estimate for 1 long groyne or 2 shorter groynes<br />
October 2012, p 178
Figure 8.7:<br />
Eastern Maputo. Recommended adaptation /coastal protection options<br />
As before, the three or four options or combination of options considered most suitable for each<br />
alongshore section of the coast are indicated on the map in the narrow text blocks adjacent to<br />
each section of the coast. The labels within the alongshore text blocks (e.g. A1 or C5, etc.) refer to<br />
the labelled options described in the large white block. The large red numbers (1 to 4) on the<br />
figures indicate the recommended order of implementation of the identified coastal adaptation<br />
measures for Maputo. In other words, Figure 8.7 and the following Figures 8.8 to 8.10 represent<br />
plans/maps summarising the preferred adaptation options along each section of the Maputo<br />
coast.<br />
As seen in Figures 8.7 and 8.8, there are a lot of areas along the Maputo coastal edge that are<br />
low-lying and thus vulnerable to the effects of climate change. The most vulnerable area in the<br />
short term is the approximately 6 km stretch of coastal road along the beachfront up to the Costa<br />
Do Sol. Management decision-making options (A1, A3 and A4) are mostly the most sustainable<br />
and ultimately less costly options along with a number ‘soft-engineering’ options as indicated in<br />
Figures 8.7 and 8.8.<br />
To combat any existing erosion problems, emphasis should be placed on determining the root<br />
causes of the problem. (This is the best way to ensure that potential solutions are successful, and<br />
could also be more cost effective, more environmentally friendly and sustainable.) Here a<br />
October 2012, p 179
practical solution to the erosion of this important section of coastline is to collaborate with the<br />
Port of Maputo. The port entrance channel is regularly dredged to keep it deep enough. Our<br />
investigations indicate that maintenance dredging that is conducted to facilitate shipping access<br />
to the port, is likely to play a significant part in the erosion. <strong>Coastal</strong> sediments are transported to<br />
the shipping channel by currents and are then deposited in this relatively deeper “trap”.<br />
Figure 8.8:<br />
Eastern Maputo. Recommended adaptation /coastal protection options<br />
The channel is occasionally dredged out and the sediments are disposed of (dumped) in deeper<br />
water away from the shoreline (Figure 8.9; Mather pers com 2009). It seems very likely that if<br />
suitable dredged sediments could rather be returned to the shoreline, this could alleviate the<br />
erosion problems.<br />
A recent investigation by a coastal engineering expert (Dr Andrew Mather) from the Ethekwini<br />
Municipality came to the same conclusions. In the bigger scheme of things, both parties would<br />
benefit significantly by linking the Port Operations (especially the maintenance dredging) to the<br />
municipal coastal protection. The sediments would have to be uncontaminated and of suitable<br />
grain size (not too fine), while suitable means of placing the sand on the shore would be required<br />
(e.g. “rainbowing” where the dredger can get in sufficiently near to the shoreline and/or pumping<br />
– Figures 7.1 and 7.2).<br />
October 2012, p 180
It has also been recently announced that the port is to be upgraded in the near future and this<br />
will most likely also entail dredging more areas of the channel. The suitable sand fraction of the<br />
material dredged during the maintenance work as well as for any future expansion could be<br />
placed along the beachfront by suitable means (Option B1), thereby restoring the natural<br />
sediment feeding process. (Much of the dredged material is reportedly very fine sediment, which<br />
might be unsuitable for beach nourishment (Achimo, pers. com. 2012.) However, selective<br />
utilization of the suitable sediment fraction or deposition areas still leave this as an attractive<br />
option, that should be investigated in detail.) An alternative reservoir of suitable sand might be<br />
the area adjacent to Xefina Island. However, not being a dredging requirement for port access,<br />
this option would probably be more expensive. (Considering the volumes of sand required for<br />
beach nourishment, delivery by mean of trucks is considered impractical in terms of road<br />
congestion, road damage/maintenance, etc.). Combining the sand feeding option with the active<br />
management of the dunes (Option B2) will restore the natural buffer in the area.<br />
Area of sand starvation<br />
DREDGED<br />
SPOIL<br />
AREAS<br />
Dredged spoil<br />
reenters the channel<br />
Sediment input<br />
Port channel<br />
Sediment flow<br />
Figure 8.9 : Sediment transport patterns at Maputo (A Mather, pers com 2009)<br />
October 2012, p 181
Figure 8.10:<br />
Western Maputo. Recommended adaptation/coastal protection options<br />
As can be seen in Figure 8.10, the current port infrastructure is vulnerable to expected climate<br />
change impacts. Options C1s and A4 are the only practical options for this area. Quay walls,<br />
warfs, storage areas, transport infrastructure, etc. located in the vicinity of the existing port<br />
infrastructure will have to be raised in stages. The protecting seawalls will have to be similarly<br />
raised where possible, or new walls constructed. It is recommended that the design of future port<br />
expansion works or refurbishment of the existing infrastructure should include the option of<br />
future heightening of the structures (in stages) to at least the +6 m MSL level and ideally to the<br />
+8.5 m MSL level by 2100. The western portion of the port area (from Point # 3977 westwards in<br />
Figure 8.10) and the river shoreline further inland (# 3978 to # 3980), are not vulnerable to wave<br />
setup and run-up. Potentially, the design flooding level along these areas could be as low as +4.5<br />
m MSL for “sea” flooding events. However, the joint effects of an extreme river flood (not within<br />
the scope of <strong>Theme</strong> 2) with high inshore seawater levels (both resulting from a cyclone) could<br />
foreseeably result in higher flooding levels. It is also more practical to have all port infrastructure<br />
at the same “ground” level where possible. Thus, the +6 m MSL design level is also recommended<br />
for these areas. This level should be revised as accurate river flooding levels and more accurate<br />
SLR projections become available in future. Based on the information available it appears that the<br />
existing infrastructure is already too low in places at present (i.e. excluding SLR) and needs to be<br />
upgraded and maintained as a matter of urgency (Priority # 2 for Maputo).<br />
October 2012, p 182
Cost estimates for the priority Maputo adaptation measures<br />
As mentioned before, cost estimates were made for the two locations which will have the highest<br />
adaptation costs (due to most infrastructure /developed), namely Maputo and Beira. These large<br />
cities should also have relatively more resources available for coastal protection, and as stated<br />
before, this should be linked to port management/maintenance. Based on the foregoing<br />
recommendations, costs have been roughly estimated for implementation of the priority<br />
adaptation measures as summarized in Table 8.2 below.<br />
Note, however, that the costs of "management" options (A1 to A4) are not included (e.g.<br />
relocation, alternative development of infrastructure, etc.) and therefore a cost estimate for<br />
these adaptation measures has not been included in Table 8.2. There are many external and<br />
socio-economic factors which will determine the cost of implementing such recommendations,<br />
versus the direct and indirect benefits (and "future cost savings"); this could only be properly<br />
considered in an in-depth socio-economic study.<br />
8.1.3 Inhambane & Maxixe<br />
Referring to the discussions in Chapters 5 and 6, the “sea water flooding hazard” levels for the<br />
Inhambane and Maxixe area (Figure 6.3) show that for a 1m sea level rise (by 2100) plus a run-up<br />
of +1.5 m during cyclonic events, that areas below the +6 m contour will be in danger of being<br />
flooded. The extensive sandbanks seaward of Inhambane and Maxixe provide partial shelter from<br />
the full extent of wave impacts such as extreme flooding levels. Thus, the intermediate flooding<br />
level of +6 m MSL is appropriate for planning and management of infrastructure along the<br />
shoreline with a design life of less than 50 years. Due to the partial wave sheltering, extreme<br />
wave runup is not expected to exceed the 1.5 m already allowed for in the +6 m MSL flooding<br />
level. However, taking a conservative and precautionary approach, the extreme scenario of 2 m<br />
SLR by 2100 should be considered. Thus, the low hazard risk level for important infrastructure<br />
with a design life of more than 50 years such as airports is +7 m MSL (as the extreme scenario of a<br />
+2 m sea level rise along with a 1.5 m storm run-up level during cyclones).<br />
October 2012, p 183
Possible order of<br />
implementation<br />
DESCRIPTION<br />
Table 8.2: Summary of some adaptation option costs for Maputo -<br />
coastal construction capital cost estimates (2011).<br />
Approximate<br />
Minimum Costs (excl<br />
tax) for 1km<br />
Approximate<br />
Maximum Costs (excl<br />
tax) for 1km<br />
Approximate length<br />
(or number of)<br />
proposed for Maputo<br />
(km)<br />
Approximate<br />
Minimum Costs (excl<br />
tax) for Maputo<br />
Approximate<br />
Maximum Costs (excl<br />
tax) for Maputo<br />
1 Sand feeding (beach nourishment) new*<br />
$4 000 000 $60 000 000 1 $4 000 000 $60 000 000<br />
@ rate of 300 000 m 3 /a for 10 yrs)<br />
3 Revetments & walls (permeable) $2 300 000 $24 000 000 2.7 $6 210 000 $64 800 000<br />
4 Vegetated dune $750 000 $7 200 000 6 $4 500 000 $43 200 000<br />
2.5 Sheet piling seawall (shore parallel) $2 700 000 $36 000 000 8.7 $23 490 000 $313 200 000<br />
2 Heightening quay walls, berths, other port infrastructure $2 000 000 $25 000 000 6 $12 000 000 $150 000 000<br />
POTENTIAL TOTAL COST FOR IMPLEMENTING ALL ABOVE ($) $50 200 000 $631 200 000<br />
NB:<br />
Costs of “management” options (A1 to A4) not included, e.g. relocation, alternative development of infrastructure, etc.<br />
* Actual nourishment to a point by means of either pipelines with booster pumps from dredger quay or possibly distributed by means of dredger rainbowing off beaches<br />
October 2012, p 184
Figure 8.11:<br />
Inhambane. Recommended adaptation /coastal protection options<br />
As can be seen in Figure 8.11, the only real affordable long term option to adapt to the effects of<br />
climate change is to ensure that development is located beyond the reach of the natural<br />
processes (A1). This can be achieved by implementing zoning to prevent development from<br />
taking place below the + 7 m MSL contour level (Priority #1). (For “greenfield” or undeveloped<br />
areas, this more conservative level allowing for 2 m SLR is recommended.) Gradual relocation<br />
(A3) of existing development to alternative safer areas should be included in the Structure Plan<br />
(Priorities #2 and #3). The active rehabilitation (B3) of mangrove areas (Priority #3 and #4) will<br />
form a natural barrier against storm waves and surges (flooding).<br />
Much of the historical area to the north of the town is very low-lying and at serious risk of being<br />
flooded under the climate change factors. Other than retreating from the area (A1 & A3) as the<br />
storm surges become more threatening in time, more costly hard-engineering options (C1s, C1r<br />
and/or C2) will be the only solution in the long run. Options for forming Public-Private-<br />
Partnerships (PPP) type of development could be considered and new developments should be<br />
designed to cater for the climate change factors and also to assist the municipality with the<br />
required adaptation works.<br />
October 2012, p 185
Although the current jetty has recently been upgraded, the raising or reinforcement of areas may<br />
be necessary in the far future (A4).<br />
Of greater concern is the fact that the current international airport is in a low-lying area and<br />
adequate protection of the runway as well as the other infrastructure should be incorporated in<br />
any future redevelopment or upgrading plans (possibly C2 supported by B3 and A4).<br />
(In the greater Inhambane region, there are many coastal lakes around which people live, in some<br />
instances in vulnerable locations. This is however beyond the scope of the present investigation,<br />
which focuses more on specific urban centres and surrounds located along and close to the<br />
influence of forces from the sea).<br />
8.1.4 Tofo and Barra<br />
The “sea water flooding hazard” levels for the Tofo/Barra area (Figure 6.3) show that for a 1m sea<br />
level rise (by 2100) plus a run-up of +1.5 m during cyclonic events, that areas below the +6.5 m<br />
contour will be in danger of being flooded. This intermediate flooding level of +6.5 m MSL is<br />
appropriate for planning and management of infrastructure along the shoreline with a design life<br />
of less than 50 years. The low hazard risk level for important infrastructure is +9 m MSL (rounded<br />
up from 8.9 m MSL) as the extreme scenario of a +2 m sea level rise along with a 3 m storm runup<br />
level during cyclones.<br />
October 2012, p 186
Figure 8.12:<br />
Tofo & Barra. Recommended adaptation /coastal protection options<br />
As can be seen in Figure 8.12, the only real affordable long term option to adapt to the effects of<br />
climate change is to ensure that development is located beyond the reach of the natural<br />
processes (A1 & A3). This can be achieved by implementing zoning to prevent development from<br />
taking place in the hazard zone (Priority #1). For the open Tofo coast, which is exposed to high<br />
wave run-up, this ‘no-development zone’ is typically above the + 9 m MSL contour level and a<br />
minimum of 100 m from the high water mark. (For “greenfield” or undeveloped areas, this more<br />
conservative level allowing for 2 m SLR is recommended.)<br />
Priority #2 is seen as the active rehabilitation of damaged foredunes and the conservation of the<br />
dune vegetation and volume (B2) will ensure that a natural barrier against storm waves and<br />
surges (flooding) is maintained. Gradual relocation of existing low-lying development to<br />
alternative lower risk areas (A1 & A3) should be included in the Structure Plan (Priority #3).<br />
8.1.5 Vilanculos<br />
The “sea water flooding hazard” levels for Vilanculos (Figure 6.3) show that for a 1m sea level rise<br />
(by 2100) plus a run-up of +1.5 m during cyclonic events, that areas below the +6.5 m contour will<br />
be in danger of being flooded. This intermediate flooding level of +6.5 m MSL is appropriate for<br />
October 2012, p 187
planning and management of infrastructure along the shoreline with a design life of less than 50<br />
years. The low hazard risk level for important infrastructure such as airports is +9 m MSL as the<br />
extreme scenario of a +2 m sea level rise along with a 3 m storm run-up level during cyclones.<br />
Figure 8.13a:<br />
Vilanculos. Recommended adaptation /coastal protection options<br />
October 2012, p 188
Figure 8.13b:<br />
Vilanculos. Recommended adaptation /coastal protection options<br />
As can be seen in Figures 8.13a and b, the only real affordable long term option to adapt to the<br />
effects of climate change is to ensure that development is located beyond the reach of the<br />
natural processes (A1 & A3). This can be achieved by implementing zoning to prevent<br />
development from taking place in the hazard zone (Priority #1). For the relatively open Vilanculos<br />
coast, which can be exposed to high wave run-up, this ‘no-development zone’ is typically above<br />
the + 9 m MSL contour level and a minimum of 100 m from the high water mark. (For<br />
“greenfield” or undeveloped areas, this more conservative level allowing for 2 m SLR is<br />
recommended.)<br />
The active rehabilitation of damaged foredunes (B2) and the conservation of the dune vegetation<br />
and volume (Priority #2) will ensure that a natural barrier against storm waves and surges<br />
(flooding) is maintained. Gradual relocation of existing low-lying development to alternative safer<br />
areas (A3) should be included in the Structure Plan.<br />
Options for forming PPP type of developments could be considered and new developments<br />
should be designed to cater for the identified climate change factors and also to assist the<br />
October 2012, p 189
municipality with implementation of the required hard-engineering adaptation works (possibly<br />
C1s, C1r, C5 along with B1). (The offshore islands and San Sebastian Peninsula are important for<br />
tourism income and should be incorporated in any future studies with scope beyond the current<br />
study areas.)<br />
The current fishing harbour area is in need of upgrading and it is recommended that new designs<br />
should allow for the raising and protection of the infrastructure (A4). Ideally the harbour should<br />
be part of the tourist infrastructure and redevelopment as part of a PPP is probably an<br />
appropriate option.<br />
It is important to verify the current estimate that the existing runway at the Vilankulo<br />
International Airport is located above the relevant flooding hazard level (Figure 6.3) where an<br />
adaptation option is possibly C2 in time.<br />
8.1.6 Quelimane<br />
Quelimane is located away from the sea along a river and therefore sea-storm wave forces and<br />
run-up can be ignored. Scouring, inundation and other forces from river flows should be<br />
considered however.<br />
The only effect of climate change is therefore the sea level rise of either 1m or 2 m. The “sea<br />
water flooding hazard” levels for Quelimane (Figure 6.3) show that for a 1m sea level rise (by<br />
2100) during cyclonic events, areas below the +5.5 m contour will be in danger of being flooded.<br />
The safe hazard level for “normal” development is recommended to be +6.5 m MSL and for key<br />
infrastructure such as ports and airports the low hazard risk level should be +8 m MSL.<br />
October 2012, p 190
Figure 8.14:<br />
Quelimane adaptation/coastal protection options<br />
Figure 8.14 shows the recommended first priority action (#1) being the implementation of<br />
adaptation options A1, A2 and B3. In the medium to long terms option C1r, C1s and C2 could be<br />
necessary. The second priority (#2) is to ensure the protection of the port infrastructure by<br />
implementing adaptation options C1s and A3.<br />
Of utmost importance is to reinforce and maintain the natural buffer that the mangroves provide<br />
to the city waterfront area and priority #3 is to protect (A1) and rehabilitate (B3) the area. In time<br />
the existing seawall will have to be reconstructed and/or raised (C1s and A3). Job creation<br />
opportunities for actively rehabilitating and reinstating mangrove swamp areas could be<br />
considered as a PPP (possibly funded through Carbon Trading Mechanisms – this should be<br />
investigated).<br />
October 2012, p 191
8.1.7 Ilha de Moçambique<br />
Figure 8.15:<br />
Ilha de Moçambique recommended adaptation /coastal protection options<br />
Even though the Ilha de Moçambique is partially protected by offshore islands, the low-lying<br />
areas on the island are extremely vulnerable to the effects of climate change. Prioritised action<br />
points are shown in Figure 8.15 although the most sensible adaptation options are A2 and A3.<br />
The design of any redevelopment or rehabilitation activities on the island should allow for<br />
extreme climate change conditions. (Many of the other islands are also especially vulnerable to<br />
climate change impacts, and are important for tourism, etc, for example the Quirimbas<br />
Archipelago located to the north of Pemba. They should be incorporated in any future studies<br />
with scope beyond the current study areas.)<br />
October 2012, p 192
8.1.8 Nacala<br />
Most of the Nacala and Minguri shoreline is relatively well sheltered from the open sea (Figure<br />
8.16). Only very limited ocean wave penetration into the bay is possible from the north, while<br />
only moderate local wave generation inside the bay is possible due to the limited fetch (e.g.<br />
resulting from cyclone winds over the bay). The “sea water flooding hazard” levels for the bay<br />
shorelines of Nacala and Minguri (Figure 6.3) show that for a 1m sea level rise (by 2100) plus<br />
spring high tides and limited local raising of water levels (through barometrics and wind), that<br />
areas below the +6.5 m contour (rounded up from +6.3 m MSL) will be in danger of being<br />
flooded. This intermediate flooding level of +6.5 m MSL is appropriate for planning and<br />
management of infrastructure along the bay shoreline with a design life of less than 50 years.<br />
However, taking a conservative and precautionary approach, the extreme scenario of 2 m SLR by<br />
2100 should be considered. Thus, the low hazard risk level for important infrastructure inside the<br />
bay such as the port and airport with a design life of more than 50 years is +7.5 m MSL.<br />
Only the shoreline outside of the bay (to the north of Fernao Veloso) is relatively exposed to<br />
cyclone waves approaching from the north-east or north. Here, the intermediate flooding level of<br />
+8 m MSL is appropriate for planning and management of infrastructure with a design life of less<br />
than 50 years (allowing for the scenario of a +1 m sea level rise along with a 1.5 m storm run-up<br />
level during cyclones).<br />
October 2012, p 193
Figure 8.16:<br />
Nacala & Minguri adaptation / coastal protection options<br />
As can be seen in Figure 8.16, the only real affordable long term option to adapt to the effects of<br />
climate change is to ensure that development is located beyond the reach of the natural<br />
processes. This can be achieved by implementing zoning to prevent development from taking<br />
place in the hazard zone (Priority #1). The recommended ‘no-development zone’ for the bay<br />
shoreline area is typically above the + 7.5 m MSL contour level and a minimum of 100 m from the<br />
high water mark. (For “greenfield” or undeveloped areas, this more conservative level allowing<br />
for 2 m SLR is recommended.)<br />
Although accurate topography data was not available, the current infrastructure at the port and<br />
the cement factory appears to be somewhat vulnerable to expected climate change impacts.<br />
Options C1s and A4 are the only practical suggestions for this area. It is recommended that the<br />
design of future port expansion works or refurbishment of the existing infrastructure should<br />
include the option of future heightening of the structures (in stages) to at least the +7.5 m MSL<br />
level by 2100. Options for forming PPP type of developments could be considered and new<br />
October 2012, p 194
developments should be designed to cater for the identified climate change factors and also to<br />
assist the municipality with implementation of the required hard-engineering adaptation works.<br />
8.1.9 Pemba<br />
The eastern and northern shores of Pemba outside of the bay (Figure 8.17) are exposed to<br />
cyclone waves approaching from the north-east or north. On first impression it may seem that<br />
the Bay shoreline is well sheltered from wave action. However, of importance is that, due to the<br />
large expanse of water in Pemba Bay (i.e. relatively large wind fetch), the Pemba peninsula<br />
provides only partial protection from cyclonic forces (waves and sea water flooding) when a<br />
cyclone moves inland across Pemba. This has implications for the design of coastal protection<br />
around the port and the shoreline around the whole bay in that significant local water level setups<br />
and local wave run-up can occur. The “sea water flooding hazard” levels for locations inside<br />
Pemba Bay (Figure 6.3) show that for a 1m sea level rise (by 2100) plus a run-up of +1.5 m during<br />
cyclonic events, that areas below the +8 m contour will be in danger of being flooded. This<br />
intermediate flooding level of +8 m MSL is appropriate for planning and management of<br />
infrastructure along the bay shoreline with a design life of less than 50 years. However, taking a<br />
conservative and precautionary approach, the extreme scenario of 2 m SLR by 2100 should be<br />
considered. Thus, the low hazard risk level for important infrastructure inside the bay with a<br />
design life of more than 50 years such as the port is +9 m MSL.<br />
Along the more exposed eastern and northern shores outside of Pemba Bay, the intermediate<br />
safety hazard level of +9 m MSL is appropriate for planning and management of infrastructure<br />
with a design life of less than 50 years (allowing for the scenario of a +1 m sea level rise along<br />
with a 3 m storm run-up level during cyclones.)<br />
October 2012, p 195
Figure 8.17:<br />
Pemba recommended adaptation /coastal protection options<br />
As can be seen in Figure 8.17, the only real affordable long term option to adapt to the effects of<br />
climate change is to ensure that development is located beyond the reach of the natural<br />
processes. This can be achieved by implementing zoning (A1) to prevent development from<br />
taking place in the hazard zone (Priority #1). The ‘no-development zone’ for the bay shoreline<br />
area (# 522 to # 528) is typically above the + 8 m MSL contour level, while outside of Pemba Bay<br />
(Porto Amelia to # 544), the level of +9 m MSL is appropriate, and a minimum of 100 m from the<br />
high water mark in all instances.<br />
Actively rehabilitating and managing the foredunes (adaptation option B2) is also a practical and<br />
inexpensive way to prevent damage to the coastline along the northern and eastern coasts of<br />
Pemba.<br />
Options for forming PPP type of developments could be considered and new developments<br />
should be designed to cater for the identified climate change factors and also to assist the<br />
municipality with implementation of the required adaptation works. This is a particularly practical<br />
option for managing the highly vulnerable area at the north-western tip of the city where the<br />
village of Paquite is regularly threatened by sea inundation. Harbour development in the deep<br />
bay can also boost income to offset coastal protection costs.<br />
Although it might not appear so at first glance, the current infrastructure at the port is relatively<br />
vulnerable to expected climate change impacts in conjunction with a cyclone moving over the<br />
bay. Options C1s and A4 are the only practical suggestions for this area. It is recommended that<br />
October 2012, p 196
the design of future port expansion works or refurbishment of the existing infrastructure should<br />
include the option of future heightening of the structures (in stages) to the +9 m MSL level by<br />
2100. (This level should be revised (say at 10 year intervals) as more accurate SLR projections<br />
become available in future.)<br />
8.2<br />
In addition to the recommendation that the strategic principles and guidelines on planning for<br />
and responding to coastal impacts and including specifically climate change impacts as discussed<br />
in Section 7.1, should be adopted and implemented forthwith, site specific analysis and<br />
recommended prioritised adaptation options for each of the study sites were presented.<br />
Noted is that the specific engineering design details and accurate costing of each option can only<br />
be done once site specific engineering and environmental investigations have been carried out<br />
where it is absolutely critical to involve experienced coastal engineering and coastal<br />
environmental professionals in the detailed planning, design and implementation of the chosen<br />
options.<br />
In most cases sound planning and future development beyond the reach of the sea forces can be<br />
implemented successfully. Many opportunities for entering into PPP exist which has the potential<br />
to co-fund the implementation of the more costly “hard”-engineering adaptation options<br />
October 2012, p 197
CHAPTER 9: INTERACTION WITH MUNICIPALITIES<br />
9.1<br />
9.2<br />
Following a formal workshop/seminar in Maputo organised by the INGC in June 2011, the<br />
researchers along with a senior representative from INGC, visited the municipalities at the key<br />
study sites and engaged with a number of municipal officials and role players responsible for the<br />
technical and/or management aspects of the coastal areas within the specific municipal areas and<br />
the Port of Maputo.<br />
The purpose of the interaction with the municipalities was to achieve the following:<br />
• To discuss the preliminary results of the <strong>Theme</strong> 2 study with relevant municipal officials.<br />
• To reach an understanding on the implications of climate change and the need to influence<br />
and incorporate recommendations into current and future plans.<br />
• To comment on current and future infrastructure and structure plans if available. This was<br />
done during the meeting. Areas where a follow-up note on relevant aspects was needed were<br />
identified.<br />
• To identify existing specialist studies on climate change in order to harmonise<br />
recommendations if possible.<br />
• Site investigation of current coastal protection activities and provide observations if relevant.<br />
The detail and notes from the interaction is provided in Appendix 2.<br />
The following important points and observations were identified:<br />
• The current structure plans of the municipalities do incorporate general environmental issues<br />
but do not specifically consider climate change issues.<br />
• At all meetings the technical staff of the municipality found the information to be relevant for<br />
current and future structure plans and they are willing to use the results of the study for this<br />
propose.<br />
• Common to all the interaction was a request to disseminate the results of the study to a<br />
broader stakeholder base.<br />
• There is a need to obtain validation from the State and the Provinces before implementation<br />
can be achieved. There is therefore a need to engage with the higher level authorities at the<br />
municipality as well as other decision makers so-as to facilitate the successful incorporation of<br />
the findings and recommendations on current and future structure plans.<br />
• There is a critical shortage of skills and management capacity at both a technical and<br />
administrative level and the need for active development and transfer of technology and skills<br />
was highlighted in all cases.<br />
October 2012, p 198
• Various studies and overlapping initiatives are taking place within the study area and the<br />
municipal officials highlighted the need to coordinate and align these to avoid confusion and<br />
to avoid the duplication of efforts and conflicting recommendations.<br />
• Some of the actions required adaptation to climate change can be costly and may not be<br />
supportable by the municipality. It was indicated that there is a high potential for publicprivate<br />
partnerships (PPP) in all coastal municipalities and this type of cost-sharing<br />
mechanisms should be considered in the assessment or request for development proposals.<br />
This forms part of <strong>Theme</strong> 4: Building resilience in partnership with the private sector.<br />
October 2012, p 199
CHAPTER 10:<br />
SUMMARY, CONCLUSION AND<br />
RECOMMENDATIONS<br />
10.1<br />
Mozambique is recognized as one of the countries in <strong>Africa</strong> that is most vulnerable to climate<br />
change. Hazards such as droughts and floods, variable rainfall and tropical cyclones already<br />
significantly affect the country.<br />
The country’s coastal zone is particularly vulnerable to the expected impacts of climate change.<br />
Contributing factors include:<br />
• Vast low-lying coastal plains such as delta coasts;<br />
• High population concentrations in close proximity to the sea;<br />
• Poverty;<br />
• Low capacity to defend infrastructure;<br />
• Susceptibility to cyclone activity;<br />
• Soft erodible coasts; and<br />
• Inadequate and ageing coastal defences.<br />
This situation is aggravated by direct exposure to high wave energy regimes in some parts, a<br />
potential increase in cyclone impacts, and impacted natural coastal defences such as dunes,<br />
mangroves and coral reefs. Large numbers of the local population also rely heavily on goods and<br />
services and economic benefits provided by the coastal zone.<br />
In this regard, the National Institute for Disaster Management (INGC) initiated two studies to<br />
define and locally contextualise important drivers and impacts of climate change in the country.<br />
Phase I, completed in 2009, focused on determining the impacts of climate change on<br />
Mozambique at the macro level. The current project, Phase II, focuses on both the macro and the<br />
micro levels, with an emphasis on the implementation of adaptation measures and providing<br />
strategic and scientific evidence-based guidance for decision-making.<br />
Led by the Mozambican government, the overall goal of the Phase II project is to help protect the<br />
country against the potential impacts of climate change, and to plan for and kick start prevention<br />
through the implementation of adaptation measures at national scale, on the basis of science and<br />
in support of sustainable development.<br />
As such, a multi-disciplinary group of scientists from Mozambique and other institutions<br />
formulated 9 themes to encapsulate the research challenges faced, namely:<br />
October 2012, p 200
• <strong>Theme</strong> 1: Early Warning at a Different Scale<br />
• <strong>Theme</strong> 2: <strong>Coastal</strong> planning and adaptation to mitigate climate change impacts<br />
• <strong>Theme</strong> 3: Cities prepared for climate change<br />
• <strong>Theme</strong> 4: Building resilience in partnership with the private sector<br />
• <strong>Theme</strong> 5: Water – doing More with less<br />
• <strong>Theme</strong> 6: Food – Meeting demands.<br />
• <strong>Theme</strong> 7: Preparing People<br />
• <strong>Theme</strong> 8: Extremes<br />
• <strong>Theme</strong> 9: National Strategy: ‘Climate Change and Disaster Risk Reduction”<br />
While this study is primarily concerned with <strong>Theme</strong> 2, it is closely aligned with <strong>Theme</strong>s 3 and 4,<br />
and addresses the following key questions:<br />
• Where are the most vulnerable areas along the coast, at the local/micro level?<br />
• What will these areas look like, with climate change, in future?<br />
• Which key infrastructure and future investment plans are at risk in these areas?<br />
• What recommendations are in order for planned investments along the coast, with emphasis<br />
on Beira and Maputo?<br />
• What structural coastal protection measures are needed to compensate for the potential<br />
effects of climate change?<br />
• What shoreline management plans are most appropriate for these areas?<br />
• What should be the strategic framework on which all coastal structures and sea defences can<br />
be evaluated?<br />
• What should go into a coastal zone information system?<br />
• What input can be provided for in a coastal management policy?<br />
The INGC also emphasised the need for a pro-active approach to protect lives and infrastructure,<br />
while at the same time finding sustainable solutions that are durable and low cost.<br />
10.2<br />
10.2.1 Drivers of change<br />
In <strong>Theme</strong> 2 the physical factors that influence the risk to coastal infrastructure in current and<br />
future climate scenarios were identified. This included consideration of the current situation<br />
along with future sea-level rise scenarios of 0.5m, 1.0m or 2m by 2100. These are further<br />
considered both with and without taking cyclones into account and the consideration of possible<br />
increases in “storminess” being another component of climate change.<br />
The primary hazards to physical (abiotic) coastal infrastructure related to sea storms and climate<br />
change are:<br />
• Extreme inshore sea water levels resulting in flooding and inundation of low lying areas.<br />
• Changes in cyclone characteristics, winds and local wave regime resulting in direct wave<br />
impacts.<br />
• <strong>Coastal</strong> erosion and under-scouring of, for example, foundations and structures.<br />
• System complexities, thresholds and non-linearities, for example related to sand transport.<br />
October 2012, p 201
• A combination of extreme events, such as sea storms during high tides plus sea level rise, will<br />
have the greatest impacts and will increasingly overwhelm existing infrastructure as climate<br />
change related factors set in time.<br />
The main drivers of change related to the above are thus waves and sea water levels (and to a<br />
lesser extent winds and currents). A detailed discussion can be seen in Chapters 5 and 6.<br />
Definition sketch of the various components leading to extreme inshore sea water<br />
levels (See Figure 5.3 in Chapter 5)<br />
The shoreline response and flooding impact is influenced by coastal parameters/processes such<br />
as: topography, geology, inshore wave action, sea level (including the tidal state and future rise),<br />
bathymetry and foredune volume.<br />
The various components that make up the drivers of shoreline change are shown in the sketch<br />
above.<br />
To be of more use in hazard quantification and ultimately in finding ways of reducing risks and<br />
deriving practical adaptation measures, it is necessary to be able to predict or forecast the coastal<br />
response and severity of impacts. To this end, given the lack of historic data and information<br />
along the Mozambican coastline, three flooding scenarios are defined to establish the hazard<br />
levels at the specific sites in terms of possible flooding due to the various factors associated with<br />
‘normal’ meteorological factors as well as the effects of climate change.To illustrate how the<br />
components of the inshore sea water levels have been calculated for each location, Beira is used<br />
as an example in the figure below.<br />
October 2012, p 202
Worst case scenario for fully exposed shorelines<br />
Intermediate risk case for partially exposed shorelines<br />
Low risk case for sheltered shorelines<br />
Beira coastal flooding and wave run-up levels (see Figure 5.32 in Chapter 5).<br />
These three flooding level scenarios were calculated for each of the study towns and cities as<br />
depicted in the figure below (the 3 bars for each town).<br />
October 2012, p 203
<strong>Coastal</strong> flooding levels for 11 towns/cities (see Figure 6.3 in Chapter 6)<br />
10.2.2 Coarse scale coastal vulnerability assessment<br />
Broadly speaking, the low lying central delta coast areas (e.g. Beira) are very vulnerable in terms<br />
of elevation (see figure below). The highest occurrence of cyclones (very high hazard) is found<br />
along the central parts of Mozambique, tapering off to the south (from roughly Tofo) and also<br />
sharply to the north (from about Ilha de Mocambique).<br />
In terms of wave height (excluding cyclones) the hazard increases slightly from north to south,<br />
with most of the coast subject to moderate offshore wave attack. Due to the particular<br />
bathymetry off Mozambique and (amongst others) the location of tidal nodes, the northern coast<br />
(e.g. Nacala and Pemba) as well as parts of the central coast (e.g. Beira) face the highest tidal<br />
hazard (note that the hazard here is still rated as moderate relative to coastlines in some other<br />
parts of the world where tidal extremes are much higher).<br />
The coarse hazard assessment is useful in comparing vulnerability on a more regional level, and<br />
does give an indication of how some important hazards are spatially distributed.<br />
October 2012, p 204
Coarse overview of hazards and vulnerability of Mozambican coast<br />
(See Figure 6.21 in Chapter 6)<br />
10.2.3 Local / micro scale coastal vulnerability assessment<br />
Analyses were carried out to determine the vulnerability of key coastal cities and towns<br />
(identified by the INGC) to the impact of a range of biophysical change scenarios.<br />
The vulnerability to the forces from the sea of approximately 10 km of shoreline at each site was<br />
assessed by evaluating 14 abiotic parameters against an agreed to set of criteria (see Table 6.1 in<br />
Chapter 6). The vulnerability assessment was done with and without climate change factors, and<br />
also with and without the effect of cyclones.<br />
The figure below summarises the results of the micro scale assessment for 1km coastline<br />
stretches at Beira under the various scenarios (C1 to C4 and D1 to D4) showing overall<br />
vulnerability rating when the 14 parameters in Table 6.1 are combined.<br />
October 2012, p 205
Beira detail vulnerability mapping: Scenarios C & D (See Figure 6.24b in Chapter 6)<br />
Similar total vulnerability maps are available for each of the other study sites, for the 8 scenarios<br />
that include cyclones (i.e. C1 to D4). The figure below shows the detailed coastal vulnerability<br />
comparison of the 12 coastal study sites when the most likely future climate change scenario, C4,<br />
is used. (Scenario C4 considers a 1m sea-level rise by 2100 and includes both the effects of<br />
cyclones and an increase in storminess due to climate change.<br />
October 2012, p 206
A comparison of the vulnerabilities of the 12 study sites under the most likely future<br />
case scenario (C4) (See figure 6.36 in Chapter 6)<br />
Results show that the most vulnerable towns are Ponta do Ouro, Maputo, XaiXai Beach, Tofo,<br />
Villanculos, Beira and Pemba. Beira is identified as the most vulnerable city.<br />
10.2.4 Appropriate adaptation measures<br />
A comprehensive literature review led to the identification of a number of management options<br />
and “soft” and “hard” coastal engineering methods available to protect the shoreline (see<br />
Chapter 7). By considering the coastal processes and characteristics of the study area, and factors<br />
governing suitability for coastal development, various potential response options were identified.<br />
The identified options do not include all possible coastal protection measures/options. The<br />
results together with site investigations allowed coastal engineers to determine the most<br />
appropriate adaptation options to introduce for a particular shoreline (0.5km to 1km) stretch<br />
within the study areas.<br />
Based on the foregoing evaluation consideration and criteria, and including all appropriate<br />
options, the priority adaptation/”no-regret” measures were grouped according to type and<br />
impact, covering the most relevant climate change issues for Mozambique coastal towns and<br />
cities, as summarized in the table below.<br />
October 2012, p 207
Priority adaptation/no-regret measures (see Table 7.6 in Chapter 7)<br />
Key:<br />
(Note, a high CBA (Cost/Benefit Assessment) is taken as a positive indicator, meaning in fact that the<br />
benefits outweigh the costs, and could thus perhaps be stated more logically as BCA (Benefit/Cost<br />
Assessment) in terms of a positive metric. However, to remain consistent with the terminology used in the<br />
other themes, CBA is retained here.)<br />
The results together with site investigations allowed coastal engineers to determine the most<br />
appropriate adaptation options to introduce for a particular area within the study areas.<br />
Following a conservative and precautionary approach, a list of prioritised adaptation response<br />
actions for each town and city was recommended (Chapter 8)<br />
10.3<br />
10.3.1 Integrated coastal planning and management<br />
The adoption and implementation of the strategic principles and guidelines on planning for and<br />
responding to coastal impacts and including specifically climate change impacts, as discussed in<br />
Chapter 7 is seen as the first and most important action point. Most of the response options are<br />
purposefully what can be termed “soft” options or “working with nature”. Following an<br />
integrated coastal planning approach is in line with strategic principles and best practise<br />
guidelines in terms of coastal management and responding to climate change. This simple<br />
October 2012, p 208
management level decision will go a long way in reducing the need for constructing expensive<br />
coastal defences in many instances, especially in the long-term. Activities are, amongst others:<br />
• Plan any coastal construction so that it is a safe distance away from the high-water mark and<br />
reinstate natural defence mechanisms with the necessary environmental authorisations.<br />
• Undertake holistic planning and implementation through the development and<br />
implementation of <strong>Coastal</strong> Management <strong>Programme</strong>s that incorporate Shoreline Management<br />
Plans.<br />
• Establish a coastal development setback line which is designed to protect both the natural<br />
environment from encroachment from buildings as well as protecting beachfront<br />
developments from the effects of storms and accelerated coastal erosion.<br />
• Work with nature by protecting the integrity of buffer dune systems, which should be<br />
vegetated with appropriate dune species as per the original natural zones and maintained.<br />
• Maintain, or even better, increase the sand reservoir (volume) stored in the dune system.<br />
• <strong>Protection</strong>, restoration and maintenance of natural systems like mangroves and coral reefs.<br />
10.3.2 Site specific adaptation options<br />
To illustrate the assessment approach and the way the results are presented for each study site,<br />
the city of Beira is used as the example below. The results for the other study sites are presented<br />
in a similar manner in Chapter 8.<br />
<strong>Adaptation</strong> / coastal protection options based on general criteria, local site<br />
characteristics and current use/”value” for Beira. (See Figure 8.1 in Chapter 8)<br />
October 2012, p 209
The key adaptation measures found to be appropriate for Mozambique is summarised in the<br />
large white block in the figure, which include four “Management options” (labelled A1 to A4),<br />
three “Soft engineering”/Restoration measures (B1, B2 & B3), four “Hard engineering” &<br />
armouring options (C1s, C1r, C2, C5), and two options more suitable for low/moderate wave<br />
energy sites (C11 & C12).<br />
The three or four options or combination of options considered most suitable for each 0.5 km<br />
alongshore section of the coast at Beira are indicated in the small white block adjacent to each<br />
marker on the map. The labels within each small block (e.g. A1 or C5, etc.) refer to the labelled<br />
options described in the large white block.<br />
The large red numbers (1 to 4) on the figures indicate the recommended order of<br />
implementation of the identified coastal adaptation measures for Beira. In other words, Figure<br />
8.1 represents a “plan” or “map” summarising the preferred adaptation options along each 0.5<br />
km section of the western, southern and south-eastern Beira coast.<br />
It should be noted that specific engineering design details and accurate costing of each option can<br />
only be done once site specific engineering and environmental investigations have been carried<br />
out. It is absolutely critical to involve experienced coastal engineering and coastal environmental<br />
professionals in the detailed planning, design and implementation of the chosen options.<br />
10.3.3 Seek opportunities for public-private-partnerships (PPP)<br />
In many cases sound planning and future development beyond the reach of the sea forces can be<br />
implemented successfully. Many opportunities for entering into ‘design-&-build’ type PPP exist<br />
which have the potential to co-fund the implementation of the more costly “hard”-engineering<br />
adaptation options.<br />
10.3.4 Continue active engagement and communication with stakeholder to<br />
disseminate the outputs and facilitate uptake<br />
Observations by the study team during interaction with stakeholder groups at various levels of<br />
authority leads to the following recommendations presented for consideration:<br />
The recommendations fall into three categories, namely (a) those that relate to the various<br />
decision-makers, (b) those at a more technical/scientific level, and (c) those that relate to<br />
decision-making.<br />
(a) Leadership aspects<br />
The following actions can be implemented immediately and maintained on an ongoing basis:<br />
1. Local leaders (Authorities as well as Traditional) should be encouraged to respect the fact<br />
that climate change may lead to a threat to lives, livelihoods and infrastructure.<br />
October 2012, p 210
2. Leaders should be encouraged to endorse the adoption and application of the strategic<br />
principles and best practice guidelines for adaptation measures (Section 7.1) in all<br />
Integrated <strong>Coastal</strong> Zone Management, coastal governance and planning of coastal<br />
developments.<br />
3. Leaders should be encouraged to implement the prioritised “no-regret” adaptation<br />
measures as soon as possible. In most cases this means adhering to sound planning and<br />
design principles.<br />
4. Leaders should be encouraged to incorporate the results of the studies into the current<br />
and future plans such as municipal structure plans and public and privately funded<br />
development plans.<br />
5. Leaders should be encouraged to consider following a PPP approach to obtain co-funding<br />
for the more costly but critically important adaptation measures.<br />
(b) Technical and scientific aspects<br />
The following technical and scientific aspects are recommended for immediate implementation<br />
over the next 6 to 12 months:<br />
1. Due to the importance of knowing the actual elevation of the identified high risk areas, it<br />
is of utmost importance to carry out detailed topographic surveys of the coastal strip in<br />
all towns and cities.<br />
2. The current municipal structure plans and other development planning along the<br />
coastline should be updated to incorporate the identified climate change factors.<br />
3. Approved coastal development plans should be revised to ensure the relevant climate<br />
change related factors are taken into consideration and that private developers are<br />
aware of the potential risk of not taking a precautionary approach. (Tourism could be one<br />
of the sources of income for implementation of adaptation measures.)<br />
4. A formal system for monitoring, evaluating, and reporting on the key parameters<br />
identified in this study should be set up and maintained by a competent authority.<br />
(c) Knowledge dissemination and decision Support<br />
To enable informed, evidence based decision-making, the following actions can be implemented<br />
within 12 to 24 months:<br />
1. Develop decision support tools such as maps, GIS database, reports and practical rulebased<br />
guidelines for use by the coastal management community at National, Provincial<br />
and Municipal levels.<br />
October 2012, p 211
2. Carry out a process to effectively disseminate results of this study at National, Provincial<br />
and Municipality levels. Also, embark on an information and education drive to raise<br />
wider local population awareness.<br />
3. Establish a regional extension/advisory service. This can possibly be done via the INGC<br />
regional offices supported by relevant scientific, engineering and technological expertise<br />
located at the universities, relevant Ministries and in partnership with regional and<br />
international service providers until a national capability is established.<br />
4. Introduce formal climate change adaptation related skills development programmes at<br />
all decision support levels (Management, Administration and Technical levels).<br />
(Early warning systems (e.g. via cell phones), emergency response plans and measures for<br />
extreme events, such as cyclones, are not the focus of this investigation, but are obviously also of<br />
critical importance. The INGC has demonstrated good foresight and implementation in this<br />
regard in the past.)<br />
10.4<br />
10.4.1 Establish a baseline<br />
Following on the present Phase II work, it is expected that there will be an implementation phase.<br />
In any follow up phase of work, it is essential to include as priority additional data collection and<br />
monitoring to address the critical gap in regional, national and local level data and information<br />
required to increase the level of confidence in the key sets of information on which the<br />
adaptation measures identified in this study are based.<br />
The parameters and issues which should be monitored include the following:<br />
Cyclone characteristics – done when appropriate.<br />
Winds and local wave regime (and sea storms) – ongoing.<br />
Inshore sea water levels ( tides and sea level trends) - ongoing<br />
• Shoreline stability and trends (erosion/accretion)- a baseline survey as soon as possible<br />
followed by repeat surveys every three to five years, and after each major cyclone.<br />
• Integrity of built coastal defences/structures - a baseline survey followed by repeat surveys<br />
every three to five years. This should be a critical input into an effective infrastructure<br />
maintenance plan.<br />
• Integrity of natural coastal defences (dunes, mangroves, coral reefs, wetlands) – a baseline<br />
followed by regular repeats as appropriate. This should also be a critical input into an effective<br />
maintenance and wider integrated coastal zone management plan.<br />
• It is of utmost importance to collect sufficiently detailed topographic and bathymetric data at<br />
identified priority areas. This can mostly be a “once off” baseline data collection task, but<br />
should be repeated at longer intervals, perhaps every 10 years for the topographic data, or<br />
immediately after any major change caused by, for example, a cyclone that will then form the<br />
new baseline.<br />
As far as can be determined, the first three items (indicated by a tick) are being monitored to<br />
some degree or can be derived indirectly from existing monitoring actions. However, the last four<br />
October 2012, p 212
items (indicated by a square dot) are not being monitored (as far as it is known). These items are<br />
also critical for any proper integrated coastal zone management and sustainable coastal<br />
developments assessments and plans. Thus, it is strongly recommended that actions be taken to<br />
ensure that effective monitoring of all the above mentioned parameters is undertaken.<br />
As indicated, while some of the parameters need to be collected at very short time intervals (e.g.<br />
sub-hourly wind data), others need only be collected every few years (e.g. topographic data).<br />
10.4.2 Ongoing monitoring, evaluation, dissemination and response<br />
Building onto the recommendation on decision-support that arose through the interaction with<br />
stakeholder groups, it is considered of strategic and tactical importance to implement a national<br />
programme of ongoing monitoring and reporting of key environmental indicators that are<br />
relevant to the climate change parameters identified during this study.<br />
The INGC has a well established and proven network for near real-time information gathering,<br />
evaluation and response during the lead up and in emergency events, such as cyclones, floods,<br />
fires etc. It is therefore recommended that a complementary network for data gathering,<br />
evaluation and information dissemination regarding climate change effects, possible trends in the<br />
identified hazard drivers, potential threshold changes (or “tipping points”) and resulting impacts<br />
to build up the scientific database and knowledge on which informed decisions can be made be<br />
set up as soon as possible.<br />
October 2012, p 213
CHAPTER 11:<br />
REFERENCES<br />
Ahrens, J., Seelig, W., 1996. Wave run-up on beaches. Proceedings of the 25th International Conference on<br />
<strong>Coastal</strong> Engineering, American Society of Civil Engineers, vol. 1, pp 981 – 993.<br />
Arthurton R (2003). The Fringing Reef Coasts of Eastern <strong>Africa</strong> - Present Processes in Their Long-term<br />
Context. Western Indian Ocean J. Mar. Sci. Vol. 2, No. 1, pp. 1–13, WIOMSA.<br />
Battjes, J.A. (1971). Runup distributions of waves breaking on slopes. Journal of the Waterways, Harbours<br />
and Coasts Engineering Div., ASCE, Vol. 97, No WWI, pp 91-114.<br />
Bentley CR (1997). Rapid sea-level rise soon from West Antarctic Ice Sheet collapse? Science (Washington).<br />
Vol. 275, no. 5303, pp. 1077-1079.<br />
Booij, N., R. Ris and L. Holthuijsen (1999). A third-generation wave model for coastal regions, Part I, Model<br />
description and validation. Journal of Geophysical Research 104 (C4): 7649{7666. 1, 5<br />
Boruff BJ, Emrich C and Cutter SL (2005). Erosion hazard vulnerability of US <strong>Coastal</strong> Counties. Journal of<br />
<strong>Coastal</strong> Research, 21(5); 932-942.<br />
Breetzke, T., Parak, O., Celliers, L., Mather, A., Colebrander D. (Eds.), 2008. Living with coastal erosion in<br />
KwaZulu-Natal: A Short-term best practice guide. KwaZulu-Natal Department of Agriculture and<br />
Environmental Affairs, Cedara, Pietermaritzburg.<br />
Brinkmann B (2010). Water levels, tides and wind waves. Presentation and course notes for Short Course on<br />
<strong>Coastal</strong> Engineering, University of Stellenbosch, Stellenbosch, South <strong>Africa</strong>.<br />
Bruno M S (1999). Re: Beach face dewatering. Personal E mail to "coastal_list" server 22/3/99. Dept. Civil,<br />
Environmental and Ocean Eng., Stevens Institute of Technology, New Jersey.<br />
Bruun P (1988). The Bruun rule of erosion by sea-level rise: a discussion on large-scale two and threedimensional<br />
usages. Journal of <strong>Coastal</strong> Research, Vol. 4, No. 4, 627-648. Charlottesville<br />
(Virginia), USA.<br />
Bruun, P. (1989). The <strong>Coastal</strong> Drain: What Can It Do or Not Do? Journal of <strong>Coastal</strong> Research, Vol. 5, No. 1<br />
(Winter, 1989), pp. 123-125<br />
Carlson A, 2011. University of Wisconsin-Madison (2011, July 28). Sea level rise less from Greenland, more<br />
from Antarctica, than expected during last interglacial. Science Daily. Retrieved December 12,<br />
2011, from http://www.sciencedaily.com/releases/2011/07/110728144727.htm<br />
Cazenave A and Nerem RS (2004). Present-day sea level change: observations and causes. Reviews of<br />
Geophysics, 42(3), RG3001, doi:10.1029/2003RG000139.<br />
Church, J.A., J.M. Gregory, N.J. White, S.M. Platten, and J.X. Mitrovica. 2011. Understanding and projecting<br />
sea level change. Oceanography 24(2):130–143, http://dx.doi.org/10.5670/oceanog.2011.33<br />
Church JA and White NJ (2006). A 20th century acceleration in global sea-level rise, Geophys. Res. Lett., 33,<br />
L01602.<br />
Coelho, C., Silva, R., Gomes, F.V., Pinto, F.T., 2006. A vulnerability analysis approach for the Portuguese west<br />
coast.<br />
Combe, A. J., J. R. Lesnik, J. H. Lockhart, E. E. Nelson, and J. G. Housley. (1989). Shoreline Erosion Control<br />
Demonstration Program Revisited. Office of the Chief of Engineers. U.S. Army Corps of<br />
Engineers, 20 Massachusetts Avenue, NW, Washington, DC.<br />
Davidson-Arnott R (2003). Modelling the Response of Sandy Coasts to Sea-Level Rise. Proc. Canadian<br />
<strong>Coastal</strong> Conference 2003. pp 8<br />
October 2012, p 214
Davidson-Arnott R.G.D. (2005). Conceptual Model of the Effects of Sea Level Rise on Sandy Coasts. Journal<br />
of <strong>Coastal</strong> Research, Vol. 21, No. 6 (Nov., 2005), pp. 1166-1172+1193 Published by: Allen Press.<br />
Dean, R G, Davis R A and Erickson K M (2006). Beach Nourishment with Emphasis on Geological<br />
Characteristics Affecting Project Performance. In: Beach Nourishment: A Guide for Local<br />
Government Officials. NOAA <strong>Coastal</strong> Services Center, USA.<br />
Deltares (2010). Delft3D-WAVE. Simulation of short-crested waves with SWAN; User Manual April 2010.<br />
Department of Agriculture and Environmental Affairs, KZN (DAEA, KZN) (2008) Living with coastal erosion:<br />
A short-term best practice guide. Prepared by DAEA, KZN, South <strong>Africa</strong>.<br />
Dutrieux, E., Canovas, S., Denis, J., Henocque, Y., Quod, J.P. and Bigot, L., 2000. Guidelines for vulnerability<br />
mapping of coastal zones in the Indian Ocean. UNESCO.<br />
ESA website. Earth Observation. Product Control Service. ERS Cyclone Tracking. European Space Agency<br />
(ESA): http://earth.eo.esa.int/pcs/ers/cyclones/study/<br />
FEMA (2000). <strong>Coastal</strong> Construction Manual: Principles and Practices of planning, Siting, Designing,<br />
Constructing, and Maintaining Buildings in <strong>Coastal</strong> Areas. Federal Emergency Management<br />
Agency, FEMA Manual 55. Jessup, MD<br />
Fletcher CH, 2009. Sea level by the end of the 21st century: A review. Shore & Beach Vol. 77, No. 4 Fall<br />
2009.<br />
Goda, Y (2000). Random Seas and Design of Maritime Structures - 2nd Edition. Advanced Series on Ocean<br />
Engineering - Volume 15. ISBN-13 978-981-02-3256-6<br />
Gregory JM (2004). Threatened loss of the Greenland ice-sheet. Nature, vol. 428, issue 616, p 257<br />
Guza, R.T. and Thornton, E.B. (1982). Swash oscillations on a natural beach. Journal of Geophysical Research<br />
87: 483 – 491.<br />
Houghton J (2005). Global warming. Rep. Prog. Phys. 68 (2005) 1343–1403<br />
IPCC (Intergovernmental Panel on Climate Change) (2001). Climate Change 2001: The scientific basis.<br />
Contribution of Working Group I to the Third Assessment Report. Cambridge University Press.<br />
IPCC (2007). Climate Change 2007: The Physical Science Basis, Summary for Policymakers. Contribution of<br />
Working Group I to the Fourth Assessment Report of the Intergovernmental Panel on Climate<br />
Change, 21 pp, Geneva. Downloaded from http://www.ipcc.ch on February 21, 2007.<br />
IPCC (2011). Special Report on Managing the Risks of Extreme Events and Disasters to Advance Climate<br />
Change <strong>Adaptation</strong>, Summary for Policymakers, approved and released Nov. 18, 2011.<br />
Jenkins S A and Bailard J A (1989). Anti sedimentation system for harbours. WWS, Feb/March 1989: 70 75.<br />
Jiménez, J., 2008. <strong>Coastal</strong> vulnerability assessment for multiple hazards, LIM Universitat Politècnica de<br />
Catalunya. Proceedings of the 31st International Conference on <strong>Coastal</strong> Engineering, ASCE,<br />
Hamburg<br />
Jiménez, J. A., Ciavola, P., Balouin, Y. Armaroli, C. Bosom, E., Gervais, M., 2009. Geomorphic coastal<br />
vulnerability to storms in microtidal fetch-limited environments: application to NW<br />
Mediterranean and N Adriatic Seas. Journal of <strong>Coastal</strong> Research, Special Issue 56 (Proceedings of<br />
International <strong>Coastal</strong> Symposium 2009, Portugal).<br />
Joubert, A. M. and Hewitson, B. C. (1997). Simulating present and future climates of southern <strong>Africa</strong> using<br />
general circulation models. Progr. Phys. Geogr. 21, 51–78.<br />
JTWC (1997). 1997 Annual Tropical Cyclone Report. U.S. Naval Pacific Meteorology and Oceanography<br />
Center West. Joint Typhoon Warning Center.<br />
October 2012, p 215
JTWC (2009). Annual Tropical Reports of 1997 to 2008 from the Joint Typhoon Warning Centre (JTWC); U.S.<br />
Naval Pacific Meteorology and Oceanography Center West.<br />
Kamphuis JW, 1999. Wave Generation Calculation Software; Copyright J.W. Kamphuis, December 1999.<br />
Karsten Mangor (2008). Encora coastal wiki portal<br />
(http://www.coastalwiki.org/coastalwiki/Wave_transformation)<br />
Komar, P.D., Allan, J.C. (2008). Increasing Hurricane-Generated Wave Heights along the U.S. East Coast and<br />
Their Climate Controls. Journal of <strong>Coastal</strong> Research, Vol. 24, No. 2.<br />
Mather AA (2008). Sea Level Rise for the East Coast of Southern <strong>Africa</strong>. COPEDEC VII, 2008, Paper No: M-04;<br />
Dubai, UAE. 11p<br />
Mather AA, Garland GG and Stretch DD, 2009. Southern <strong>Africa</strong>n sea levels: corrections, influences and<br />
trends. <strong>Africa</strong>n Journal of Marine Science 2009, 31(2), ISSN 1814–232X EISSN 1814–2338<br />
Mather AA, Stretch D and Garland G (2011). Predicting Extreme Wave Run-Up on Natural Beaches for<br />
<strong>Coastal</strong> Planning and Management. <strong>Coastal</strong> Engineering Journal, Vol. 53, No. 2 (2011) 87–109;<br />
World Scientific Publishing Company and Japan Society of Civil Engineers; DOI:<br />
10.1142/S0578563411002288<br />
Mavume, A. F., Lars Rydberg, Mathieu Rouault and Johann R.E. Lutjeharms, 2009. Climatology and Landfall<br />
of Tropical Cyclones in the South-West Indian Ocean. Western Indian Ocean J. Mar. Sci. Vol. 8,<br />
No. 1 ,pp. 15–36, 2009; WIOMSA<br />
Milne G A, W. Roland Gehrels, Chris W. Hughes and Mark E. Tamisiea. 2009. Identifying the Causes of Sealevel<br />
Change - Sea Level Review Postscript. Nature Geoscience Letters, 2009,<br />
www.nature.com/naturegeoscience; Macmillan Publishers Limited.<br />
Mori, N., Yasuda, T., Mase, H., Tom, T., Oku, Y. (2010). Projection of Extreme Wave Climate Change under<br />
Global Warming. Hydrological Research Letter, Vol. 4.<br />
NCCOE (2004). Guidelines for Responding to the Effects of Climate Change in <strong>Coastal</strong> and Ocean<br />
Engineering. The National Committee on <strong>Coastal</strong> and Ocean Engineering. Institution of Engineers<br />
Australia, Barton. Pp 12-13.<br />
Nicholls RJ and Cazenave A, Sea-Level Rise and Its Impact on <strong>Coastal</strong> Zones. Science 328, 1517 (2010);DOI:<br />
10.1126/science.1185782<br />
Nielsen P and Hanslow DJ (1991) Wave run-up distributions on natural beaches. Journal of <strong>Coastal</strong> Research<br />
7(4): 1139-1152<br />
Obura DO (2005). Resilience and climate change: lessons from coral reefs and bleaching in the Western<br />
Indian Ocean. Estuarine, <strong>Coastal</strong> and Shelf Science, Vol 63, Issue 3: 353-372.<br />
Ogden M R and Wiesman R N (1991). Beach stabilization using drains an experimental model study.<br />
<strong>Coastal</strong> Sediments '91: 1955 1969.<br />
Overland, J.E. 2011. Potential Arctic change through climate amplification processes. Oceanography<br />
24(3):176–185, http://dx.doi.org/10.5670/oceanog.2011.70.<br />
Parks J M (1991). New "dredging" technology for inlets and beaches: move sand to the pump. <strong>Coastal</strong><br />
Sediments '91: 1943 1954.<br />
Parks J M (1992). Patent developments (including fluidization). Inlet & Beach, Newsletter #5, Vol.2 no.2,<br />
Winter 1992, Florida.<br />
Pfeffer, W., Harper, J. and O’Neel, S. (2008). Kinematic constraints on glacier contributions to 21st-century<br />
sea-level rise. Science 321, 1340–1343. (doi:10.1126/science.1159099)<br />
Pfeffer, W. T., Harper J. T., O’Neel S., Science 321, 1340 (2008).<br />
October 2012, p 216
PIANC (2008). Waterborne transport, ports and waterways: A review of climate change drivers, impacts,<br />
responses and mitigation. EnviCom – Task Group 3, PIANC.<br />
Pierson, WJ, Neumann, G and James, RW (1955). Practical Methods for Observing and Forecasting Ocean<br />
Waves by Means of Wave Spectra and Statistics. Washington, US, Navy Hydrographic Office,<br />
Publication No. 603.<br />
Rahmstorf S, Cazenave A, Church JA, Hansen JE, Keeling RF, Parker DE, Somerville RCJ (2007). Recent<br />
Climate Observations Compared to Projections. SCIENCE VOL 316 4 MAY 2007 p709.<br />
www.sciencemag.org Published online 1 February 2007; 10.1126/science.1136843<br />
Rossouw, C (1999). The Probability of Occurrence and the Intensity of Tropical Cyclones along the Southern<br />
<strong>Africa</strong>n East Coast. Thesis prepared for Master’s degree in Civil Engineering. University of<br />
Stellenbosch.<br />
Rossouw, J and Rossouw, M., 1999. Re-evaluation of recommended design wave methods. Proceedings of<br />
the 5th International Conference on <strong>Coastal</strong> and Port Engineering in Developing Countries<br />
(COPEDEC), Cape Town, South <strong>Africa</strong>.<br />
Ruggiero, P., Komar, P.D., McDougal, W.G., Marra, J.J., Beach, R.A., 2001. Wave run-up, extreme water<br />
levels and the erosion of properties backing beaches, Journal of <strong>Coastal</strong> Research 17 (2): 407 –<br />
419.<br />
Ruggiero, P., Komar, P.D., Allan, J.C. (2010). Increasing Wave Heights and Extreme Value Projections: The<br />
Wave Climate of the U.S. Pacific Northwest. <strong>Coastal</strong> Engineering, Vol. 57.<br />
Saenko, O. A., Fyfe, J. C. and M. H. England (2005) On the response of the oceanic wind-driven circulation to<br />
atmospheric CO2 increase. Climate Dynamics, 25, 415-426.<br />
Smith AM, Guastella LA, Bundy SC and Mather AA (2007). Combined marine storm and Saros spring high<br />
tide erosion events along the KwaZulu-Natal coast in March 2007. S. Afr. J. Sci. 103, 274–276.<br />
SMITH, A.M., MATHER, A.A., BUNDY, S.C., COOPER, J.A.G., GUASTELLA, L.A., RAMSAY, P.J., THERON, A,K.,<br />
2010. Contrasting styles of swell-driven coastal erosion: examples from KwaZulu-Natal, South<br />
<strong>Africa</strong>. Geol. Mag.: Cambridge University Press. doi:10.1017/S0016756810000361<br />
SNH (2000). A guide to managing coastal erosion in beach/dune systems. Scottish Natural Heritage.<br />
Souirji, 1997. Soils and Terrain database for Mozambique, scale 1:1.000.000. FAO consultant report.<br />
Stive MJF, Nicholls RJ, De Vriend HJ (1991). Sea-level rise and shore nourishment: a discussion. <strong>Coastal</strong><br />
Engineering, Vol. 16, No.1:147-163.<br />
Stockdon, H.F., Holman, R.A., Howd, P.A., Sallenger, A.H., 2006. Empirical parameterization of setup, swash,<br />
and run-up, <strong>Coastal</strong> Engineering 53 (7): 573 – 588.<br />
SWIPA, 2011. 2011 Snow, Water, Ice and Permafrost in the Arctic (SWIPA) assessment - coordinated by<br />
AMAP and produced in collaboration with IASC, WMO/Clic and IASSA - Executive Summary<br />
http://amap.no/swipa/SWIPA2011ExecutiveSummaryV2.<strong>pdf</strong><br />
Theiler ER and Hammar-Klose ES (2000). National Assessment of <strong>Coastal</strong> Vulnerability to Future Sea-Level<br />
Rise: preliminary Results for the US Gulf of Mexico Coast. US Geological Survey, Open-File Report<br />
00-179. Online at: http://pubs.usgs.gov/of/of00-179/<br />
Theiler, E.R.; PILKEY, O.H., JR.; YOUNG, R.S.; BUSH, D.M.; and CHAI, F. (2000). The Use of Mathematical<br />
Models to Predict Beach Behavior for U.S. <strong>Coastal</strong> Engineerings: A Critical Review. Journal of<br />
<strong>Coastal</strong> Research, 16(1), 48-70. Royal Palm Beach (Florida), ISSN 0749-0208.<br />
Theron AK (1994). Sea level rise, impacts and the use of Bruun’s erosion rule. J SA Inst Civ Eng, Vol 36, No 3,<br />
Fourth Quarter 1994: 6-10.<br />
October 2012, p 217
Theron, A.K., Coppoolse, R.C. and Schoonees, J.S. (1994) Low-cost coastal protection measures using<br />
textiles. Proceedings 28th International Navigation Congress (PIANC), Seville, Spain. Section II -<br />
Subject 4, pp109-118.<br />
Theron, A K, Schoonees, J S and Manini, D (1999). Successful prototype testing of low-cost dike/beachwall<br />
protection. Proceedings, International Conference on <strong>Coastal</strong> Structures ’99, ASCE, Santander,<br />
Spain. Vol. 2: 1027 – 1035.<br />
Theron, A K (2000). Recession Line Evaluations. CSIR Report ENV-S-I 2000-02<br />
Theron AK (2007). Analysis of Potential <strong>Coastal</strong> Zone Climate Change Impacts and Possible Response<br />
Options in the Southern <strong>Africa</strong>n Region. Proceedings IPCC TGICA Conference: Integrating<br />
Analysis of Regional Climate Change and Response Options; Nadi, Fiji, June, 2007. p 205-216<br />
Theron A K (2008). Beach Erosion Study Northern Beaches Umhlathuze Municipality. CSIR Report<br />
CSIR/NRE/ECO/ER/2008/0109/C. Stellenbosch, South <strong>Africa</strong>.<br />
Theron A K and Rossouw M (2009). Aspects of Potential Climate Change Impacts on Ports & Maritime<br />
Operations around the Southern <strong>Africa</strong>n Coast. Proceedings - UNCTAD Intergovernmental Expert<br />
Meeting on “Maritime Transport and the Climate Change Challenge”; First Expert Meeting on<br />
climate change and maritime transport issues. Geneve, Switzerland.<br />
Theron, A.K., Rossouw, M., Barwell, L., Maherry, A., Diedericks, G., De Wet, P. (2010). Quantification of risks<br />
to coastal areas and development: wave run-up and erosion. CSIR 3rd Biennial Conference 2010.<br />
Science Real and Relevant, CSIR International Convention Centre, Pretoria 30 August – 01<br />
September 2010, South <strong>Africa</strong>. http://hdl.handle.net/10204/4261.<br />
Theron AK, Marius Rossouw, Laurie Barwell, Ashton Mahery. 2011. “<strong>Adaptation</strong> Measures & <strong>Coastal</strong><br />
<strong>Protection</strong> Options in Response to Climate Change Impacts in the <strong>Coastal</strong> Zone of the Southern<br />
WIO Region.” Conference on Climate Change Impacts, <strong>Adaptation</strong> and Mitigation in the WIO<br />
region: Solutions to the Crisis; Grand Baie, Mauritius. 21-23 March 2011.<br />
Theron AK. 2011. Climate change, sea level rise and the southern <strong>Africa</strong>n coastal zone: A general revue of<br />
causes, consequences and possible responses. In: Observations on Environmental Change in<br />
South <strong>Africa</strong>, Zietsman L (ed), p 174-177. South <strong>Africa</strong>n Environmental Observation Network,<br />
Pretoria. 303 pp. Downloadable from: http://www.africansunmedia.co.za/<br />
Thomas R, Rignot E, Casassa G, Kanagaratnam P, Acuña C, Akins T, Brecher H, Frederick E, Gogineni P,<br />
Krabill W, Manizade S, Ramamoorthy H, Rivera A, Russell R, Sonntag J, Swift R, Yungel Y and<br />
Zwally J (2004). Accelerated Sea-Level Rise from West Antarctica. Science Magazine, 8 October<br />
2004, pp. 255 – 258<br />
Tol RSJ (2004). The Double Trade-Off between <strong>Adaptation</strong> and Mitigation for Sea Level Rise: An Application<br />
of FUND. FNU-48 (submitted), Research Unit Sustainability and Global Change, Hamburg<br />
University and Centre for Marine and Atmospheric Science.<br />
Turner I L and Leatherman S P (1997). Beach dewatering as a "soft" engineering solution to coastal erosion<br />
a history and critical review. Journal of <strong>Coastal</strong> Research, 13 (4), pp. 1050 1063.<br />
UK Hydrographic Office (2007). Admirality Tide Tables Vol 3 2008, United Kingdom Hydrographic Office,<br />
2007<br />
USACE (1984). Shore protection manual (SPM). Department of the Army, U S Army Corps of Engineers,<br />
CERC, Vicksburg, Mississippi. Vol. 1.<br />
USACE 2011. SEA-LEVEL CHANGE CONSIDERATIONS FOR CIVIL WORKS PROGRAMS. DEPARTMENT OF THE<br />
ARMY, EC 1165-2-212, U.S. Army Corps of Engineers (USACE), CECW-CE Washington, DC, 20314-<br />
1000<br />
U. S. Army <strong>Coastal</strong> Engineering Research (2004). <strong>Coastal</strong> Engineering Manual (CEM). Very-Tech, USA<br />
October 2012, p 218
UNCTAD (2008). Maritime transport and the climate change challenge. Note by the UNCTAD secretariat.<br />
United Nations Conference on Trade and Development. TD/B.C.I/MEM.1.2, 9 December 2008.<br />
UNCTAD (2009). (United Nations Conference on Trade and Development) Multi-Year Expert Meeting on<br />
Transport and Trade Facilitation: Maritime Transport and the Climate Change Challenge.<br />
Summary of Proceedings, UNCTAD/DTL/TLB/2009/1, United Nations. 16–18 February 2009,<br />
Geneva. www.unctad.org/ttl/legal. 1 December 2009.<br />
Van Ballegooyen, R.C.(1996) Forced coastal-trapped waves along the southern <strong>Africa</strong>n coastline, MSc thesis,<br />
University of Cape Town, Rondebosch, 221pp (+42), October 1996.<br />
Van Ballegooyen, R., Theron, A.K., Wainman, C., 2003. Final input to the Risk and Vulnerability Assessment<br />
(RAVA) for the Western Cape (included in the final report to the Provincial Government of the<br />
Western Cape).<br />
Van Rijn LC (2011). <strong>Coastal</strong> erosion and control. Ocean and <strong>Coastal</strong> Management, doi:<br />
10.1016/j.ocecoaman.2011.05.004<br />
Wang, X.L., Zwiers, F.W., Swail, V.R. (2004). North Atlantic Ocean Wave Climate Change Scenarios for the<br />
Twenty-First Century. Journal of Climate, Vol. 17.<br />
Welsby J and Motyka JM, A review of novel shore protection methods, Vol 3 Gabions; HR Wallingford<br />
report SR5, November 1984.<br />
Wiesman R N, et al. (1995). Effect of water table manipulation on beach profiles. Journal of Waterway, Port,<br />
<strong>Coastal</strong>, and Ocean Engineering, 121 (2): 134 142.<br />
WMO (1988). Guide to Wave Analysis and Forecasting. No. 702, Secretariat of the World Meteorological<br />
Organization, Geneva.<br />
October 2012, p 219
CHAPTER 12: GLOSSARY OF TERMS<br />
(DEAD & P, 2010)<br />
Accretion<br />
Alongshore<br />
Astronomical tide<br />
Bar<br />
Bathymetry<br />
Bay<br />
Beach<br />
Beach erosion<br />
Beach profile<br />
Bed<br />
Benefits<br />
Buffer area<br />
Cay<br />
Cliff<br />
Climate change<br />
The accumulation of (beach) sediment, deposited by natural fluid flow processes<br />
Parallel to and near the shoreline; same as longshore<br />
The tidal levels and character which would result from gravitational effects, e.g. of the<br />
earth, sun and moon, without any atmospheric influences.<br />
An offshore ridge or mound of sand, gravel, or other unconsolidated material which is<br />
submerged (at least at high tide), especially at the mouth of a river or estuary, or lying<br />
parallel to, and a short distance from, the beach.<br />
The measurement of depths of water in oceans, seas and lakes; also the information<br />
derived from such measurements.<br />
A recess or inlet in the shore of a sea or lake between two capes or headlands, not as<br />
large as a gulf but larger than a cove.<br />
(1) a deposit of non-cohesive material (e.g. sand, gavel) situated on the interface<br />
between dry land and the sea (or large expanse of water) and actively “worked” by<br />
present-day hydrodynamics processes (i.e. waves, tides and currents) and sometimes by<br />
winds. (2) the zone of unconsolidated material that extends landward from the low<br />
water line to the place where there is marked change in material or physiographic form,<br />
or to the line of permanent vegetation. The seaward limit of a beach – unless otherwise<br />
specified – is the mean low water line. A beach includes foreshore and backshore. (3)<br />
(smp) the zone of unconsolidated material that is moved by waves, wind and tidal<br />
currents, extending landward to the coastline.<br />
The carrying away of beach materials by wave action, tidal currents, littoral currents or<br />
wind.<br />
A cross-section taken perpendicular to a given beach contour, the profile may include<br />
the face of a dune or seawall, extend over the backshore, across the foreshore, and<br />
seaward underwater into the nearshore zone.<br />
The bottom of a watercourse, or any body of water.<br />
The economic value of a scheme, usually measured in terms of the cost of damages<br />
avoided by the scheme, or the valuation of perceived amenity or environmental<br />
improvements.<br />
A parcel or strip of land that is designed and designated to permanently remain<br />
vegetated in an undisturbed and natural condition to protect an adjacent aquatic or<br />
wetland site from upland impacts, to provide habitat for wildlife and to afford limited<br />
access.<br />
A small, low island composed largely or coral or sand.<br />
A high steep face of rock.<br />
Refers to any long-term trend in mean sea level, wave height, wind speed, drift rate etc.<br />
Coast<br />
A strip of land of indefinite length and width (may be tens of kilometres) that extends<br />
from the seashore inland to the first major change in terrain features.<br />
<strong>Coastal</strong> management<br />
The development of a strategic, long-term and sustainable land use policy, sometimes<br />
also called shoreline management.<br />
<strong>Coastal</strong> processes<br />
Collective term covering the action of natural forces on the shoreline, and the nearshore<br />
seabed.<br />
<strong>Coastal</strong> zone<br />
The land-sea air interface zone around continents and islands extending from the<br />
landward edge or a barrier or shoreline of coastal bay to the outer extent of the<br />
continental shelf.<br />
Coastline (1) technically, the line that forms the boundary between the coast and the shore. (2)<br />
commonly, the line that forms the boundary between land and water. (3) (smp) the line<br />
October 2012, p 220
Conservation<br />
Continental shelf<br />
Contour line<br />
Cross-shore<br />
Debris line<br />
Deep water<br />
Deep water waves<br />
Depth<br />
Design storm<br />
Design wave<br />
Direction of waves<br />
Direction of wind<br />
Dunes<br />
Duration<br />
Ecosystem<br />
Erosion<br />
Estuary<br />
Event<br />
Fetch<br />
Fetch length<br />
Gabion<br />
Geology<br />
Georeferencing<br />
High water (HW)<br />
where terrestrial processes give way to marine processes, tidal currents, wind waves,<br />
etc.<br />
The protection of an area, or particular element within an area, accepting the dynamic<br />
nature of the environment and therefore allowing change.<br />
The zone bordering a continent extending from the line of permanent immersion to the<br />
depth, usually about 100 m to 200 m, where there is a marked or rather steep descent<br />
toward the great depths.<br />
A line connecting points, on a land surface or sea bottom, which have equal elevation. It<br />
is called an isobaths when connecting points of equal depth below a datum.<br />
Perpendicular to the shoreline.<br />
A line near the limit of storm wave up-rush marking the landward limit of debris<br />
deposits.<br />
In regard to waves, where depth is greater than one-half the wave length. Deep-water<br />
conditions are said to exist when the surf waves are not affected by conditions on the<br />
bottom.<br />
A wave in water the depth of which is greater than one-half the wave length.<br />
Vertical distance from still-water level (or datum as specified) to the bottom.<br />
<strong>Coastal</strong> protection structures will often be designed to withstand wave attack by the<br />
extreme design storm. The severity of the storm (i.e. return period) is chosen in view of<br />
the acceptable level of risk of damage or failure. A design storm consists of a design<br />
wave condition, a design water level and a duration.<br />
In the design of harbours, harbour works, etc. the type or types of waves selected as<br />
having the characteristics against which protection is desired.<br />
Direction from which waves are coming.<br />
Direction from which wind is blowing.<br />
(1) Accumulations of windblown sand on the backshore, usually in the form of small hills<br />
or ridges, stabilized by vegetation or control structures. (2) a type of bed form<br />
indicating significant sediment transport over a sandy seabed.<br />
In forecasting waves, the length of time the wind blows in essentially the same.<br />
The living organisms and the non-living environment interacting in a given area.<br />
Wearing away of the land by natural forces. (1) On a beach, the carrying away of beach<br />
material by wave action, tidal currents or by deflation. (2) The wearing away of land by<br />
the action of natural forces.<br />
(1) a semi-enclosed coastal body of water which has a free connection with the open<br />
sea. The seawater is usually measurably diluted with freshwater. (2) the part of the<br />
river that is affected by tides.<br />
An occurrence meeting specified conditions, e.g. damage, a threshold wave height or a<br />
threshold water level.<br />
The length of unobstructed open sea surface across which the wind can generate waves<br />
(generating area).<br />
(1) the horizontal distance (in the direction of the wind) over which a wind generates<br />
seas or creates wind setup. (2) the horizontal distance along open water over which the<br />
wind blows and generates waves.<br />
(1) steel wire-mesh basket to hold stones or crushed rock to protect a bank or bottom<br />
from erosion.<br />
The science which treats of the original, history and structure of the earth, as recorded in<br />
rocks, together with the forces and processes now operating to modify rocks.<br />
The process of scaling, rotating, translating and de-skewing the image to match a<br />
particular size and position (2) establishing the location of an image in terms of map<br />
projections or coordinate systems.<br />
Maximum height reached by a rising tide. The height may be solely due to the periodic<br />
tidal forces or it may have superimposed upon it the effects of prevailing meteorological<br />
conditions. Non-technically, also called the high tide.<br />
October 2012, p 221
High water mark<br />
Mean high water springs<br />
(MHWS)<br />
Mean sea level<br />
Ocean<br />
Offshore<br />
Offshore wind<br />
Outcrop<br />
Overtopping<br />
Peak period<br />
Photogrammetry<br />
Port<br />
Reach<br />
Recession<br />
Refraction<br />
Retum period<br />
Revetment<br />
Rocks<br />
Run-up<br />
Sand<br />
Scour protection<br />
Sea defences<br />
Sea level rise<br />
Seawall<br />
A reference mark on a structure or natural object, indicating the maximum stage of tide<br />
or flood.<br />
The average height of the high water occurring at the time of spring tides.<br />
The average height of the surface of the sea for all stages of the tide over a 19-year<br />
period, usually determined from hourly height readings.<br />
The great body of salt water which occupies two-thirds of the surface of the earth, or<br />
one of its major subdivisions.<br />
(1) in beach terminology, the comparatively flat zone of variable width, extending from<br />
the shoreface to the edge of the continental shelf. It is continually submerged. (2) the<br />
direction seaward from the shore. (3) the zone beyond the nearshore zone where<br />
sediment motion induced by wave alone effectively ceases and where the influence of<br />
the sea bed on wave action is small in comparison with the effect of wind. (4) the<br />
breaker directly seaward of the low tide line.<br />
A wind blowing seaward from the land in the coastal area.<br />
A surface exposure of bare rock, not covered by soil or vegetation.<br />
Water carried over the top of a coastal defence due to wave run-up or surge action<br />
exceeding the crest height.<br />
The wave period determined by the inverse of the frequency at which the wave energy<br />
spectrum reaches it’s maximum.<br />
The science of deducing the physical dimensions of objects from measurements on<br />
images (usually photographs) of the objects.<br />
A place where vessels may discharge or receive cargo.<br />
(1) an arm of the ocean extending into the land. (2) a straight section of restricted<br />
waterway of considerable extent; may be similar to a narrows, except much longer in<br />
extent.<br />
(a) a continuing landward movement of the shoreline. (2) a net landward movement of<br />
the shoreline over a specified time.<br />
The process by which the direction of a wave moving in shallow water at an angle to the<br />
bottom contours is changed. The part of the wave moving shoreward in shallower water<br />
travels more slowly than that portion in deeper water, causing the wave to turn or bend<br />
to become parallel to the contours.<br />
Average period of time between occurrences of a given event.<br />
(1) a facing of stone, concrete, etc., to protect an embankment, or shore structure,<br />
against erosion by wave action or currents. (2) a retaining wall. (3) (smp) facing of<br />
stone, concrete, etc., built to protect a scarp, embankment or shore structure against<br />
erosion by waves of currents.<br />
An aggregate of one or more minerals rather large in area. The three classes of rocks are<br />
the following: (1) igeneous rock – crystalline rocks formed from molten material.<br />
Examples are granite and basalt. (2) sedimentary rock – a rock resulting from the<br />
consolidation of loose sediment that has accumulated in layers. Examples are<br />
sandstone, shale and limestone. (3) metamorphic rock – rock that has formed from preexisting<br />
rock as a result of heat or pressure.<br />
The rush of water up a structure or beach on the breaking of a wave. The amount of<br />
run-up is the vertical height above still-water level that the rush of water reaches.<br />
An unconsolidated (geologically) mixture of inorganic soil (that may include disintegrated<br />
shells and coral) consisting of small but easily distinguishable grains ranging in size from<br />
about .062 mm to 2.0 mm.<br />
<strong>Protection</strong> against erosion of the seabed in front of the toe.<br />
Works to prevent or alleviate flooding by the sea.<br />
The long-term trend in mean sea level.<br />
(1) a structure built along a portion of a coast primarily to prevent erosion and other<br />
damage by wave action. It retains earth against its shoreward face. (2) (smp) a structure<br />
separating land and water areas primarily to prevent erosion and other damage by wave<br />
October 2012, p 222
Sediment transport<br />
Setback<br />
Shallow water<br />
Shoal<br />
Shore<br />
Significant wave height<br />
Significant wave period<br />
Soft defences<br />
Spring tide<br />
Stillwater level (SWL)<br />
Surf zone<br />
Surf zone<br />
Surge<br />
Survey, control<br />
Survey, hydrographic<br />
Survey, photogrammetric<br />
Survey, topographic<br />
Swash zone<br />
Swell<br />
action. Generally more massive and capable of resisting greater wave forces than a<br />
bulkhead.<br />
The main agencies by which sedimentary materials are moved are: gravity (gravity<br />
transport); running water (rivers and streams); ice (glaciers); wind; the sea (currents and<br />
longshore drift). Running water and wind are the most widespread transporting agents.<br />
In both cases, three mechanisms operate, although the particle size of the transported<br />
material involved is very different, owing to the differences in density and viscosity of air<br />
and water. The three processes are: rolling or traction, in which the particle moves<br />
along the bed but is too heavy to be lifted from it; saltation and suspension, in which<br />
particles remain permanently above the bed, sustained there by the turbulent flow of<br />
the air or water.<br />
(smp) a required open space, specified in shoreline master programs, measured<br />
horizontally upland from a perpendicular to the ordinary high water mark.<br />
Water of such depth that surface waves are noticeably affected by bottom topography.<br />
Typically this implies a water depth equivalent to less than half the wave length.<br />
(1) (noun) a detached area of any material except rock or coral. The depths over it are a<br />
danger to surface navigation. Similar continental or insular shelf features of greater<br />
depths are usually termed banks. (2) (verb) to become shallow gradually. (3) to cause<br />
to become shallow. (4) to proceed from a greater to a lesser depth of water.<br />
That strip of ground bordering any body of water which is alternatively exposed, or<br />
covered by tides and/or waves. A shore of unconsolidated material is usually called a<br />
beach.<br />
Average height of the highest one-third of the waves for a stated interval of time.<br />
Average period of the highest one-third of the waves for a stated interval of time.<br />
Usually refers to beaches (natural or designed) but may also relate to energy –absorbing<br />
beach-control structures, including those constructed of rock, where these are used to<br />
control or redirect coastal processes rather than opposing or preventing them.<br />
A tide that occurs at or near the time of new or full moon, and which rises highest and<br />
falls lowest from the mean sea level (msl).<br />
The surface of the water if all wave and wind action were to cease. In deep water this<br />
level approximates the midpoint of the wave height. In shallow water it is nearer to the<br />
trough than the crest. Also called the undisturbed water level.<br />
The nearshore zone along which the waves become breakers as the approach the shore.<br />
The zone of wave action extending from the water line (which varies with tide, surge,<br />
set-up, etc). Out to the most seaward of the zone (breaker zone) at which waves<br />
approaching the coastline commence breaking, typically in water depths of between 5 m<br />
and 10 m.<br />
(1) long-interval variations in velocity and pressure in fluid flow, not necessarily periodic,<br />
perhaps even transient in nature. (2) the name applied to wave motion with a period<br />
intermediate between that of an ordinary wind and that of a tide. (3) changes in water<br />
level as a result of meteorological forcing (wind, high or low barometric pressure)<br />
causing a difference between the recorded water level and that predicted using<br />
harmonic analysis, may be positive or negative.<br />
A survey that provides coordinates (horizontal or vertical) of point to which<br />
supplementary surveys are adjusted.<br />
A survey that has as its principal purpose the determination of geometric and dynamic<br />
characteristics of bodies of water.<br />
A survey in which monuments are placed at points that have been determined<br />
photogrammetrically.<br />
A survey which has, for its major purpose, the determination of the configuration (relief)<br />
of the surface of the land and the location of natural and artificial objects thereon.<br />
The zone of wave action on the beach, which moves as water levels vary, extending from<br />
the limit of run-down to the limit of run-up.<br />
Waves that have travelled a long distance from their generating area and have been<br />
sorted out by travel into long waves of the same approximate period.<br />
October 2012, p 223
Toe<br />
Topographic map<br />
Updrift<br />
Wave crest<br />
Wave direction<br />
Wave height<br />
Wave hindcast<br />
Wave length<br />
Wave rose<br />
Wave set-up<br />
Wave steepness<br />
Wave train<br />
Wave trough<br />
Wave variability<br />
Wind rose<br />
Wind setup<br />
Wind waves<br />
World Geodetic System,<br />
1984 (revised 2004)<br />
(1) lowest part of sea- and portside breakwater slope, generally forming the transition<br />
to the seabed. (2) the point of break in slope between a dune and a beach face.<br />
A map on which elevations are shown by means of contour lines.<br />
The direction to which the predominant longshore movement of beach material<br />
approaches.<br />
(1) the highest part of the wave. (2) that part of the wave above still water level.<br />
The direction from which the waves are coming.<br />
The vertical distance between the crest (the high point of the wave) and the trough (the<br />
low point).<br />
The calculation from historic synoptic weather charts of the wave characteristics that<br />
probably occurred at some past time.<br />
The distance, in meters, between equivalent points (crests or troughs) on waves. Wave<br />
period: (1) the time required for two successive wave crests to pass a fixed point. (2)<br />
the time, in seconds, required for a wave crest to traverse a distance equal to one wave<br />
length.<br />
Diagram showing the long-term distribution of wave height and direction.<br />
Elevation of the still-water level due to breaking waves.<br />
The ratio of wave height to its length. Not the same thing as the slope between a wave<br />
crest and its adjacent trough.<br />
A series of waves from the same direction.<br />
The lowest part of the wave form between crests. Also that part of a wave below still<br />
water level.<br />
(1) the variation of heights and periods between individual waves within a wave train.<br />
Wave trains are not composed of waves of equal heights and periods which vary in a<br />
statistical manner. (2) the variability in direction of wave travel when leaving the<br />
generating area. (3) the variation in height along the crest.<br />
Diagram showing the long-term distribution of wind speed and direction.<br />
(1) the vertical rise in the stillwater level on the leeward side of a body of water caused<br />
by wind stresses on the surface of the water. (2) the difference in stillwater levels on<br />
the windward and the leeward sides of a body of water caused by wind stresses on the<br />
surface of the water. (3) synonymous with wind tide and storm surge. Storm surge is<br />
usually reserved for use on the ocean and large bodies of water. Wind setup is usually<br />
reserved for use on reservoirs and smaller bodies of water.<br />
(1) waves formed and growing in height under the influence of wind. (2) loosely, any<br />
wave generated by wind.<br />
An earth fixed global reference frame used for defining coordinates when surveying and<br />
by GPS systems.<br />
October 2012, p 224
October 2012, p 225
APPENDIX 1: SATELLITE REMOTE SENSING<br />
FOR COASTAL CHANGE<br />
Satellite Remote Sensing for <strong>Coastal</strong> Change<br />
Detection: Mozambique case study.<br />
Dr Wesley Roberts (wroberts@csir.co.za)<br />
Dr Melanie Lück-Vogel (MLuckVogel@csir.co.za)<br />
CSIR<br />
Natural Resources and the Environment<br />
Ecosystems Earth Observation Research Group<br />
Pretoria / Stellenbosch 14 th February 2011<br />
October 2012, p 226
Table of Contents<br />
1.0 INTRODUCTION 228<br />
1.1 Satellite Remote Sensing for change detection studies – Landsat TM 228<br />
1.2 Methods employed 230<br />
2.0 RESULTS 236<br />
2.1 Object Oriented Analysis 236<br />
2.2 Change Vector Analysis 238<br />
2.3 Spectral Change Analysis 244<br />
3.0 DISCUSSION 246<br />
4.0 CONCLUSION 247<br />
Figures<br />
Figure 1 Location of study sites 229<br />
Figure 2<br />
Graphical Representation of CVA: Top shows the magnitude of the change vector<br />
while the bottom shows the direction. 233<br />
Figure 3 Schematic overview of spectral change workflow 235<br />
Figure 4 Object Oriented Image Analysis Results (Maputo) 236<br />
Figure 5 Object Oriented Image Analysis Results (Beira) 237<br />
Figure 6 Object Oriented Image Analysis Results (Vilanculos) 238<br />
Figure 7 Change Vector Analysis Results (Maputo) 239<br />
Figure 8 Change Vector Analysis Results (Beira) 240<br />
Figure 9 Change Vector Analysis Results (Maxixe) 241<br />
Figure 10 Change Vector Analysis Results (Vilanculos) 243<br />
Figure 11 Spectral Change Analyses for Maputo (A: 1986 – 2009; B: 1986 – 1999; C: 1999 –<br />
2003; D: 2003 – 2009) 245<br />
October 2012, p 227
EXECUTIVE SUMMARY<br />
<strong>Coastal</strong> vulnerability to large storm events and or sea level rise is dependent on the state of the<br />
coastline and the morphological processes acting on that coastline. In the present analyses<br />
satellite remote sensing data were assessed in terms of its ability to identify erosive and or<br />
accretive processes. The Mozambican coastline is subject to large storm events associated with<br />
Indian Ocean low pressure systems, large storm surges are generally associated with these events<br />
placing coastal populations and infrastructure under threat. Identifying zones of potential critical<br />
change would go a long way to determining where coastal infrastructure could be used to protect<br />
coastal communities. A vital step in this process is determining where erosive and accretive<br />
processes are taking place along the coastline focussing initially on populated areas. Four study<br />
areas were identified for the satellite remote sensing assessment; Maputo, Maxixe, Vilanculos<br />
and Beira.<br />
Three change detection methods were assessed at the Maputo (Object-Oriented Image Analysis,<br />
Change Vector Analysis and Spectral Change Analysis) site while two were used for the Maxixe,<br />
Vilanculos, and Beira sites (Change Vector Analysis and Spectral Change Analysis). Results<br />
presented in this report show that the Change Vector and Spectral Change Analyses report<br />
consistent results while the Object-Oriented Image Analysis returned inconsistent results. All<br />
three image analysis procedures were affected by tides which made differentiating between<br />
ocean, beach and shallow water very difficult. This resulted in commission and omission type<br />
errors depending on the nature of the tides and the imagery used.<br />
Spatial resolution also played a role in the quality of the results with a ±60 metre accuracy<br />
deemed too inaccurate. While the Landsat 5 Thematic Mapper (TM) and 7 Enhanced Thematic<br />
Mapper Plus (ETM+) archive provide free and easy to access satellite data, this report suggests<br />
that the mapping scale of these sensors is only suitable for contextual coastal studies.<br />
In the future either high resolution satellite imagery or digital aerial photography should be used<br />
to assess coastal stability. The authors acknowledge that this data are not always readily<br />
available, however, when access to historical aerial photography is possible, every means should<br />
be used to acquire and use this data. Further, it is suggested that high resolution Interferometric<br />
synthetic aperture radar (InSAR) be explored for identifying either erosive or accretive processes<br />
at work along the coastline.<br />
1.0 INTRODUCTION<br />
1.1 Satellite Remote Sensing for change detection studies – Landsat TM<br />
This project component sought to use the Landsat archive to monitor coastal erosion and or<br />
accretion at specified locations along the Mozambican coastline. Satellite remote sensing imagery<br />
has long been identified as a suitable change detection tool, as the synoptic scale of many sensors<br />
in particular allows for the analysis of large areas within one image. Satellite remote sensing<br />
platforms also enable direct monitoring of a particular land surface at regular intervals. This<br />
characteristic of satellite based earth observation means that a particular multispectral sensor<br />
October 2012, p 228
could (depending on swath width and spatial resolution) collect multiple scenes per year of the<br />
same area. However, especially in tropical regions the acquisition of cloud free of imagery is<br />
usually challenging. The longest running medium resolution archive of satellite data is the Landsat<br />
Thematic Mapper (TM) series owned and operated by the United States Geological Survey<br />
(USGS). The archive dates back to early 1980s providing a wealth of information for the<br />
monitoring of both natural and anthropogenic land cover change. Figure 1 shows the sites where<br />
the change detection analyses were conducted within this project.<br />
Figure 1 Location of study sites<br />
Landsat TM data were chosen for this study as the system has a comprehensive archive for the<br />
region of interest which dates back to the early 1980s. The task was to monitor the location of<br />
the coastline at regular intervals (± 5 years) where possible. Further the entire Landsat Archive is<br />
made available for free through the Global Land Cover Facility (http://www.landcover.org) and<br />
the United States Geological Survey Global Visualisation Viewer (http://glovis.usgs.gov/), data<br />
were also sourced from the CSIR’s Satellite Applications Centre (SAC). Data are directly<br />
downloadable from the Global Land Cover Facility and the USGS Global Visualisation Viewer. The<br />
goal of the change detection analysis was to identify areas along the coastline (within our areas of<br />
October 2012, p 229
interest) that displayed unusual change both in terms of accretion and erosion. In particular those<br />
areas which display large amounts of eroding could be identified and flagged as zones of potential<br />
critical change.<br />
The Mozambican coastline is susceptible to weather events which result in large storm surges<br />
threatening both public infrastructure and the wellbeing of those living in close proximity to the<br />
coastal areas. It was therefore necessary to investigate if and where the coastline is being eroded<br />
and attempt to understand why this is happening with a view to presenting a plan for adapting to<br />
future coastal climate related threats. On the other hand accretion is a sign of changes to coastal<br />
morphology resulting from either natural or anthropogenic influences. Mapping accreting zones<br />
would help to plan for the future changes.<br />
Several studies have shown the utility for mapping both erosion and or accretion using various<br />
Landsat satellites. Alesheikh et al. (2007) employed histogram rationing and band thresholding<br />
techniques to monitor the shoreline of a saline lake in north western Iran. The authors were able<br />
to determine, through the use of Landsat imagery and change detection methods that, the area<br />
of the lake had decreased by up to 20% over a 5 year period. Accuracy assessments indicated that<br />
their proposed methodology was accurate to 1.3 pixels (±39m). Chen et al. (2005) employed<br />
Landsat MSS and TM imagery to measure coast line reclamation in Lingding Bay in Southern<br />
China. Their analyses were able to identify and map coastal accretion of between 3.6 and 6 km<br />
seaward due to urban expansion and coastal reclamation projects. Similarly Vanderstraete et al.<br />
(2006) made use of Landsat TM and ETM+ data to map zones of accretion and erosion resulting<br />
from changing land use activities. Their study was able to definitively map zones of change and<br />
incorporate those into future planning activities.<br />
While all three studies indicate that satellite remote sensing proves useful for coastal change<br />
studies, Boak and Turner (2007) do indicate that a limiting factor when utilising multispectral data<br />
is the pixel resolution and cost. The recently published Landsat archive are free of charge<br />
however any analysis conducted using Landsat imagery is limited to an accuracy of ±60m for<br />
Landsat TM and ETM+ and ±120m for the older MSS sensors.<br />
1.2 Methods employed<br />
As mentioned above change detection techniques were employed to analyse change in coast line<br />
location over the predefined study period in the following locations: Maputo, Beira, Maxixe and<br />
Vilanculos. Landsat imagery was downloaded from the GLOVIS and SAC archive for various dates<br />
for each location. Table 1 shows the dates and locations for which data was collected (Not all<br />
input data was employed in either of the three change detection methods).<br />
October 2012, p 230
Table 1 Input imagery (sources: CSIR SAC & USGS GLOVIS)<br />
Maputo Beira Maxixe Vilanculos<br />
15/03/1984 01/06/1984 05/22/1992 27/02/1987<br />
18/03/1986 13/12/1988 03/02/1995 31/05/1992<br />
27/03/1991 20/05/1991 01/06/2001** 21/03/1995<br />
09/07/1992 04/06/1996 13/05/2000**<br />
18/06/1996 01/09/2000** 01/06/2004<br />
14/01/2000** 24/06/2004 31/08/2008<br />
14/09/2003 07/09/2008 30/05/2009<br />
10/07/2004<br />
07/09/2008<br />
Landsat 7ETM+ ** (All others are Landsat 5 TM)<br />
The USGS distributes Landsat imagery corrected to level 1T, which indicates that a geometric<br />
correction has been applied to the imagery with both sensor and terrain specific geometric errors<br />
removed. It is thus not necessary to perform any geometric corrections to the imagery, while the<br />
SAC distributes their data at level 1G, which usually requires some correction for terrain effects.<br />
Therefore SAC data were corrected using a Shuttle Radar Topography (SRTM) derived digital<br />
elevation model (DEM), with final image to image registration employing USGS data. Radiometric<br />
corrections were required as both data sources are distributed as scaled digital numbers. Using<br />
the ATCOR software DN values have been converted to at-surface reflectance using gains and<br />
biases and other solar parameters derived from the metadata files which accompany the<br />
respective input images.<br />
Quality control was employed by analysing spectral signatures of characteristic surfaces within<br />
each of the resulting reflectance images and comparing with reference signatures. Following<br />
completion of the pre-processing three change detection methods were employed. The first<br />
method employed object oriented image analysis (OOIA) to extract the coastline from each of the<br />
input images and then plot these lines within a geographical information system. The second<br />
method employed change vector analysis (CVA) to identify pixels along the coastline which<br />
displayed change outside of normal expected range. Finally a spectral change technique was used<br />
to analyse the changes in spectra per pixel. Three separate methods were employed as this<br />
provided the researchers with the opportunity to fully explore the application of medium<br />
resolution satellite remote sensing for coastal change studies. For the interpretation of the<br />
images, for all acquisition dates also the tidal state at the time of image acquisition was assessed<br />
using the WXTide40 tool.<br />
Object Oriented Image Analysis (OOIA)<br />
The first coastline change analysis method used was OOIA which as described above sought to<br />
identify the coastline which was defined as the interface between the ocean and the land mass.<br />
In contrast to pixel based classifiers OOIA conducts its classification on image objects as opposed<br />
to single pixels. These objects are defined using a segmentation algorithm which seeks to identify<br />
homogenous regions within the image based on predefined parameters. The present project<br />
made use of a Multiresolution Segmentation algorithm developed by Baatz and Schäpe (2000)<br />
October 2012, p 231
and implemented within the Definiens Developer 7 image analysis software. The parameters<br />
required for the segmentation include shape and compactness which control both the size and<br />
shape of the segments based on the image content. No definitive rule exists for the selection of<br />
optimal shape and compactness values; rather, image analysts use a trial and error to determine<br />
the optimal selection for each image. The result of the segmentation is a number of image<br />
objects. Each of these image objects has certain characteristics depending on the pixels within it.<br />
The characteristics of these pixels are then assigned to the object and used to further partition<br />
the objects into predefined classes. Further partition is conducted using thresholding as well as<br />
colour, object shape and object adjacency.<br />
Employment of spatial adjacency as a measure of class association allows for the classification of<br />
image objects based on their proximity to a class or feature within the image. In the present<br />
analysis OOIA was used to locate the interface between the land and ocean and then convert this<br />
area into a vector designating the coastline. The definition of the coastline changed depending on<br />
the land cover present, in some cases the coastline was the interface between an urban area and<br />
the ocean, at other locations the interface between vegetation and ocean and still others the<br />
interface between white sand and vegetation adding to the complexity of the analyses. Results of<br />
the OOIA procedure are presented in section 2.1.<br />
Change Vector Analysis (CVA)<br />
The second change detection method employed was the Change Vector Analysis (CVA) technique<br />
(Johnson and Kasischke, 1998). The technique uses Euclidean distance to calculate the magnitude<br />
of change between two spatially coincident pixels from two images of the same area captured on<br />
different dates. In contrast to the OOIA technique CVA attempts to quantify the amount of<br />
change taking place between two images at the pixel level. Further, the method also offers the<br />
opportunity to determine the direction of change based on Cartesian coordinates. Equation 1<br />
outlines the calculation of the magnitude M of change between pixels, where ya is band 1 from<br />
the first date image and yb is band one from the second image and xa and xb are bands 2 from<br />
the first and second images respectively (equation 1 is suitable for change detection studies using<br />
two input bands per image date)<br />
Using this equation, CVA quantifies the length of the change vector between two spatially<br />
coincident pixels. Further, CVA presents the opportunity to quantify the particular direction of the<br />
change vector. If we were to draw the change space on a Cartesian plane and plot the location of<br />
the pixels in date 1 and the location of the pixels in date 2 (based on x & y coordinates) we would<br />
then be shown not only the magnitude of change but also the direction of change. See figure 2<br />
for a graphical explanation.<br />
(1)<br />
October 2012, p 232
Figure 2 Graphical Representation of CVA: Top shows the magnitude of the change vector while the bottom<br />
shows the direction.<br />
The lower half of Figure 2 graphically illustrates that, depending on the type of change the<br />
direction of that change may be used to deduce certain characteristics about the change.<br />
In the present analysis two derivative bands from each date were used, namely the near-Infrared<br />
(IR) band and the first component of a Principal Component Analysis (PCA). These two bands<br />
were chosen because firstly, near-IR electromagnetic radiation is strongly absorbed by water and<br />
largely reflected by non-water surfaces thus making this band sensitive to changes between land<br />
and water, while the first component of a PCA displays the information which is common among<br />
all input bands, i.e. similar reflectance and absorption. This means, areas of change are displayed<br />
by either increases or decreases in spectral reflectance as quantified by the input bands. Thus<br />
combined, the near-IR band and the first PC make for an effective tool for monitoring coastline<br />
change as they are both sensitive to changes in land reflectance and water absorption. For<br />
example, in the present study a particular pixel was deemed to be accreting if both the near-IR<br />
and the 1 st PC increased in brightness between the two dates. An increase in brightness would<br />
indicate that the pixel has moved from a predominantly water based pixel to a land based pixel.<br />
Similarly, if the brightness decreased then the pixel has moved from a land based pixel to a water<br />
October 2012, p 233
ased pixel indicating erosion. This is the basis for the CVA analysis with the output of the analysis<br />
being an image depicting magnitude of change as well as direction, either quadrant 1, 2, 3, or 4<br />
with 1 and 3 being the focus. Following this several trials were run with regards to selecting and<br />
appropriate magnitude threshold, the authors settled on the 90 th percentile as representing<br />
significant change from one date to the next. Following this those pixels displaying change larger<br />
than the 90 th percentile were selected and used to mask the direction output where only<br />
quadrants 1 and 3 were retained. A CVA was conducted for each date pair at each location. The<br />
acquisition years of the images compared in the change vector analysis are given in table 2 below.<br />
Table 2 CVA date pairs<br />
Maputo Beira Maxixe Vilanculos<br />
1992 - 1996 1991 - 1996 1992 - 1995 1987 - 1995<br />
1996 - 2004 1996 - 2000 1992 - 2001 1995 - 2000<br />
2004 - 2008 2000 - 2004 1995 - 2001 2000 - 2009<br />
Change for the entire time period was then determined using raster mathematics, with pixels<br />
consistently returning erosion and or accretion identified as critical change zones. The results are<br />
illustrated in section 0.<br />
Spectral Change Analysis (SCA)<br />
The third change detection method employed for the Maputo test region involved the use of<br />
Spectral Change Analyses (SCA). As with all change detection algorithms, the Spectral Change<br />
Analysis required meticulous geometric correction of the input data as any inaccuracies would<br />
result in false detection of change. To detect spectral changes over time, a bi-temporal<br />
comparison of the geometrically and atmospherically pre-processed data was undertaken. For<br />
that purpose, an image differencing was performed, subtracting the respective younger image<br />
from the respective older one.<br />
From the resulting 6-band composite, the ratio of band 3 / band 4 was calculated, band 3 being<br />
the difference of the Landsat TM bands 3: RED old – RED new and band 4 being the near infrared<br />
difference NIR old – NIR new .<br />
Using this band3/band4 ratio and the difference bands 3 and band 4 themselves, a decision tree<br />
classifier was developed, based on image analysis-derived threshold values for those three bands.<br />
The following change classes were derived:<br />
0: no change,<br />
1: vegetation in image old changed to bare soil in image new,<br />
2: bare soil changed to vegetation,<br />
3: vegetation to water,<br />
4: water to vegetation,<br />
5: bare soil to water, and<br />
6: water to bare soil.<br />
October 2012, p 234
Figure 3 Schematic overview of spectral<br />
change workflow<br />
Relevant for this work were only the<br />
classes 1 and 2, indicating a change of<br />
the edge between coastal (dune)<br />
vegetation and beach, and the classes<br />
5 and 6, indicating a change in the<br />
water line. In order to avoid<br />
misclassifications of the change of the<br />
waterline due to tidal variances of the<br />
compared images, only high tide<br />
images were used for this approach.<br />
The tidal state of the respective<br />
Landsat images at the image<br />
acquisition time has been assessed<br />
using the WXtide40 tool. Accordingly,<br />
the following Landsat TM and ETM+<br />
images for the Maputo region have<br />
been compared:<br />
1986-11-14 – 2009-12-23,<br />
1986-11-14 – 1999-07-05,<br />
1999-07-05 – 2003-09-02,<br />
2003-09-02 – 2009-12-23.<br />
October 2012, p 235
2.0 RESULTS<br />
2.1 Object Oriented Analysis<br />
Object-oriented image analysis (OOIA) was conducted on all but one of the sites; due to data<br />
irregularities no OOIA was performed on the Maxixe site. As mentioned in section 1.2.1 Definiens<br />
eCognition software was used to map the location of the coastline which was defined as the<br />
interface between the ocean and the land. Figure 4 shows the results from the OOIA around the<br />
capital Maputo. The analyses were conducted at several temporal intervals including 1984, 1986,<br />
1992, 1996, 2000, 2004,<br />
and 2008. The extracted<br />
coastlines are shown in<br />
Figure 4 where no clear<br />
identification of coastal<br />
erosion or accretion has<br />
been detected. While<br />
the algorithm managed<br />
to identify the general<br />
location of the coastline<br />
determining trends and<br />
or systematic change is<br />
largely a quantitative<br />
procedure which is very<br />
limiting when compared<br />
to the methods used by<br />
coastal engineers.<br />
Figure 4 Object Oriented Image<br />
Analysis Results (Maputo)<br />
October 2012, p 236
While the data may be difficult to interpret one can clearly see that there have been few<br />
catastrophic changes associated with either floods and or hazardous events. Changes in the river<br />
mouth, seen on the top left side of figure 4 highlight the continued problems encountered with<br />
regards to the exact definition of the coastline. In some images the tide was in while on others<br />
the tide was clearly out. Given the shallow depths of Maputo bay low-tide images returned a<br />
coastline much further seaward than a high-tide scene. After the analysis of the tidal state of<br />
employed Landsat images, those changes clearly related to differences in the tidal state and have<br />
been excluded from the change analysis.<br />
Figure 5 shows a similar analysis for the Beira region where OOIA procedures were employed to<br />
map coastal changes. Unfortunately due to time limitations it was not possible to conduct the<br />
OOIA for all the input images.<br />
Figure 5 Object Oriented Image Analysis Results (Beira)<br />
October 2012, p 237
Figure 5 also highlights the issues of the tidal range<br />
around Beira. Shallow coastal waters display a bright<br />
white hue in contrast to deep coastal waters which<br />
appear dark. Especially during low tides, the shallow<br />
sandy coastal areas frequently become spectrally<br />
indistinguishable from water-free beaches. This<br />
means, during low-tide cycles it becomes very<br />
difficult to establish an accurate location of the<br />
coastline (using Landsat TM imagery) with a bias<br />
towards identifying accretion as opposed to erosion<br />
events. Due to technical issues it was not possible to<br />
run the OOIA on the Maxixe study site however<br />
figure 6 shows the Vilanculos area and its extracted<br />
coastlines for 1992 and 2004. Similarly, data analysis<br />
was hampered by inconsistent tidal ranges between<br />
image capture dates. The two coastlines presented<br />
in figure 6 show a slight amount of accretion in the<br />
2004 scene when compared to the 1992 image. This<br />
accretion is most likely the result of inconsistent<br />
tidal ranges between the two scenes. Furthermore,<br />
the method employed may well be able to identify<br />
coastal accretion or erosion but quantifying how<br />
much has taken place and identifying any<br />
meaningful trends is very difficult using a twodimensional<br />
method as precise as OOIA.<br />
Figure 6 Object Oriented Image Analysis Results<br />
(Vilanculos)<br />
2.2 Change Vector Analysis<br />
Change vector analysis was also conducted using the<br />
same image data. In the analyses, image pairs were<br />
analysed using the CVA method, table 2 shows the<br />
dates of the analyses while figure 7 shows the<br />
results for the Maputo analysis. While up to three<br />
comparisons were made not all change vectors<br />
could be mapped onto a single map, instead only<br />
those pixels which returned consistent change in the<br />
same direction were retained and identified as<br />
zones of potential critical change. Figure 5?? where<br />
erosion is depicted in yellow and accretion in cyan,<br />
shows that in areas around the city and indeed<br />
across the bay a small amount of accretion is taking<br />
October 2012, p 238
place along the coastline with little or no erosion present.<br />
Interpretation of the results focussed on the coastal areas as this is the area of interest, not on<br />
the inland areas. While spectrally similar changes may have taken place inland of the coast, these<br />
changes are likely the result of land use / land cover change during the analyses periods. Figure 8<br />
shows the results of the CVA analysis of the Beira region. Once again erosion is depicted in yellow<br />
with accretion in cyan. The CVA analysis conducted between 1991 and 2004 shows persistent<br />
erosion and accretion in several places. To the right of the image a river / marsh delta appears<br />
highly dynamic with both erosive and accretive process occurring in more than two of the image<br />
pairs while mangrove swamps in the region return what appear to be erosive processes. When<br />
interpreting these results one should remember that the Beira region experiences inter-tidal<br />
fluctuations of ±6 meters (range between spring high and low tides) thus any changes identified<br />
should be confirmed using traditional methods.<br />
Figure 7 Change Vector<br />
Analysis Results<br />
(Maputo)<br />
October 2012, p 239
Figure 8 Change Vector Analysis Results (Beira)<br />
Figure 9 presents the results of the CVA analysis for the Maxixe site where both erosive and<br />
accretive processes have been detected. Accretive processes in the top right of the image are the<br />
result of cloud cover. North of Maxixe, the CVA analysis returns consistent erosive processes<br />
north of the town while the coastal areas adjacent to Maxixe appear to be accreting. Further<br />
south, erosive processes are evident especially in the inland bays where at least two of the three<br />
CVA analyses returned a decrease in spectral brightness indicating a move from predominantly<br />
land based pixels (which reflect more light than water) to darker water pixels. No significant<br />
change is seen further south but several smaller regions within the bay / estuary do return<br />
consistent erosive processes. Interpreting the erosive process should once again be conducted<br />
with the knowledge that tidal ranges play an important role in the dynamics of coastal<br />
morphology. The present analysis identifies many areas which could potentially be eroding and<br />
may, in the future, present a problem to infrastructure and the people of the area.<br />
October 2012, p 240
Figure 9 Change Vector Analysis Results (Maxixe)<br />
October 2012, p 241
Figure 10 shows the results for the Vilanculos study area, where erosive processes have been<br />
detected. Of all the study sites Vilanculos appears to be most affected by the tidal issues<br />
mentioned above. The problem is best illustrated off shore just south of the town where shallow<br />
water is identified as having erosive processes which, is obviously impossible. The very same<br />
processes leading to the “off-shore erosion” may well be in place all along the coastline. Off-shore<br />
the obvious change from a bright pixel to a dark pixel (erosion) is the result of tidal changes<br />
whereby the initial image was captured at low tide and the second image captured at high tide.<br />
The result is that in many cases commission errors (for both erosion and accretion) are apparent<br />
depending on when the high and low tide images occur within the CVA analyses. The dynamic<br />
nature of the coastline, in particular the interface between the ocean and the land makes<br />
coastline change studies very difficult when satellite remote sensing data are used without<br />
ancillary data on the tidal state at the image acquisition time.<br />
Figure 10/…<br />
October 2012, p 242
Figure 10 Change Vector Analysis Results (Vilanculos)<br />
October 2012, p 243
2.3 Spectral Change Analysis<br />
Spectral change analysis was only employed for the Maputo study site and was intended as an<br />
assessment of an alternative change detection approach. Figure 11 shows the change detection<br />
results for the various input images. A, B, C, D report the change detection results for each input<br />
image pair mentioned in section 1.2.3. Image A looks at the period between 1986 and 2009 and<br />
immediately it is clear that the tidal differences between the images are seen in class 5 (Bare Soil<br />
to Water: Blue), the same pattern is seen in image B which covers the 1986 to 1999 period. It is<br />
thus easy to deduce that the 1986 scene was captured during a lower tide when compared to the<br />
1999 and 2009 images. The other important class is vegetation to bare soil (class 1). In image A<br />
class 1 is seen within the coastal zone both north and south of the city centre, the change from<br />
vegetation to bare soil is an indication of land cover change normally associated with vegetation<br />
degradation. When found in close proximity to a beach or coastline this could be interpreted as<br />
the beach moving inland as a result of coastal erosion, degradation of coastal vegetation (e.g.<br />
dunes) or other related processes.<br />
On the other hand bare soil to vegetation change is seen throughout all four image pairs.<br />
Typically this type of land cover change is prominent in areas where vegetation has been<br />
introduced to replace bare soil or where conservation and or rehabilitation initiatives are<br />
successful, or –depending on the vegetation type – simply reflecting vegetation seasonality. In<br />
the present analyses class 2 could be associated with accretive processes when found in close<br />
proximity to the coastline. All fours scenes return possible accretive processes in close proximity<br />
to the coastline. In particular class 2 is prominent in the southern portions of Maputo Bay. Image<br />
A, C, and D highlight an additional problem associated with recent imagery within the Landsat<br />
archive. In May 2003 Landsat 7 ETM+ experienced a failure of the scan line corrector mechanism<br />
on board. This has led to the imagery being distributed with scan line gaps where data is not<br />
available. The lines seen in results are due to this missing data. Change results in A, C, and D<br />
should therefore be validated using field work and or ancillary aerial photographic data.<br />
October 2012, p 244
Figure 11 Spectral Change Analyses for Maputo (A: 1986 – 2009; B: 1986 – 1999; C: 1999 – 2003; D: 2003 – 2009)<br />
October 2012, p 245
3.0 DISCUSSION<br />
Methods for assessing coastal morphology and or trends in coastal change have been discussed<br />
in this report. Three methods were assessed and reported on with a view to determining the<br />
applicability of medium resolution Landsat TM data to coastal change studies. The analyses and<br />
report have not sought to identify zones of potential critical change but, instead, report on the<br />
applicability of the three methods employed. The experimental design was similar for each of the<br />
methods assessed. For each location (Maputo, Beira, Maxixe, and Vilanculos) a number of<br />
Landsat TM images were downloaded from either the GLOVIS or SAC archive. Imagery were then<br />
pre-processed and analysed.<br />
The experiments were designed to determine which method could accurately map and identify<br />
either erosive or accretive processes. The OOIA procedure was by far the most inconclusive of the<br />
three. Coastlines extracted using object based analyses were inconsistent and heavily influenced<br />
by the nature of the tide at image capture. The approach was also plagued with irregularities<br />
when applying the same algorithm to two different images. Band thresholds between images<br />
were never the same resulting in time having being spent on updating algorithm parameters. The<br />
parameters required adjustment when applying to different locations as well as to different dates<br />
in the same location. Thus the idea of creating an OOIA algorithm that can be universally applied<br />
to images from the same sensor was not possible. The second (CVA) and third methods (CSA)<br />
were however standardised and could be applied to all scenes regardless of data and or location.<br />
This was a distinct advantage as it saved the analyst a lot of time in terms of running and<br />
assessing the quality of the output. The CVA and CSA methods also compared anniversary date<br />
images which were then used to identify trends based on location and frequency of occurrence.<br />
Identifying erosive and or accretive processes using the second two methods was far easier as the<br />
individual analyses focused on pixel level change as opposed to object level changes (OOIA).<br />
While CVA and SCA were more focussed on identifying change, understanding the nature of that<br />
change was far more difficult. The mechanisms which brought about the results mentioned<br />
above are complex in nature and refer to the methods themselves, the imagery selected and the<br />
nature of the study areas. OOIA is a highly precise approach attempting to select or identify the<br />
exact location of the coastline in a temporal set of images collected at different times of the year<br />
under varying conditions. The dynamic nature of the coastline means that while the algorithm<br />
performs as expected, the location of the coastline is likely to change based on the tidal<br />
conditions at the time. In essence the OOIA approach is too precise resulting in highly inaccurate<br />
results. The CVA and SCA methods on the other hand did not attempt to locate the actual<br />
coastline; rather they sought to identify significant change within the coastal region and attempt<br />
to explain that change. The CVA and SCA methods rely on the change in spectra between two<br />
image dates and are thus more reliable than a simple vector extracted from a single image date.<br />
It should also be noted that the CVA method is more sensitive to trends in coastal change than<br />
the OOIA approach in that the final areas identified as erosion or accretion were selected based<br />
on the fact that at least two image pairs returned the same results (direction of change vector).<br />
Similar analyses could be undertaken for the SCA method; however, for the purposes of this<br />
report it was important to illustrate the nature of change between image pairs. Unfortunately, as<br />
Sections 2.1 and 2.2 showed while both approaches (CVA & SCA) have their merits they are<br />
susceptible to the influence of tidal periodicity. In many cases (depending on which image was<br />
October 2012, p 246
captured at either low or high tide) both the accretion and erosive processes identified were not<br />
the result of actual erosive or accretive process, but instead, were the result of tidal changes.<br />
Retrospectively, a tidal analysis of all image data available for the study would have reduced the<br />
impact of tidal ranges but not removed the effects completely.<br />
A historical analysis of change for a coastline as long and complex as the Mozambican is by no<br />
means easy. The use of remote sensing data for such a study is the obvious choice. Large scale<br />
synoptic observations of the coastline at regular intervals should provide the researcher with<br />
enough information to gauge the general state of the coastline (in terms of erosion and or<br />
accretion). However, the only data source available for this area is the Landsat archive which,<br />
while comprehensive, easily accessible, and free of charge, is limited by the spatial resolution of<br />
the sensor. The 30m resolution is far too coarse to identify small scale changes of interest to<br />
coastal engineers. For example, in some procedures coastal engineers require data with an<br />
accuracy of centimetres and or meters, Landsat accuracy is at best between 30 and 45 metres. It<br />
is therefore similar to measuring the width of a human hair using a scholar’s 30cm classroom<br />
ruler. Large scale changes (> 60 metres) are obviously detectable along with trends resulting in<br />
large scale coastal morphological change, however, engineers involved in this project required<br />
accuracies way below what the remote sensing data could provide.<br />
As always projects working in developing countries suffer from a lack of available baseline data.<br />
The analysis described in this report could have been conducted using both digital and analogue<br />
aerial photography. The Mozambican coastline has been surveyed on several occasions however;<br />
this data was not readily available to CSIR researchers. Further, when suitable data were located<br />
it was in a format unsuitable for immediate analysis. Bureaucracy also made it very difficult to<br />
acquire the high resolution data required for such a study. Additional pre-processing of analogue<br />
aerial photography was also time consuming and not an option for the present study. The lack of<br />
suitable readily available data for the study makes it very difficult to establish a coastal baseline<br />
from which to measure change. An alternative to passive optical monitoring using satellite<br />
remote sensing and or aerial photography is the use of high resolution Interferometric synthetic<br />
aperture radar (InSAR).<br />
InSAR is used to generate maps of surface elevation as well as deformation using phase signal<br />
differentiation in synthetic aperture radar (SAR) images captured at different times of the year.<br />
High resolution InSAR such as those flown on the TerraSAR-X system of satellites which can<br />
measure ground deformation between two image dates with an accuracy of up to 3m would be<br />
suitable for coastal deformation studies. Obviously a historical study using this data is not<br />
possible but a reliable monitoring tool could be developed to monitor changes in coastal<br />
morphology on an annual basis or every five years.<br />
4.0 CONCLUSION<br />
Satellite remote sensing methods employed during this project returned a wealth of interesting<br />
information. It turned out that a historical study of coastal change for the Mozambican coastline<br />
requires input data with a higher spatial resolution than the 30m Landsat 5 and 7 (TM and ETM+)<br />
data employed. Identifying small scale change using Landsat TM is possible; however, the<br />
accuracy of the sensor renders the resulting erosion / accretion maps unhelpful when it comes to<br />
October 2012, p 247
assessing the rates of changes and the identification of zones of potential critical change. Tidal<br />
issues as well as data availability made it difficult to identify large scale changes that could lead to<br />
loss of life and damage to infrastructure. Within the context of coastal vulnerability to climate<br />
change future studies may well use Landsat TM; however this information should only be used to<br />
establish contextual coastal parameters. High resolution satellite data and digital aerial<br />
photography along with historical analogue data should be used for more precise studies of<br />
climate induced coastal change. Further, it would be prudent for coastal authorities / researchers<br />
to explore the use of InSAR data for identifying coastal deformation resulting from erosive<br />
processes.<br />
Based on the two most reliable methods used (CVA and SCA), can we briefly summarize the main<br />
outcome for Maputo, Beira and Vilankulos?<br />
References<br />
Alesheikh, A., Ghorbanali, A, Nouri, N (2007). "Coastline change detection using remote sensing."<br />
International Journal of Environ. Sci. Tech. 4(1) 61-66.<br />
Baatz, M. and A. Schape (2000). Multiresolution Segmentation - An Optimization Approach for High Quality<br />
Multi-Scale Image Segmentation. Angewandte Geographische Informationsverarbeitung XII, Ed.<br />
J. Strobl et al. AGIT Symposium, Salzburg, Germany, 2000. pp. 12-23.<br />
Chavez, P.S., Kwarteng, A.Y. (1989). Extracting Spectral Contrast in Landsat Thematic Mapper Image Data<br />
Using Selective Principal Component Analysis. Photogrammetric Engineering & Remote Sensing,<br />
55(3), 339-348.<br />
Chavez, P.S., Mackinnon, D.J. (1994). Automatic Detection of Vegetation Changes in the Southwestern<br />
United States Using Remotely Sensed Images. Photogrammetric Engineering & Remote Sensing,<br />
60(5), 571-583.<br />
Johnson, R. D. andKasischke, E. S.(1998) 'Change vector analysis: a technique for the multispectral<br />
monitoring of land cover and condition', International Journal of Remote Sensing, 19: 3, 411 —<br />
426 DOI: 10.1080/014311698216062<br />
Shui-sen, C., Liang-fu, C., Qin-huo, L., Xia, L., Qiyu, T. (2005) Remote sensing and GIS-based integrated<br />
analysis of coastal changes and their environmental impacts in Lingding Bay, Pearl River Estuary,<br />
South China. Ocean & <strong>Coastal</strong> Management 48 (2005) 65–83.<br />
Vanderstraete, T., Goossens, R. and Ghabour, T. K. (2006) 'The use of multi-temporal Landsat images for the<br />
change detection of the coastal zone near Hurghada, Egypt', International Journal of Remote<br />
Sensing, 27:17, 3645 - 3655 DOI: 10.1080/01431160500500342<br />
Vogel, M. (2006) Online publication of PhD thesis "Erfassung von Vegetationsveränderungen in Namibia mit<br />
Hilfe von Fernerkundungs-Change-Detection-Verfahren und unter Berücksichtigung rezenter<br />
Niederschlagsereignisse (Assessment of vegetation change in Namibia using remote sensing<br />
change detection and considering recent precipitation data)”. English Abstract and German full<br />
version at https://www.opus-bayern.de/uniwuerzburg/frontdoor.php?source_opus=1717&la=de<br />
Weiers, S., Mielby, S., Groom, G., Stjernholm, M., Wissen, M., Bock, M., Schade, B., Tschach, E. (1999).<br />
Monitoring of Changes in Biotope and Land Use Inventory in Denmark and Schleswig-Holstein by<br />
means of Satellite Image Analysis and GIS Technology. MoBio. EC-FP4-Final Report.<br />
October 2012, p 248
APPENDIX 2: THEME 2 MISSION TO INTERACT WITH<br />
MUNICIPALITIES<br />
Participants<br />
INGC- Figueiredo Araujo<br />
UEM- Jose Rafael<br />
CSIR- Laurie Barwell<br />
Purpose<br />
• To discuss the preliminary results of the <strong>Theme</strong> 2 study with relevant municipal officials.<br />
• To reach an understanding on the implications of climate change and the need to influence<br />
and incorporate recommendations into current and future plans.<br />
• To comment on current and future infrastructure and structure plans if available. This to be insitu<br />
during the meeting and a follow-up note on relevant aspects were needed.<br />
• To identify existing specialist studies on climate change in order to harmonise<br />
recommendations if possible.<br />
• Site investigation of current coastal protection activities and provide observations if relevant.<br />
Structure of interaction (Agenda)<br />
Welcome (Municipality)<br />
Purpose and introduction (INGC)<br />
Technical context (UEM)<br />
Discussion (CSIR)<br />
Way forward (UEM)<br />
Closure (INGC)<br />
October 2012, p 249
Notes of the meetings<br />
Date 25 August 2011 Place Maputo<br />
Municipal representative:<br />
Raul Chilaule<br />
Position:<br />
Head: Environmental Management<br />
Contact details: +258 826532810<br />
Available plans at Current General report on coastal protection Maputo City<br />
meeting<br />
Future<br />
Detailed design report and plans not available<br />
Problems<br />
As described in report<br />
Solutions<br />
As described in report<br />
Way forward Obtain detail plans on the infrastructure<br />
Field observations Much of Municipal infrastructure is located within high risk area.<br />
Many opportunities for PPP exist to support the Municipality in preparing for the impact of CC<br />
Comments On hold until detailed plans can be obtained<br />
Date 21 September 2011 Place Matola<br />
Municipal representative (1): Abel Ricotze (tel + 258 82 3988720)<br />
Position:<br />
Director of urban and environmental planning<br />
Municipal representative (2): Aurelio Salomao ( tel +258 82 9109930)<br />
Position:<br />
Head planning<br />
Available plans at Current Structure Plan approved 2010 (digital copy supplied)<br />
meeting<br />
Future<br />
Major waterfront development (no climate change (CC) factors taken into<br />
account)<br />
Problems 1. Storm water inundation in wetlands<br />
2. River flooding of low areas in floodplain<br />
Solutions<br />
Nothing identified<br />
Way forward 1. The municipal representatives understood the technical concepts and the importance<br />
of taking the <strong>Theme</strong> 2 results seriously.<br />
2. Municipality is aware that their current plans do not consider any climate change<br />
factors.<br />
3. The technical level officials at the municipality are now aware of the importance of<br />
incorporating the affects of climate change in current and future plans however the<br />
higher level decision makers will need to be also convinced in order to effect any<br />
changes.<br />
4. Request for another presentation to the Mayor and Council<br />
Field observations Some infrastructure is located in the identified vulnerable areas, including e.g. the new tollgate<br />
complex. Some commercial infrastructure also at risk (e.g. factories) and infrastructure<br />
belonging to the Port of Matola is vulnerable in places.<br />
Comments 1. Municipal area has not experienced inundations or surges from the sea to date (only<br />
river flooding)<br />
2. The planned expansion of the Port of Matola provides an opportunity for future<br />
waterfront development as a Private-Public-Participation project which could pay for<br />
engineering adaptation actions (as conceptually shown in <strong>Theme</strong> 2 results).<br />
3. Noted that the new port development project is mainly associated with Maputo so<br />
Matola Municipality has not been directly involved or consulted.<br />
October 2012, p 250
Date 29 August 2011 Place Inhambane (Tofo)<br />
Municipal representative:<br />
Eugenio Jose<br />
Position:<br />
Head: Infrastructure and Urbanisation<br />
Contact details: +25 82 4288890<br />
Available plans at Current Tofo seawall; INGC World Bank climate change study<br />
meeting<br />
Future<br />
Municipal structure plan is large scale and conceptual where three<br />
alternatives for future expansion are presented.<br />
Undertaken by Consultants: Arcus Consultants (Maputo). Contact person:<br />
Architect Nhachungue +258 823263720<br />
Problems<br />
Listed on the drawing along with photos to illustrate are the following:<br />
1. Destruction of vegetation on primary dune<br />
2. Degradation of natural rock protection<br />
3. Disregard of existing prohibition measures (signage)<br />
4. Vehicular traffic on beaches<br />
5. Lack of toilet facilities (not relevant to <strong>Theme</strong> 2)<br />
6. Cutting / destruction of mangroves<br />
7. Lack of maintenance to coastal infrastructure<br />
8. Too many buildings in Tofo (relates to spatial planning)<br />
9. Solid waste management (illegal dumping in sensitive areas)<br />
10. Destruction of buildings due to erosion<br />
11. Slumping due to erosion<br />
12. Dunes disappearing<br />
Solutions<br />
No solutions other than seawall at Tofo were presented.<br />
Way forward <strong>Adaptation</strong> measures proposed by <strong>Theme</strong> 2 are relevant to addressing problems. Transfer<br />
knowledge to Municipality to enable them to question consultants.<br />
Field observations Wall design needs to be adjusted to respond to climate change impacts (e.g. sea-level rise<br />
(SLR), run-up and wave energy). Major erosion of foredunes north of Nautical Club. Attempts<br />
at dune toe protection inadequate.<br />
Comments 1. Municipality is aware that their current plans do not consider any climate change<br />
factors.<br />
2. Municipality willing to accept relevant recommended changes to current designs.<br />
3. Municipality is now aware of the importance of incorporating the affects of climate<br />
change in current and future plans.<br />
4. There is a need to ensure alignment of recommendations from different studies e.g.<br />
World Bank and current <strong>Theme</strong> 2 studies<br />
October 2012, p 251
Date 30 August 2011 Place Vilankulo<br />
Municipal representative (1): Jeremias Macubele (844651706)<br />
Position:<br />
Head: Administration, Finances & Local Economic Development<br />
Municipal representative (2): Andre Mavitice (846849560)<br />
Position:<br />
Head: Urban planning, Housing and Environment<br />
Municipal representative (3): Nelio Nhamutabe (828398320 / 848399390<br />
Position:<br />
Technical: Civil Engineering Construction<br />
Contact details:<br />
(as above)<br />
Available plans at<br />
meeting<br />
Current<br />
Old Master Plan (11 yrs old): Three expansion areas. Needs<br />
updating (Quote obtained for USD200 000). Did not take CC into<br />
consideration.<br />
Plan and design of new <strong>Coastal</strong> Road, seawall and boat slipway.<br />
(Did not consider CC or current coastal processes and wave energy<br />
aspects). Commissioned by Ministry of Tourism. Also has Ministry<br />
of Public Works & Housing logo on plans.<br />
Mentioned a Solid Waste Management plan (2010).<br />
Future<br />
Master Plan needs updating (see above)<br />
Problems 1. <strong>Coastal</strong> erosion<br />
2. Erosion of sandy steep slopes due to storm water (mainly in town centre)<br />
3. Erosion of sandy steep slopes due to storm water (mainly in town centre)<br />
4. No existing drainage system on paved roads (indirectly linked to <strong>Theme</strong> 2)<br />
5. Solid waste management (not for <strong>Theme</strong> 2)<br />
Solutions<br />
New <strong>Coastal</strong> Road design (see above)<br />
Solid waste management plan (not implemented yet – in final stages of approval)<br />
Way forward <strong>Adaptation</strong> measures proposed by <strong>Theme</strong> 2 are relevant to addressing problems. Transfer<br />
knowledge to Municipality to enable them to question consultants.<br />
Field observations<br />
Road, wall and slipway design needs to be adjusted to respond to climate change<br />
impacts (SLR, run-up, wave energy).<br />
Uncertainty about Datum Level for road design (refer to Consultant for clarification).<br />
This is important to allow alignment between <strong>Theme</strong> 2 study results and Engineering<br />
design levels.<br />
Arial Survey of Vilankulo (Oct 2000). Obtain datum level of ‘Iron peg in concrete’ Vill 1<br />
(739030.72; 7563494.32; WG84 UTM, Zone 36 – M 33 degrees) Height = 12.52 m (not<br />
sure if MSL – needs confirmation)<br />
Comments 1. The municipal representatives understood the technical concepts and the importance<br />
of taking the <strong>Theme</strong> 2 results seriously.<br />
2. Municipality is aware that their current plans do not consider any climate change<br />
factors.<br />
3. Municipality willing to accept relevant recommended changes to current designs.<br />
4. Municipality is now aware of the importance of incorporating the affects of climate<br />
change in current and future plans.<br />
5. Existing <strong>Coastal</strong> <strong>Protection</strong> design study completed and signed off (no further<br />
involvement from Consultant possible). Municipality looking for funding to<br />
implement, however needs to take CC (<strong>Theme</strong> 2 recommendations) and <strong>Coastal</strong><br />
Engineering design practise into consideration before final implementation.<br />
6. There is an opportunity for a Private-Public-Participation project within the Vilankulo<br />
Rest Camp area which could pay for engineering coastal protection and beach<br />
improvement works (as conceptually shown in <strong>Theme</strong> 2 results).<br />
7. It is important for INGC (and <strong>Theme</strong> 2) to interact with Ministry of Tourism as soon as<br />
possible.<br />
October 2012, p 252
Date 31 August 2011 Place Quelimane<br />
Municipal representative (1): Silva Mario (825772876)<br />
Position:<br />
Head: Planning & Development<br />
Municipal representative (2): Santiago Marques (825845440)<br />
Position:<br />
Head: Infrastructure & Housing<br />
Municipal representative (3): Iria Mvunguabe (827415740)<br />
Position:<br />
Technical: Urbanisation and Construction<br />
Contact details:<br />
As above<br />
Available plans at Current Outdated structure plan (2002)<br />
meeting<br />
Future<br />
No future plans available<br />
Problems<br />
None presented<br />
Solutions<br />
None presented<br />
Way forward Information and adaptation measures proposed by <strong>Theme</strong> 2 are relevant to inform and<br />
support future structure plan.<br />
Transfer knowledge to Municipality to enable them to include CC aspects into the Terms of<br />
Reference for future plans.<br />
Field observations Work being done on slipway (below HWM – no problem) and the removal of the shipwrecks in<br />
Mangrove area (Good). Provides opportunity for re-establishment of mangroves.<br />
Comments 1. The municipal representatives understood the technical concepts and the importance<br />
of taking the <strong>Theme</strong> 2 results seriously.<br />
2. Municipality not clear on future economic development of Quelimane so cannot plan<br />
in accordance.<br />
3. Municipality is now aware of the importance of incorporating the affects of climate<br />
change in current and future plans.<br />
4. Potable water supply from groundwater resources (no salinity problems for city water<br />
supply).<br />
5. Ideas for future waterfront development (e.g. Brazilians and/or Chinese) provide an<br />
opportunity for a Private-Public-Participation project which could pay for engineering<br />
adaptation actions (as conceptually shown in <strong>Theme</strong> 2 results).<br />
Date 1 September 2011 Place Nacala<br />
Municipal representative (1): Crisanto Paulo (+258 82 859 7423)<br />
Position:<br />
Head: Urban Planning<br />
Municipal representative (2): Adelino Cobre (+258 84 398 8239)<br />
Position:<br />
Technical: Civil Engineering<br />
Contact details:<br />
(as above)<br />
Available plans at Current Master Plan recently approved (2011). Did not take CC into consideration.<br />
meeting<br />
Future<br />
Implementation of the Master Plan<br />
Problems 1. Erosion of sandy steep slopes due to storm water (not for <strong>Theme</strong> 2)<br />
2. Drainage system inadequate (indirectly linked to <strong>Theme</strong> 2)<br />
3. Informal settlements on steep slopes (not for <strong>Theme</strong> 2)<br />
4. Lack of capacity (skills etc) and funding to implement Structure Plan (not for <strong>Theme</strong> 2)<br />
5. The local businesses and entrepreneurs are not volunteering to partner with the<br />
municipalities to address the environmental problems.<br />
6. Lack of formal waste site (not for <strong>Theme</strong> 2)<br />
7. No capacity to control possible pollution from shipping (not for <strong>Theme</strong> 2)<br />
Solutions<br />
Seeking private partnerships to help to fund and solve the problems<br />
Negotiating with World Bank for funding to implement prioritised actions.<br />
October 2012, p 253
Way forward<br />
<strong>Adaptation</strong> measures proposed by <strong>Theme</strong> 2 are relevant to addressing problems.<br />
Transfer knowledge to Municipality to enable them to question consultants.<br />
Results from <strong>Theme</strong> 2 need to be simplified for presentation and discussion at higher<br />
levels within the municipality to ensure take-up as a critical component of the<br />
Structure Plan.<br />
Field observations Municipality not seeing the opportunity to set conditions of approval that include partnering<br />
with the developers to improve (and fund) municipal infrastructure.<br />
Comments 1. The municipal representatives understood the technical concepts and the importance<br />
of taking the <strong>Theme</strong> 2 results seriously.<br />
2. Municipality is aware that their current plans do not consider any climate change<br />
factors.<br />
3. The technical level officials at the municipality are now aware of the importance of<br />
incorporating the affects of climate change in current and future plans however the<br />
higher level decision makers will need to be also convinced in order to effect any<br />
changes.<br />
4. It is important for INGC to facilitate the dissemination of the results to higher levels of<br />
decision making.<br />
5. All ministries commented and signed off on approved Structure Plan. It is therefore<br />
important for INGC (and <strong>Theme</strong> 2) to interact with Ministry of Tourism as soon as<br />
possible.<br />
Date 2 September 2011 Place Pemba<br />
Municipal representative (1): Mikas Muianga (+258 826699093)<br />
Position:<br />
Head: Urban Services<br />
Municipal representative (2): Abel Aluar (+258 826401980)<br />
Position:<br />
Municipal Focal Point Climate Change<br />
Municipal representative (3): Jose Tavale (+258 82 2581 370)<br />
Position:<br />
Technical representative<br />
Contact details:<br />
(as above)<br />
Available plans at<br />
meeting<br />
Current<br />
Outdated Structure Plan (Year unknown). Did not take CC into<br />
consideration.<br />
Future<br />
None<br />
Problems 1. Sea inundation in Paquite and Chibuabare<br />
2. Critical areas of coastal erosion are Chabane and Ruela<br />
3. Erosion of sandy steep slopes due to storm water (not for <strong>Theme</strong> 2)<br />
4. Informal settlements in vulnerable areas (not for <strong>Theme</strong> 2)<br />
5. Sand mining of coastal dunes reducing buffer area<br />
6. Lack of solid waste management (illegal dumping) -(not for <strong>Theme</strong> 2)<br />
7. Lack of capacity (skills etc) to evaluate and take critical environmental management<br />
decisions<br />
Solutions<br />
No current construction or implementation activities related to Climate Change<br />
aspects taking place.<br />
Aware that people in Paquite need to be resettled, but no specific plans were<br />
mentioned.<br />
Way forward<br />
<strong>Adaptation</strong> measures proposed by <strong>Theme</strong> 2 are relevant to addressing problems.<br />
Need to transfer knowledge to Municipality to enable them to question consultants.<br />
Results from <strong>Theme</strong> 2 need to be simplified for presentation and discussion at higher<br />
levels within the municipality to ensure take-up as a critical component of the<br />
Structure Plan.<br />
Field observations It was mentioned that the Ministry of Tourism has identified an area for future tourism<br />
October 2012, p 254
development (ARCO-NORTE = Northern Circle).<br />
Some infrastructure is located very close to the sea (e.g. on the foredunes)<br />
Sand mining site lowering landward side of the foredune and is at risk of being flooded if<br />
foredune is eroded away under high sea surges.<br />
Comments 1. The municipal representatives understood the technical concepts and the importance<br />
of taking the <strong>Theme</strong> 2 results seriously.<br />
2. Municipality is aware that their current plans do not consider any climate change<br />
factors.<br />
3. The technical level officials at the municipality are now aware of the importance of<br />
incorporating the affects of climate change in current and future plans however the<br />
higher level decision makers will need to be also convinced in order to effect any<br />
changes.<br />
4. It is important for INGC to facilitate the dissemination of the results to higher levels of<br />
decision making so-as to get the validation and approval to facilitate implementation<br />
in current and future plans.<br />
October 2012, p 255
THEME 2 MISSION TO INTERACT WITH MUNICIPALITY OF BEIRA<br />
20 -22 SEPTEMBER 2011<br />
Participants<br />
INGC- Figueiredo Araujo<br />
UEM- Jose Rafael<br />
CSIR- Andre Theron<br />
Purpose<br />
• To discuss the preliminary results of the <strong>Theme</strong> 2 study with relevant municipal officials.<br />
• To reach an understanding on the implications of climate change and the need to influence<br />
and incorporate recommendations into current and future plans.<br />
• To comment on current and future infrastructure and structure plans if available.<br />
• To identify existing specialist studies on climate change in order to harmonise<br />
recommendations if possible.<br />
• Site investigation of current coastal protection activities and provide observations.<br />
Structure of interaction (Agenda)<br />
Welcome (Municipality)<br />
Purpose and introduction (INGC)<br />
Technical context (UEM)<br />
Discussion (CSIR)<br />
Way forward (UEM)<br />
Closure (INGC)<br />
October 2012, p 256
Notes from the meeting<br />
Date 20 September 2011 Place BEIRA<br />
Municipal Representative:<br />
Mario Jose Guina<br />
Position:<br />
Head: Physical Planning<br />
Contact details: 82 43 88 540<br />
Municipal representative:<br />
Augusto Manhoca<br />
Position:<br />
Head: Sanitation<br />
Contact details: +25 82 56 49 390<br />
Available plans at<br />
meeting<br />
Current Strategic Plan approved in February 2010, which has coastal protection as<br />
the main subject<br />
Future<br />
Continuous implementation of the Strategic plan<br />
Problems<br />
The Municipality has identified the following problems:<br />
1. Destruction of vegetation on primary dune<br />
2. Disregard of existing prohibition measures<br />
3. Vehicular traffic on beaches<br />
4. Cutting / destruction of mangroves<br />
5. Lack of maintenance to coastal infrastructure<br />
6. <strong>Coastal</strong> erosion<br />
7. Destruction of buildings due to erosion<br />
8. Slumping due to erosion<br />
9. Dunes disappearing<br />
10. Informal settlement in risk areas along the coast<br />
11. Inundation<br />
Solutions<br />
The Municipality has identified the following solutions:<br />
Dune protection, dune restoration, 3km of tree planting along the coast, protection of dune<br />
vegetation, mangroves protection and restoration, specific areas for vehicular traffic on beach,<br />
seawall, groynes.<br />
Way forward <strong>Adaptation</strong> measures proposed by <strong>Theme</strong> 2 are relevant to addressing problems. Transfer<br />
knowledge to Municipality to enable them to question consultants and crosscheck ongoing<br />
implementation of adaptation measures.<br />
Field observations Opportunities exist for Public-Private-Partnerships to address the identified problems along the<br />
coastal interface.<br />
Comments 1. Municipality´s current strategic does consider climate change factors.<br />
2. Municipality is now more aware of the importance of incorporating the affects of<br />
climate change in current and future plans.<br />
3. In 2010 the Municipality created a Disaster Risk Management, Climate Change and<br />
<strong>Coastal</strong> <strong>Protection</strong> Department.<br />
4. There is a need to ensure alignment of recommendations from different studies and<br />
current <strong>Theme</strong> 2 studies.<br />
5. There is a need to replicate the study to other critical areas, such as the expansion<br />
area of Munhava to Ceramica.<br />
6. There is a need of having the final results of the study as soon as possible so that it<br />
can be used, bearing in mind that there are already activities being implemented and<br />
other to be implemented.<br />
7. Municipality is aware of the need to maximize PPP<br />
October 2012, p 257
THEME 2 MISSION TO INTERACT WITH MAPUTO PORT EXECUTIVE BOARD<br />
DIRECTOR, 25 NOVEMBER 2011<br />
Participants<br />
INGC- Figueiredo Araujo<br />
CSIR- Laurie Barwell<br />
Purpose<br />
• To discuss the preliminary results of the <strong>Theme</strong> 2 study with relevant municipal officials.<br />
• To reach an understanding on the implications of climate change and the need to influence<br />
and incorporate recommendations into current and future plans.<br />
• To comment on current and future infrastructure and structure plans if available. This to be insitu<br />
during the meeting and a follow-up note on relevant aspects were needed.<br />
• To identify existing specialist studies on climate change in order to harmonise<br />
recommendations if possible.<br />
• Site investigation of current coastal protection activities and provide observations if relevant.<br />
Structure of interaction (Agenda)<br />
Welcome (CFM)<br />
Purpose and introduction (INGC)<br />
Technical context (UEM)<br />
Discussion (CSIR)<br />
Way forward (UEM)<br />
Closure (INGC)<br />
October 2012, p 258
Notes from the meeting<br />
Date 25 November 2011 Place MAPUTO<br />
CFM Representative:<br />
Marta E. N. Mapilele<br />
Position:<br />
Executive Board Director<br />
Contact details: e-mail: mmapilele@cfmnet.mz Tel: 00 258 21 31 33 62<br />
CFM representative:<br />
Antonio Bie<br />
Position:<br />
Executive Director<br />
Contact details: e-mail: antonio.bie@cfm.co.mz mobile: 00258823273120<br />
CFM representative<br />
Miguel Jose Matabel<br />
Position:<br />
Inspector General<br />
Contact details:<br />
e-mail:<br />
mobile: 00258823199460<br />
miquel.matabel@cfmnet.co.mz<br />
Available plans at Current NONE<br />
meeting<br />
Future<br />
NONE<br />
Problems<br />
None mentioned<br />
Solutions<br />
None mentioned<br />
Way forward CFM board will share the presentation with the Port technical staff and discuss the results of<br />
the study. INGC will be contacted should there be questions or a need for further discussions.<br />
Field observations It is important to determine the actual elevation (to MSL) of the current port infrastructure to<br />
identify the areas at risk.<br />
Major redevelopment plans are underway for a new Waterfront development (including a<br />
new Cruise Ship terminal). This offers the opportunity to ensure that CC factors are taken into<br />
account in the design.<br />
Comments 1. CFM's activities and projects do not take climate change issues into consideration;<br />
2. CFM's activities and projects take into consideration environmental impact<br />
assessments. There is uncertainty is CC issues are considered in the specialist studies.;<br />
3. CFM is now more aware of the importance of incorporating the affects of climate<br />
change into current and future plans.<br />
4. CFM found the study relevant and are willing to use its results and underlined that<br />
the study was made at a good time since there are planned activities that did not take<br />
climate change issues into account;<br />
5. CFM suggested that INGC should contact the Ministry of Transport and<br />
Communication in order to organize a national seminar that would gather public and<br />
private stakeholders working with CFM so that everyone could be made aware and<br />
agree on how and when to start using the results of the study;<br />
6. CFM’s opinion is that the results of the study should be shared among different<br />
institutions within the government and harmonized with other studies, so that the<br />
recommendations come from one channel.<br />
October 2012, p 259
APPENDIX 3: COASTAL PROTECTION: SCOPE OF WORK (PHASE 2)<br />
Key Questions Work Packages Deliverables Assumptions<br />
Q1. Where are the most vulnerable<br />
areas along the coast, at the micro<br />
level?<br />
WP1. Generate realistic scenarios of future<br />
coastal conditions under climate change;<br />
D1.<strong>Coastal</strong> vulnerability index; [CHAPTER 2]<br />
Q2. What will these areas look like,<br />
with climate change, in future?<br />
Q3. Which key infrastructure and<br />
future investment plans are at risk in<br />
these areas?<br />
WP2. Determine the potential effects of<br />
climate change on the sediment transport<br />
potential and coastal erosion at Maputo;<br />
WP3. Research the potential effects of climate<br />
change on wave run-up levels and<br />
development set-back lines;<br />
D2. Shoreline change detection at<br />
representative points at the key<br />
sites(Maputo, Beira, Maxixe, Inhambane and<br />
Vilankulos);<br />
[APPENDIX 1]<br />
D3. Coarse climate change Risk Assessment for<br />
Mozambique <strong>Coastal</strong> Zone;<br />
[CHAPTER 6]<br />
D4. Description of realistic scenarios of future<br />
coastal conditions under climate change for<br />
Maputo;<br />
[CHAPTER 5]<br />
D5. Definition of potential effects of climate<br />
change on sediment transport (potential) and<br />
coastal erosion for Maputo;<br />
[CHAPTER 5]<br />
D6. Definition of the potential effects of<br />
climate change on wave run-up levels and<br />
development set-back lines for Maputo;<br />
[CHAPTERS 5 & 6]<br />
A1. Future coastal conditions scenarios<br />
limited to factors related to sediment<br />
transport potential, coastal erosion,<br />
wave run-up and development setback<br />
lines only;<br />
A2. Evaluation based on available<br />
information only (no detailed field<br />
measurements to be undertaken);<br />
A3. Short site visit to Maputo to verify<br />
the aspects related to vulnerability<br />
index;<br />
October 2012, p 260
Key Questions Work Packages Deliverables Assumptions<br />
For the identified 10 key sites:<br />
WP4. Determine the potential effects of<br />
climate change on the sediment transport<br />
potential and coastal erosion at the key sites;<br />
Q4. What shoreline management<br />
strategies are most appropriate (Do<br />
Nothing; Hold the existing line;<br />
Advance the existing line; Retreat)?<br />
WP5. Based on the output of WPs 1, 2, 3 and<br />
4, the 10 key sites will be analysed using<br />
available information (specific specialist field<br />
investigations are beyond the scope of this<br />
study);<br />
D7. Definition of potential effects of climate<br />
change on sediment transport (potential) and<br />
coastal erosion at the key sites;<br />
[CHAPTER 5]<br />
D8. Definition of the potential effects of<br />
climate change on wave run-up levels and<br />
development set-back lines at the key sites;<br />
[CHAPTERS 5 & 6]<br />
A4. Short site visit to the key sites to<br />
verify the aspects related to<br />
vulnerability index and to identify<br />
possible protection / adaptation<br />
options;<br />
A5. Input on projected future climate<br />
change scenarios required from <strong>Theme</strong><br />
8 (Extremes)<br />
WP6. A portfolio of relevant and practical<br />
coastal protection (adaptation and mitigation)<br />
measures will be defined using input from<br />
coastal engineering practice and experience<br />
from the Expert Reference Team following<br />
specific site evaluations (Field visits);<br />
D9. Shoreline management strategies defined<br />
for the 10km shoreline at each of the 10 key<br />
sites;<br />
[CHAPTER 8]<br />
A6. Detailed engineering design, e.g.<br />
hydraulic stability analyses or<br />
structural dimensioning, is not<br />
appropriate at this stage.<br />
Q5. What structural coastal<br />
protection measures are needed to<br />
compensate for the potential effects<br />
of climate change?<br />
WP7. Appropriate management approaches<br />
will be identified from published best practice<br />
and as advised by the Expert Reference Team<br />
following the site visits;<br />
D10. Conceptual designs, including functioning<br />
and location/general layout, where<br />
appropriate. Rough (ball-park) cost estimate<br />
provided.<br />
[CHAPTER 7]<br />
D11. Type of management / maintenance<br />
actions / approach identified for each of the<br />
conceptual protection measures. Rough (ballpark)<br />
cost estimate provided.<br />
[CHAPTER 8]<br />
A7. Site specific designs and<br />
construction specifications would be<br />
done under a final phase or directly<br />
with construction.<br />
A8. The scope of the deliverable is<br />
limited to a write-up of possible<br />
adaptation / mitigation options for<br />
coastal protection at the 10 key sites.<br />
October 2012, p 261
Key Questions Work Packages Deliverables Assumptions<br />
Q6. What should be the strategic<br />
framework on which all coastal<br />
structures and sea defences can be<br />
evaluated?<br />
WP8. Desk-top study to define appropriate<br />
evaluation criteria.<br />
Q7. What recommendations are in<br />
order for planned investments along<br />
the coast, with emphasis on Beira and<br />
Maputo?<br />
WP9. Take into consideration opportunities<br />
and constraints with respect to investment<br />
possibilities at Beira and Maputo.<br />
D12. Evaluation criteria appropriate for<br />
strategically evaluating proposed coastal<br />
structures and sea defences;<br />
[CHAPTER 7]<br />
D13. Generally for the various types of<br />
coastline and specifically related to identified<br />
developmental / investment opportunities at<br />
Maputo and Beira;<br />
[CHAPTER 7]<br />
A9. Criteria will be limited to<br />
appropriate coastal defence<br />
mechanisms and approaches.<br />
A10. Interaction with <strong>Theme</strong>s 3 and 4<br />
required.<br />
A11. Evaluation based on information<br />
to be provided by Mozambican<br />
stakeholders;<br />
Q8. What should go into a coastal<br />
zone information system?<br />
WP10. Identify relevant spatial and non-spatial<br />
information that can be made available via a<br />
proposed coastal zone information system;<br />
D14. Metadata of various information sets<br />
available.<br />
[ON CD]<br />
A12. It is assumed that a content<br />
management system via a suitable<br />
portal system will be made available.<br />
Q9. What input can be provided for<br />
an integrated coastal management<br />
policy?<br />
WP11. Providing collected data and<br />
information in the required format to feed<br />
into a communication system provided under<br />
<strong>Theme</strong> 1 as far as possible.<br />
WP12. Appropriate ICM policy relevant<br />
information will be identified from published<br />
best practice and as advised by the Expert<br />
Reference Team<br />
D15. Data and information gathered and<br />
developed under <strong>Theme</strong> 2 will be made<br />
available for communication via the relevant<br />
communication system provided via <strong>Theme</strong> 1.<br />
[ON CD]<br />
D16. Input relevant to <strong>Coastal</strong> <strong>Protection</strong><br />
under Climate Change provided for integration<br />
into an integrated coastal management policy<br />
for Mozambique;<br />
[CHAPTER 10]<br />
A13. The input will be limited to the<br />
scope of <strong>Theme</strong> 2 only. Development<br />
or writing of a ICM Policy document is<br />
beyond the scope of the contract.<br />
October 2012, p 262