Effects of global risk in transition countries Dr. Artan NIMANI Mr ...
Effects of global risk in transition countries Dr. Artan NIMANI Mr ...
Effects of global risk in transition countries Dr. Artan NIMANI Mr ...

Create successful ePaper yourself
Turn your PDF publications into a flip-book with our unique Google optimized e-Paper software.
<strong>Effects</strong> <strong>of</strong> <strong>global</strong> <strong>risk</strong> <strong>in</strong> <strong>transition</strong> <strong>countries</strong><br />
<strong>NIMANI</strong> <strong>Artan</strong> & ZEQIRAJ Valbona & SEJDIU Sherif - Price movement impact <strong>in</strong> apply<strong>in</strong>g VAT <strong>in</strong> Kosova<br />
PRICE MOVEMENT IMPACT IN APPLYING VAT IN KOSOVA<br />
<strong>Dr</strong>. <strong>Artan</strong> <strong>NIMANI</strong><br />
<strong>Mr</strong>. Valbona ZEQIRAJ<br />
<strong>Mr</strong>. Sherif SEJDIU<br />
Abstract<br />
This paper will analyze the price movement for the year <strong>of</strong> 2000 until the <strong>in</strong>troduction <strong>of</strong> value added tax <strong>in</strong> Kosovo (1 July 2001), and after<br />
apply<strong>in</strong>g it, There will be <strong>in</strong>cluded sec half <strong>of</strong> year 2001 and complete year <strong>of</strong> 2002.<br />
Also the price movements will be analyzed for the year 2008 and 2009 s<strong>in</strong>ce is known that scale <strong>of</strong> taxes <strong>of</strong> added value has been<br />
<strong>in</strong>creased from 15% to 16%. 16% norm has been applied from 01.01.2009.Special importance will be given to the issues with substantial<br />
effect <strong>in</strong> br<strong>in</strong>g<strong>in</strong>g specific conclusions. There will also be analyzed the cause <strong>of</strong> price <strong>in</strong>crease and decrease <strong>in</strong> the above mentioned<br />
period.<br />
KEYWORDS Behavior analysis, Value, Added, Tax, Kosovo.<br />
jel classification codes: D8, E4, G21.<br />
1. Introduction<br />
Value added tax is a form <strong>of</strong> taxation by which taxable<br />
value that the seller has added the purchase price, sales,<br />
production and services taxed at each stage <strong>of</strong> the cycle <strong>of</strong><br />
circulation.<br />
The tax base <strong>of</strong> this tax is the difference between<br />
sell<strong>in</strong>g price and the supplier. So the value added tax is a<br />
tax on consumption.<br />
One <strong>of</strong> the conditions states must meet to become a<br />
member <strong>of</strong> the European Union is obligated the<br />
<strong>in</strong>troduction <strong>of</strong> this tax (VAT) on their tax system VAT is<br />
spread<strong>in</strong>g very quickly, as <strong>in</strong> many <strong>in</strong>fectious<br />
diseases other <strong>countries</strong>. Thus, <strong>in</strong> the 70s <strong>of</strong> the twentieth<br />
century this tax <strong>in</strong> its tax systems have <strong>in</strong>troduced the 28<br />
states <strong>in</strong> the 80 - 48 <strong>countries</strong> <strong>in</strong> 90 years more than 100<br />
<strong>countries</strong>.<br />
This number does not end with that, but grow<strong>in</strong>g<br />
every year, therefore, accord<strong>in</strong>g to Mark Bloomfield and<br />
Margo Thorn<strong>in</strong>g, not only the VAT tax is really simple, but it<br />
is the most popular tax <strong>in</strong> the world.<br />
It is thought that <strong>in</strong> terms <strong>of</strong> taxation, the end <strong>of</strong> XIX century<br />
and first half <strong>of</strong> the twentieth century is characterized by<br />
the <strong>in</strong>come tax on <strong>in</strong>come, and VAT is the biggest<br />
<strong>in</strong>novation <strong>in</strong> the field <strong>of</strong> taxation <strong>in</strong> the last decades <strong>of</strong> the<br />
last century. Accord<strong>in</strong>g to C. Shoup, Pr<strong>of</strong>essor at Columbia<br />
University, VAT is the last phase, probably f<strong>in</strong>al, <strong>in</strong> the<br />
development <strong>of</strong> overall turnover tax.( Shoup, S.C.1989).<br />
2. FLUCTUATION OF PRICES, IN KOSOVO IN THE<br />
PERIOD 2000/2009<br />
Consumer Price Index (CPI) is a relative <strong>in</strong>dicator<br />
which shows the changes or the movement <strong>of</strong> retail prices<br />
for products and services and services consumed by<br />
households <strong>in</strong> the period <strong>of</strong> time, <strong>in</strong>volved <strong>in</strong> groups and<br />
subgroups, classified accord<strong>in</strong>g to the nomenclature called<br />
the International Classification <strong>of</strong> <strong>in</strong>dividual consumption by<br />
dest<strong>in</strong>ation (COICOP).<br />
This statistical parameter has a special significance<br />
for the economic, f<strong>in</strong>ancial, country, f<strong>in</strong>ancial policy<br />
development, measurement <strong>of</strong> liv<strong>in</strong>g standards,<br />
harmonization <strong>of</strong> personal <strong>in</strong>come, trade flows, etc..<br />
Consumer Price Index (CPI) is constructed accord<strong>in</strong>g to<br />
European standards and methodologies and these data<br />
regularly used by local and <strong>in</strong>ternational <strong>in</strong>stitutions.<br />
Statistical Office <strong>of</strong> Kosovo (SOK) consumer price <strong>in</strong>dex<br />
(CPI) began to publish <strong>in</strong> September 2002. Consumer<br />
prices have started to gather <strong>in</strong> May <strong>of</strong> 2002, which is<br />
considered the base month.<br />
CPI is calculated by tak<strong>in</strong>g <strong>in</strong>to account the<br />
observation <strong>of</strong> price movements <strong>of</strong> various commodities<br />
were grouped and given different weights. At first we<br />
analyze the price movement 2000-2008. And we will<br />
cont<strong>in</strong>ue with the analysis <strong>of</strong> price movement for the year<br />
2000 to the application <strong>of</strong> value added tax <strong>in</strong> Kosovo (1<br />
July 2001), and after the implementation <strong>of</strong> VAT <strong>in</strong> Kosovo,<br />
which will <strong>in</strong>clude the second half <strong>of</strong> 2001 and 2002 <strong>in</strong> its<br />
entirety. Also, the price movement will analyze for 2009,<br />
consider<strong>in</strong>g that the tax rate <strong>of</strong> VAT <strong>in</strong> Kosovo <strong>in</strong>creased<br />
from 15% to 16%, which rate (16%) began to be<br />
implemented on January 1, 2009.<br />
When analyz<strong>in</strong>g price movement we should note two<br />
issues that have substantial impact on the conclusions<br />
should be taken:<br />
- Under one has to do with the availability <strong>of</strong> data<br />
and their source. Given that the Statistical Office<br />
<strong>of</strong> Kosovo has begun the publication <strong>of</strong> the CPI<br />
as <strong>of</strong> May 2002, the 2000/2001 period and the<br />
time period January-April 2002, before and after<br />
implementation <strong>of</strong> VAT. The data is reliable <strong>in</strong><br />
this respect seem to be those published by the<br />
M<strong>in</strong>istry <strong>of</strong> Economy and F<strong>in</strong>ance (<strong>in</strong> cooperation<br />
with the Central Fiscal Authority) <strong>in</strong> Monthly<br />
Macroeconomic Monitor,( Daliq, S.et.al. 2008).<br />
- Under the two has to do with the quality and<br />
comparability <strong>of</strong> these data. Unlike the CPI,<br />
calculated by SOK based on data collected on a<br />
regular basis for a large number <strong>of</strong> articles, the<br />
price <strong>in</strong>dex published by the MEF <strong>in</strong>cludes a<br />
smaller number <strong>of</strong> items.<br />
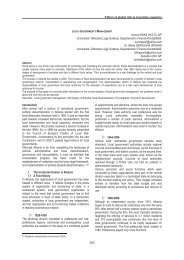
The data from the table and chart below show a<br />
significant <strong>in</strong>crease <strong>in</strong> prices (<strong>in</strong>dex 128.26 <strong>in</strong> December<br />
2008) throughout the postwar period, despite the fact that<br />
this <strong>in</strong>crease was not uniform from year to year.<br />
Secondary period is characterized by two years <strong>of</strong> high<br />
growth <strong>of</strong> prices (2001-8.76% and 2007 - 10.50%) 6, two<br />
years with a lower rate <strong>of</strong> price <strong>in</strong>crease than the previous<br />
two years (2000-3.92% and 2002 -3.82%), four years had<br />
the lowest rate <strong>of</strong> price <strong>in</strong>crease (2003 to 0.50%, 2005 to<br />
0.70%, 2006-1.10% and 2008 to 0.50%) and one year we<br />
reduce Price (2004 - with negative rate <strong>of</strong> 3.80%).<br />
409
<strong>Effects</strong> <strong>of</strong> <strong>global</strong> <strong>risk</strong> <strong>in</strong> <strong>transition</strong> <strong>countries</strong><br />
Table 3. The data from the table and chart below show a significant <strong>in</strong>crease <strong>in</strong> prices (<strong>in</strong>dex 128.26 <strong>in</strong> December 2008)<br />
throughout the postwar period<br />
3. Price fluctuation prior to the implementation <strong>of</strong> vat<br />
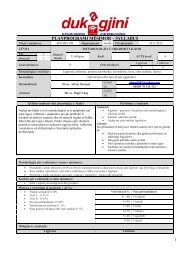
Based on macroeconomic data from the Monthly Monitor (MMM), 2000 is characterized by a low-price<br />
<strong>in</strong>creases <strong>of</strong> 3.9% (monthly rate <strong>of</strong> <strong>in</strong>crease / decrease the price for January 2000 is not taken <strong>in</strong>to account for the lack<br />
<strong>of</strong> data) .<br />
As seen from the table and graph (below), the year 2000 was characterized by large sw<strong>in</strong>gs <strong>in</strong> the monthly rate <strong>of</strong> price<br />
movement, and the discount <strong>of</strong> 2.95% <strong>in</strong> March and 31.2% <strong>in</strong>crease <strong>in</strong> December.<br />
Table 2. Based on macroeconomic data from the Monthly Monitor (MMM), 2000<br />
The<br />
price<br />
rise has cont<strong>in</strong>ued with <strong>in</strong>creased <strong>in</strong>tensity dur<strong>in</strong>g the first<br />
half <strong>of</strong> 2001, before<br />
the implementation <strong>of</strong> value added tax (VAT),<br />
result<strong>in</strong>g <strong>in</strong> one <strong>of</strong> my high annual rates <strong>of</strong> prices dur<strong>in</strong>g<br />
the post war period this level <strong>of</strong> 6.95% (June 2001 or<br />
December2000).<br />
As seen from the table and graph (below) the first half <strong>of</strong><br />
2001 is characterized by a cont<strong>in</strong>ued <strong>in</strong>crease <strong>of</strong><br />
prices <strong>in</strong> each month compared with December 2000. The<br />
highest <strong>in</strong>creases have <strong>in</strong> May, to 5.64%,<br />
and June, 6.95%. This shows that the highest <strong>in</strong>creases <strong>in</strong><br />
prices have existed <strong>in</strong> the past two months before the<br />
application <strong>of</strong> VAT.<br />
Oscillation prices <strong>in</strong> Kosovo <strong>in</strong> the period <strong>of</strong> before<br />
implement<strong>in</strong>g <strong>of</strong> VAT, where period <strong>in</strong>clusive January<br />
2000 - June 2001, ris<strong>in</strong>g the price is too high, where<br />
the <strong>in</strong>dex is 111.14% (June 2001, January 2000),<br />
an <strong>in</strong>crease <strong>of</strong> 11.14%.<br />
The reasons for these <strong>in</strong>creases are manifold, but we<br />
will mention a few:<br />
-<br />
Increased prices <strong>in</strong> this period more is imported, unfortunat<br />
ely it imports most <strong>of</strong> the items,<br />
Kosovo has extremely high import prices.<br />
This support with the data that the imports share <strong>of</strong> f<strong>in</strong>al<br />
Consumption <strong>of</strong> households is, <strong>in</strong> 2004 (44.6%), 2005<br />
(46.6%) 2006 (47.7%) and 2007 (49.6%),<br />
- Due to fear the application <strong>of</strong> VAT, which was due<br />
to ignorance <strong>of</strong> the function<strong>in</strong>g and lack<br />
<strong>of</strong> proper education implementers <strong>of</strong> VAT,<br />
- psychological aspect,<br />
- speculative aspect.<br />
Table 3. Data that the imports share <strong>of</strong> f<strong>in</strong>al Consumption <strong>of</strong> households<br />
410
<strong>Effects</strong> <strong>of</strong> <strong>global</strong> <strong>risk</strong> <strong>in</strong> <strong>transition</strong> <strong>countries</strong><br />
From the above table it is evident that <strong>in</strong> the first half<br />
<strong>of</strong> 2001 prices have <strong>in</strong>creased each month compared with<br />
December <strong>of</strong> 2000 <strong>in</strong> Kosovo, as well as <strong>in</strong> Eurozonë.9 *<br />
However, this price <strong>in</strong>crease is significantly higher <strong>in</strong><br />
Kosovo, which is 6.95%, than <strong>in</strong> the Euro zone, where<br />
growth was only 1.96%, which means that <strong>in</strong> Kosovo <strong>in</strong> the<br />
first 6-month period <strong>of</strong> 2001, prices <strong>in</strong>creased by 4.9%<br />
more than <strong>in</strong> the euro area <strong>countries</strong>, that will graphically<br />
present.<br />
4. FLUCTUATION OF PRICES AFTER VAT<br />
IMPLEMENTATION<br />
Obviously that any conclusion on price movement<br />
dur<strong>in</strong>g before implementations <strong>of</strong> the value added tax<br />
should be drawn with reservation, given the different<br />
economic developments each year and the lack <strong>of</strong> reliable<br />
data.<br />
We here will do the analysis <strong>of</strong> price movement for the<br />
second period <strong>of</strong> 2001, when he started the application <strong>of</strong><br />
VAT (1-July - 2001), and for 2002, which year is the first<br />
year after application VAT. As seen from the table and<br />
graph below, the second half <strong>of</strong> 2001 is characterized by:<br />
- Increased price almost <strong>in</strong>visible for the second half <strong>of</strong><br />
2001 and this <strong>in</strong>crease was only 1.69%. Dur<strong>in</strong>g this 6-<br />
month period <strong>in</strong> two months (August and September 2001)<br />
is decreased (-1.38% and -0.17%), while <strong>in</strong> four other<br />
months have <strong>in</strong>creased, <strong>in</strong> July (12:41%), October (0.07%),<br />
November (0.50%) and December (1.69%).<br />
Whereas, if you look at price trends <strong>in</strong> the second half<br />
<strong>of</strong> 2001 <strong>in</strong> Kosovo, it is obvious that rais<strong>in</strong>g the price is<br />
much lower than <strong>in</strong> the first half <strong>of</strong> this year, which is 1.69%<br />
over that part, and <strong>in</strong> compared to rais<strong>in</strong>g prices <strong>in</strong> the euro<br />
area, is higher by 1.60% <strong>in</strong> the Euro zone, where growth<br />
was only 0.09%.<br />
The data published by Euro stat show clearly that its<br />
impact on the monthly trend <strong>of</strong> ris<strong>in</strong>g prices has been<br />
between -0.27% <strong>in</strong> July 2001 and 0.65% for the month <strong>of</strong><br />
April was <strong>of</strong> that year.<br />
Euro zone CPI Index is expressed through the so-called<br />
MUICP. From this we can conclude that the <strong>in</strong>crease <strong>in</strong><br />
prices <strong>in</strong> Kosovo application <strong>of</strong> VAT has not had quite an<br />
impact. Although the experiences from other <strong>countries</strong><br />
<strong>in</strong>dicate that <strong>in</strong> the <strong>in</strong>itial application <strong>of</strong> this tax is<br />
associated with immediate price <strong>in</strong>crease, as a reflection <strong>of</strong><br />
tax payers, tax effects to convey to the consumer.<br />
International Monetary Fund (IMF) has done research <strong>in</strong> 35<br />
<strong>countries</strong> where the comparison <strong>of</strong> price movements <strong>in</strong> the<br />
first two years and two years after the application <strong>of</strong><br />
VAT. These researches have shown that the<br />
implementation <strong>of</strong> VAT has caused the follow<strong>in</strong>g effects 11.<br />
1) the immediate establishment <strong>of</strong> prices <strong>in</strong> seven<br />
(7) states,<br />
2) <strong>in</strong>crease the acceleration <strong>of</strong> <strong>in</strong>flation <strong>in</strong> five (5)<br />
states,<br />
3) the immediate establishment <strong>of</strong> prices has been<br />
due to <strong>in</strong>creas<strong>in</strong>g the speed <strong>of</strong> the consumer<br />
price <strong>in</strong>dex <strong>in</strong> (1) state and<br />
4) For the 22 <strong>countries</strong> research has shown that the<br />
application <strong>of</strong> VAT has had little or no impact on<br />
price tremor.<br />
5) In Croatia, prices have risen by 2.4% <strong>in</strong> January<br />
1998 (<strong>in</strong>troduction <strong>of</strong> VAT has started on<br />
1.01.1998), after that prices have stabilized and<br />
<strong>in</strong>flation that year was 5.4%. In 1996 <strong>in</strong>flation <strong>in</strong><br />
Croatia was 3.4%, 1997 - 3.8%, while <strong>in</strong> 1999 -<br />
4.4%. 12 *<br />
From these data <strong>in</strong>dicate that <strong>in</strong> Croatia <strong>in</strong> the<br />
four years mentioned above <strong>in</strong>flation has been higher<br />
<strong>in</strong> 1998, started implementation <strong>of</strong> VAT.<br />
Table 4. The data published by Euro stat, period 2001.<br />
From<br />
the above table and graph that compares prices rate growt<br />
h <strong>in</strong> Kosovo and the euro area for 2001, can be<br />
observed that:<br />
- The general level <strong>of</strong> prices <strong>in</strong> Kosovo is on the<br />
general level <strong>of</strong> prices <strong>in</strong> the euro area as a<br />
result <strong>of</strong> higher monthly rates <strong>of</strong> price<br />
<strong>in</strong>creases, especially <strong>in</strong> the first half <strong>of</strong> 2001,<br />
- monthly price changes are characterized by large<br />
sw<strong>in</strong>gs and highlighted <strong>in</strong> Kosovo, especially <strong>in</strong> the first<br />
half <strong>of</strong> 2001, which can not be said for the second half <strong>of</strong><br />
2001,when began the implementation <strong>of</strong> valueadded<br />
. But <strong>in</strong> the Euro zone these oscillations<br />
are significantly lower and s<strong>of</strong>ter.<br />
Year 2002 is the first year that the<br />
VAT is applied, so will do an analysis <strong>of</strong> prices <strong>in</strong> this<br />
year. The total <strong>in</strong>dex <strong>of</strong> consumer prices<br />
<strong>in</strong> Kosovo <strong>in</strong> 2002 reached 103.82% compared with<br />
December <strong>of</strong> 2001, which shows an <strong>in</strong>crease <strong>of</strong> 3.82%.<br />
Dur<strong>in</strong>g monitor<strong>in</strong>g the<br />
movement <strong>of</strong> prices <strong>in</strong><br />
2002 clearly observed two trends:<br />
- The year was concluded with the general<br />
price <strong>in</strong>crease <strong>of</strong> 3.82%;<br />
- Shak<strong>in</strong>g significant monthly price movements;<br />
- Two opposite trends dur<strong>in</strong>g the year, seen from the<br />
follow<strong>in</strong>g table: <strong>in</strong> the first quarter coupled with ris<strong>in</strong>g<br />
prices, then have a price drop <strong>in</strong> five months, with the<br />
411
<strong>Effects</strong> <strong>of</strong> <strong>global</strong> <strong>risk</strong> <strong>in</strong> <strong>transition</strong> <strong>countries</strong><br />
exception <strong>of</strong> May, and aga<strong>in</strong> last year period (September- December) is characterized by constant growth <strong>of</strong> prices.<br />
Table 5. Dur<strong>in</strong>g monitor<strong>in</strong>g the movement <strong>of</strong> prices <strong>in</strong> 2002 clearly observed<br />
Price movement <strong>in</strong> Kosovo <strong>in</strong> the period after<br />
implementation <strong>of</strong> VAT which is <strong>in</strong>cluded the period June<br />
2001-December 2002. In this period, we drop the price to<br />
2:03%, which makes it concluded that:<br />
- The implementation <strong>of</strong> VAT has no <strong>in</strong>fluence <strong>in</strong> rais<strong>in</strong>g<br />
prices, rather have a noticeable drop them from 2:03%.<br />
5. FLUCTUATION OF PRICES FOR 2009<br />
Value added tax <strong>in</strong> Kosovo has started to be<br />
implemented by July 1, 2001 and chargeable at the rate <strong>of</strong><br />
15% on the taxable value. This tax rate is applied to the<br />
end <strong>of</strong> 2008. From a January 2009, the tax rate <strong>in</strong>creased<br />
from 15% to 16%, which means <strong>in</strong>creased 1%.<br />
Dur<strong>in</strong>g 2009 the price after the shak<strong>in</strong>g rate <strong>in</strong>creased<br />
the value added tax by 1%. The total <strong>in</strong>dex <strong>of</strong> consumer<br />
prices <strong>in</strong> Kosovo <strong>in</strong> 2009 compared with 2008, decreased<br />
to an average <strong>of</strong> -2.4%. * 13<br />
as seen from the table and graph below, s<strong>in</strong>ce 2009 are<br />
characterized by:<br />
- drop the price for each month <strong>of</strong> 2009 compared with<br />
December 2008, with the exception <strong>of</strong> December, when<br />
there is an <strong>in</strong>crease only to 0.09%, the largest falls we<br />
have <strong>in</strong> the month <strong>of</strong> May (-2.1%), July (-2.2%) and August<br />
(-2.3%)<br />
- Based on these data, we can conclude that rais<strong>in</strong>g the tax<br />
rate <strong>of</strong> VAT has done noth<strong>in</strong>g to <strong>in</strong>crease prices, as seen<br />
from the table above.<br />
Table 6. The total <strong>in</strong>dex <strong>of</strong> consumer prices <strong>in</strong> Kosovo <strong>in</strong> 2009 compared with 2008<br />
5. CONCLUSION<br />
On the basis <strong>of</strong> these data listed above, one can conclude that:<br />
- In the before implementation <strong>of</strong> VAT have a significant <strong>in</strong>crease <strong>in</strong> prices, which is 11.14%<br />
- In the after application <strong>of</strong> VAT have a price reduction for 2:03% and<br />
- In the build<strong>in</strong>g tax rate <strong>of</strong> VAT have an <strong>in</strong>visible <strong>in</strong>crease prices, it is only 0.9%.<br />
The causes <strong>of</strong> these behaviors <strong>in</strong> these periods, we emphasized above.<br />
REFERENCES<br />
1. Shoup, S.C.1989: Public F<strong>in</strong>ance, Ald<strong>in</strong>e Pub. Comp., Chicago , USA.<br />
2. Daliq, S.et.al. 2008, : Procjena moguçeg uticaja uvogjenja poreza dodatnu us vrijednost was Hrvatskoj,<br />
3. F<strong>in</strong>ansijska Praxis, Zagreb, Town 2 / 96. , Croatija<br />
4. Consumer Price Index for the years 2002/2009 SOK, Prist<strong>in</strong>a, June 2009, Eight local Brutoprodukti SOK,<br />
412
<strong>Effects</strong> <strong>of</strong> <strong>global</strong> <strong>risk</strong> <strong>in</strong> <strong>transition</strong> <strong>countries</strong><br />
5. 2004 to 2007, page 10.<br />
6. In the Eurozone <strong>in</strong>flation rate measured by CPI Monetary Union (MUICP-Monetary Union Index <strong>of</strong><br />
7. Consumer Prices).<br />
8. Trasition Report,2003, EBRD, London, UK<br />
9. David W. 1996, : Vali-Added Tax, International Monetary Fund, Wash<strong>in</strong>gton, USA.<br />
10. The data <strong>in</strong> the euro area are <strong>in</strong> various monthly publications (Statistics <strong>in</strong> focus) <strong>of</strong> Eurostat.<br />
413
414<br />
<strong>Effects</strong> <strong>of</strong> <strong>global</strong> <strong>risk</strong> <strong>in</strong> <strong>transition</strong> <strong>countries</strong>