Managing and Treating Landfill Leachate
Managing and Treating Landfill Leachate
Managing and Treating Landfill Leachate

You also want an ePaper? Increase the reach of your titles
YUMPU automatically turns print PDFs into web optimized ePapers that Google loves.
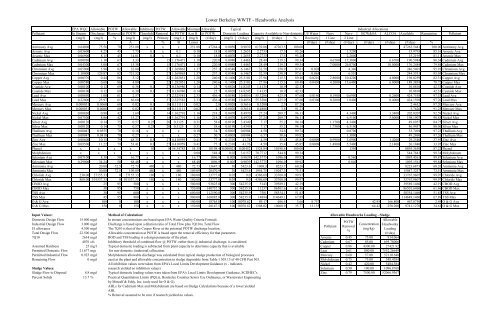
Lower Berkeley WWTF - Headworks Analysis<br />
EPA WQC Allowable POTW Allowable Inhibitory POTW Allowable MinimumAllowable Typical Industrial Allocations<br />
Pollutant In Stream Discharge Removal @ POTW Threshold Removal at POTW A,or B @ POTW Domestic Loading Capacity Available to Non-domestic US Water Navy Navy BCW&SA ALCOA Available Remaining Pollutant<br />
(mg/l) (mg/l) % (mg/l) (mg/l) Primary (mg/L) (mg/l) (#/day) (mg/l) (#/day) (mg/l) (#/day) % Recovery 1 Line 2 Line<br />
A % B Lesser (#/day) (#/day) (#/day) (#/day) (#/day) (#/day) %<br />
Antimony Avg 0.64000 75.56 70 251.88 x x x 251.88 47264.4 0.0050 0.9039 6139.86 47263.5 100.00 47263.5441 100.00 Antimony Avg<br />
Arsenic Avg 0.03600 4.25 45 7.73 0.1 x 0.1 0.10 18.8 0.0070 1.2655 2.2733 17.5 93.26 1.5200 15.9795 85.16 Arsenic Avg<br />
Arsenic Max 0.06900 8.15 45 14.81 0.1 x 0.1 0.10 18.8 0.0070 1.2655 2.2733 17.5 93.26 2.2800 15.2195 81.11 Arsenic Max<br />
Cadmium Avg 0.00930 1.10 67 3.33 1 15 1.176471 1.18 220.8 0.0080 1.4463 28.49 219.3 99.34 4.6700 17.3800 6.6700 190.5984 86.34 Cadmium Avg<br />
Cadmium Max 0.04300 5.08 67 15.38 1 15 1.176471 1.18 220.8 0.0080 1.4463 28.49 219.3 99.34 7.0000 26.0700 10.0000 176.2484 79.84 Cadmium Max<br />
Chromium Avg 0.05000 5.90 82 32.80 1 27 1.369863 1.37 257.1 0.0340 6.1467 32.59 250.9 97.61 0.028 4.340 246.5401 95.91 Chromium Avg<br />
Chromium Max 1.10000 129.87 82 721.52 1 27 1.369863 1.37 257.1 0.0340 6.1467 32.59 250.9 97.61 0.065 6.510 244.3331 95.05 Chromium Max<br />
Copper Avg 0.00370 0.44 86 3.12 1 22 1.282051 1.28 240.6 0.1400 25.3101 27.96 215.3 89.48 0.0210 2.8000 10.4200 4.0000 198.0259 82.31 Copper Avg<br />
Copper Max 0.00580 0.68 86 4.89 1 22 1.282051 1.28 240.6 0.1400 25.3101 27.96 215.3 89.48 0.0430 4.2000 15.6400 6.0000 189.3839 78.72 Copper Max<br />
Cyanide Avg 0.00100 0.12 69 0.38 0.1 27 0.136986 0.14 25.7 0.0820 14.8245 1.4135 10.9 42.33 10.8810 42.33 Cyanide Avg<br />
Cyanide Max 0.00100 0.12 69 0.38 0.1 27 0.136986 0.14 25.7 0.0820 14.8245 1.4135 10.9 42.33 10.8810 42.33 Cyanide Max<br />
Lead Avg 0.00850 1.00 61 2.57 1 57 2.325581 2.33 436.4 0.0580 10.4856 55.3286 425.9 97.60 0.0140 0.1900 0.6900 0.2600 424.7558 97.33 Lead Avg<br />
Lead Max 0.22000 25.97 61 66.6060 1 57 2.325581 233 2.33 436.44 0.05800580 10.4856 55.3286 425.9 97.60 0.03000300 0.2800 1.0400 0.4000 424.1598 97.20 Lead Max<br />
Mercury Avg 0.000051 0.0060 60 0.02 0.1 10 0.111111 0.02 2.8 0.0020 0.3616 0.3200 2.5 87.20 2.4632 87.20 Mercury Avg<br />
Mercury Max 0.000051 0.0088 60 0.02 0.1 10 0.111111 0.02 4.1 0.0020 0.3616 0.4888 3.8 91.23 3.7626 91.23 Mercury Max<br />
Nickel Avg 0.00830 0.98 42 1.69 1 14 1.162791 1.16 218.2 0.0470 8.4970 27.24 209.7 96.11 4.3400 3.3400 202.0207 92.59 Nickel Avg<br />
Nickel Max 0.07500 8.86 42 15.27 1 14 1.162791 1.16 218.2 0.0470 8.4970 27.24 209.7 96.11 6.5100 5.0000 198.1907 90.83 Nickel Max<br />
Silver Avg 0.00120 0.14 75 0.57 0.25 20 0.3125 0.31 58.6 0.0190 3.4349 7.17 55.2 94.14 1.1700 4.3400 49.6957 84.75 Silver Avg<br />
Silver Max 0.00120 0.14 75 0.57 0.25 20 0.3125 0.31 58.6 0.0190 3.4349 7.17 55.2 94.14 1.7500 6.5100 46.9457 80.06 Silver Max<br />
Thallium Avg 0.00047 0.0555 70 0.18 x x x 0.18 34.7 0.0005 0.0904 4.50 34.6 99.74 0.8700 33.7494 97.23 Thallium Avg<br />
Thallium Max 0.00047 0.0810 70 0.27 x x x 0.27 50.7 0.0005 0.0904 6.57 50.6 99.82 1.3000 49.2860 97.26 Thallium Max<br />
Zinc Avg 0.08600 10.15 79 48.35 0.3 27 0.410959 0.41 77.1 0.2310 41.76 4.59 35.4 45.85 0.0009 0.9900 3.6900 1.4200 29.2540 37.93 Zinc Avg<br />
Zinc Max 0.09500 11.22 79 53.41 0.3 27 0.410959 0.41 77.1 0.2310 41.76 4.59 35.4 45.85 0.0009 1.4900 5.5400 2.1400 26.1840 33.95 Zinc Max<br />
Phenol x x x x 50 8 54.34783 54.35 10198.4 0.000025 0.00452 1324.84 10198.4 100.00 1303 8895.3650 87.22 Phenol<br />
Molybdenum x x x x x x x 0.00 548.4 0.02 3.6157 70.7712 544.8 99.34 544.7843 99.34 Molybdenum<br />
Selenium Avg 0.07100 8.38 50 16.77 x x x 16.77 1096.9 0.005 0.9039 142.3775 1096.0 99.92 0.560 1095.4361 99.87 Selenium Avg<br />
Selenium Max 0.29000 34.24 50 68.48 x x x 68.48 1096.9 0.005 0.9039 142.3775 1096.0 99.92 0.840 1095.1561 99.84 Selenium Max<br />
Ammonia Avg 20.00 72.5 72.73 480 x 480 72.73 13647.3 30 5423.6 1068.3 8223.7 60.26 8223.6873 60.26 Ammonia Avg<br />
Ammonia Max 30.00 72.5 109.09 480 x 480 109.09 20470.9 30 5423.6 1954.75 15047.3 73.51 15047.3237 73.51 Ammonia Max<br />
Chloride Avg 230.0000 27155.33 0 27155.33 180 x 180 180.0000 33777.0 005 0.05 90 9.0 4386.6969 33768.0 99.9797 33767.9607 99.9797 Chloride Avg<br />
Chloride Max 860.00 101537.33 0 101537.33 180 x 180 180.00 33777.0 0.05 9.0 4386.69 33768.0 99.97 33767.9607 99.97 Chloride Max<br />
CBOD Avg 25 95 500 x x x 500.00 93825.0 300 54235.9 5143 39589.1 42.19 39589.1460 42.19 CBOD Avg<br />
CBOD Max 38 95 750 x x x 750.00 140737.5 300 54235.9 11237 86501.6 61.46 86501.6460 61.46 CBOD Max<br />
TSS Avg 30 95 600 x x x 600.00 112590.0 300 54235.9 7581 58354.1 51.83 58354.1460 51.83 TSS Avg<br />
TSS Max 45 95 900 x x x 900.00 168885.0 300 54235.9 14894 114649.1 67.89 114649.1460 67.89 TSS Max<br />
O & G Avg 100 0 100 x x x 100.00 18765.0 100 18078.62 89.17 686.4 3.66 8.757 42.95 166.800 467.8750 2.49 O & G Avg<br />
O & G Max 150 0 150 x x x 150.00 28147.5 100 18078.62 1308.02 10068.9 35.77 13.135 64.42 250.200 9741.1270 34.61 O & G Max<br />
Input Values:<br />
Method of Calculation:<br />
Allowable Headworks Loading - Sludge<br />
Domestic Design Flow 15.000 mgd In stream concentrations are based upon EPA Water Quality Criteria Formuli.<br />
Allowable<br />
POTW<br />
Industrial Design Flow 3.000 mgd Discharge is based upon a dilution ratio of Total Flow plus 7Q10 to Total Flow.<br />
Concentration Headworks<br />
Pollutant Removal<br />
I/I allowance 4.500 mgd The 7Q10 is that of the Cooper River at the potential POTW discharge location.<br />
(mg/kg) Loading<br />
%<br />
Total Design Flow 22.500 mgd Allowable concentration at POTW is based upon the removal efficiency for that parameter,<br />
(#/day)<br />
7Q10 2634 mgd BOD <strong>and</strong> TSS loading is a design parameter of the plant. Arsenic 0.45 75.00 914.064<br />
4076 cfs Inhibitory threshold of combined flow @ POTW, rather than @ industrial discharge, is considered. Cadmium 0.67 85.00 695.78006<br />
Assumed Hardness 25 mg/l Typical domestic loading is subtracted from plant capacity to determine capacity that is available Copper 0.86 4300.00 27421.92<br />
Permitted Domestic Flow 21.677 mgd for non-domestic (industrial) allocation. Lead 061 0.61 840.0000 7552.2664926649<br />
Permitted Industrial Flow 0.923 mgd Molybdenum allowable discharge was calculated from typical sludge production of biological processes Mercury 0.60 57.00 521.01648<br />
Remaining Flow 0 mgd used at the plant <strong>and</strong> allowable concentration in sludge disposable from Table 1 503.13 of 40 CFR Part 503. Molybdenum 0.75 75.00 548.4384<br />
All inhibition values were taken from EPA's Local Limits Development Guidance (x - indicates Nickel 0.42 420.00 5484.384<br />
Sludge Values: research yielded no inhibition values) Selenium 0.50 100.00 1096.8768<br />
Sludge Flow to Disposal 4.8 mgd Typical domestic loading values were taken from EPA's Local Limits Development Guidance, SCDHEC's Zinc 0.79 7500.00 52066.9367<br />
Percent Solids 13.7 % Practical Quantitation Limits (PQLs), Berekeley Counties Sewer Use Ordinance, or Wastewater Engineering<br />
by Metcalf & Eddy, Inc. (only used for O & G).<br />
AHLs for Cadmium Max <strong>and</strong> Molybdenum are based on Sludge Calculations because of a lower yielded<br />
AHL<br />
% Removal assumed to be zero if research yielded no values.