Managing and Treating Landfill Leachate
Managing and Treating Landfill Leachate
Managing and Treating Landfill Leachate

Create successful ePaper yourself
Turn your PDF publications into a flip-book with our unique Google optimized e-Paper software.
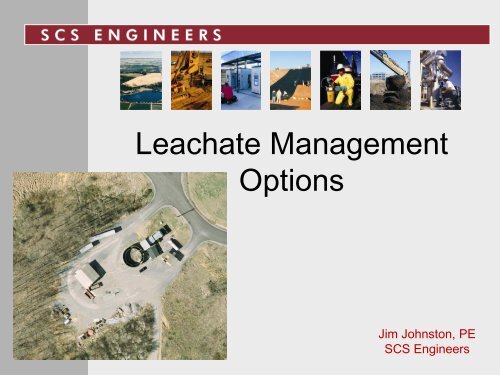
<strong>Leachate</strong> Management<br />
Options<br />
Jim Johnston, PE<br />
SCS Engineers
<strong>Leachate</strong> is<br />
Industrial<br />
Wastewater<br />
• Regulated under NPDES<br />
• A Categorical Point Source When<br />
Discharged Directly<br />
• IW Pretreatment (to POTW)-No NPS<br />
• Can be l<strong>and</strong> applied with certain restrictions<br />
• Can be recirculated within certain limitations<br />
2
Currently Most<br />
Common<br />
Means of<br />
Disposal:<br />
3<br />
• Pump & Haul<br />
• Private Carrier<br />
• Pretreatment by<br />
POTW<br />
• Direct VPDES<br />
Discharges are Being<br />
Discouraged
Business Cents<br />
What’s Up With <strong>Leachate</strong>?<br />
• Many Have Not Been Directed to Treat/Pretreat<br />
• Pump & Haul is Getting Expensive<br />
• DPWs, WWTPs Pressed for Nutrient Removal<br />
• POTW Capacity Stretched by Development<br />
• Corrosion of Infrastructure<br />
• May Have Had Upsets<br />
5
Recirculation to Inactive Cells<br />
•Recirculation on Subtitle D Liner is OK<br />
•May require Minor Amendment<br />
•Recirculation on Alternative Liner Limited<br />
•RDD Rule only codified by some states<br />
6
RD&D Flexibilities<br />
<strong>Leachate</strong> recirculation <strong>and</strong> liquid<br />
additions over alternative liners<br />
Alternative final covers for l<strong>and</strong>fills<br />
(especially in arid regions)<br />
7<br />
Bioreactor provisions:<br />
Add liquid wastes<br />
Add water<br />
Alternative daily cover<br />
Reduced run-on controls<br />
More allowances for leachate<br />
recirculation
RDD Tradeoffs<br />
Alternate bottom liners<br />
More flexibility on leachate collection<br />
More flexibility on daily covers<br />
BUT: More Monitoring intended to confirm<br />
alternatives are “at least as protective of<br />
human health <strong>and</strong> environment”<br />
8
Common Problems - <strong>Leachate</strong><br />
Any leak or discharge of leachate is not authorized under the SWGP
Common Problems - <strong>Leachate</strong>
TYPICAL BIOREACTOR CROSS-SECTION
Basic Benefits<br />
• Accelerates waste decomposition by…..<br />
•Increasing moisture content of waste<br />
• <strong>Leachate</strong> recirculation/liquids injection<br />
• Spray on at working face, vertical injection, horizontal<br />
•Injection air (aerobic)<br />
•pH or other chemical controls<br />
•Adding organics (yard trimmings, compost, etc.)<br />
•Waste shredding (increased surface area)<br />
• Accelerates LFG emissions (rate)<br />
• Potentially shortens post-closure period<br />
• Increases “effective” density (air space)
Bioreactor Types<br />
• Basic Bioreactor Types<br />
• Anaerobic:<br />
• Aerobic:<br />
• Hybrid:<br />
degradation w/o oxygen<br />
degradation w/oxygen<br />
aerobic (short) + anaerobic<br />
• Facultative: anaerobic w/chemical control<br />
(See Outer Loop L<strong>and</strong>fill Award Application)<br />
• More to come…..
PRETREATMENT STANDARDS FOR DISCHARGERS<br />
Pollutant<br />
Arsenic (T)<br />
Cadmium (T)<br />
Chromium (T)<br />
Copper (T)<br />
Lead (T)<br />
Mercury (T)<br />
Nickel (T)<br />
Silver (T)<br />
Zinc (T)<br />
Cyanide (T)<br />
Total Toxic Organics (TTO)<br />
Daily Maximum<br />
(mdl)<br />
t.29<br />
0.1I<br />
t.07<br />
t.92<br />
0.3s<br />
0.002<br />
3.98<br />
0.43<br />
2.55<br />
1.20<br />
2.t3<br />
BODs<br />
coD<br />
Suspended Solids<br />
Phosphorus (T)<br />
Animal/Vegetable Oil <strong>and</strong> Grease<br />
Petroleum Based Oil <strong>and</strong> Grease<br />
Lower Explosive Limit<br />
pH<br />
Temperature<br />
Closed Cup Flashpoint<br />
See Footnote I<br />
See Footnote I<br />
See Footnote I<br />
See Footnote I<br />
See Footnote 2<br />
100<br />
t0%<br />
Not less than 6.0 <strong>and</strong> not preater than 10.0<br />
Not greater than l40o p (O-Oo C)<br />
Not less than l40o F (600 C)<br />
T = Total<br />
All limits apply at end of pipe.<br />
Footnote l: Wastewater discharge concentrations greater than 250 mg/l for BOD <strong>and</strong><br />
TSS <strong>and</strong> concentrations greater than 8 mg/l for Phosphorus are subject ¡o a surcharge, as<br />
per County Code Section 5-509.<br />
Footnote 2: No numerical discharge st<strong>and</strong>ard exists; however, the following nanative<br />
st<strong>and</strong>ard applies:<br />
Discharge prohibition of solids or viscous substances in quantities capable of<br />
obstructing the fl_ow in sanitary sewers or otherwise interfering with th. prop.,<br />
operation of the County system, discharge prohibition of free or emulsified<br />
materials that are not readily biodegradable. Discharge prohibition of grease or<br />
oil wastes that could solidify at normal wastewater temperatures <strong>and</strong> cõnfibute to<br />
sewer line clogging, skimming <strong>and</strong>/or grease h<strong>and</strong>ling equipment overload, or<br />
treatment process interference.<br />
il
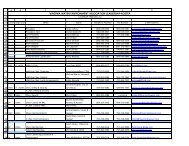
Lower Berkeley WWTF - Headworks Analysis<br />
EPA WQC Allowable POTW Allowable Inhibitory POTW Allowable MinimumAllowable Typical Industrial Allocations<br />
Pollutant In Stream Discharge Removal @ POTW Threshold Removal at POTW A,or B @ POTW Domestic Loading Capacity Available to Non-domestic US Water Navy Navy BCW&SA ALCOA Available Remaining Pollutant<br />
(mg/l) (mg/l) % (mg/l) (mg/l) Primary (mg/L) (mg/l) (#/day) (mg/l) (#/day) (mg/l) (#/day) % Recovery 1 Line 2 Line<br />
A % B Lesser (#/day) (#/day) (#/day) (#/day) (#/day) (#/day) %<br />
Antimony Avg 0.64000 75.56 70 251.88 x x x 251.88 47264.4 0.0050 0.9039 6139.86 47263.5 100.00 47263.5441 100.00 Antimony Avg<br />
Arsenic Avg 0.03600 4.25 45 7.73 0.1 x 0.1 0.10 18.8 0.0070 1.2655 2.2733 17.5 93.26 1.5200 15.9795 85.16 Arsenic Avg<br />
Arsenic Max 0.06900 8.15 45 14.81 0.1 x 0.1 0.10 18.8 0.0070 1.2655 2.2733 17.5 93.26 2.2800 15.2195 81.11 Arsenic Max<br />
Cadmium Avg 0.00930 1.10 67 3.33 1 15 1.176471 1.18 220.8 0.0080 1.4463 28.49 219.3 99.34 4.6700 17.3800 6.6700 190.5984 86.34 Cadmium Avg<br />
Cadmium Max 0.04300 5.08 67 15.38 1 15 1.176471 1.18 220.8 0.0080 1.4463 28.49 219.3 99.34 7.0000 26.0700 10.0000 176.2484 79.84 Cadmium Max<br />
Chromium Avg 0.05000 5.90 82 32.80 1 27 1.369863 1.37 257.1 0.0340 6.1467 32.59 250.9 97.61 0.028 4.340 246.5401 95.91 Chromium Avg<br />
Chromium Max 1.10000 129.87 82 721.52 1 27 1.369863 1.37 257.1 0.0340 6.1467 32.59 250.9 97.61 0.065 6.510 244.3331 95.05 Chromium Max<br />
Copper Avg 0.00370 0.44 86 3.12 1 22 1.282051 1.28 240.6 0.1400 25.3101 27.96 215.3 89.48 0.0210 2.8000 10.4200 4.0000 198.0259 82.31 Copper Avg<br />
Copper Max 0.00580 0.68 86 4.89 1 22 1.282051 1.28 240.6 0.1400 25.3101 27.96 215.3 89.48 0.0430 4.2000 15.6400 6.0000 189.3839 78.72 Copper Max<br />
Cyanide Avg 0.00100 0.12 69 0.38 0.1 27 0.136986 0.14 25.7 0.0820 14.8245 1.4135 10.9 42.33 10.8810 42.33 Cyanide Avg<br />
Cyanide Max 0.00100 0.12 69 0.38 0.1 27 0.136986 0.14 25.7 0.0820 14.8245 1.4135 10.9 42.33 10.8810 42.33 Cyanide Max<br />
Lead Avg 0.00850 1.00 61 2.57 1 57 2.325581 2.33 436.4 0.0580 10.4856 55.3286 425.9 97.60 0.0140 0.1900 0.6900 0.2600 424.7558 97.33 Lead Avg<br />
Lead Max 0.22000 25.97 61 66.6060 1 57 2.325581 233 2.33 436.44 0.05800580 10.4856 55.3286 425.9 97.60 0.03000300 0.2800 1.0400 0.4000 424.1598 97.20 Lead Max<br />
Mercury Avg 0.000051 0.0060 60 0.02 0.1 10 0.111111 0.02 2.8 0.0020 0.3616 0.3200 2.5 87.20 2.4632 87.20 Mercury Avg<br />
Mercury Max 0.000051 0.0088 60 0.02 0.1 10 0.111111 0.02 4.1 0.0020 0.3616 0.4888 3.8 91.23 3.7626 91.23 Mercury Max<br />
Nickel Avg 0.00830 0.98 42 1.69 1 14 1.162791 1.16 218.2 0.0470 8.4970 27.24 209.7 96.11 4.3400 3.3400 202.0207 92.59 Nickel Avg<br />
Nickel Max 0.07500 8.86 42 15.27 1 14 1.162791 1.16 218.2 0.0470 8.4970 27.24 209.7 96.11 6.5100 5.0000 198.1907 90.83 Nickel Max<br />
Silver Avg 0.00120 0.14 75 0.57 0.25 20 0.3125 0.31 58.6 0.0190 3.4349 7.17 55.2 94.14 1.1700 4.3400 49.6957 84.75 Silver Avg<br />
Silver Max 0.00120 0.14 75 0.57 0.25 20 0.3125 0.31 58.6 0.0190 3.4349 7.17 55.2 94.14 1.7500 6.5100 46.9457 80.06 Silver Max<br />
Thallium Avg 0.00047 0.0555 70 0.18 x x x 0.18 34.7 0.0005 0.0904 4.50 34.6 99.74 0.8700 33.7494 97.23 Thallium Avg<br />
Thallium Max 0.00047 0.0810 70 0.27 x x x 0.27 50.7 0.0005 0.0904 6.57 50.6 99.82 1.3000 49.2860 97.26 Thallium Max<br />
Zinc Avg 0.08600 10.15 79 48.35 0.3 27 0.410959 0.41 77.1 0.2310 41.76 4.59 35.4 45.85 0.0009 0.9900 3.6900 1.4200 29.2540 37.93 Zinc Avg<br />
Zinc Max 0.09500 11.22 79 53.41 0.3 27 0.410959 0.41 77.1 0.2310 41.76 4.59 35.4 45.85 0.0009 1.4900 5.5400 2.1400 26.1840 33.95 Zinc Max<br />
Phenol x x x x 50 8 54.34783 54.35 10198.4 0.000025 0.00452 1324.84 10198.4 100.00 1303 8895.3650 87.22 Phenol<br />
Molybdenum x x x x x x x 0.00 548.4 0.02 3.6157 70.7712 544.8 99.34 544.7843 99.34 Molybdenum<br />
Selenium Avg 0.07100 8.38 50 16.77 x x x 16.77 1096.9 0.005 0.9039 142.3775 1096.0 99.92 0.560 1095.4361 99.87 Selenium Avg<br />
Selenium Max 0.29000 34.24 50 68.48 x x x 68.48 1096.9 0.005 0.9039 142.3775 1096.0 99.92 0.840 1095.1561 99.84 Selenium Max<br />
Ammonia Avg 20.00 72.5 72.73 480 x 480 72.73 13647.3 30 5423.6 1068.3 8223.7 60.26 8223.6873 60.26 Ammonia Avg<br />
Ammonia Max 30.00 72.5 109.09 480 x 480 109.09 20470.9 30 5423.6 1954.75 15047.3 73.51 15047.3237 73.51 Ammonia Max<br />
Chloride Avg 230.0000 27155.33 0 27155.33 180 x 180 180.0000 33777.0 005 0.05 90 9.0 4386.6969 33768.0 99.9797 33767.9607 99.9797 Chloride Avg<br />
Chloride Max 860.00 101537.33 0 101537.33 180 x 180 180.00 33777.0 0.05 9.0 4386.69 33768.0 99.97 33767.9607 99.97 Chloride Max<br />
CBOD Avg 25 95 500 x x x 500.00 93825.0 300 54235.9 5143 39589.1 42.19 39589.1460 42.19 CBOD Avg<br />
CBOD Max 38 95 750 x x x 750.00 140737.5 300 54235.9 11237 86501.6 61.46 86501.6460 61.46 CBOD Max<br />
TSS Avg 30 95 600 x x x 600.00 112590.0 300 54235.9 7581 58354.1 51.83 58354.1460 51.83 TSS Avg<br />
TSS Max 45 95 900 x x x 900.00 168885.0 300 54235.9 14894 114649.1 67.89 114649.1460 67.89 TSS Max<br />
O & G Avg 100 0 100 x x x 100.00 18765.0 100 18078.62 89.17 686.4 3.66 8.757 42.95 166.800 467.8750 2.49 O & G Avg<br />
O & G Max 150 0 150 x x x 150.00 28147.5 100 18078.62 1308.02 10068.9 35.77 13.135 64.42 250.200 9741.1270 34.61 O & G Max<br />
Input Values:<br />
Method of Calculation:<br />
Allowable Headworks Loading - Sludge<br />
Domestic Design Flow 15.000 mgd In stream concentrations are based upon EPA Water Quality Criteria Formuli.<br />
Allowable<br />
POTW<br />
Industrial Design Flow 3.000 mgd Discharge is based upon a dilution ratio of Total Flow plus 7Q10 to Total Flow.<br />
Concentration Headworks<br />
Pollutant Removal<br />
I/I allowance 4.500 mgd The 7Q10 is that of the Cooper River at the potential POTW discharge location.<br />
(mg/kg) Loading<br />
%<br />
Total Design Flow 22.500 mgd Allowable concentration at POTW is based upon the removal efficiency for that parameter,<br />
(#/day)<br />
7Q10 2634 mgd BOD <strong>and</strong> TSS loading is a design parameter of the plant. Arsenic 0.45 75.00 914.064<br />
4076 cfs Inhibitory threshold of combined flow @ POTW, rather than @ industrial discharge, is considered. Cadmium 0.67 85.00 695.78006<br />
Assumed Hardness 25 mg/l Typical domestic loading is subtracted from plant capacity to determine capacity that is available Copper 0.86 4300.00 27421.92<br />
Permitted Domestic Flow 21.677 mgd for non-domestic (industrial) allocation. Lead 061 0.61 840.0000 7552.2664926649<br />
Permitted Industrial Flow 0.923 mgd Molybdenum allowable discharge was calculated from typical sludge production of biological processes Mercury 0.60 57.00 521.01648<br />
Remaining Flow 0 mgd used at the plant <strong>and</strong> allowable concentration in sludge disposable from Table 1 503.13 of 40 CFR Part 503. Molybdenum 0.75 75.00 548.4384<br />
All inhibition values were taken from EPA's Local Limits Development Guidance (x - indicates Nickel 0.42 420.00 5484.384<br />
Sludge Values: research yielded no inhibition values) Selenium 0.50 100.00 1096.8768<br />
Sludge Flow to Disposal 4.8 mgd Typical domestic loading values were taken from EPA's Local Limits Development Guidance, SCDHEC's Zinc 0.79 7500.00 52066.9367<br />
Percent Solids 13.7 % Practical Quantitation Limits (PQLs), Berekeley Counties Sewer Use Ordinance, or Wastewater Engineering<br />
by Metcalf & Eddy, Inc. (only used for O & G).<br />
AHLs for Cadmium Max <strong>and</strong> Molybdenum are based on Sludge Calculations because of a lower yielded<br />
AHL<br />
% Removal assumed to be zero if research yielded no values.
4<br />
VPDES Permit v. Pretreatment Permit
Improved BOD & COD<br />
Removal<br />
BOD, COD Concentrations<br />
1000.00<br />
900.00<br />
800.00<br />
700.00<br />
Concentration (mg/L)<br />
600.00<br />
500.00<br />
400.00<br />
300.00<br />
200.00<br />
100.00<br />
0.00<br />
6/6/2006 6/29/2006 7/25/2006 11/9/2006 12/15/2006 03/0707 4/4/2007<br />
Sample Dates<br />
BOD5<br />
COD<br />
11
BOD:COD Ratio Behavior<br />
BOD, COD <strong>and</strong> Ratio<br />
1000.00<br />
16.00<br />
900.00<br />
14.00<br />
800.00<br />
12.00<br />
700.00<br />
Concentration (mg/L)<br />
600.00<br />
500.00<br />
400.00<br />
10.00<br />
8.00<br />
6.00<br />
300.00<br />
200.00<br />
4.00<br />
100.00<br />
2.00<br />
0.00<br />
6/6/2006 6/29/2006 7/25/2006 11/9/2006 12/15/2006 03/0707 4/4/2007<br />
Sample Dates<br />
BOD5 COD BOD5 : COD Ratio<br />
0.00<br />
12
13<br />
THE END