Testing of Internal Combustion Engines
Testing of Internal Combustion Engines
Testing of Internal Combustion Engines

Create successful ePaper yourself
Turn your PDF publications into a flip-book with our unique Google optimized e-Paper software.
CHAPTER (4)<br />
Fuel Air Cycle<br />
The theoretical cycle based on the actual properties <strong>of</strong> the cylinder contents is<br />
called the fuel – air cycle. The fuel – air cycle take into consideration the following:<br />
1- The actual composition <strong>of</strong> the cylinder contents.<br />
2- The variation in the specific heat <strong>of</strong> the gases in the cylinder.<br />
3- The dissociation effect.<br />
4- The variation in the number <strong>of</strong> moles present in the cylinder as the pressure and<br />
temperature change.<br />
5- No chemical changes in either fuel or air prior to combustion.<br />
6- <strong>Combustion</strong> takes place instantaneously at top dead center.<br />
7- All processes are adiabatic.<br />
8- The fuel is mixed well with air.<br />
Variation <strong>of</strong> specific heats:<br />
All gases, except mono-atomic gases, show an increase in specific heat as<br />
temperature increase. The specific heat may be written in the form:<br />
C = a + bT + cT 2<br />
where T is the absolute temperature and a, b and c are constants for any specific gas.<br />
Cp and Cv increase with temperature but<br />
93<br />
c p<br />
� � decrease as the temperature increase.<br />
c<br />
There are special tables and charts which gives the specific heat <strong>of</strong> different gases at<br />
different temperatures. Specific heats <strong>of</strong> a mixture <strong>of</strong> gases can be calculated if the<br />
constituents <strong>of</strong> the mixture are known, using the gas mixture relations.<br />
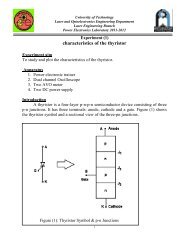
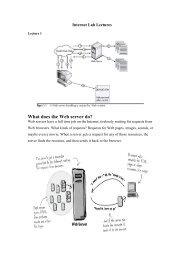
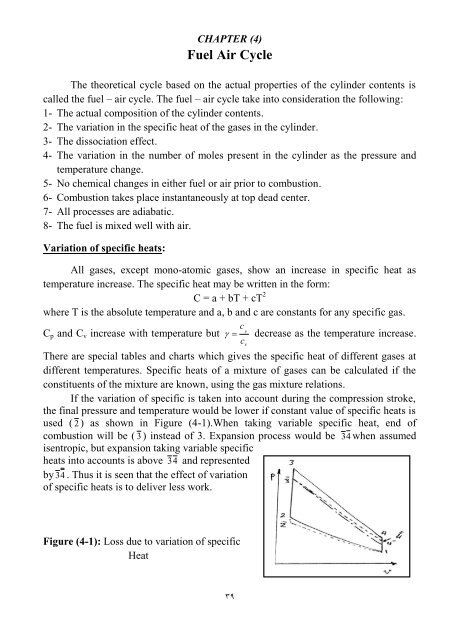
If the variation <strong>of</strong> specific is taken into account during the compression stroke,<br />
the final pressure and temperature would be lower if constant value <strong>of</strong> specific heats is<br />
used ( 2 ) as shown in Figure (4-1).When taking variable specific heat, end <strong>of</strong><br />
combustion will be ( 3 ) instead <strong>of</strong> 3. Expansion process would be 34 when assumed<br />
isentropic, but expansion taking variable specific<br />
heats into accounts is above 3 4 and represented<br />
by 3 4 . Thus it is seen that the effect <strong>of</strong> variation<br />
<strong>of</strong> specific heats is to deliver less work.<br />
Figure (4-1): Loss due to variation <strong>of</strong> specific<br />
Heat<br />
v
Dissociation effect:<br />
The effect <strong>of</strong> dissociation is a suppression <strong>of</strong> a part <strong>of</strong> the heat release during<br />
combustion and the liberation <strong>of</strong> it as expansion proceeds, a condition similar to the<br />
effect produced by the variation <strong>of</strong> specific heats. However, the effect <strong>of</strong> dissociation is<br />
much smaller than that <strong>of</strong> change <strong>of</strong> specific heats.<br />
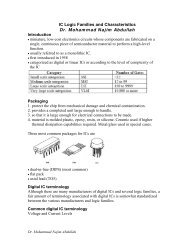
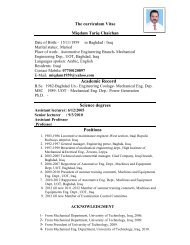
Figure (4-2): Effect <strong>of</strong> dissociation Figure (4-3): Comparison <strong>of</strong> air-<br />
temperature at different Ø Standard cycle with fuel – air cycle<br />
The effect <strong>of</strong> dissociation on combustion temperature is as shown in figure (4-2),<br />
the dotted line represents the maximum combustion temperature attained with no<br />
dissociation, and the full line is with dissociation. Dissociation reduces the maximum<br />
temperature by about 300 o C.<br />
Comparison <strong>of</strong> P-V Diagram <strong>of</strong> Air-standard and Fuel – Air cycle for SI engine:<br />
Diagram (4 – 3) shows three constant volume cycles:<br />
1- Air – standard cycle.<br />
2- Air – standard with variable specific heat.<br />
3- Fuel – Air cycle with variable specific heat and dissociation.<br />
Example (4-1):<br />
What is the percentage change in the efficiency <strong>of</strong> Otto cycle having a<br />
compression ratio <strong>of</strong> 7, if the specific heat at constant volume increases by 1%?<br />
Solution:<br />
04
�otto �1<br />
� � �1<br />
C<br />
P<br />
� C<br />
v<br />
R<br />
� �1<br />
�<br />
C<br />
� � 1�<br />
1<br />
1<br />
r<br />
� R<br />
R<br />
C<br />
v<br />
v r<br />
R<br />
ln( 1�<br />
�)<br />
� �<br />
C<br />
Differentiating:<br />
1 � R<br />
d�<br />
� 2<br />
1�<br />
� C<br />
d�<br />
�<br />
v<br />
v<br />
� 1�<br />
� � r<br />
ln r<br />
ln r � d C<br />
dCv<br />
�1(<br />
1�<br />
�)(<br />
� �1)<br />
ln r<br />
C<br />
v<br />
v<br />
R<br />
�<br />
C<br />
, r<br />
d�<br />
( 1�<br />
�)<br />
dCv<br />
� � ( � �1)<br />
ln r �<br />
� �<br />
C<br />
v<br />
v<br />
� constant<br />
1<br />
� � 1� � 0.<br />
54<br />
0.<br />
4<br />
7<br />
d�<br />
( 1�<br />
0.<br />
54)<br />
� � � � ( 1.<br />
4 �1)<br />
� ln 7 � �0.<br />
663<br />
� 0.<br />
54<br />
Example (4-2):<br />
04<br />
( decrease)<br />
A petrol engine <strong>of</strong> compression ratio 6 uses a fuel <strong>of</strong> calorific value 43950 kJ/kg.<br />
The air – fuel ratio is 15:1. The temperature and pressure <strong>of</strong> the charge at the charge at<br />
the end <strong>of</strong> the suction stroke are 60 o C and 1 bar. Determine the maximum pressure in<br />
the cylinder if the index <strong>of</strong> compression is 1.32 and the specific heat at constant<br />
volume is expressed by the expression; Cv = 0.71 + 19 × 10 -5 T kJ/kg K, where T is the<br />
temperature in K.<br />
Compare this value with that when constant specific heat Cv = 0.72 is used.<br />
Solution:<br />
p v<br />
p<br />
T<br />
n<br />
1 1<br />
2<br />
2<br />
� p v<br />
n<br />
2 2<br />
� v � 1 � p1�<br />
�<br />
�<br />
� �1�<br />
6<br />
� v2<br />
�<br />
� p2v<br />
� T1�<br />
�<br />
� p v<br />
2<br />
1 1<br />
n<br />
1.<br />
32<br />
�<br />
10.<br />
645<br />
� 10.<br />
645<br />
�<br />
� � 333�<br />
� 6<br />
� 590.<br />
8K<br />
bar
�5<br />
�T2 � T3<br />
�<br />
Mean specific heat Cv<br />
� 0.<br />
71�19�10<br />
mean<br />
�<br />
� 2 �<br />
�<br />
43950<br />
Assume 1 kg <strong>of</strong> air in the cylinder, heat added per kg air =<br />
15<br />
Q = Cv × mass <strong>of</strong> charge × (T3-T2)<br />
2930 = [0.71 + 19 × 10 -5 16<br />
(T3+590.8)/2] × × (T3 - 590.8)<br />
15<br />
Solving we get T3 = 3090 K<br />
T 3 P3=P2 = 10.645 × 3090 = 55.75 bar<br />
T<br />
590<br />
2<br />
16<br />
For constant specific heat, 2930 = 0.72 × (T3 - 590)<br />
15<br />
Solving we get T3=4405 K<br />
4405<br />
P3=10.645 × = 79.5 bar<br />
590<br />
Example (4-3):<br />
In an oil engine, working on dual combustion cycle, the temperature and<br />
pressure at the beginning <strong>of</strong> compression are 90 o C and 1 bar. The compression ratio is<br />
13:1. The heat supplied per kg <strong>of</strong> air is 16740 kJ, half <strong>of</strong> which is supplied at constant<br />
volume and half at constant pressure. Calculate (i) the maximum pressure in the cycle<br />
(ii) the percentage <strong>of</strong> stroke at which cut-<strong>of</strong>f occurs.<br />
Take � for compression 1.4, R = 0.293 kJ/kg K and Cv for products <strong>of</strong> combustion<br />
(0.71 + 12 × 10 -5 T)<br />
Solution:<br />
� v � 1<br />
( i)<br />
P � �<br />
�<br />
�<br />
�<br />
2 P1<br />
� v2<br />
�<br />
T<br />
2<br />
Q<br />
� v<br />
� T �<br />
� 1<br />
� v<br />
12<br />
� m<br />
T3<br />
�<br />
T2<br />
1<br />
2<br />
�<br />
�<br />
�<br />
�<br />
� �1<br />
�1�<br />
( 13)<br />
� 363(<br />
13)<br />
C dT � m<br />
v<br />
�<br />
T3<br />
�<br />
T2<br />
1.<br />
4<br />
�<br />
8370 �1�0.<br />
71T<br />
�12�10<br />
�<br />
� 36.<br />
3<br />
0.<br />
4<br />
bar<br />
�1013K<br />
( 0.<br />
71�12�10<br />
�5<br />
T ) dT<br />
�5<br />
12�10<br />
2 2<br />
� 0.71(T3<br />
�1013)<br />
� ( T3<br />
�1013<br />
)<br />
2<br />
2<br />
� 0.00006 T � 0.<br />
71T<br />
� 9444.<br />
6<br />
3<br />
�5<br />
2<br />
T �<br />
�<br />
2 �<br />
3<br />
T<br />
3<br />
T<br />
2<br />
04
Solving we get T3 = 1864 K<br />
1864<br />
� Maximum pressure = 36.3 � =66.7 bar<br />
1013<br />
( ii)<br />
C<br />
Q<br />
p<br />
34<br />
� C<br />
v<br />
� m<br />
�<br />
8370 � 1�1.003<br />
T �12<br />
�10<br />
�<br />
8370 � 1.003(T<br />
0.00006 T<br />
� R � 1.<br />
003 �12<br />
�10<br />
T<br />
4<br />
�<br />
T<br />
3<br />
� 1.003 T<br />
2<br />
4<br />
4<br />
4<br />
�1.<br />
003 T<br />
( 1.<br />
003<br />
�1864)<br />
� 0.<br />
00006(<br />
T<br />
�<br />
0.<br />
00006<br />
4<br />
T<br />
4<br />
�<br />
C dT � m<br />
Solving we get, T4=2460 K<br />
v4<br />
T4<br />
2460<br />
� � �1.<br />
32<br />
v T 1864<br />
3<br />
3<br />
1<br />
Cut – <strong>of</strong>f = v � v , � 13<br />
4<br />
3<br />
p<br />
v<br />
v<br />
2<br />
T<br />
3<br />
-5<br />
T<br />
�12<br />
�10<br />
2<br />
4<br />
�5<br />
T<br />
2<br />
T �<br />
2<br />
�<br />
�<br />
T<br />
1864<br />
� 2078<br />
�10448<br />
� 0<br />
% <strong>of</strong> stroke at which cut <strong>of</strong>f occurs =<br />
1.<br />
32 v � v<br />
�<br />
13 v � v<br />
2<br />
( 1.<br />
32 �1)<br />
v<br />
�<br />
12 v<br />
3 3<br />
2 �<br />
2<br />
2<br />
4<br />
1<br />
2.<br />
67%<br />
�5<br />
2<br />
4<br />
v4<br />
� v3<br />
v � v<br />
T ) dT<br />
�1864<br />
2<br />
09<br />
2<br />
)<br />
, V3 = V2
CHAPTER (5)<br />
The Actual Cycle<br />
The actual cycle experienced by internal combustion engines is an open cycle with<br />
changing composition, actual cycle efficiency is much lower than the air standard<br />
efficiency due to various losses occurring in the actual engine. These losses are as<br />
follows:<br />
1- Losses due to variation <strong>of</strong> specific heats with temperature: already discussed.<br />
2- Losses due to dissociation: already discussed.<br />
3- time losses:<br />
In theoretical cycles the burning is assumed to be instantaneous. Whereas, in<br />
actual cycle, burning is completed in a definite interval <strong>of</strong> time. The effect <strong>of</strong> this<br />
time is that the maximum pressure will not be produced when the volume is<br />
minimum; but sometime after T.D.C., causes a reduction in the work produced.<br />
Figure (5-1): The effect <strong>of</strong> time losses on P-V diagram<br />
In order that the maximum pressure is not reached too late in the expansion stroke,<br />
the time at which burning starts is varied by varying the spark timing (spark advance).<br />
4- incomplete combustion loss:<br />
Fuel vapour, air, and residual gas are present in the cylinder, this makes it<br />
impossible to obtain perfect homogeneous mixture.. Therefore some fuel does not burn<br />
to CO2 or partially burns to CO, and O2 will appear in the exhaust. Energy release in<br />
actual engine is about 90 to 93% <strong>of</strong> fuel energy input.<br />
5- direct heat loss:<br />
During combustion process and subsequent expansion stroke, the heat flows from<br />
cylinder gases through cylinder walls and cylinder head into the water jacket or cooling<br />
fins. Some heat enters the piston head and flows through piston rings into the walls <strong>of</strong><br />
the cylinder or carried away by the engine oil.<br />
00
The heat loss during combustion and expansion does not represent a complete heat<br />
loss; a part <strong>of</strong> the heat loss would be rejected in the exhaust at the end <strong>of</strong> the expansion<br />
stroke.<br />
6- exhaust blow down loss:<br />
The opening <strong>of</strong> the exhaust value before B.D.C. reducing cylinder pressure, causing<br />
the roundness <strong>of</strong> the end <strong>of</strong> the P-V diagram, this means a reduction in the work done<br />
per cycle.<br />
7- pumping losses:<br />
Pumping loss is due to expelling the exhaust<br />
gases and the induction <strong>of</strong> the fresh charge. In<br />
naturally aspirated engine this would be a negative<br />
work.<br />
8- Friction losses:<br />
These losses are due to the friction between<br />
the piston and cylinder walls, the various<br />
bearings, and the friction in the auxiliary<br />
equipment, such as pumps, fans, etc…<br />
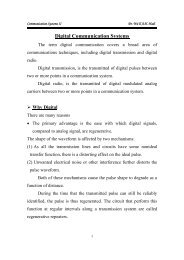
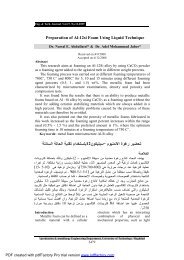
Effect <strong>of</strong> throttle opening:<br />
Figure (5-4): Effect <strong>of</strong> throttle opening<br />
on the indicator diagram<br />
04<br />
Figure (5-2, 3): Effect <strong>of</strong> exhaust valve<br />
opening time and pumping<br />
When a four- stroke SI engine is run at partially closed throttle, (throttle is a<br />
butterfly valve in the intake system), fuel supplied to the engine is reduced, and this
would lead to less power output at part throttle opening as shown in figure (5-4). The<br />
upper loop represent positive work output (A) while the lower loop consisting <strong>of</strong> the<br />
exhaust and intake strokes is negative work (B). The more closed the throttle position,<br />
the lower will be the pressure during the intake stroke and the greater the negative<br />
pumping work.<br />
Effect <strong>of</strong> spark timing:<br />
Figure (5-5): Power loss by retarded<br />
ignition timing<br />
The effect <strong>of</strong> spark timing is shown in figure (5-5), ϕ = 0 means spark timing at<br />
T.D.C, in this case the peak pressure is low and occurs nearly 40 � after T.D.C., as spark<br />
timing is advanced to achieve combustion at TDC, additional work is required to<br />
compress the burning gases. Figure (5-5) shows the power loss by retarded ignition<br />
timing optimum loss in power. In actual practice a deliberate retard in spark from<br />
optimum may be done to avoid knocking and reduce exhaust emissions <strong>of</strong> HC and CO.<br />
Figure (5-6): Variation <strong>of</strong> imep with spark timing<br />
04
CHAPTER (6)<br />
Engine Performance<br />
The basic performance parameters <strong>of</strong> internal combustion engine (ICE) may be<br />
summarized as follows:<br />
1. Indicated power (i.p.):<br />
Figure (6-1): indicator diagram <strong>of</strong> SI engine<br />
It is the actual rate <strong>of</strong> work done by the working fluid on the piston. As its name<br />
implies, the i.p. can be determined from an "indicator diagram" as show in figure (6-1),<br />
by subtracting the pumping loop area (- ve) from the positive area <strong>of</strong> the main diagram.<br />
i.p. power could be estimated by performing a Morse test on the engine. The physical<br />
equation for the i.p. is:<br />
i.p. = Pm LAN<br />
where N is the number <strong>of</strong> machine cycles per unit times, which is 1/2 the rotational<br />
speed for a four- stroke engine, and the rotational speed for a two- stroke engine.<br />
2. Brake power (b.p.):<br />
This is the measured output <strong>of</strong> the engine. It is usually obtained by a power<br />
absorption device such as a brake or dynamometer which can be loaded in such a way<br />
that the torque exerted by the engine can be measured. The break power is given by:<br />
b.p. = 2�NT<br />
Where T is the torque<br />
3. Friction power (f.p.) and Mechanical efficiency (�m):<br />
The difference between the i.p. and the b.p is the friction power (f.p.) and is that<br />
power required to overcome the frictional resistance <strong>of</strong> the engine parts,<br />
f.p. = i.p. – b.p.<br />
The mechanical efficiency <strong>of</strong> the engine is defined as:<br />
�m = b.p.<br />
i.p.<br />
04
�m is usually between 80% and 90%<br />
4. Indicated mean effective pressure (imep):<br />
It is a hypothetical pressure which if acting on the engine piston during the working<br />
stroke would results in the indicated work <strong>of</strong> the engine. This means it is the height <strong>of</strong><br />
a rectangle having the same length and area as the cycle plotted on a p- v diagram.<br />
Consider one engine cylinder:<br />
Work done per cycle = Pi AL<br />
where: A = area <strong>of</strong> piston; L = length <strong>of</strong> stroke<br />
Work done per min. = work done per cycle � active cycles per min.<br />
i.p. = Pi AL � active cycles/ min<br />
To obtain the total power <strong>of</strong> the engine this should be multiplied by the number<br />
<strong>of</strong> cylinder n, i.e.:<br />
Total i.p. = Pi AL Nn/2 for four- stroke engine<br />
and<br />
= Pi AL Nn for Two- stroke engine<br />
5. Brake mean effective pressure (bmep) and brake thermal efficiency:<br />
The bmep (Pb) may be thought <strong>of</strong> as that mean effective pressure acting on the<br />
pistons which would give the measured b.p., i.e.<br />
b.p. = Pb AL � active cycles/ min<br />
The overall efficiency <strong>of</strong> the engine is given by the brake thermal efficiency, �BT<br />
i.e.<br />
imep (Pi) =<br />
�BT =<br />
�<br />
BT<br />
Net area <strong>of</strong> the indicator diagram<br />
Swept volume<br />
b.<br />
p.<br />
�<br />
m�<br />
�Q<br />
f<br />
Brake power<br />
Energy supplied<br />
net<br />
where f m� is the mass <strong>of</strong> fuel consumed per unit time, and Qnet is the lower calorific<br />
value <strong>of</strong> the fuel.<br />
6. Specific fuel consumption (s.f.c.):<br />
It is the mass <strong>of</strong> fuel consumed per unit power output per hour, and is a criterion <strong>of</strong><br />
economic power production.<br />
m�<br />
f<br />
sfc �<br />
kg<br />
b.<br />
p.<br />
04<br />
kWh<br />
� Indicator scale
Low values <strong>of</strong> s.f.c are obviously desired. Typical best values <strong>of</strong> bsfc for SI engines are<br />
about 270g/kW.h, and for C.I. engines are about 200g/kW.h.<br />
7. Indicated thermal efficiency (�IT):<br />
It is defined in a similar way to �BT<br />
Dividing �BT by �IT gives<br />
�<br />
IT<br />
i.<br />
p.<br />
�<br />
m�<br />
�Q<br />
�BT = b.p. = �m<br />
�IT<br />
� �BT = �m � �IT<br />
8. Volumetric efficiency (�v):<br />
i.p.<br />
Volumetric efficiency is only used with four- stroke cycle engines. It is defined<br />
as the ratio <strong>of</strong> the volume if air induced, measured at the free air conditions, to the<br />
swept volume <strong>of</strong> the cylinder:<br />
v<br />
f<br />
� �<br />
The air volume �V� � may be refereed to N.T.P. to give a standard comparison.<br />
The volumetric efficiency <strong>of</strong> an engine is affected by many variables such as<br />
compression ratio, valve timing, induction and port design, mixture strength, latent<br />
heat <strong>of</strong> evaporation <strong>of</strong> the fuel, heating <strong>of</strong> the induced charge, cylinder pressure, and<br />
the atmospheric conditions.<br />
Example 6-1:<br />
The peak pressure <strong>of</strong> a SI engine rotating at 1500 rpm occurs 0.003 S after the<br />
spark, what will be the spark timing when peak pressure is at TDC. If the inlet valve<br />
opens at 10 degrees bTDC and closes at 45 degrees aBDC, how long the inlet valve<br />
opening period is in seconds.<br />
Solution:<br />
1500<br />
Number <strong>of</strong> revolutions per second � � 25 rev.<br />
60<br />
Number <strong>of</strong> revolutions between spark timing and TDC = 25 � 0.003 = 0.075 rev.<br />
Crank shaft angle during this period = 0.075 � 360 = 27<br />
i.e. spark must occurs 27 degree bTDC<br />
inlet valve opening = 10 + 180 + 45 = 235 degrees<br />
03<br />
v�<br />
v<br />
s<br />
net
235<br />
inlet valve opening time in seconds � � 0.<br />
0265.<br />
360�<br />
25<br />
Example 6-2:<br />
In a four stroke single cylinder gas engine the indicated mean effective pressure<br />
is 0.46 MN/m 2 , the brake power 9 kW, speed 250 rpm, mechanical efficiency, �m =<br />
0.8, and bore to stroke ratio = 0.66. Calculate cylinder diameter and mean piston speed.<br />
Solution:<br />
�m<br />
bp<br />
�<br />
i.<br />
p<br />
Pi<br />
LANn<br />
i.p �<br />
2<br />
2 � i.<br />
p 2 �11.<br />
25<br />
LA � �<br />
� 0.<br />
01174<br />
P Nn 0.<br />
46 �1000<br />
� 250 �1<br />
d<br />
L<br />
�<br />
i<br />
0.<br />
66<br />
d �<br />
� � d<br />
0.<br />
66 4<br />
d<br />
d<br />
2<br />
3<br />
,<br />
,<br />
�<br />
�<br />
i.p �<br />
L �<br />
9<br />
0.8<br />
d<br />
0.66<br />
0.<br />
01174<br />
0.<br />
009866<br />
� 11.<br />
25<br />
kw<br />
� 0.2145 m<br />
2LN<br />
2�<br />
0.<br />
2145�<br />
250<br />
�<br />
� 2.<br />
71<br />
60 0.<br />
66�<br />
60<br />
Mean piston speed = m/s<br />
Example 6-3:<br />
A four stroke petrol engine delivers 35.75 kW with a mechanical efficiency <strong>of</strong><br />
80%, the fuel consumption <strong>of</strong> the engine is 0.4 kg per brake power hour, and the A/F<br />
ratio is 14:1. The heating value <strong>of</strong> the fuel is 41870 kJ/kg. Find: (a) i.p, (b) f.p., (c) � BT ,<br />
(d) � IT , (e) fuel consumption per hour, (f) air consumption per hour.<br />
Solution:<br />
b.<br />
p 35.75<br />
a) � m � , i.p � � 44.<br />
7 kW<br />
i.<br />
p 0.8<br />
b) f.p = i.p – b.p = 44.7 – 35.75 = 8.95 kW<br />
b.<br />
p 35.<br />
75�<br />
3600<br />
c) � BT � �<br />
� 0.<br />
215<br />
Q 0.<br />
4�<br />
35.<br />
75�<br />
41870<br />
added<br />
d) �BT � �IT<br />
��m<br />
0.<br />
215<br />
� IT � � 0.<br />
2687<br />
0.<br />
8<br />
e) fuel consumption per hour = 0.4 �35.75=14.32 kg<br />
f) air consumption per hour = 14.32 � 14=200.5 kg<br />
44<br />
m<br />
3
Example 6-4:<br />
The air flow to a four cylinder four – stroke engine is 2.15 m 3 / min. During a<br />
test on the engine the following data were recorded:<br />
Bore 10.5cm; stroke 12.5cm; engine speed 1200 rpm, torque 150 N.m, fuel<br />
consumption 5.5 kg/h, calorific value <strong>of</strong> fuel, 43124 kJ/kg, ambient temperature and<br />
pressure are 20 o C and 1.03 bars. Calculate:<br />
1- The brake thermal efficiency.<br />
2- The brakes mean effective pressure.<br />
3- The volumetric efficiency.<br />
Solution:<br />
2�NT<br />
2�<br />
�1200�150<br />
1- b . p.<br />
� �<br />
�18.<br />
85<br />
60 60�1000<br />
kW<br />
b.<br />
p<br />
� BT �<br />
Q<br />
18.<br />
85�<br />
3600<br />
�<br />
� 0.<br />
286<br />
5.<br />
5�<br />
43124<br />
added<br />
P n<br />
2- b. p � iLAN<br />
2<br />
2�18.<br />
85�<br />
4�<br />
60<br />
�P<br />
i �<br />
� 435.<br />
4<br />
2<br />
0.<br />
125�<br />
� � ( 0.<br />
105)<br />
�1200�<br />
4<br />
V�<br />
3- � �<br />
v<br />
Vs<br />
44<br />
kPa<br />
Nn � 2 1200�<br />
4<br />
Vs<br />
� LA � 0.<br />
125�<br />
( 0.<br />
105)<br />
� � 2.<br />
6<br />
2 4<br />
2<br />
2.<br />
15<br />
�� v � � 0.<br />
83<br />
2.<br />
6<br />
<strong>Testing</strong> <strong>of</strong> <strong>Internal</strong> <strong>Combustion</strong> <strong>Engines</strong>:<br />
m<br />
3<br />
/ min<br />
There are a wide variety <strong>of</strong> engine tests, starting from simple fuel and air- flow<br />
measurements to taking <strong>of</strong> complicated injector needle lift diagram, swirl patterns and<br />
photographs <strong>of</strong> the combustion process, etc..<br />
Here only certain basic tests and measurement will be considered.<br />
1-Measurement <strong>of</strong> speed:<br />
A wide variety <strong>of</strong> speed measuring devices are available they range from a<br />
mechanical tachometer to digital and triggered electrical tachometers.<br />
The best method <strong>of</strong> measurement is to count the number <strong>of</strong> revolution in a given<br />
time; this could be done either mechanically or electrically.<br />
2-Fuel consumption measurement:<br />
The fuel consumption <strong>of</strong> an engine is measured by determining the volume flow<br />
in a given time interval, or to measure the time required for the consumption <strong>of</strong> a given<br />
volume (or mass) <strong>of</strong> fuel.
3-Air consumption measurement:<br />
The measurement <strong>of</strong> the air flow in the engine intake is not an easy task, because<br />
<strong>of</strong> the cyclic nature <strong>of</strong> the engine which causes a pulsating air flow:<br />
a) Air box method:<br />
In this method the intake air is drawn from a large surge tank, and measurement<br />
<strong>of</strong> air flow into the surge tank is performed using a calibrated orifice or a flow nozzle<br />
(see fig.6-2).<br />
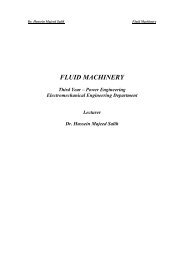
Figure (6-2): <strong>Testing</strong> equipment for measured <strong>of</strong> air consumption<br />
b) Positive – Displacement meters:<br />
Positive – displacement meters are very accurate, their working principle is<br />
shown in figure (6-3), as the impellers rotate, a fixed volume <strong>of</strong> air is alternately<br />
trapped between each impeller and the casing. This occurs four times for each<br />
complete revolution <strong>of</strong> both impellers.<br />
Figure (6-3): Rotary positive displacement meter<br />
c) Viscous – flow air meter:<br />
The meter is show diagrammatically in figure 6-4. It uses an element where<br />
viscous resistance is the principle source <strong>of</strong> pressure loss and kinetic effects are small.<br />
44
With the air box the flow is proportional to the square root <strong>of</strong> the pressure difference,<br />
while the viscous resistance is directly proportional to the air velocity and is measured<br />
by means <strong>of</strong> an inclined manometer. Felt pads are fitted in the manometer connections<br />
to damp out fluctuations, an additional damping vessel is fitted between the meter and<br />
the engine to increase the accuracy by reducing the effect <strong>of</strong> pulsations.<br />
Figure (6-4): Viscous- flow air meter<br />
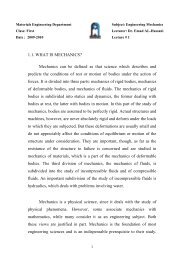
4-Measurement <strong>of</strong> engine torque and power:<br />
Any apparatus that permits the measurement <strong>of</strong> torque and power <strong>of</strong> the engine<br />
is called a "dynamometer". There are many types <strong>of</strong> dynamometers; all operate on the<br />
principle illustrated in fig. (6-5). Here the rotor (a), driven by the engine to be tested, is<br />
couple (electrically, magnetically, hydraulically or by friction) to the stator (b). In one<br />
revolution <strong>of</strong> the shaft, the peripherally <strong>of</strong> the rotor moves through a distance ( 2 � r )<br />
against the coupling force f (drag force).<br />
Fig.6-5 The dynamometer principle<br />
Thus the work per revolution is:<br />
Work = 2 � r f<br />
The external moment, which is the product <strong>of</strong> the reading p <strong>of</strong> the scale (could<br />
be a beam balance or weights) and the arm R, must just balance the turning moment,<br />
which is r�f;<br />
r × f = R× P<br />
Work = 2<br />
�RP<br />
49
Work per minute = 2 �RPN<br />
(N is engine speed in rpm)<br />
Power is defined as the time rate <strong>of</strong> doing work, i.e.<br />
Power = 2 �RPN<br />
where R in meters and P in Newton, then<br />
2 RPN<br />
power �<br />
1000�<br />
60<br />
�<br />
a) Fluid Dynamometers:<br />
kW<br />
They absorb engine energy in water or oil pumped through orifices or dissipated<br />
with viscous losses in a rotor – stator combination. Large energy can be absorbed in<br />
this manner. Fluid brakes fall into two classes; the “friction" and the “agitator" type. In<br />
the friction type the coupling force arises from the viscous shearing <strong>of</strong> fluid between<br />
the rotor and stator, while in the agitator type the coupling force arises from the change<br />
in momentum <strong>of</strong> fluid as it is transported from rotor vanes to the stator vanes and back<br />
again.<br />
Figure (6-6) illustrates Heenan – Froude hydraulic dynamometer. Here, the<br />
vanes <strong>of</strong> the rotor direct the water outward toward the stator vanes which redirect it<br />
back into the rotor. This highly turbulent process repeats itself again and again. The<br />
change <strong>of</strong> momentum experienced by the water as it changes direction is manifested as<br />
a reaction force on the stator housing.<br />
Figure (6-6): Cross-section through casing <strong>of</strong> Froud dynamometer<br />
b) The eddy – current Dynamometer:<br />
It consist <strong>of</strong> disk (d) which, driven by the engine under test, turns in a magnetic<br />
field, see figure (6-7). The strength <strong>of</strong> the field is controlled by varying the current<br />
40
through a series <strong>of</strong> coils (g) located on both sides <strong>of</strong> the disk (d). The revolving disk;<br />
act as a conductor cutting the magnetic field. Currents are induced in the disk and,<br />
since no external circuit exists, the induced current heats the disk. The temperature rise<br />
<strong>of</strong> the stator (a) is controlled by the flow <strong>of</strong> water in channels (h).<br />
Figure (6-7): Cross- section <strong>of</strong> eddy- current dynamometer<br />
c) The electric dynamometer:<br />
The electric dynamometer; as shown in fig. (6-8) can operate either as a motor to<br />
start and drive the engine at various speeds or as a generator to absorb the power<br />
output <strong>of</strong> the engine. The load is easily varied by changing the amount <strong>of</strong> resistances in<br />
the circuit connected to the generator output.<br />
Figure (6-8): set- up <strong>of</strong> engine and dynamometer.<br />
44
6-Measurment <strong>of</strong> engine indicated power:<br />
There are two methods <strong>of</strong> finding the indicated power <strong>of</strong> an engine:<br />
i- By taking the indicator diagram with the help <strong>of</strong> an indicator.<br />
ii - By measuring b.p and f.p separately and adding the two.<br />
i- Indicator Diagram:<br />
The device which measures the variation <strong>of</strong> the pressure in the cylinder over the<br />
cycle is called an indicator and the plot (diagram) <strong>of</strong> such information obtained is<br />
called indicator diagram. There are two types <strong>of</strong> indicator diagrams which can be<br />
taken from various indicators, these are:<br />
1- Pressure – volume (p – v) plot.<br />
2- Pressure – crank angle (p – � ) plot.<br />
There are number <strong>of</strong> indicators in use. However, only some representative types<br />
would show here:<br />
a) Piston indicator (fig. 6-9)<br />
b) Balance– Diaphragm (Farnborough balanced engine) indicator (fig. 6-10)<br />
Figure (6-9) Piston indicator Figure (6-10): Schematic diagram <strong>of</strong><br />
balanced- diaphragm type indicator<br />
b) Transducers and electronic indicators:<br />
In general, a transducer is any device which converts a non-electrical quantity<br />
into an electrical signal. Examples <strong>of</strong> quantities which can be converted to electrical<br />
signals are; displacement, velocity, acceleration, and force. The electrical properties <strong>of</strong><br />
many materials change when the material is subjected to a mechanical deformation.<br />
This is the characteristics upon which all pressure transducers depend. Resistive<br />
(strain– gauge), capacitive, or piezoelectric elements are the most common types <strong>of</strong><br />
pressure pickups for engine work.<br />
44
Figure (6-11) Elements <strong>of</strong> an<br />
electrical instantaneous pressure<br />
transducer<br />
Fig. (6-11) shows a continuous – pressure system with a pressure pickup (b)<br />
(various types <strong>of</strong> pressure pickups are feasible). Fig. 6-12 shows different examples <strong>of</strong><br />
pressure transducers, fig. (6-12 a and b) explain piezoelectric transducers, fig. (6-12b),<br />
indicate a strain – gauge transducer, while fig.6-12 d shows an electromagnetic<br />
pressure pickup.<br />
Figure (6-11): a & b<br />
Figure (6 – 12): a & b<br />
Figure (6-12): c & d<br />
44
7-Pressure Diagrams for I.C engines:<br />
Figure (6-13): Typical p−t diagram<br />
for SI engine at wide- open throttle<br />
Figure (6-14) p-t diagram for<br />
mechanical- injection CI engine<br />
at full load<br />
7-Measurement <strong>of</strong> friction power (f.p):<br />
The friction power is nearly constant at a given engine speed. Friction has a<br />
dominating effect on the performance <strong>of</strong> the engine. Frictional losses are dissipated to<br />
the cooling system as they appear in the form <strong>of</strong> heat.<br />
Measurement <strong>of</strong> friction power is important for having better understanding on<br />
how the engine output can be increased. Methods <strong>of</strong> measuring the friction power are<br />
as follows:<br />
i- Measurement <strong>of</strong> the i.p. and b.p. by the methods described previously for the engine<br />
at identical working conditions.<br />
ii- Motoring test:<br />
In this test; the engine is first run to measure the b.p at a given speed, then the<br />
fuel supply (or the spark) is cut-<strong>of</strong>f and the dynamometer is converted to run as motor<br />
to drive the engine (motoring) at the same speed and keeping other parameters the<br />
same. The power supplied to the motor is measured which is a measure <strong>of</strong> the friction<br />
power (f.p).<br />
The main objection to this method is that the engine is not firing, which leads to<br />
make running conditions are not similar. The pressure and temperature <strong>of</strong> cylinder<br />
contents, cylinder and piston surfaces are not the same.<br />
iii- Morse test:<br />
44
This test is only applicable to multi-cylinder engines. The engine is run at the<br />
required speed and the torque is measured. One cylinder is cut out, the speed falls<br />
because <strong>of</strong> the loss <strong>of</strong> power with one cylinder cut out, but is restored by reducing the<br />
load. The torque is measured again when the speed has reached its original value. If the<br />
values <strong>of</strong> i.p. <strong>of</strong> cylinders are denoted by I1,I2,I3, and I4 (considering a four – cylinder<br />
engine), and the power losses in each cylinder are denoted by L1,L2, L3 and L4, then the<br />
value <strong>of</strong> b.p, B, at the test speed with all cylinders firing is given by:<br />
B = (I1 - L1) + (I2 - L2) + (I3 - L3) + (I4 - L4)<br />
If number 1 cylinder is cut out, then the contribution I1 is lost; and if the losses due to<br />
that cylinder remain the same as when it is firing, then the b.p B1 now obtained at the<br />
same speed is:<br />
B1 = (0 - L1) + (I2 - L2) + (I3 - L3) + (I4 - L4)<br />
Subtracting the second equation from the first given<br />
B – B1 = I1<br />
By cutting out each cylinder in turn the values I2, I3 and I4 can be obtained, then:<br />
I = I1 + I2 + I3 + I4<br />
iv- Willan's line:<br />
In this method gross fuel consumption versus b.p at a constant speed is plotted.<br />
The graph drawn is called the "Willan's line" and extrapolated back to cut the b.p axis<br />
at the point A. OA represent the power loss <strong>of</strong> the engine at this speed. The fuel<br />
consumption at zero b.p is given by OB; this would be equivalent to the power loss<br />
OA. This test is applicable to C.I. engines only.<br />
Figure (6-15): Willan's line<br />
8 – Heat balance <strong>of</strong> Engine:<br />
The main components <strong>of</strong> the heat balance are:<br />
1- Heat equivalent to the b.p <strong>of</strong> the engine.<br />
2- Heat rejected to the cooling medium.<br />
3- Heat carried away from the engine with the exhaust gases.<br />
4- Unaccounted losses.<br />
The following table gives the approximate percentage values <strong>of</strong> various losses in SI<br />
and CI engines:<br />
43