Solar and Wind Energy Resource Assessment (SWERA) - OpenEI
Solar and Wind Energy Resource Assessment (SWERA) - OpenEI
Solar and Wind Energy Resource Assessment (SWERA) - OpenEI

Create successful ePaper yourself
Turn your PDF publications into a flip-book with our unique Google optimized e-Paper software.
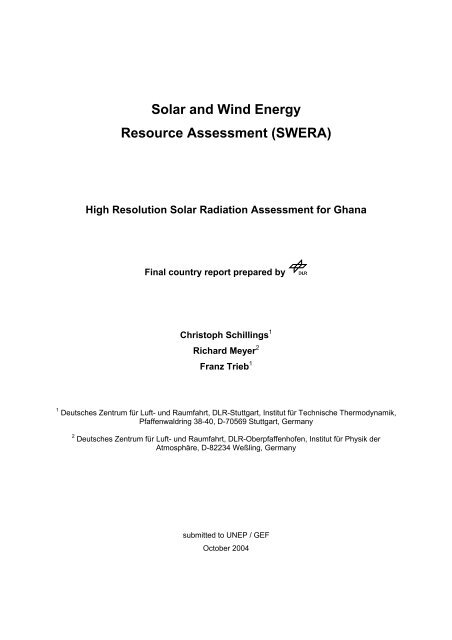
<strong>Solar</strong> <strong>and</strong> <strong>Wind</strong> <strong>Energy</strong><br />
<strong>Resource</strong> <strong>Assessment</strong> (<strong>SWERA</strong>)<br />
High Resolution <strong>Solar</strong> Radiation <strong>Assessment</strong> for Ghana<br />
Final country report prepared by<br />
Christoph Schillings 1<br />
Richard Meyer 2<br />
Franz Trieb 1<br />
1 Deutsches Zentrum für Luft- und Raumfahrt, DLR-Stuttgart, Institut für Technische Thermodynamik,<br />
Pfaffenwaldring 38-40, D-70569 Stuttgart, Germany<br />
2 Deutsches Zentrum für Luft- und Raumfahrt, DLR-Oberpfaffenhofen, Institut für Physik der<br />
Atmosphäre, D-82234 Weßling, Germany<br />
submitted to UNEP / GEF<br />
October 2004
Content<br />
1. Method description (satellite data, GHI-method, DNI-method)<br />
2. Model output (GHI, DNI)<br />
3. Comparison with ground measurements (if available)<br />
4. References<br />
Notice<br />
This report was prepared as an account of work within the <strong>SWERA</strong> project funded by GEF / UNEP.<br />
The results presented here were produced by state-of-the-art methods with best-known data. The<br />
DLR (Deutsches Zentrum fuer Luft- und Raumfahrt e.V.) does not make any warranty, express or<br />
implied, or assumes any legal liability or responsibility for the accuracy, completeness, or usefulness<br />
of any information, apparatus, product, or process disclosed, or represents that its use would not<br />
infringe privately owned rights. Reference herein to any specific commercial product, process, or<br />
service by trade name, trademark, manufacturer, or otherwise does not necessarily constitute or imply<br />
its endorsement, recommendation, or favoring by the DLR.<br />
This report is electronically available at http://swera.unep.net<br />
Contact the responsible author:<br />
Christoph Schillings<br />
DLR - Deutsches Zentrum für Luft- und Raumfahrt, e.V.<br />
Pfaffenwaldring 38-40<br />
D - 70569 Stuttgart<br />
tel ++49(0)711/6862-784<br />
fax ++49(0)711/6862-783<br />
mail christoph.schillings@dlr.de<br />
www http://www.dlr.de/system
High resolution solar radiation assessment for Ghana, by 1<br />
1 Method description<br />
Satellite Data<br />
The high resolution solar radiation assessment is based on data of the geostationary satellite<br />
Meteosat. Due to the location of the participating <strong>SWERA</strong> countries, data of Meteosat 7<br />
(M-7) for the years 2000, 2001 <strong>and</strong> 2002 (for Ghana, Kenya <strong>and</strong> Ethiopia) <strong>and</strong> data of<br />
Meteosat 5 (M-5) for the years 2000, 2002 <strong>and</strong> 2003 (for Bangladesh, West-China, Nepal<br />
<strong>and</strong> Sri Lanka) are used. M-5 has its position at 0° latitude <strong>and</strong> 63° East longitude, M-7 is<br />
located at an orbit at 0° latitude <strong>and</strong> 0° longitude. Figure 1 gives the field of view of both<br />
satellites which scans the specific area every 30 minutes with a spatial resolution of 5x5 km².<br />
Figure 1: The solar irradiance data is derived from Meteosat a 0° (red circle) <strong>and</strong> at 63° East<br />
(orange circle). The brightened area marks the quantitatively analyzable region. (Meyer et al.,<br />
2004).<br />
Data of the visible (VIS) channel, which gives the reflection of the system earth/atmosphere<br />
(including clouds) <strong>and</strong> data of the infrared (IR) channel, which represents the temperature of<br />
the surface <strong>and</strong> atmosphere, are used for gathering information about the clouds. Both are<br />
used in a different way to assess the global horizontal (GHI) <strong>and</strong> the direct normal radiation<br />
(DNI) at ground. Additionally, data of the most important atmospheric components that<br />
attenuate the radiation, namely ozone, water vapor <strong>and</strong> aerosols, are used to take into<br />
account the clear-sky conditions of the atmosphere. In the following, the method for deriving<br />
DNI based on the DLR method <strong>and</strong> the method for deriving GHI, based on a combined<br />
method of DLR <strong>and</strong> SUNY, is described.<br />
Method for Direct Normal Radiation (DNI)<br />
The calculation of DNI bases on the clear-sky model of Bird <strong>and</strong> Hulstrom (1981) as<br />
described in Iqbal (1983) which was modified by Schillings et al. (2004) for taking into<br />
account cloudy conditions with<br />
DNI = 0 .9751⋅<br />
I 0 ⋅τ<br />
R ⋅τ<br />
Gas ⋅τ<br />
Ozon ⋅τWV<br />
⋅τ<br />
Ae ⋅τ<br />
vis ⋅τ<br />
ir<br />
(1)<br />
Each atmospheric transmittance coefficient τ i is calculated separately using atmospheric<br />
input data. All equations for calculating the clear-sky transmittances are described in Iqbal<br />
(1983).
2 High resolution solar radiation assessment for Ghana, by<br />
Transmittance for Rayleigh scattering<br />
0.84<br />
[ − 0.0903m<br />
( 1.0<br />
)]<br />
1.01<br />
a + amp<br />
− amp<br />
τ = exp<br />
(2)<br />
R<br />
Transmittance for equally distributed gas (mainly O 2 <strong>and</strong> CO 2 )<br />
0.26<br />
( − 0.0127am<br />
)<br />
τ = exp<br />
(3)<br />
Gas<br />
Transmittance for ozone<br />
τ<br />
Ozon α Ozon<br />
p<br />
=1 −<br />
(4)<br />
−0.3035<br />
2 −<br />
( 1.0 + 139.48χ<br />
) − 0.002715χ<br />
( 1.0 + 0.044χ<br />
+ 0.0003 ) 1<br />
α Ozone = 0.1611χ<br />
χ (5)<br />
χ = u ⋅ am , with the vertical ozone layer thickness u in cm[NTP] <strong>and</strong> the airmass am.<br />
Transmittance for water vapor<br />
τ<br />
=1 −<br />
(6)<br />
WV α WV<br />
[( )<br />
] 0.6828<br />
−<br />
1.0 + 79.034γ<br />
+ 6.385<br />
1<br />
α WV = 2.4959γ<br />
γ<br />
(7)<br />
γ = w⋅ am , with the pressure-corrected relative optical path length of precipitable<br />
water w in cm[NTP].<br />
Transmittance for aerosols<br />
0.873<br />
0.7088 0.9108<br />
[ − ka<br />
( 1.0 + ka<br />
− ka<br />
) am p ]<br />
τ = exp<br />
(8)<br />
Ae<br />
ka<br />
= 0.2758kaλ + 0.35k<br />
λ µ m<br />
aλ<br />
(9)<br />
| = 0.38<br />
| λ = 0. 5µ<br />
m<br />
with the aerosol optical thickness k aλ at the wavelength 0.38 µm und 0.5 µm.<br />
Transmittance for clouds<br />
using the visible Cloud-Index CI_vis<br />
( −CI<br />
vis ⋅0.1<br />
τ = e<br />
)<br />
(10)<br />
vis<br />
<strong>and</strong> using the infrared Cloud-Index CI_ir<br />
( −CI<br />
ir ⋅0.07<br />
τ = e<br />
)<br />
(11)<br />
ir<br />
For the clear-sky atmospheric transmittance, the airmass is needed which is calculated by<br />
1<br />
am =<br />
(12)<br />
−<br />
[ cosΘ<br />
+ 0.15(93.885 − Θ )] 1.253<br />
The pressure correction is made by<br />
Z<br />
Z<br />
with<br />
p<br />
am p = am ⋅<br />
(13)<br />
1013.25<br />
p<br />
p<br />
0<br />
( − 0.0001184z)<br />
= exp<br />
(14)
High resolution solar radiation assessment for Ghana, by 3<br />
The clear-sky radiation is calculated each 20 minutes (10,30,50 minutes of each hour) for the<br />
maps <strong>and</strong> each 5 minutes (5,10,15,…,55,60 minutes each hour) for the time series. The<br />
influence of the clouds is taken into account hourly, therefore all maps (monthly <strong>and</strong> annual<br />
average daily sums) <strong>and</strong> time series are based on an hourly calculation of the radiation. The<br />
DLR -model output for DNI is sampled at a 10km spatial resolution.<br />
Method for Global Horizontal Radiation (GHI)<br />
The calculation of GHI bases on the method of Perez et al (2002) <strong>and</strong> Ineichen <strong>and</strong> Perez<br />
(2002). GHI is calculated with (Perez et al., 2002)<br />
with ktm<br />
GHI = ktm ⋅ Ghc ⋅ ( 0.0001⋅<br />
ktm ⋅ Ghc + 0.9)<br />
(15)<br />
5<br />
4<br />
3<br />
ktm = 2.36 ⋅ CI − 6.2 ⋅ CI + 6.22 ⋅ CI − 2.63 ⋅ CI − 0.58 ⋅ CI + 1<br />
(16)<br />
GHI is calculated using the cloud information based on infrared (IR) <strong>and</strong> visible (VIS)<br />
Meteosat data which lead to a single Cloud-Index CI with<br />
CI = max( CI _ vis,<br />
CI _ ir)<br />
(17)<br />
For the determination of the clear-sky global irradiance G hc the new formulation as described<br />
in Perez et al (2002) is used with<br />
Ghc = cg1⋅<br />
I0 ⋅ cos ΘZ ⋅ exp( −cg2<br />
⋅ am ⋅ ( fh1<br />
+ fh2<br />
⋅ ( TL −1))) exp(0.01⋅<br />
am ) (18)<br />
2<br />
1.8<br />
with<br />
cg1 = (0.0000509 * alt + 0.868)<br />
cg2 = (0.0000392 * alt + 0.0387)<br />
I 0 = <strong>Solar</strong> constant (eccentricity corrected)<br />
Θ z = solar zenith angle<br />
fh1 = exp(-alt / 8000)<br />
fh2 = exp(-alt / 1250)<br />
am = elevation corrected air mass<br />
alt = altitude in meters<br />
= Linke turbidity<br />
T L<br />
Due to missing values of the Linke turbidity T L for the parameterization of the clear-sky<br />
atmosphere, data of the atmospheric components ozone, water vapor <strong>and</strong> aerosols are<br />
used. These atmospheric data are also used for the DNI. To derive T L from atmospheric data<br />
we use the following formulation as described by Ineichen <strong>and</strong> Perez (2002) with<br />
I 0<br />
Tl = ((11.1⋅<br />
ln( b ⋅ )) / am)<br />
+ 1<br />
B<br />
ncl<br />
(19)<br />
with b = 0.664<br />
+ (0.163 / fh1)<br />
(20)<br />
<strong>and</strong> the clear-sky direct normal irradiance B ncl<br />
0 ⋅τ<br />
ra ⋅τ<br />
ae ⋅τ<br />
o3 ⋅τ<br />
ga ⋅τ<br />
wv<br />
B ncl = I<br />
(21)
4 High resolution solar radiation assessment for Ghana, by<br />
The calculation of transmittance coefficients τ i <strong>and</strong> the used atmospheric input data are<br />
described in the method for the DNI.<br />
The clear-sky radiation is calculated each 20 minutes (10,30,50 minutes of each hour) for the<br />
maps <strong>and</strong> each 5 minutes (5,10,15,…,55,60 minutes each hour) for the time series. The<br />
influence of the clouds is taken into account hourly, therefore all maps (monthly <strong>and</strong> annual<br />
average daily sums) <strong>and</strong> time series are based on an hourly calculation of the radiation. The<br />
DLR/SUNY-model output for GHI is sampled at a 10km spatial resolution.<br />
Input Data<br />
Elevation<br />
For the airmass pressure correction, the elevation from the GLOBE database from the USGS<br />
U.S. Geological Survey [http://rockyweb.cr.usgs.gov/elevation/dpi_dem.html] is used,<br />
(Hastings <strong>and</strong> Dunbar, 1998).<br />
Figure 2: Elevation from GLOBE.<br />
Ozone<br />
The monthly ozone data are taken from TOMS published by the NASA/GSFC TOMS Ozone<br />
Processing Team [http://toms.gsfc.nasa.gov/], (McPeters et al., 1998).<br />
Figure 3: Ozon monthly average for February 2003 in [DU] from TOMS<br />
Water vapor<br />
The daily water vapor data are taken from the NOAA-CIRES Climate Diagnostics Center in<br />
Boulder Colorado, USA (NCEP/NCAR) [http://www.cdc.noaa.gov/] (Kalnay et al., 1996).
High resolution solar radiation assessment for Ghana, by 5<br />
Figure 4: Water vapor daily mean for 7. February 2003 in cm[NTP] from NCEP/ NCAR-<br />
Reanalysis<br />
Aerosol<br />
The monthly climatological aerosol optical thickness data are taken from NASA-GACP,<br />
[http://gacp.giss.nasa.gov/index.html], (Mishchenko et al, 2002).<br />
Figure 5: Aerosol optical thickness for February from NASA-GACP.<br />
Clouds<br />
The hourly cloud information are based on half-hourly Meteosat-5 IR <strong>and</strong> VIS data (©<br />
EUMETSAT, 2004). The determination of the cloud indices is described in detail in<br />
Mannstein et al. (1999) <strong>and</strong> Schillings et al. (2004). The basic approach for deriving VIS<br />
cloud information is described with<br />
ρ − ρ min<br />
CI _ vis =<br />
(22)<br />
ρ − ρ<br />
max<br />
min<br />
where ρ is the actual reflectivity measured by the satellite, ρ min corresponds to the surface<br />
albedo <strong>and</strong> ρ max is the maximum reflectivity measured for overcast cloudy conditions. The<br />
similar approach is used for IR-data, with the actual, minimum <strong>and</strong> maximum brightness<br />
temperatures T measured by the satellite:<br />
Tmin<br />
− T<br />
CI _ ir = (23)<br />
T − T<br />
min<br />
max
6 High resolution solar radiation assessment for Ghana, by<br />
Figure 6: Field of view of Meteosat (M-7, IR-channel) © 2004, EUMETSAT.
High resolution solar radiation assessment for Ghana, by 7<br />
2 Model output<br />
The solar radiation is calculated for the complete country for the years 2000, 2001 <strong>and</strong> 2002.<br />
The data are made available in a digital GIS-format (ESRI Vector-Shapefile). Within this<br />
report, maps of the annual average daily total sum of GHI <strong>and</strong> DNI are presented. The<br />
complete database (ESRI-Shapefile <strong>and</strong> MS-Access database) can be downloaded from the<br />
<strong>SWERA</strong>-homepage (http://swera.unep.net). Within the ESRI Vector-Shapefile, 3 annual <strong>and</strong><br />
36 monthly average daily total sums of GHI <strong>and</strong> DNI are given for each 10km x 10km<br />
georeferenced pixel as shown in the following figures. Additional, hourly time series for the<br />
same time period for several interesting sites are delivered in a separate ASCII-File. The<br />
output time of the hourly data is UTC.<br />
Time series<br />
For following sites hourly time series of GHI <strong>and</strong> DNI for three years are calculated:<br />
Stations/Sites Lat(degree) Long(degree) Elevation (m)<br />
Abetifi 6.67 -0.75 595<br />
Accra 5.60 -0.17 68<br />
Adafoah 5.78 0.63 5<br />
Akatsi 6.12 0.80 46<br />
Akim Oda 5.93 -0.98 139<br />
Akuse 6.10 0.12 17<br />
Axim 4.90 -2.25 10<br />
Bole 9.33 -2.48 240<br />
Ho 6.60 0.47 157<br />
Kete Krachi 7.82 -0.33 122<br />
Koforidua 6.83 -0.25 166<br />
Kumasi 6.72 -1.60 286<br />
Navrongo 10.90 -1.10 201<br />
Saltpond 5.20 -1.67 44<br />
Sefwi_Bekwai 6.20 -2.33 171<br />
Sunyani 7.33 -2.33 309<br />
Takoradi 0.88 -1.77 5<br />
Tamale 9.42 -0.85 183<br />
Tema 5.62 0.0 14<br />
Wa 10.05 -2.50 323<br />
Wenchi 7.75 -2.10 339<br />
Yendi 9.45 -0.17 195<br />
The hourly time series can be downloaded from the <strong>SWERA</strong> web-site. The name convention<br />
of the file name is: Country_Sitename_Lat_Lon_Z_Year.<br />
for example Ghana_Abetifi_N6.667_W0.75_Z595
8 High resolution solar radiation assessment for Ghana, by<br />
Important notice: The following maps show classified values of kWh/m²/day with a<br />
common color ramp for all <strong>SWERA</strong> countries to give a first impression of the solar<br />
regime for each country <strong>and</strong> for easier comparison with other countries. The provided<br />
digital GIS data (available at http://swera.unep.net) give the real (<strong>and</strong> not classified!)<br />
values in Wh/m²/day for each georeferenced pixel with a signal resolution of<br />
1 Wh/m²/day.
High resolution solar radiation assessment for Ghana, by 9<br />
Global Horizontal Radiation<br />
Figure 7: Annual average daily total sum of GHI kWh/m²/day for Ghana 2000
10 High resolution solar radiation assessment for Ghana, by<br />
Figure 8: Annual average daily total sum of GHI in kWh/m²/day for Ghana 2001
High resolution solar radiation assessment for Ghana, by 11<br />
Figure 9: Annual average daily total sum of GHI in kWh/m²/day for Ghana 2002
12 High resolution solar radiation assessment for Ghana, by<br />
Direct Normal Radiation<br />
Figure 10: Annual average daily total sum of DNI in kWh/m²/day for Ghana 2000
High resolution solar radiation assessment for Ghana, by 13<br />
Figure 11: Annual average daily total sum of DNI in kWh/m²/day for Ghana 2001
14 High resolution solar radiation assessment for Ghana, by<br />
Figure 12: Annual average daily total sum of DNI in kWh/m²/day for Ghana 2002
High resolution solar radiation assessment for Ghana, by 15<br />
3 Comparison with ground measurement in Ghana<br />
Ground data: Ground measurements of the global horizontal irradiance are available for the<br />
several sites in Ghana (see figure 13). The GHI is derived from sunshine duration<br />
measurements (MSD). For the site Kumasi, GHI values are also measured by a pyranometer<br />
(KNUST) with a higher accuracy than the sunshine duration measurements. All ground data<br />
are taken from the "<strong>Solar</strong> Data Analysis Report" for Ghana (KNUST, 2003) provided within<br />
the <strong>SWERA</strong>-project.<br />
Figure 13: measurements sites in Ghana.
16 High resolution solar radiation assessment for Ghana, by<br />
Satellite data: The complete years 2000-2002 are calculated <strong>and</strong> there are no data missing.<br />
Comparison results: For this comparison, monthly average daily sums are compared for 19<br />
sites. Kumasi is the only site with both, MSD <strong>and</strong> KNUST, measurements. The overall<br />
relative Root Mean Deviation (rMBD) is –11.6%, the relative Root Mean Square Deviation<br />
(rRMSD) is 16.3. For the more accurate GHI measurements of Kumasi using the KNUST<br />
pyranometer values, a rMBD of -0.4% <strong>and</strong> a rRMSD of 13.6% is performed as shown in<br />
table 1.<br />
Station rMBD (%) rRMSD (%) N (months)<br />
Accra -4.1 11.1 36<br />
Abetifi -18.5 20.7 36<br />
Adafoah -6.2 9.6 36<br />
Akatsi -7.3 10.7 24<br />
Akuse -5.1 10.3 36<br />
Akim Oda -4.2 9.4 36<br />
Axim -3.5 11.3 36<br />
Bole -16.4 19.9 36<br />
Ho -11.0 14.2 36<br />
Koforidua -5.5 12.0 36<br />
Krachi -12.6 15.7 36<br />
Kumasi (MSD) -10.7 14.0 36<br />
Kumasi (KNUST) -0.4 13.6 36<br />
Navrongo -19.0 20.9 36<br />
Saltpond -16.9 18.4 36<br />
Takoradi -2.4 11.0 36<br />
Tamale -16.1 18.8 36<br />
Wa -21.2 23.2 36<br />
Wenchi -15.5 18.4 36<br />
Yendi -18.5 19.9 36<br />
All -11.6 16.3 672<br />
Table 1: Relative MBD <strong>and</strong> RMSD for monthly average daily sum of GHI. N gives the number<br />
of used months.<br />
The next figures show the monthly average daily sum of GHI (ground <strong>and</strong> satellite), averaged<br />
over the complete analyzed period of the three years (2000-2002) for all sites. For Kumasi,<br />
both MSD- <strong>and</strong> KNUST- values are shown.
High resolution solar radiation assessment for Ghana, by 17
18 High resolution solar radiation assessment for Ghana, by
High resolution solar radiation assessment for Ghana, by 19<br />
Acknowledgement:<br />
All Meteosat data is under copyright of EUMETSAT (© 2004), Darmstadt, Germany. Many<br />
thanks for access to the data set go to the crew of the MARF (Meteosat Archive <strong>and</strong><br />
Retrieval Facility, Darmstadt) <strong>and</strong> to our colleagues from DLR-DFD (Deutsches<br />
Fernerkundungs-Datenzentrum). Data on aerosol is provided by NASA-GACP Global<br />
Aerosol Climatology Project. We also acknowledge the use of the water vapor data from the<br />
NCEP Reanalysis by NOAA-CIRES Climate Diagnostics Center, Boulder, Colorado, US <strong>and</strong><br />
the use of the TOMS ozone data provided by the NASA-Goddard Space Flight Center<br />
(GSFC), Washington, DC, USA. Special thanks to Rüdiger Buell <strong>and</strong> Hermann Mannstein at<br />
the Institut für Physik der Atmosphäre for doing the archive logistics <strong>and</strong> cloud data<br />
processing of the Meteosat 5 <strong>and</strong> Meteosat 7 data.<br />
4 References<br />
Bird R.E. <strong>and</strong> R.L. Hulstrom (1981): Review, evaluation <strong>and</strong> improvement of direct irradiance<br />
models. J. of Sol. <strong>Energy</strong> Engineering 103, 182-192.<br />
Hastings D.A. <strong>and</strong> P.K. Dunbar (1998): Development & <strong>Assessment</strong> of the Global L<strong>and</strong> Onekm<br />
Base Elevation Digital Elevation Model (GLOBE). International Society of<br />
Photogrammetry <strong>and</strong> Remote Sensing (ISPRS) Archives 32 (4), 218-221.<br />
(http://www.ngdc.noaa.gov/seg/topo/globe.shtml)<br />
Ineichen P. <strong>and</strong> R. Perez (2002): A new airmass independent formulation for the Linke<br />
turbidity coefficient. <strong>Solar</strong> <strong>Energy</strong>, 73 (3), 151-157.<br />
Iqbal M. (1983): An introduction to solar radiation. Academic Press, Toronto.<br />
Kalnay E., M. Kanamitsu, R. Kistler, W. Collins, D. Deaven, L. G<strong>and</strong>in, M. Iredell, S. Saha, G.<br />
White, J. Woollen, Y. Zhu, A. Leetmaa, R. Reynolds, M. Chelliah, W. Ebisuzaki, W.<br />
Higgins, J. Janowiak, K.C. Mo, C. Ropelewski, J. Wang, R. Jenne <strong>and</strong> D. Joseph (1996):<br />
The NMC/NCAR 40-Year Reanalysis Project. Bulletin of the American Meteorological<br />
Society 77 (3), 437–472.<br />
KNUST, Kwame Nkrumah University of science <strong>and</strong> technology (2003): <strong>Solar</strong> data analysis<br />
report for Ghana, Kumasi, Ghana (available on the <strong>SWERA</strong> website:<br />
http://swera.unep.net)<br />
Mannstein H., H. Broesamle, C. Schillings <strong>and</strong> F. Trieb (1999): Using a METEOSAT cloud<br />
index to model the performance of solar-thermal power stations. Procs. of Eumetsat<br />
Conference Copenhagen, 239-246.<br />
McPeters R.D. , P. K. Bhartia, A. J. Krueger, J. R. Herman, C. G. Wellemeyer, C. J. Seftor,<br />
G. Jaross, O. Torres, L. Moy, G. Labow, W. Byerly, S. L. Taylor, T. Swissler <strong>and</strong> R. P.<br />
Cebula (1998): Earth Probe Total Ozone Mapping Spectrometer (TOMS) Data Products<br />
User's Guide. NASA Technical Publication 1998-206895.<br />
Meyer R., C. Hoyer, E. Diedrich, C. Schillings, S. Lohmann, M. Schroedter-Homscheidt, R.<br />
Buell <strong>and</strong> F.Trieb (2004): <strong>Solar</strong> <strong>Energy</strong> Mining: A High-Quality Satellite-based Service to<br />
Provide Direct <strong>Solar</strong> Radiation for Europe, Brazil, Africa <strong>and</strong> Asia. Presentation at<br />
<strong>Solar</strong>Paces 2004, Oaxaca, Mexico.
20 High resolution solar radiation assessment for Ghana, by<br />
Mishchenko M., J.E. Penner <strong>and</strong> D. Anderson (Ed.) (2002): Global Aerosol Climatology<br />
Project. Special Issue of Global Aerosol Climate, J. of Atmospheric Science 59 (3).<br />
Perez R., P. Ineichen, K. Moore, M. Kmiecik, C. Chain, R. George <strong>and</strong> F. Vignola (2002): A<br />
new operational satellite-to-irradiance model - description <strong>and</strong> validation. <strong>Solar</strong> <strong>Energy</strong>, 73<br />
(5), 307-317.<br />
Schillings C., H. Mannstein <strong>and</strong> R. Meyer (2004): Operational method for deriving high<br />
resolution direct normal irradiance from satellite data. <strong>Solar</strong> <strong>Energy</strong> 76, 475-484.